Department for Transport annual report and accounts 2021 to 2022
Published 20 July 2022

© Crown copyright 2022
This publication is licensed under the terms of the Open Government Licence v3.0 except where otherwise stated. To view this licence, visit nationalarchives.gov.uk/doc/open-government-licence/version/3 or write to the Information Policy Team, The National Archives, Kew, London TW9 4DU, or email: psi@nationalarchives.gov.uk.
Where we have identified any third party copyright information you will need to obtain permission from the copyright holders concerned.
This publication is available at https://www.gov.uk/government/publications/dft-annual-report-and-accounts-2021-to-2022/department-for-transport-annual-report-and-accounts-2021-to-2022
Secretary of State foreword
The 3 years in which I’ve served as Transport Secretary have been among the most challenging in the department’s history. As we continued to deliver a packed policy agenda through a period of tremendous uncertainty, we had to protect the resilience of the transport network through pressures imposed by the Ukraine crises and coronavirus (COVID-19). That work carried on uninterrupted through 2021 to 2022. Policy teams and agencies across the department worked exceptionally hard to deliver an ambitious programme to modernise transport.
After leaving the EU, the department also ensured that there was effective delivery of the UK and EU trade and cooperation agreement which provides the legal basis for air, road freight and road passenger transport operations between the UK and EU.
Rail reform was one of the year’s top priorities. Following the publication of the Williams-Shapps plan, I announced our full reform programme in June 2021. This included creating a new body, Great British Railways (GBR), to bring infrastructure, fares, timetables and network planning under one roof. In contrast with the fractured industry of the past, GBR will manage trains and tracks, and focus overwhelmingly on punctuality and passengers.
And alongside these structural changes, we will continue to invest record sums upgrading the network. We have just opened the Elizabeth Line, and we’re making fast progress building High Speed Rail Two (HS2). We’re reversing the Beeching rail cuts to reconnect left-behind communities, and we’re rolling out the £96 billion Integrated rail plan for the North and Midlands. After decades of underinvestment in the rail network, we are fortunate to be working for the department at a time of historic renewal and growth.
We were one of the first countries to ban Russian planes and close our ports to Russian owned, registered, or operated ships following the shocking invasion of Ukraine. We are working with industry to monitor the impacts of the war on the supply of critical goods. And as I write, we are dealing with the national rail strike action.
Thanks to the success of the vaccination programme, we were at last able to restart international travel this year and get back to supporting key events that promote Britain and our interests globally. For example, we had a major presence at the delayed Expo 2020 in Dubai, and the department made a significant contribution to the United Nations Climate Change Conference (COP26) in Glasgow, bringing together global transport leaders to take part in transport day. During London international shipping week, we held a global maritime forum for senior industry figures. All these events were a great success, and highlighted UK leadership on the international transport stage.
Following the publication of our Transport decarbonisation plan last year, we now have a clear strategy to reduce and replace fossil fuels across transport and so play our part in reaching net zero. For example, we recently unveiled our Electric Vehicle Infrastructure Strategy, which will help transform road transport in this country within a generation. This work is already having a big impact on the market as buyers increasingly see electric cars as viable.
Battery electric car sales rose by three-quarters in 2021 and make up 15% of all new registrations so far this year. We continue to make vital progress on green aviation through our Jet Zero strategy. And our refreshed National Shipbuilding Strategy launched a new UK shipping office for reducing emissions, with £206 million investment for Maritime R&D.
One of the biggest impacts of the pandemic globally has been the disruption to supply chains, and this has particularly affected teams across the Department for Transport (DfT). The heavy goods vehicle (HGV) driver shortage, for example, hampered distribution of food, manufacturing components and fuel. Truck drivers perform a critical role in our finely tuned supply chains, and the shortage threatened our economic recovery at the worst possible time.
So, the department and our motoring agencies worked extremely hard with industry and colleagues across government and the department is putting in place 33 different measures to tackle the shortage, which include:
- urgently increasing HGV driver testing
- speeding up licence processing
- investing over £50 million in lorry parking and driver welfare facilities
These actions have been critical to help major supply chains moving and in December 2021, industry reported that they were starting to see signs of recovery.
Other recent events also tested the department’s capabilities. We acted rapidly to close legal loopholes which allowed ferry operator P&O to undercut British workers and stepped-up enforcement of existing laws to penalise companies which fire and rehire. Our work with international partners to create minimum wage corridors will give maritime workers the rights they deserve.
Despite all these challenges, and I am sure that there will be more in 2022 to 2023, I have no doubt that the DfT will meet them head on. I am proud to lead one of the most capable and resourceful departments in government today, and I’d like to thank all staff for their hard work and commitment over the past year.
Permanent Secretary foreword
April 2022 marked my 5-year anniversary as Permanent Secretary at DfT. Each successive year has brought new and bigger challenges.
COVID-19 continued to stretch and challenge the department and its public bodies like never before. I am immensely proud of the way they have worked with the wider transport sector to keep the country moving over the past 2 years. It has been a truly herculean effort. While the transport sector continues to recover, the effects of the pandemic on transport have been very significant and continuing challenges and uncertainty have impacted both on the department’s finances, and on the sector more widely
In parallel we have continued to deliver an ambitious programme of work to make journeys greener, improve transport for those who use the network and contribute to levelling up as we build new and renew infrastructure. We have:
- published the Transport Decarbonisation Plan
- published the Integrated Rail Plan and the Union Connectivity Review
- progressed ambitious plans to restructure the railway
- hosted London International Shipping Week
- continued to make progress in the delivery of our extensive portfolio of major projects including HS2 and Crossrail which opened for business as the Elizabeth Line on 24 May 2022
We also successfully published our second Statutory cycling and walking investment strategy (CWIS2) and continued to take steps to improve the accessibility of transport – for example we have established Mobility Centres to provide advice on travel alternatives to those unable to drive due to disability or impairment. I am pleased that DfT has also played an active role in addressing issues such as on tackling loneliness and violence against women and girls on the transport system and made vital contributions to the Levelling Up White Paper and the COP26 conference in Glasgow.
Within the department we continue to drive improvements in our organisation and capability. In January 2022, it was my pleasure to welcome Gareth Davies, as the new Second Permanent Secretary at DfT. His appointment is great news for the department and reflects our ambitious delivery agenda.
After a year of changing COVID-19 restrictions, we have implemented new HR policies to support the department’s return to offices and hybrid working. We have rapidly grown our offices in Leeds and Birmingham, moved into new offices in Hastings, been listed as a Times Top 50 Employer for Women and made it into the top 30 employers on the Social Mobility Index.
Looking ahead many challenges remain. Ensuring we have a safe and reliable network, managing the impact of inflation on our programmes, and continuing to manage the environmental impacts of transport are just some of these. Just as we have risen to the challenges of the past years, we will need to continue to adapt, innovate and improve how we work.
The department will continue to work hand-in-hand with our arms-length bodies, industry partners and other key stakeholders to ensure transport continues to deliver for the public and taxpayers. I am extremely grateful for the dedication and expertise shown by colleagues across the department and its public bodies over the past year and look forward to continuing to make progress in 2022 to 2023.
Performance report
This performance report notes the department’s main successes and challenges against the workstreams it worked on within our outcome delivery plan. Whilst delivering the department’s priority outcomes, it also had to respond to several challenges across the transport system, which are included in this report.
Overview: How we have performed
The purpose for this report
This performance report is based on the priority outcomes set out in section A of the department’s outcome delivery plan: 2021 to 2022. These priority outcomes were developed using the principle of the public value framework, published by HM Treasury in 2019, which is a tool for maximising the value delivered from public spending and improving outcomes for citizens.
The priority outcomes were confirmed as part of the department’s spending review settlement (SR20), and they remain in place as part of the SR21 settlement. The performance report also includes the effects of COVID-19 on policy, delivery, and the subsequent programme for recovery.
How we are organised
DfT comprises the central department (DfTc) and several public bodies. These are classified according to the level of ministerial control required for them to best perform their functions. Many of these organisations have their own governance structures and publish annual reports, with their accounts consolidated into the department’s annual report and accounts.
Executive agencies act as an arm of DfTc and typically carry out services or functions with a focus on delivering specific outputs, with policy set by ministers. Non-departmental public bodies (NDPBs) and non-ministerial departments (NMDs) are separate legal entities from DfTc. The department usually sets their strategic framework, appoints the chair of their boards, approves all non-executive board member appointments, and appoints their accounting officer.
The wider departmental family includes other public bodies helping to achieve our objectives but have more autonomy over their own policies and are not consolidated into the group’s financial statements.
Looking ahead: Our strategy
COVID-19 and the rise in cost of living has, and will continue to have, a profound impact on the transport sector. The last year has required significant government intervention, including financial support for rail and bus operators and Transport for London (TfL) to maintain service levels, and in the management of port and border congestion.
The department must now consider what the future looks like given the impact of the pandemic on travel habits. In some areas, both transport modes and geographic areas, there has been strong demand for return to public transport, in others the demand has been below pre-pandemic levels, although it is not certain that travel patterns have stabilised. The department is continuing to work closely with transport operators, local government and our arm’s length bodies (ALBs) to deliver a sustainable transport sector and where possible to support the public with the rising cost-of-living.
At this crucial time, our 5 priority outcomes are guiding the work of the department to ensure we are delivering on the government’s agenda.
Our priority outcomes
The priority outcomes are interlinked and mutually support each other: delivery of one will often contribute to the delivery of the others, as in many cases workstreams offer benefits across more than one priority.
The reporting framework lends itself to a matrix style of reporting across the priority outcomes. This entails the department reporting against both its business groups and travel modes that impact on the delivery of the priority outcome.
The department’s priority outcomes are:
- grow and level-up the economy
- improve transport for the user
- reduce environmental impacts
- increase our global impact
- be an excellent department
Priority outcome indicators
As part of the outcome delivery plan (ODP) framework, the department has identified a suite of metrics that will be used to monitor progress towards the priority outcomes. The metrics set out, against the priority outcomes, show the latest published position for each of the indicators.
Whilst a range of data is available to monitor progress, both within the department and across the transport sector, these metrics are typically drawn from official and National Statistics sources. This is to ensure outcomes are measured using data of the highest quality, even if more timely sources exist.
These metrics are:
- non-exhaustive
- to be considered as part of a suite of wider evidence
- designed to measure progress towards overall outcomes rather than individual DfTc programmes
- subject to reporting lags
- not necessarily published to a consistent schedule
Our governance
The department’s governance arrangements reflect best practice and the importance of giving parliament confidence that we use our resources cost-effectively when delivering our priority outcomes. See the full governance statement in the accountability report section.
Our risks
Risk management is an integral part of the department’s work, from how we manage our programmes and our money, to how we develop our policies and work with the departmental family. These risks represent the department’s view of its overall risk profile, taking into account the risk carried and managed by our public bodies.
The governance statement contains a full report on our internal controls and risk management approach and sets out the principal risks faced by the department. The report includes the actions the department took or are taking to mitigate these risks.
Figure 1: wider departmental family
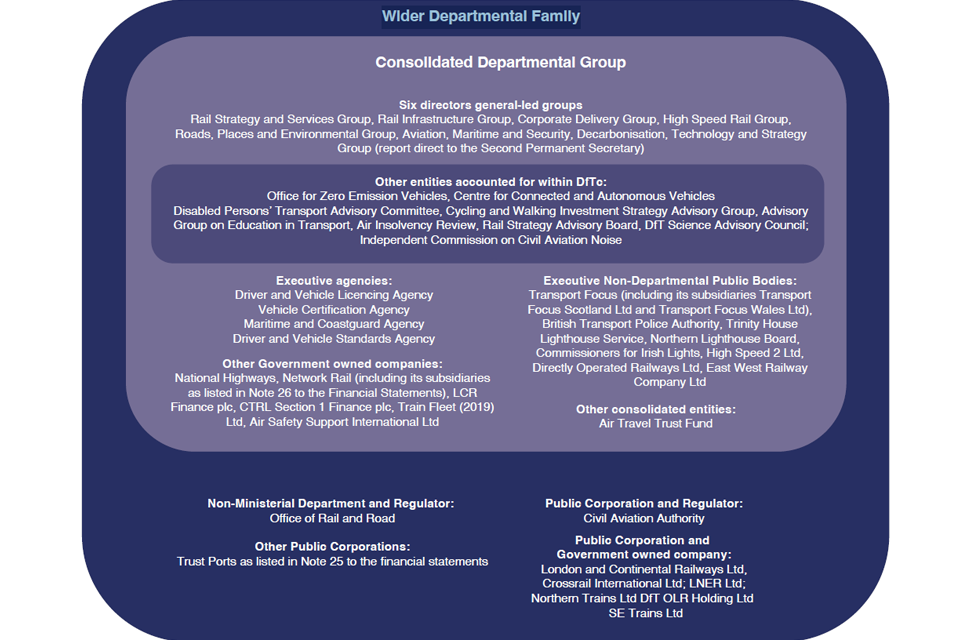
Consolidated departmental group
6 directors general-led groups:
- rail strategy and services group
- rail infrastructure group
- corporate delivery group
- high speed rail group
- roads, places and environmental group
- aviation, maritime and security, decarbonisation, technology and security group (report direct to the Second Permanent Secretary)
Other entities accounted for within DfTc:
- Office for Zero Emission Vehicles (OZEV)
- Centre for Connected and Autonomous Vehicles
- Disabled Persons’ Transport Advisory Committee
- Cycling and Walking Investment Strategy Advisory Group
- Advisory Group on Education in Transport
- Air Solvency Review
- Rail Strategy Advisory Board
- DfT Science Advisory Council
- Independent Commission on Civil Aviation Noise
Executive agencies:
- Driver and Vehicle Licencing Agency (DVLA)
- Vehicle Certification Agency
- Maritime and Coastguard Agency
- Driver and Vehicle Standards Agency (DVSA)
Executive non-departmental public bodies:
- Transport Focus (including its subsidiaries Transport Focus Scotland Ltd and Transport Focus Wales Ltd)
- British Transport Police Authority
- Trinity House Lighthouse Service
- Northern Lighthouse Board
- Comissioners for Irish Lights
- HS2 Ltd
- Directly Operated Railways Ltd
- East West Railway Company Ltd
Other consolidated entities:
- Air Travel Trust Fund
Wider departmental family
Non-ministerial department and regulator: Office of Rail and Road (ORR)
Public corporation and regulator: Civil Aviation Authority (CAA)
Public corporation and government owned company:
- London and Continental Railways Ltd
- Crosswail International Ltd
- LNER Ltd
- Northern Trains Ltd
- DfT OLR Holding Ltd
- SE Trains Ltd
Figure 2: our governance
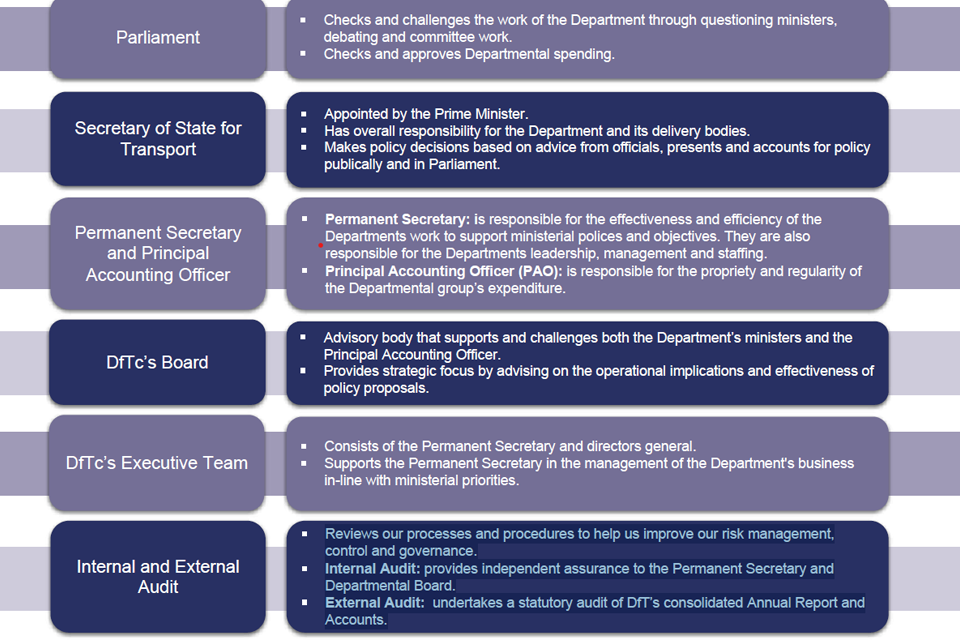
Parliament:
- checks and challenges the work of the department through questioning ministers, debating and committee work
- checks and approves departmental spending
The Secretary of State for Transport:
- is appointed by the Prime Minister
- has overall responsibility for the department and its delivery bodies
- makes policy decisions based on advice from officials, presents and accounts for policy publically and in Parliament
Permanent Secretary and Principal Accounting Officer:
- the Permanent Secretary is responsible for the effectiveness and efficiency of the departments work to support ministerial polices and objectives. They are also responsible for the departments leadership, management and staffing
- the Principal Accounting Officer (PAO) is responsible for the propriety and regularity of the departmental group’s expenditure
DfTc’s board:
- is the advisory body that supports and challenges both the department’s ministers and the PAO
- provides strategic focus by advising on the operational implications and effectiveness of policy proposals
DfTc’s executive team:
- consists of the Permanent Secretary and directors general
- supports the Permanent Secretary in the management of the department’s business in-line with ministerial priorities
Internal and external audit:
- reviews our processes and procedures to help us improve our risk management, control and governance
- Internal Audit provides independent assurance to the Permanent Secretary and departmental Board
- External Audit: undertakes a statutory audit of DfT’s consolidated Annual Report and Accounts
Our performance at-a-glance
Grow and level up the economy

This year we have:
-
restored the railway flyover at Bletchley with minimal disruption. The new flyover is built to last 120 years
-
announced the largest ever government programme of investment in the railway – a £96 billion package to overhaul and moderinse rail connections across the North and Midlands
-
awarded a £2 billion contract (under budget) for the delivery and maintenance of HS2 trains for phases 1 and 2a
-
upgraded Testo’s junction which brings great benefits to the North East, providing swifter, more reliable free-flowing journeys and supporting economic growth in the region. It also enables better journeys and connections to international gateways and the rest of the country
-
renewed traffic signals on the roundabout and its approaching roads and adding new traffic signals for the Tabley Hill Lane / Pickmere Lane junction
-
set out in the IRP, NPR services that will be delivered by the end of the decade, meaning people and businesses of the North will begin to benefit from NPR upgrades much sooner than previous proposals
-
opened the Elizabeth Line central section (Paddington to Abbey Wood) which the Queen attended to open on 17 May and opened to the public on 24 May 2022
-
completed the Thorpe Road, Norwich bus and cycle priority scheme, savings between 1 and 3 minutes, representing journey time savings of about 15% overall
-
completed a £130 million junction improvement in the North East that was fully open to traffic. Delivered after more than a million hours of work – around 60% of that time coming from a local workforce
-
built a 2-way link across the junction to allow better connection between the M6 and A556, including a new bridge spanning the M6 motorway within the roundabout
Improve transport for the user

Image showing
This year we have:
-
committed to funding the introduction of 2,500 new zero emission buses through the Zero Emissions Bus Regional Areas (ZEBRA) scheme
-
made important announcements, including £1.5 million for mobility centres, to provide advice on travel alternatives to those unable to drive due to disability and £1 million to enhance access to lifeline ferry services
-
took part in the G7 Leaders conference in Cornwall and COP26 in Glasgow
-
set out through the National Bus Strategy (NBS) how £3 billion of funding will be invested in new and improved services during the current Parliament
-
launched new national flexible season tickets matching modern working habits post COVID-19 and providing commuters greater choice and flexibility
-
scaled up the RIS2 concrete roads renewal programme delivered through National Highways, with the replacement or renewal of more that 125 miles of lane
-
appointed 2 women’s safety on transport champions, alongside the government’s violence against women and girls strategy in July 2021
-
delivered the first tranche of NRC Direct awards, including South Western and TPE and Essex Thameside
-
Great British Railways Transition Team established and detailed planning for Great British Railways stand-up is underway to test deliverability of the integrated programme plan, including options to de-risk
-
published revised and updated guidance on Improving the accessibility of the public realm – January 2022
-
implemented timetable changes to support the return to schools and more passengers returning to offices
Reduce environmental impacts

Image showing
This year we have:
-
published the Transport Decarbonisation Plan
-
government’s Net Zero strategy: build back greener confirmed the introduction of a zero-emission vehicle mandate on manufacturers of new cars and vans in the UK in 2024
-
delivered Transport Day at COP26 which saw 30 countries and 6 of the world’s largest car manufacturers agreeing to deliver 100% zero emission vehicle sales by 2035
-
published the Electric Vehicle Charging Infrastructure strategy
-
published the Green paper on a new road vehicle CO2 emissions regulatory framework consultation. In the net zero strategy we announced the department will introduce a zero-emission vehicle mandate that will set targets for a percentage of manufacturers’ new car and van sales to be zero emissions each year from 2024
-
introduced E10 petrol – petrol with up to 10% ethanol – as standard fuel in the UK
-
awarded funding for 15 projects to undertake research into the requirements of airports and airfields to handle zero emission aircraft
-
announced the winners of a £23 million clean maritime demonstration competition
-
extended the plug-in truck grant to continue to encourage the uptake of zero-emission HGVs by reducing the purchase price of zero-emission commercial vehicles
-
awarded £20 million funding for collaborative research and development projects that will advance innovative zero emission vehicle and infrastructure technologies in the UK
-
ZEBRA scheme competition launched, worth up to £270 million, to help local transport authorities to introduce zero-emission buses, cut carbon emissions from local transport and improve air quality
Increase our global impact

Image showing
This year we have:
-
supported the government’s regulatory reform agenda, including establishing the Brexit opportunities delivery board to drive forward the department’s projects
-
supported the government’s commitment to make the UK a science superpower by 2030 through our work on developing leading edge transport research and innovation
-
participated at the world’s biggest trade fair, the Dubai Expo, which enabled the department to showcase UK leadership in transport decarbonisation and innovation to a global audience
-
successfully delivered a provisional GB vehicle approval scheme by the Vehicle Certifcation Agency
-
hosted a ministerial roundtable with industry representatives from the UK Connected and Automated Mobility (CAM) sector to discuss barriers and opportunities to exports and inward investment, in a sector projected to be worth £42 billion for the UK by 2035
-
delivered 15 separate events at the COP26 Transport Day
-
assumed presidency of the International Transport Forum (ITF) summit in Leipzig, June 2022
-
participated in the Global Investment Summit held October 2021, aimed at galvanizing foreign investment in UK green industries
-
worked on the Tel Aviv Metro with Crossrail Internation, a £33 billion underground network
Be an excellent department

Image showing
This year we have:
-
increased remote working, which has led to significant reductions in paper use, water use and domestic flights. This saw us exceed our target trajectory in all 3 areas
-
launched the department’s career development programme for Ascend for people in ethnic minorities and / or disabled people to provide support with future career development and progression
-
matched over 200 senior civil servants (SCS) with a reverse mentor as part of the reverse mentoring scheme
-
committed to 650 posts in Leeds and Birmingham by 2025. We have already moved 280 roles to both cities, which includes 9 SCS roles
-
continued our focus on improving digital and cyber security and enabled DfTc to become a 100% cloud-hosted organisation
-
published the Operational sustainability strategy for 2021 to 2025, which sets out the actions to improve sustainable performance and achieve greening government commitments by 2025
-
restructured the department with the addition of a Second Permanent Secretary, enabling the department to steup up and accelerate the focus on de-carbonisation and Levelling Up
-
developed the diversity and inclusion strategy and DfTc inclusion and wellbeing action plan with a focus on drawing from a range of backgrounds, experiences and locations, engaging in the communities we serve
-
implemented a crisis response cohort to provide immediate cover in the case of future crises and ensure the resilience of any future response activity
-
participated in government internships, life chances and outreach initiatives, including hosting placements for the summer diversity internship and autism exchange programmes
-
exceeded the apprenticeships target of 2.3%
Financial overview
Introduction
From the Director General for the corporate delivery group.
The department’s work and its financial position continued to be affected by the COVID-19 pandemic in 2021 to 2022. With the support of HM Treasury, we responded to the challenges presented while ensuring a sustained focus on delivering the government’s transport ambitions. Our annual capital expenditure continued to rise to record levels, reflecting existing plans to ramp up investment in local and national infrastructure. Emergency COVID-19 support to transport operators remained necessary during 2021 to 2022, though expenditure is trending down as the UK emerges and recovers from the pandemic.
Our initial spending plans for 2021 to 2022 were agreed with HM Treasury through Spending review 2020, with statutory authority for final budgets granted by Parliament via the estimates process. Budgets are set in accordance with HM Treasury’s budgeting framework for central government bodies and our financial statements are prepared on an accruals basis in accordance with the government financial reporting manual (FReM).
This report provides a high-level overview of our financial performance, with the table below summarising spend against the final control totals voted by Parliament at the supplementary estimate and figure 3 showing a breakdown by mode.
The final budgets for the year were authorised through the supplementary estimate: this was agreed between the department and HM Treasury in December 2021, at which point the outlook for the final quarter of the financial year remained uncertain.
Figure 3: outturn and control totals authorised by Parliament
| Name | Budget (£ million) | Outturn (£ million) | Variance (£ million) | Variance % |
|---|---|---|---|---|
| Resource DEL | 20,897 | 18,584 | 2,313 | 12% |
| Of which: Administration | 360 | 329 | 31 | 9% |
| Capital DEL | 19,421 | 19,151 | 270 | 1% |
| Resource AME | 4,431 | 3,454 | 977 | 28% |
| Capital AME | 350 | 78 | 272 | 349% |
| Net cash requirement | 37,080 | 30,368 | 6,712 | 22% |
This graph shows the total DEL and AME spending by estimate line, with estimate lines grouped by transport mode. Total DEL and AME spending includes both resource and capital cash spending in addition to non-cash resource costs such as depreciation.
Figure 3.1: breakdown of spending by mode

Image showing
Income and funding
Alongside the supply funding received from figure 3: outturn and control totals authorised by Parliamentary described in figure 3, the departmental group received £6.2 billion in income from other sources. These are summarised in figure 3, and more detail can be found in note 4 to the Financial Statements.
Figure 4: Main sources of income received in year

Image showing
| Sources of income | Income |
|---|---|
| Franchise track access income | £2,767,000 |
| Fees and charges | £1,370,000 |
| Other income | £671,000 |
| Transport for Scotland | £604,000 |
| Capital grant received | £260,000 |
| Income from rail policing services | £226,000 |
| Rental income | £190,000 |
| River crossing charges | £149,000 |
Figure 4.1 below shows the net movement in Income by revenue source in the year ended 31 March 2022. Main movements are discussed below.
Figure 4.1: Movement in revenue streams, £ million

Image showing
Source: Financial statements note 4, cash items.
Rail franchise settlements represent termination sums payable by some train operating companies at the end of their franchise agreements with the department: these were recognised in full in 2020 to 2021 and were therefore not repeated in 2021 to 2022.
Fees and charges have increased in 2021 to 2022 as operational activity in the agencies recovered following the initial impact of the pandemic.
Expenditure
The departmental group incurred £32 billion of expenditure in 2021 to 2022 compared to £34 billion in the previous year. Figure 5 shows the headline movements in expenditure during the year.
Figure 5: Movements in expenditure in 2021 to 2022

Image showing
Goods and services include the department’s contractual payments to train operating companies to sustain rail services. These costs reduced in 2021 to 2022 as passenger numbers and fare income revenues recovered from the levels experienced in the previous year.
Grants include support payments to TfL, bus and light rail operators: these support costs reduced in 2021 to 2022 during COVID-19 recovery. In addition, grants include amounts issued to local authorities for investment in local transport.
Depreciation is a non-cash cost reflecting operational usage of assets: this increased due to the higher valuation of assets.
Finance costs primarily represent interest charges on legacy debt owed by the group to bondholders: these increased due to inflation.
The increase in other costs primarily reflects the one-off impact of the prospective change in corporation tax rate, which was substantively enacted for accounting purposes during the year.
COVID-19 spending
The department incurred £8 billion of COVID-19-related costs in 2021 to 2022. A breakdown of COVID-19 related spending is provided in figure 6. While this is less than the equivalent £13 billion spent in 2020 to 2021, expenditure remained high as we continued to navigate uncertainty and respond to challenges that emerged, including those presented by the Omicron variant and the introduction of the associated plan B measures.
Figure 6: COVID-19 spend
Image showing
Note: Cycling and walking grants were categorised as COVID support spending in 2020 to 2021 but not in 2021 to 2022.
Spending on COVID-19 interventions against the budgets authorised by HM Treasury in the supplementary estimate are described below.
| Spending | Rail (£ million) | TfL (£ million) | Buses (£ million) | Light Rail (£ million) | Other (£ million) | Total (£ million) |
|---|---|---|---|---|---|---|
| Outturn 2021 to 2022 | 5,113[footnote 1] | 1,719 | 495 | 84 | 129 | 7,540 |
| Budget 2021 to 2022 | 6,160 | 2,100 | 513 | 97 | 146 | 9,016 |
| Under or over spend | 1,047 | 381 | 18 | 13 | 17 | 1,476 |
The out performance on rail and TfL arose from the improvement in passenger numbers and revenue in the final quarter of the year, compared with the set of assumptions agreed with Her Majesty’s Treasury (HMT) at the supplementary estimate at which point the impact of the Omicron variant and plan B restrictions was uncertain.
The department’s counter-fraud strategy and main financial controls are summarised in the accountability report: the department is not aware of any instances of fraud or error relating to COVID-19 spending during the year.
Capital investment
Capital investment included continued delivery of the:
- Road Investment Strategy by National Highways
- Network Rail enhancements programme and
- High Speed Two (HS2) construction by HS2 Ltd.
These are our 3 main areas of capital spending. Alongside these major infrastructure projects, we have continued to invest at a local level, including via grant funding to local authorities and mayoral combined authorities, in line with our strategic priority of growing and levelling up the economy.
Capital funding to TfL and the GLA for Crossrail reduced compared with the prior year, as the project approached completion during the financial year and opened in May 2022.
We have increased investment in projects to decarbonise the transport system – such as cycling and walking infrastructure, zero emission buses and electric vehicle infrastructure.
Total managed expenditure (TME)
Total managed expenditure (TME) represents the total funds spent by the department against a series of different budget types, which are depicted in figure 7. A comparison of TME in 2021 to 2022 to recent years is shown in figure 8, with 2021 to 2022 values corresponding to the statement of outturn against Parliamentary supply.
Net cash requirement (NCR) is a separate Parliamentary control total which limits the cash funding departments can draw from the exchequer to finance their TME spending for the year.
HM Treasury sets the budgetary framework for government spending .
The total amount the department spends is referred to as TME, which splits into:
- annually managed expenditure (AME)
- departmental expenditure limited (DEL) AME expenditure is typically volatile or demand-fed
AME budgets are agreed with HM Treasury on an annual basis. DEL expenditure reflects the cost of delivery front-line and back-office activities. Long-term DEL budgets are set through spending reviews which usually occur every 3 to 5 years. Budgets are also classified into resource and capital.
Resource DEL includes a further split into:
- programme budgets for frontline service provision,
- admin budgets, such as back office functions
Figure 7: Our budgetary framework.

Image showing
Figure 8 : TME and NCR by year.

Image showing
The COVID-19-related expenditure described above is largely responsible for the sustained high level of spending in resource DEL in 2021 to 2022, when compared to pre-pandemic levels.
Our resource DEL also covers the expenditure associated with the day-to-day running of the group, including the costs our ALBs incur to develop and deliver our major projects and to operate and maintain the elements of the transport network they are responsible for.
Our capital DEL covers the major capital investments described above and other important spend that is intended to create future economic growth.
We spent £58 million of capital DEL to support the construction of inland border facilities, following the UK’s exit from the European Union (EU). This was supported by £59 million of resource DEL to enable effective operation of these sites as well as the operation of information and advice sites, bringing the department’s total EU exit spend in 2021 to 2022 to £117 million.
TME includes our non-cash budget requirements, such as:
- depreciation in resource DEL
- deferred tax and interest accretion charges in resource AME
- capital provisions in capital AME
Rising inflation increased the costs associated with servicing Network Rail’s external debt, total accretion interest on Network Rail’s debt was £1.5 billion in 2021 to 2022.
In the same period, it also includes a one-off deferred tax charge of £0.9 billion driven by the prospective increase in corporation tax rate. Figure 8 includes our net cash requirement for the year, which represents the department’s total call on taxpayer funds from the exchequer to finance its spending activities for the year.
Figure 8.1 shows how our biggest area of spend which are:
- HS2
- Network Rail
- National Highways
All of which have evolved in recent years. Spending plans for 2022 to 2023 reflect amounts authorised by Parliament in the main estimate for the year.
Figure 8.1: Main areas of capital spend.

Image showing
Assets and liabilities
| Assets | 2021 to 2022 £ million | 2020 to 2021 £ million | Increase or (Decrease) £ million |
|---|---|---|---|
| Property, plant and equipment, including leases and assets held for sale | 534,891 | 489,454 | 45,437 |
| Receivables | 2,694 | 3,029 | (-335) |
| Loans | 2,522 | 2,172 | 350 |
| Investments in equities and associate | 1,096 | 1,092 | 4 |
| Cash | 1,191 | 1,037 | 154 |
| Inventories | 1,077 | 986 | 91 |
| Derivatives | 13 | 387 | (-374) |
| Investment properties | 211 | 213 | (-2) |
| Intangible assets | 406 | 286 | 120 |
| Total assets | 544,101 | 498,656 | 45,445 |
| Liabilities | 2021 to 2022 £ million | 2020 to 2021 £ million | Increase or (Decrease) £ million |
|---|---|---|---|
| Borrowings | 30,325 | 29,301 | 1,024 |
| Payables | 8,601 | 8,696 | (-95) |
| Pensions | 4,007 | 5,180 | (-1,173) |
| Deferred tax | 5,120 | 3,350 | 1,770 |
| Provisions | 1,880 | 1,817 | 63 |
| Derivatives | 264 | 651 | (-387) |
| Total liabilities | 50,197 | 48,995 | 1,202 |
| NET assets | 493,904 | 449,661 | 44,243 |
Assets
The department had £544 billion of assets at 31st March 2022, an overall increase of £45 billion on the prior year. Notable changes are set out below.
The department held £544 billion of assets as at 31 March 2022, of which £373 billion related to the Railway Network in GB and £146 billion related to the strategic road network in England, which are the responsibility of Network Rail and National Highways respectively.
The value of the department’s asset base increased by £45 billion between 31 March 2021 and 31 March 2022. This was driven largely by £15 billion additions and £39 billion of revaluation gains to property, plant and equipment assets, offset by £8 billion of depreciation charges.
Additions to the Rail Network comprised £2 billion of Enhancements and £4 billion of renewals. Major schemes included:
- Transpennine improvements
- East West Rail
- HS2-related projects
- East Coast Main Line improvements
- in Scotland, improvements relating to the Inverness to Aberdeen and Edinburgh to Glasgow lines
Additions to the strategic road network included:
-
£2 billion of capital enhancements including spending from the designated funds used to improve the surroundings of the network, supporting sustainability and protecting quality of life and the environment
-
£0.8 billion of asset renewals
-
significant additions in 2021 to 22 included improvements to M6 junction 19 in Cheshire
-
completion of the A19 upgrade in Northumberland
-
completion of the A45 / A6 Chowns Mill junction in the Midlands
These networked assets are valued using a depreciated replacement cost valuation approach as required under HM Treasury financial reporting rules, representing the newbuild cost of a modern equivalent asset which is then depreciated to its current condition. The revaluation gains primarily represent inflationary increases in the estimated cost of building a modern equivalent infrastructure asset. The department’s approach to revaluing these assets and the sources of uncertainty are explained in note 3 of the financial statements.
Loans increased by £400 million, primarily driven by £500 million new loans for the Crossrail project made available to the Greater London Authority (GLA) and TfL – which was £700 million in 2020 to 2021.
Trade and other receivables decreased by £400 million, largely driven by some significant one-off working capital items relating to the department’s COVID-19 response in 2021.
Derivative assets decreased by £400 million due to settlement of derivative instruments, following Network Rail’s repayment of bonds during the year.
Further details can be found in notes 5 to 9 and 11 to 18 to the financial statements.
Liabilities
The department held £50 billion of liabilities at 31 March 2022 (in 2021: £48 billion). These include:
-
Network Rail has £25 billion of debt payable to bondholders, reflecting third party borrowing entered into before the company joined the departmental group - which in 2020 to 2021 was £24 billion. In addition, £4 billion of debt is payable to institutional investors holding bonds issued by the department’s finance companies, LCR finance plc and CTRL section 1 Finance plc. This stock of debt matures by 2052
-
£9 billion of trade and other payables - which was £8 billion in 2021
-
Network Rail has a total deferred tax liability of £5 billion. This has increased by £2 billion since the prior year, comprising £1 billion due to the prospective change in the tax rate and £1 billion for temporary differences
-
£4 billion of defined benefit pension liabilities relating to employees, which is £1 billion lower than last year due to net effect of changes in key financial assumptions on assets and liabilities. The pension schemes accounted for within this liability are described in note 24 to the Accounts: this liability excludes civil servants in the principal Civil Service pension scheme (PCSPS), for which accounting rules require that liabilities are recognised in-year as the employer contributions fall due
-
£2 billion of provisions, of which £1 billion is for land and property purchases along the HS2 route
-
£1 billion of lease liabilities in respect of right of use assets
Further details can be found in notes 14, 19,23 and 25 to the financial statements.
The department has £2 billion of contingent liabilities and £12 billion of remote contingent liabilities, many of which were designed to promote investment in transport assets by offering guarantees and indemnities to the supply chain in the event that assets do not produce the expected revenues.
The value of contingent liabilities tends to decrease over time as many are based on the remaining value of underlying assets, such as rolling stock and depots. The department also has several contingent liabilities that cannot be quantified.
Figure 9: Increase or (decrease) in liabilities during the year to the nearest £ million

Future outlook
HM Treasury’s Spending Review 2021 was published in November and saw the conclusion of a major piece of work for the department; setting future year budgets up to and including 2024 to 25 and demonstrating the government’s commitment to continued transport investment.
Capital DEL will increase as we continue to deliver through the lifecycle of our major programmes, while resource DEL is forecast to reduce as we emerge and recover from the pandemic.
Figure 10: Total net expenditure (exc. depreciation) split between capital and resource net expenditure

Despite the COVID-19 pandemic receding, the operating context remains challenging as we continue to learn about and adapt to transport users’ changing demands. Inflation presents fresh challenges for the department and the supply chains we depend on to deliver.
The performance report demonstrates the department’s success in delivering against our long-term strategic priorities, while simultaneously responding to the unprecedented challenges brought on by the pandemic. Despite the likely challenges the future will bring, I am confident in our ability to continue delivering the government’s transport ambitions and creating value for money.
Nick Joyce
Director General, Corporate Delivery Group
Response work on the transport network
Over the last year, the department has needed to respond to a number of crises or issues, from the COVID-19 pandemic to the response to the war in Ukraine, in order to ensure that people and goods can continue to travel.
Impact of COVID-19
COVID-19 continued to impact upon the delivery of departmental priorities in 2021 and 2022. Ensuring the safety of transport users and workers and the supply of goods and services continued to be the over-riding priority, alongside building confidence in the transport network to support the recovery from COVID-19 and minimising the operational impact of the pandemic on transport networks. The department has provided £7.6 billon in financial support to the transport sector in 2021 and 2022.
DfT also:
-
worked closely with the transport sector and wider government to develop and communicate the regulation and guidance changes associated with the government’s roadmap, to ensure that the transport sector was ready to support the reopening of the economy
-
took action to safeguard disproportionately impacted groups that used or worked on the transport networks, this included:
-
working hard to encourage disabled people to continue using public transport during the pandemic, including through the exemptions policy for face coverings, backed by a comprehensive communications campaign, and publishing more accessible formats for our safer transport guidance (such as the easy read safer travel guide)
-
updating our guidance for transport operators to reflect advice from the Health and Safety Executive, that operators as part of their risk assessment should have individual conversations with those deemed atrisk by Public Health England
3. implemented the red amber green (RAG) rating system for international travel, so that the department could continue to manage the borders safely
4. agreed and implemented a mitigation strategy with the sector that prevented the mass cancellation of services during a time of significant workforce absence
5. responded rapidly to the emergence of the COVID-19 Omicron variant, establishing travel restrictions for travellers from affected countries and supported the sector through the return of work from home guidance under ‘plan B’
6. provided financial support to the Civil Aviation Authority (CAA) in order to carry out additional activities at the border from the changing requirements of the pandemic - managing passenger locator forms at airports
As part of the lessons learnt from the pandemic, the department is exploring how the transport sector can be made more resilient to future pandemics and has started embedding lessons learned from the response to COVID-19 in the planning for future scenarios.
This will both strengthen the department’s resilience and support the transport sector to develop capabilities for dealing with future public health threats.
Financial settlement with Transport for London (TfL)
The department has continued to provide TfL with extraordinary funding with the aim of supporting them back to financial sustainability and are considering a longer-term settlement.
Since the onset of the pandemic, the government has provided TfL with over £5 billion of emergency funding support.
COVID-19 also had an impact on the department’s public bodies:
Driver and Vehicle Standards Agency (DVSA)
The Driver and Vehicle Standards Agency (DVSA) typically carry out around 1.8 million practical driver and rider tests per year, however during 2020 to 2021, due to measures in response to COVID-19, only around 519,000 tests were completed.
This led to DVSA beginning the year with a substantially increased waiting time for a test of around 17 weeks compared to the usual waiting time of 6 weeks. There was a backlog of around 420,000 candidates waiting for a practical driving test.
Recovery plans are in place to address this, including introducing incentive schemes to increase the throughput of tests, working with the industry to ensure candidates are as well prepared as possible and recruiting more driving examiners.
Driver and Vehicle Licensing Agency (DVLA)
The Driver and Vehicle Licensing Agency (DVLA) cleared the backlog of ordinary paper driver applications processed and turnaround times are back to normal.
DVLA has reduced the paper backlog from a peak of 1.2 million applications in September 2021 to 245,000 in June 2022. The current backlog consists of drivers’ medical applications which are more complicated in nature and require further information to proceed.
DVLA is reliant on the NHS for information in many of these cases and receipt of timely information was affected by the pandemic with response times remaining longer than pre-pandemic. Furthermore, this area was targeted for strike action, including a month-long strike in August 2021.
Despite challenges raised throughout the pandemic including high COVID-19 rates in the Swansea area, strike action and high levels of scrutiny, the DVLA is on track to return the service to normal levels by September 2022.
Crisis in Ukraine
The invasion of Ukraine by Russia is now both a geopolitical and humanitarian crisis, which will have long term implications.
The government continues to take strong action against Russia in light of the invasion of Ukraine and the department has worked with industry to monitor the impacts of this, including on critical goods. Most of the response work across Whitehall is with the Foreign, Commonwealth and Development Office (FCDO), Home Office, and Ministry of Defence (MoD).
However, the department has played its role right from the start. The UK was one of the first countries to ban Russian planes from UK airspace and closed ports to Russian owned, registered, or operated ships. The department is also supporting the wider sanctions package.
The government put in place legislation banning all ships that are Russian owned, operated, controlled, chartered, registered, or flagged from entering British ports, effective from 1 March 2022. These measures also included powers to detain Russian vessels already in port and to direct them out of British ports, as well as ensuring that anyone sanctioned by the UK can no longer register a vessel – and will have any existing registrations terminated – in the UK.
A restriction of flying order was implemented in February to ban all scheduled services owned, chartered, or operated by a person connected with Russia or registered in Russia from overflying, landing or taking-off from the UK. This was extended to include non-scheduled flights (private jets and cargo).
This has been intense and demanding work. This has particularly affected teams on supply chains, aviation, maritime, international and the security and response operations. The department set up a new Ukraine response cell and will build on what worked for EU exit and COVID-19 to ensure the department continues to deliver at pace.
Inflation, cost of living and critical goods: Supply chains
The department continues to monitor the crisis in Ukraine and the impact that it is having on the rising fuel prices and critical supply chains. These increases affect transport operators, vehicle owners, and user demand.
These higher rates of inflation have increased the operational costs of running transport services and will increase capital costs of delivering the department’s infrastructure portfolio.
The department also continues to monitor secondary impacts from rising gas and oil prices. The UK imports 4% of its gas from Russia. However, a spike in demand for the North Sea and Middle East gas supplies and disruption to Germany’s gas supply, increased prices that were already rising.
For example, both Network Rail and manufacturers in the rail supply chain are heavy consumers of energy, so any rise in gas or electricity will be strongly felt.
These costs are also felt by consumers. The recent Great British rail sale, and revisions to insurance regulations to remove the Vnuk requirement have helped reduce anticipated increased costs for families with cars.
In addition, at the Spring Statement the Chancellor announced a temporary, 12 months cut of 5 pence per litre to duty on petrol and diesel, further reducing costs for motorists. Further options for interventions to alleviate the increasing cost of living are being investigated across the department’s policy areas.
HGV driver shortage
The heavy goods vehicle (HGV) driver shortage was a significant issue for transport over the last year. The drivers perform a critical role in the finely tuned supply chains. The disruption caused by the lack of drivers resulted in difficulty delivering some goods.
To address this, the department worked hard across government, with industry, and motoring agencies to urgently increase HGV driver testing, to speed up HGV licencing processing and to increase the supply of drivers, securing the future driver workforce.
Since summer 2021, the department has delivered 25 different measures to tackle the shortage. These broadly fall into the following categories:
- support and training for new HGV drivers
- increasing HGV driver testing capacity and improving licensing processes
- attracting drivers back to industry and improving working conditions
- supporting fuel deliveries
In the medium to long term, the department is focused on supporting industry to address the root causes of the shortages.
Kent and Short Straits resilience
In recent years, periods of high demand coupled with and changes to border controls, have led to some periods of freight and passenger traffic disruption on key routes to ports in Kent. It is expected that demand, will be high throughout the summer holiday period.
The Kent resilience forum (KRF) is responsible for managing any disruption arising from traffic heading to the short straits, including activation of Operation Brock on the M20, to ensure continued flow of vehicles through Kent to the Port of Dover and Eurotunnel.
The department is continuing to work with the KRF to strengthen existing traffic management measures. This includes utilising additional capacity to queue freight vehicles off the strategic road network and measures to improve compliance with Operation Brock to keep local and passenger traffic flowing.
In addition, the department is working with its French counterparts and the portals to maximise the fluidity at the juxtaposed controls.
Delays at airports and disruption to scheduled flights
A steep increase in passenger demand, alongside a tight labour market has put considerable pressure on the aviation sector which resulted in some passengers experiencing unacceptable delays.
However, the aviation industry operates in the private sector, so it is the responsibility of the industry to manage demand, recruit and roster staff and have appropriate mitigations in place. The government is seeking to ensure that passengers can rely on airline schedules and travel through airports without unreasonable delays and disruption.
The aviation minister regularly meets with CEOs from the sector at a strategic risk group. In partnership with the CAA, the government has written to the industry setting out 5 expectations:
- summer schedules must be reviewed to make sure they are deliverable
- everyone from ground handlers to air traffic control must collaborate on resilience planning
- passengers must be promptly informed of their consumer rights when things go wrong and – if necessary – compensated in good time
- disabled and less mobile passengers must be given the assistance they require
- safety and security must never be compromised
On 30 June, the Secretary of State set out various measures the government is taking to support the aviation industry, including to help recruit and train staff, ensure the delivery of a realistic summer schedule, minimise disruption, and support passengers when delays and cancellations are unavoidable.
The government recognises that while the issues were for industry to solve, a series of targeted measures could support their efforts.
Rail industrial action
In response to the unprecedented emergency funding and changes to travel behaviours experienced through COVID-19, the railway requires modernising, making it more productive and financially sustainable.
In this context, some of the rail trade unions balloted for strike action, related to a range of issues, including increases to pay, a guarantee of no compulsory redundancies and protection of terms and conditions.
The National Union of Rail, Maritime and Transport Workers (RMT) union announced strike action that took place in June 2022. The rail industry and the department worked together to ensure plans were in place to minimise disruption. This allowed freight and passenger services to remain operational where possible. This also included working with other government departments (OGDs) on mitigations for impacts on critical supply chains.
The department will continue to work with the rail industry to prepare for and respond to any future industrial action.
Seafarer protections
In March 2022, P&O Ferries dismissed nearly 800 workers without notice or consultation.
These actions highlighted the need to make legislative changes to protect seafarers and ensure they are paid fairly.
In response, the department implemented a 9 point plan for seafarers which aims to:
1. introduce a new law (Harbours Act (Seafarers’ Remuneration) Bill) to:
- improve protection for seafarers, announced by the Secretary of State for Transport on 30 March
- ensure all ferry crews receive the equivalent to national minimum wage when operating regularly in UK ports. This will protect seafarers and ensure that if the industry wish to access UK ports, they will be expected to pay their seafarers at least the equivalent to national minimum wage
2. work with international partners to create minimum wage corridors, and work to encourage more ships to operate under the British flag – so that workers on board can benefit from more rights
The insolvency service also confirmed on 1 April 2022 that it had commenced formal civil and criminal investigations into the circumstances surrounding the redundancies.
Grow and level up the economy
Improve connectivity across the United Kingdom and grow the economy by enhancing the transport network on time and on budget: overview
Growing and levelling up the economy is at the heart of the government’s agenda to build back after the pandemic, ensuring every part of the UK has access to equal opportunities and reaches its productivity potential.
While levelling up requires a cohesive cross-government approach, as outlined in the Levelling Up White Paper, investment in transport infrastructure is critical.
This report provides a detailed performance update on the workstreams and outcome metrics that support the delivery of the priority outcome and is interlinked and mutually supports the other priority outcomes.
Improvements to transport connectivity are an essential element in the creation of high-performing markets, and increased agglomeration and linkages between major sectors of the economy.
The Union Connectivity Review looked to identify ways that the quality and availability of transport connectivity could be enhanced to support economic growth and quality of life across the UK. The efficient delivery of major programmes such as the Integrated rail plan for the Midlands and the North, HS2 and the Roads Investment Strategy is fundamental to supporting job creation, driving economic growth and our recovery from COVID-19.
This report provides an update on the progress of these workstreams and outcome metrics that support the delivery of the priority outcome throughout 2021 to 2022. As with all the priority outcomes it is interlinked and mutually supports the other priority outcomes.
Progress made by the department in 2021 to 2022 is summarised below.
Integrated rail plan (IRP)
The government published the integrated rail plan (IRP) on 18 November 2021. It set out the biggest ever government investment in the British rail network, outlining a £96 billion strategy of rail construction and upgrades for the North and Midlands to be delivered over the next 30 years.
IRP will deliver faster, more frequent, and more reliable journeys across the North of England and the Midlands.
IRP redresses decades of underspend in the railways in those places outside of London and sits at the heart of the government’s plans to level up the whole country by delivering 3 new high-speed rail lines:
- HS2 from Crewe to Manchester
- HS2 from West Midlands to East Midlands Parkway
- Northern Powerhouse Rail between Warrington, Manchester and Yorkshire,
These will transform transport connections to, from and between the East and West Midlands, the North West and North East of England, Yorkshire, Scotland and Wales.
The government will also electrify and or upgrade 3 crucial main lines:
- the Midlands Main Line
- Trans-Pennine Route
- East Coast Main Line
Places like Doncaster, Huddersfield, Newark, Wakefield, Market Harborough and Leicester would have seen little benefit, or even a worsening of their services under previous plans. Instead, these and other towns will see improved, electrified or faster services.
IRP technical annex and the Mott MacDonald report on strategic alternatives to the HS2 Eastern Leg (an independent report), both of which formed part of IRPs evidence base, were also published in January 2022.
Northern Powerhouse Rail
Northern Powerhouse Rail (NPR) is an intrinsic part of the department’s ambition to Grow and Level Up the UK economy through improvements of rail connectivity, capacity and journey times between cities in the north of England.
In 2021 to 2022, the department continued to work with Transport for the North (TfN), Network Rail, HS2 Ltd and other delivery partners to continue the option development for NPR. This led to an enhanced rail network that will unify labour markets and foster agglomeration. The output of this development work feed into the IRP and contributed to the shaping of the long-term scope of the programme.
The IRP outlines the core NPR network and how it will integrate with HS2 phase 2b, and HS2 East.
The core NPR network will comprise of 40 miles of new line, alongside the upgrade of existing railways, digitised signalling, gauge and track upgrades and full electrification between Liverpool and York and Bradford and Leeds.
These changes across the NPR network will see journey times improve across the north with services between Leeds to Manchester reduced by 20 mins and Liverpool to Manchester by 15 mins, and capacity improvements with an increase of 300% seating on the Transpennine Route.
As the IRP sets out, some NPR services will also be delivered by the end of this decade, meaning people and businesses in the north will begin to benefit from NPR upgrades much sooner than previous proposals.
Currently, the department is in the process of finalising the revised strategic outline business case (SOBC) for NPR following the changes to project sponsorship set out in the IRP.
The publication of the IRP proved to be a pivotal point in the development of NPR. The IRP introduced 2 significant changes to NPR, these being:
-
transition from shared responsibility between the department and for the delivery of NPR to single responsibility for delivery with the department. The department and TfN will continue to sponsor NPR, but Network Rail, HS2 Ltd and other delivery partners will be managed by the department
-
commitment to build NPR, between Liverpool and York, in line with 2019 option one developed by TfN
The department, working alongside key stakeholders, focused on designing the new governance arrangements to support sole responsibility for NPR delivery and co-sponsorship with both achieving ministerial and TfN board approval in 2021 to 2022.
Additionally, the department, with Network Rail and HS2 Ltd, led in re-baselining the NPR programme to align with the IRP and are working towards NPR achieving entry onto the government’s major projects portfolio in 2022 to 2023.
HS2
HS2 will free-up capacity on the traditional rail network that can then be used to allow more local and commuter services, while also ensuring these places have better access to new HS2 services.
HS2 is critical for a low carbon transport future and will have a transformative impact across the country adding much needed rail capacity. It will improve connectivity between major cities and is integral to rail projects in the North and Midlands – helping rebalance the UK economy.
The programme is at the heart of the government’s build back better, levelling up and net zero agendas. The fepartment is working closely with the Department for Levelling Up, Housing and Communities (DLUHC), to determine how central government can help local places make the most of HS2.
Ministers from the department and DLUHC are inviting local leaders from phase 1 and 2a station places to present on their local growth strategies. Using these and working level engagement the department’s aim is to develop an HS2 local growth action plan.
Delivery highlights
Dft has:
-
supported over 24,000 jobs, with over 2,400 UK registered businesses having delivered work on HS2 over the course of the project
-
supported HS2 over 900 apprenticeships and at its peak, the programme will create at least 2,000 apprenticeships
-
planted over 700,000 trees on phase 1 to date (240,000 of which were in the 2020 to 2021 planting season), the department aims to plant 7 million new trees across phase 1 alone
-
marked the next phase of work at Old Oak Common by formally handing over the site from National Rail to HS2 Ltd.’s Station Team. This follows 4 years of work to relocate depots previously on the site
-
began the Invitation to tender for a design and delivery partner for phase 2a (Birmingham to Crewe) route
-
deposited the phase 2b Western Leg hybrid bill in the House of Commons
Crossrail
Her Majesty Queen Elizabeth attended the ceremonial opening on 17 May 2022 of the Elizabeth Line (EL) central section – Paddington to Abbey Wood – and on 24 May the EL central section opened to the public.
Bond Street station was not opened for passenger use as part of the EL opening but is available for emergency exit. Further work is required to complete the station for full passenger use and is expected in Autumn 2022.
The next phase of opening scheduled for Autumn 2022 will provide direct services from Reading, Heathrow and Shenfield to connect into the central section.
Services from Reading and Heathrow will operate through to Abbey Wood. Services from Shenfield will operate through to Paddington. The final timetable that will connect all parts of the EL is scheduled to be introduced by May 2023.
There is a risk that Crossrail Limited (CRL) will breach the existing £825 million funding package – agreed late 2020 – at the end of 2022.
The government has committed to finance Crossrail to completion, although funding will ultimately have to come from London in a way that is fair to UK taxpayers. The department expect this to be resolved as part of a wider capital funding negotiation with TfL.
East to West rail (EWR)
East West Rail (EWR) is another multi-year rail project that will provide a direct rail link between Oxford and Cambridge and will join up key towns and cities across the Oxford to Cambridge Arc.
The scheme will not only improve connectivity but support wider economic growth in the area. The project is split into several stages, structured around the phased introduction of passenger services:
-
connection stage (CS) 1 will reinstate and upgrade railway lines between Bicester and Bletchley, to enable new train services to run between Oxford and Bletchley and Milton Keynes
-
further EWR services would be introduced from Oxford to Bedford, using an extensively upgraded Marston Vale Line, as part of CS2. This could include potential changes to station locations for better local connectivity
-
the third stage, CS3, would involve building new railway between Bedford and Cambridge to complete the project, and will see services run from Oxford to Cambridge
-
a possible CS2.5 would enable passenger services from Aylesbury to Milton Keynes. It would require upgrading an existing freight-only railway from Aylesbury Vale Parkway to Calvert Junction
Although certain challenges remain, CS1 is currently on track for completion to time and budget. Design work continues to determine the best value for money, scope, route, and delivery schedule for CS2 and CS3.
Delivery highlights:
DfT saw:
-
in 2021 East West Railway Company ran a non-statutory public consultation on CS2 and CS3, seeking views on topics such as train service provisions for CS2 and route alignment options for CS3. Over 9,800 responses were received
-
the restored the railway flyover at Bletchley with minimal disruption. The new flyover is built to last 120 years. Innovative construction approaches saved £70 million
Intra-city connectivity – Transforming Cities Fund
The department is committed to supporting cities to develop and promote local growth through the £2.45 billion transforming cities fund (TCF).
The fund is aimed at driving up connectivity and productivity through investments in public and sustainable transport infrastructure in 18 of England’s city regions.
In 2021 to 2022 a total of £815 million was paid to these 18 city regions, of which:
- £340 million was shared by 8 mayoral combined authorities
- £475 million was shared by the 10 competitively bid city regions
Across all 18 city regions TCF has started to deliver benefits, and a range of measures are either being implemented on site or in some cases have already been completed. These include improvements to:
- rail services
- bus services
- active travel
- park and ride
- smart ticketing
- electric vehicle infrastructure
The financial year 2022 to 2023 is the final planned year for TCF investment, although delivery challenges arising from COVID-19, including supply chain challenges and cost escalation, may result in delay to some TCF projects.
Furthermore, the 2022 to 2023 mayoral combined authorities funding (£515 million) will be subsumed into the city region sustainable transport settlements (CRSTS) programme.
Delivery highlights:
-
secured approvals for the £94 million of TCF investment in the Tyne and Wear Metroflow project to proceed which will help ensure:
- economic growth – improved frequency, capacity, resilience, and connectivity will generate an additional 1.7 million passenger journeys, each contributing £8.50 to the regional economy
-
air quality improvements – improved frequency, capacity and resilience will encourage mode transfer from car to Metro. This removes 3 million car kms, 517,000 kg of CO2, and 37,000 kg of NO2
-
building for the future – improved accessibility, connectivity and integration will encourage further investment in those areas served by the Metro, supporting regeneration and development, and support the development of future network expansion to areas currently not served by the Metro
-
completed the Thorpe Road, Norwich bus and cycle priority scheme, delivering bus journey time savings between 1 and 3 minutes, representing journey time savings of about 15% overall. Furthermore, this has enabled the previous 501 park and ride service 30-minute service frequency to be improved to a 20-minute service frequency
-
delivered 21 out of 27 new trams, 19 of which have already been brought into service in Greater Manchester, with the delivery of the remaining 6 trams on track for 2022 to 2023
Intra city connectivity – City Region sustainable transport settlements (CRSTS)
Building on the success of TCF, the government is investing £5.7 billion through City Region sustainable transport settlements (CRSTS) to develop the transport networks of 8 city regions in England starting in 2022 to 2023.
This funding will be delivered through 5-year consolidated funding settlements based on the plans put forward by Mayors and will see upgrades to local tram, bus, cycling and walking and rail networks.
Indicative allocations for eligible mayoral combined authorities were announced by the Chancellor in his budget and spending review in October 2021 (SR21).
Following the assessment of their business cases, the government have now confirmed their final settlements. Further work to finalise the full range of schemes to be delivered through these settlements will now take place over the coming months.
City regions benefiting from confirmation of the multi-billion-pound transport investment are:
| Area | Amount (£) |
|---|---|
| Greater Manchester | £1.07 billion |
| West Yorkshire | £830 million |
| South Yorkshire | £570 million |
| West Midlands | £1.05 billion |
| Tees Valley | £310 million |
| West of England | £540 million |
| Liverpool City Region | £710 million) |
The North East will be eligible to access its share of the funding once appropriate governance is in place.
Mayoral combined authorities eligible for CRSTS
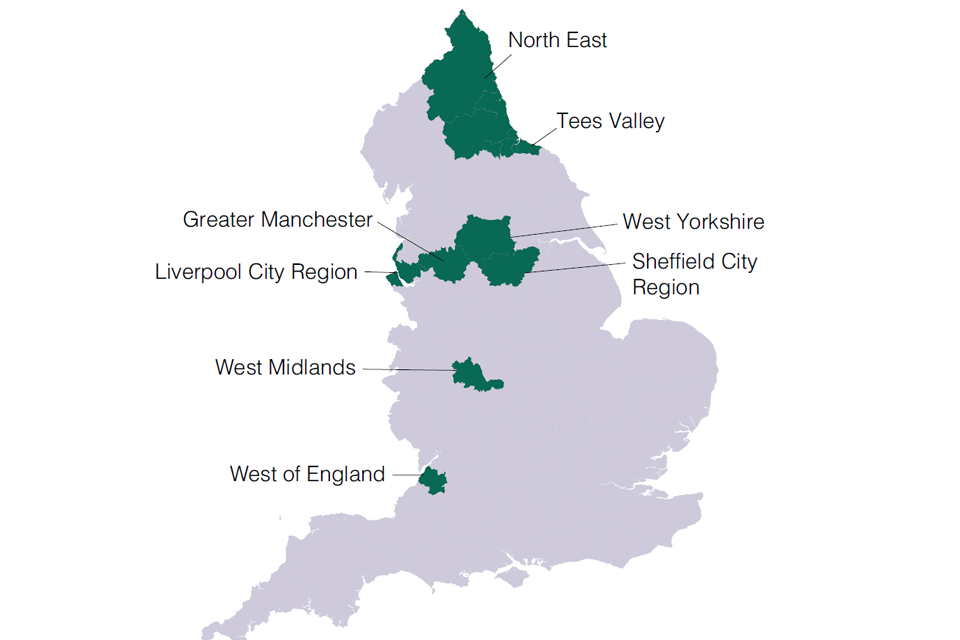
Combined authorities eligible for CRSTS areas include:
- North East
- Tees Valley
- Greater Manchester
- Liverpool City Region
- West Yorkshire
- Sheffield City Region
- West Midlands
- West of England
Union connectivity
In 2020 the government asked Sir Peter Hendy (CBE) to undertake an independent review of how the quality and availability of transport connectivity could be enhanced to support economic growth and quality of life across the UK.
As a result, the union connectivity review (UCR) was published in November 2021 and contained 19 recommendations for improving transport connectivity across the UK, including the creation of UKNET – a strategic transport network spanning the entire UK.
The department is grateful to Sir Peter for his report and is working with the Devolved Administrations and stakeholders to identify solutions that work best for the people of the UK. The government intends to publish the response to the UCR later this year.
Delivery highlights
-
the government made development funding available to take forward feasibility work for projects identified in the UCR in Scotland, Wales, and Northern Ireland
-
in May 2021, Network Rail and HS2 Ltd received £2 million development funding to identify options to improve capacity and journey times on rail services between England and Scotland
-
the department worked with DAs and delivery partners to consider Sir Peter’s recommendations and identify further suitable development projects
Strategic road enhancements (SRN)
The strategic road network (SRN) supports people and goods to travel up and down the country unlocking a host of social and economic benefits, including access to education, jobs, healthcare, retail, and leisure. It is essential that the network is safe and reliable throughout the year helping boost economic growth across the country.
The second road investment strategy (RIS2) delivered by National Highways covers the period 2020 to 2025. The budget for this portfolio at the start of this financial year was £27.5 billion with around three-quarters being spent on 69 enhancement schemes, however SR21 confirmed the reduction of RIS2 funding to £24.0 billion. The reduction in funding reflects public delays to major schemes such as the Lower Thames Crossing and A428 Black Cat to Caxton Gibbet.
Five schemes were completed and open to traffic in 2021 to 2022, those being the:
- A19 Testo’s junction
- A45 / A6 Chowns Mill roundabout improvement
- M6 junction 19 improvement
- A19 Norton to Wynyard
- A34 Oxford to Newbury
The latter 3 opened ahead of committed schedule.
Delivery highlights:
A19 Testo’s junction
-
in June 2021, after more than a million hours of work – around 60% of that time coming from a local workforce – a £130 million junction improvement in the North East was complete and fully open to traffic
-
the Testo’s junction upgrade brings great benefits to the North East, providing swifter, more reliable free-flowing journeys and supporting economic growth in the region, enabling better journeys and connections to international gateways and the rest of the country
M6 junction 19
The M6 junction 19 improvement schemes were completed, and the improvements are part of a wider collection of schemes to improve connections between Cheshire and South Manchester. As part of this project NH delivered:
-
a 2-way link across the junction to allow better connection between the M6 and A556, including a new bridge spanning the M6 motorway within the roundabout
-
renewing traffic signals on the roundabout and its approach roads and adding new traffic signals for the Tabley Hill Lane and Pickmere Lane junction
-
additional new signs
-
improved local access for walkers and cyclists using the junction
Grow and level up the economy: priority outcome indicators
These indicators were agreed as part of the SR20 settlement to show performance against the priority outcome. Unless otherwise stated, metrics have been drawn from the sources referred to in the department’s 2021 to 2022 outcome delivery plan.
The delivery confidence assessment gives an overall summary of how likely each project is to deliver its outcomes successfully and is reported via a traffic light system ranging from green – for the projects judged with the lowest risks to success – to red – for those projects facing the most serious challenges.
Transport infrastructure projects DfT assesses
These projects are in the government major projects portfolio (GMPP) which DfT assesses as on track to delivery, based on infrastructure and project authority assessments.[footnote 2]
| Annually | % |
|---|---|
| 2020 to 2021 | 96% |
| 2019 to 2020 | 82% |
Travel time to reach nearest large employment centre
Travel time (in minutes) to reach nearest large employment centre, by region.
| Region | 2016 | 2017 | 2019 |
|---|---|---|---|
| North East | 31.4 | 31.6 | 30.82 |
| North West | 30.3 | 29.4 | 28.00 |
| Yorkshire and the Humber | 32.3 | 31.6 | 30.40 |
| East Midlands | 37.8 | 36.2 | 35.14 |
| West Midlands | 30.5 | 29.7 | 29.48 |
| East of England | 37.8 | 38.2 | 37.30 |
| London | 23.6 | 22.4 | 21.90 |
| South East | 35.0 | 34.2 | 33.23 |
| South West | 41.2 | 42.0 | 39.89 |
Improve transport for the user
Build confidence in the transport network as the country recovers from COVID-19 and improve transport users’ experience, ensuring that the network is safe, reliable, and inclusive.
Priority outcome overview
Improving transport for the user is critical in ensuring the department delivers and maintains a transport system that meets user need and expectations addressing what they care about most.
It is about putting current and potential users (both passengers and freight customers) at the heart of the operation of the transport system. Ensuring that our infrastructure, and the services that use it, meet the varied needs of businesses and the public, and are attractive, affordable, safe and sustainable.
Our approach focused on:
- building confidence and improving the public transport experience – this is especially important given the significant impact COVID-19 has had on both usage and perceptions of public transport
- improving the experience for road users
- building a transport network that works for everyone and continually improving the safety, security and resilience of the transport system
Progress made by the department in 2021 to 2022 is summarised below.
Transport safety
A safe and secure transport system is vital for society, prosperity, and quality of life. It is therefore critical that the transport networks are resilient to a wide range of threats and hazards.
The department is responsible for managing critical risks as identified via the national security risk assessment as well as playing an active role in delivering on cross-government strategies such as the:
- integrated review
- national cyber strategy
- forthcoming national resilience strategy
This year has again seen the department having to respond to a wide-ranging number of incidents and events including:
- storm Eunice that led to large scale impacts across road and rail
- fuel shortages in the autumn impacting industry and the public
- G7 leaders conference in Cornwall and COP26 in Glasgow
- the cancellation of P&O Ferries services
- withdrawal of coalition forces from Afghanistan
Alongside those events, the Russian invasion of Ukraine in February 2022 and the ongoing conflict there has had major implications for the security and resilience of global transport networks.
The department played a key role in the initial response, working alongside partners in government and industry to ensure the continued safety of aviation and shipping routes in the region, and in implementing sanctions to deter further aggression.
Road user safety
Public concerns about the safety of smart motorways have been at the forefront over the past year. The SRN is critical to the smooth running of the economy, and the top priority is that the roads must be safe.
Despite the continuing improvements to smart motorways as set out in the Stocktake and action plan, published in March 2020, the department and National Highways remain determined to go further and do all that they can to help drivers feel safer and be safer on all the roads.
Following the transport select committee report on the rollout and safety of Smart Motorways, the department is taking forward all the committee’s recommendations, including the pause of the roll out of future all lanes running smart motorway schemes.
This will help to gather further safety and economic data and to complete and evaluate the rollout of measures within the stocktake and action plan. The pause will also enable evidence to be gathered to inform a robust assessment of options for future enhancements of capacity on the SRN as the department prepares for the next road investment strategy.
The National Highways safety and congestion fund delivers route and junction improvements to improve both safety and congestion on high-risk roads, accident-cluster locations, and potential suicide-cluster areas.
The fund had a budget of £31.9 million in 2021 to 2022 and £18.8 million was used delivering high value for money small-scale projects with specific interventions for safety including safety barriers, new or improved signage and measures to reduce road-work risk.
The department also published an updated Highway code to improve road safety for cyclists, pedestrians and horse riders and a THINK! campaign was launched to raise awareness.
Strategic roads – maintenance and renewals
National Highways continues to deliver maintenance and renewals improvements to the SRN. The programme aims to secure a higher performing road network that meets road users’ priorities - in particular on safety and journey reliability - but also one that has less an impact on places and communities. This can be done by:
- reducing noise and light pollution
- improving air and water quality
- mitigating the severance effects that busy roads can have
National Highways have scaled up the RIS2 concrete roads renewal programme, with the replacement or renewal of more than 125 lane miles of roads which are nearing the end of their life. They have also continued their programme to replace steel and concrete barriers with over 230 miles of barriers replaced or renewed.
Local highways maintenance and renewals
Local authorities (LAs) have a statutory responsibility to help maintain their respective local highways network and are provided with capital grant funding each year using a sector-agreed needs-based formula. Funding for the highway network covers both the footway and cycleway as well as the carriageway.
The department remains committed to ensuring that LAs have the resources available to carry out safe and effective maintenance of their respective highway network and associated assets - such as bridges, culverts, and lighting columns.
This investment benefits all road users, not just motorists, and is critical for the successful delivery of both national transport strategies such as the national bus strategy (NBS), gear change and local transport plans.
In addition, the government provides additional formula funding to ensure that small-scale renewals in and around their local transport network can be carried out, focusing on aspects such as public transport, accessibility, and road safety.
The main priority in 2021 to 2022 for the department was to agree a multi-year spending settlement for local highway maintenance at SR21. This was achieved by securing a 3-year funding settlement between 2022 to 2025 consistent with 2021 to 2022 funding levels.
Bus reform
The national bus strategy (NBS) for England was published in March 2021 and sets out the department’s vision on delivering better bus services for passengers across the country. The goal is to get bus use back to pre-pandemic levels, then to increase patronage and raise buses’ mode share.
The strategy sets out how £3 billion of funding will be invested in new and improved services during the current Parliament.
This includes giving local transport authorities (LTAs) the skills and people they need to deliver the strategy, including bus priority schemes to speed up bus journeys and accelerating the delivery of zero emission buses.
Delivery highlights:
-
the department has worked with LTAs and provided £25 million in 2021 to 22 to support the delivery of bus service improvement plans (BSIPs). Funding is also supporting the ongoing development of enhanced partnerships, franchising plans and a bus centre of excellence. This is the first stage in delivering improved services for communities and helping to meet net zero and levelling up ambitions
-
the department is supporting by funding the introduction of 2,500 new zero emission buses through the zero emission bus regional areas (ZEBRA) scheme
-
the department consulted on increasing metropolitan combined authorities’ powers over key roads in their areas, where they are not already the highway authority
Rail transformation programme
The Williams-Shapps plan for rail (WSPR) published on 20 May 2021 sets out the government’s ambitions for the future of the railway. The review outlined urgent and radical change is needed to help the railways become more customer focused and financially stable, working in the interest as a public service.
The government have a vision for Great Britain’s railways that can be summarised in 10 outcomes, as outlined in figure 11.
Since publishing the Williams-Shapps White Paper and establishing the rail transformation programme, there has been significant progress on:
- further policy development to support legislation
- defining the overarching transformation strategy
- developing the delivery approach for the programme with key partners
Delivery highlights:
-
appointed Andrew Haines to lead Great British Railway transition team (GBRTT), a virtual team, to help drive forward reforms and build collaboration across the sector as we move towards a new guiding mind for the railway on behalf of the government, with significant progress towards establishing GBRTT as a legal entity in spring 2022
-
launched new national flexible season tickets matching modern working habits post COVID-19 and providing commuters greater choice and flexibility, offering commuters travelling 2 to 3 days a week significant savings as they return to the railway
-
SR21 committed £360 million of funding to transform rail fares, ticketing and retailing (FTR). The programme will provide customers with a simpler, better experience delivered through incremental improvements developing the initial sector operating target model to provide a framework and enable change across the sector
-
launched the whole industry strategic plan – call for evidence, to help shape a 30-year high-level plan shaped by a set of strategic objectives developed for the benefit of passengers, freight users, taxpayers and staff
-
appointed 2 women’s safety on transport champions, alongside the government’s violence against women and girl’s strategy in July 2021. In March 2022, following extensive engagement and evidence-gathering, the champions published 13 ambitious recommendations to make our transport networks safer
Rail concession contracts
National rail contracts (NRCs) are a steppingstone to the new way of working with the private sector. These new contracts will provide the necessary stability to customers and operators as the impact of the pandemic continues to be felt, in addition to providing the department with the necessary flexibility to direct change and accommodate reform measures.
NRCs prioritise cost efficiency, high quality services for customers and improved train performance to support the recovery from the COVID-19. They enable agile changes to train services to reflect changing requirements of the railway.
The NRCs have been directly awarded to incumbent train operators and will be replaced by competed passenger service contracts (PSCs) in due course.
Delivery highlights:
-
delivered the first tranche of NRC direct awards, including South Western and TransPennine Express – both contracts started in May 2021 – and Essex Thameside – contract commenced in July 2021
-
delivered the second tranche of NRC direct awards, including Greater Anglia and West Midlands – contracts commenced in September 2021 – and Chiltern – contract commenced in December 2021
-
ongoing work on the third tranche of NRCs, which aims to deliver NRC contracts on Great Western, TSGN, West Coast and East Midlands during 2022
-
ongoing work to produce a schedule of PSCs projects, which will gradually replace the NRCs in due course
Figure 11: Increase/(decrease) in liabilities during the year
1. Modern passenger experience
Passengers must receive high-quality, consistent services day in, day out. This means accessible, reliable journeys that are well connected with other transport services and include new customers offers at stations and on trains.
2. Retail revolution
A new customer offer will be driven by clearer, easy-to-understand information, simpler travel with contactless and cashless payment and clearer prices. Compensation will be simpler to claim and journeys will become easier across transport services.
3. New way of working with the private sector
Passenger service contracts will replace franchising, bringing a new focus on reliability, performance and efficiency. New opportunities for innovators, suppliers – including small and local partners – and funders will be created through streamlined contracts and more contestability.
4. Economic recovery and financially sustainable railways
The railways are a public service, paid for by taxpayers and passengers to connect places and foster economic growth through levelling up across our towns, cities and regions. Bringing together responsibility for cost and revenue across the system will ensure the railways become more financially sustainable.
5. Greater control for local people and places
Railways will become more responsive to the needs of local communities and customers, whether from Woking, Wrexham or Wick. Empowered, locally-led teams will support levelling up and be accountable to the people and places they serve.
6. Cleaner, greener railways
Britain’s railways can and will spearhead the nation’s ambition to become a world leader in clean, green transport. Decarbonisation, greater biodiversity and improvements in air quality in towns and cities will ensure rail is the backbone of a cleaner, greener public transport network.
7. New offer for freight
The pandemic has highlighted the importance of freight to our country and economy. National co-ordination, greater opportunities for growth and strong safeguards will put rail freight on the front foot.
8. Increased speed of deliver and efficient enhancements
Restoring lost rail links and accelerating the delivery of critical upgrades to the network will help level up places across the country, spark new economic growth and improve public transport connectivity and prosperity across our nations and regions.
9. Skilled, innovative workforce
Enhancing skills, leadership and diversity across the sector will create new opportunities for the hundreds of thousands of people working on our railways. High-value jobs for the future will be created and make the most of data and technology to better support customers.
10. Simpler industry structure
Track and train will come together in a ‘guiding mind’ for the system Great British Railways. It will be made up of regional railways that are locally rooted and accountable with new culture and incentives focused on serving customers. A 30-year strategy will enable the sector to modernise efficiently.
Rail performance
Rail performance, focusing on passenger experience, maintenance or renewals.
Through the different stages of the pandemic, the department collaborated with the rail industry to ensure an adequate level of service could be maintained for passengers and key workers and that the level of service aligned with government measures to deal with the effect of the pandemic.
Delivery highlights:
-
operators added more than 2,500 extra services to meet increasing passenger demand as the country progressed through the roadmap out of lockdown
-
minor timetable changes were introduced to support the return to schools and more passengers returning to offices
-
with the surge in COVID-19 Omicron cases and rising staff absences, the industry made plans to operate the maximum level of service it can run reliably within existing operational constraints
-
Porterbrook class 168 hybrid-flex successfully trialled on Chiltern which allows the train to enter and exit the station in battery mode improving air quality on the stations
-
Porterbrook developed a trial hydrogen train proving the concept and operating for a short distance on the UK Network
-
VIVARAIL produced a battery train which operated during the COP26 conference and is also being delivered into Wales
Accessible transport reform
The 2018 inclusive transport strategy (ITS) remains integral to the department’s ambition of a fully accessible and inclusive transport system by 2030, with assistance if physical infrastructure remains a barrier.
The department published a Baseline evaluation report to help measure progress against the ITS in January 2022. Despite the impact of COVID-19, which has led to some activities being delayed, during 2021 to 2022 progress was made on delivering commitments in the ITS, and on further policy initiatives to enhance accessible and inclusive travel.
Delivery highlights:
-
published revised and updated guidance on improving the accessibility of the public realm (January 2022)
-
ran 2 rounds of the COVID-19 specific element (#WorldofDifference) of the It’s Everyone’s Journey public awareness campaign to support disabled people using public transport in November 2021 and in March 2022, with more activity planned for 2022 to 2023
-
invited and received expressions of interest to the tackling loneliness with transport fund, a £5.8 million fund for public sector organisations to pilot transport-related schemes to reduce loneliness, with a view to awarding funding early in 2022 to 2023
-
£1.5 million announced in March 2022 to support the 13 mobility centres across England to roll out a new hubs mobility service, offering advice to help disabled people travel more confidently
COVID-19 impacts delayed delivery of some changing places toilets at motorway service areas, with all 59 now expected to be installed by April 2023.
Improve transport for the user: priority outcome indicators
These indicators were agreed as part of the SR20 settlement to show performance against the priority outcome. Unless otherwise stated, metrics have been drawn from the sources referred to in the department’s 2021 to 2022 outcome delivery plan.
Percentage (%) of users satisfied with their most recent journey, England
| Journey mode | Users satisfied with journey in 2019 (%) | Users satisfied with journey in 2020 (%) | Users satisfied with journey in 2021 (%) |
|---|---|---|---|
| Strategic road network [footnote 3] | 81% | 79% | 67% |
| Bus[footnote 4] | 89% | N/A | N/A |
Percentage (%) of non-frequent bus services running on time, England
| 2018 to 2019 | 2019 to 2020 | 2020 to 2021 |
|---|---|---|
| 38% | 42% | 43% |
Percentage (%) of users very or fairly satisfied with their local roads, England
| 2018 to 2019 | 2019 to 2020 | 2020 to 2021 |
|---|---|---|
| 38% | 42% | 43% |
Percentage (%) of users very or fairly satisfied with provision in their local area, England (cycling, walking)
| Type | 2018 | 2019 | 2020 |
|---|---|---|---|
| Cycling | 27% | 29% | 25% |
| Walking | 67% | 68% | 78% |
Average (mean) delay on strategic roads (seconds per vehicle mile), England[footnote 5]
| 2019 | 2020 | 2021 |
|---|---|---|
| 9.5 | 7.3 | 8.5 |
Average (mean) delay on local roads (seconds per vehicle mile), England[footnote 6]
| 2019 | 2020 | 2021 |
|---|---|---|
| 44.0 | 33.9 | 46.1 |
Percentage (%) of rail journeys rated satisfactory, Great Britain[footnote 7]
| Overall satisfaction | 2017 | 2018 | 2019 |
|---|---|---|---|
| Journey | 81% | 79% | 82% |
| Station | 81% | 80% | 80% |
| Train | 77% | 76% | 78% |
Percentage (%) of trains running on time, Great Britain
| Month and year | Trains running on time (%) |
|---|---|
| June 2021 | 78% |
| September 2021 | 74% |
| December 2021 | 68% |
| March 2022 | 72% |
Number of people killed or seriously injured in reported road traffic collisions, by road user, Great Britain [footnote 8]
| Road user | Number of people killed or injured in 2019 | Number of people killed or injured in 2020 | Number of people killed or injured in 2021[footnote 9] |
|---|---|---|---|
| Pedestrians | 6,980 | 4,710 | 5,356 |
| Pedal cyclists | 4,332 | 4,461 | 4,462 |
| Motorcycle users | 6,086 | 4,786 | 5,491 |
| Car occupants | 12,047 | 8,958 | 10,280 |
| Bus and coach occupants | 344 | 163 | 203 |
| Goods vehicle occupants | 816 | 838 | 838 |
| Other vehicles | 269 | 317 | 670 |
| All road users | 30,874 | 24,087 | 27,300 |
Percentage (%) of local authority roads considered for maintenance, England
| Road category | 2018 to 2019 | 2019 to 2020 | 2020 to 2021 |
|---|---|---|---|
| A roads and motorways | 3% | 4% | 4% |
| B and C roads | 6% | 6% | 6% |
Number of trips per person per year, by main mode and disability status
| Age group | Disability status | Trips per person in 2018 | Trips per person in 2019 | Trips per person in 2020 |
|---|---|---|---|---|
| 16 to 64 years | With a disability | Not reported | 854 | 628 |
| 16 to 64 years | Without a disability | Not reported | 1026 | 817 |
| 65+ years | With a disability | Not reported | 642 | 519 |
| 65+ years | Without a disability | Not reported | 970 | 745 |
Reducing environmental impacts
Tackle climate change and improve air quality by decarbonising transport.
Priority outcome overview
Domestic transport generates the largest share of UK greenhouse gas emissions of any sector across the economy and stood at 23% in 2019. The department must deliver a step change in the breadth and scale of our ambitions and, to this end, in July 2021 it published the transport decarbonisation plan (TDP).
In order to reach net zero and deliver against our carbon budgets, the department will also continue to look internally at the whole life carbon impacts of our infrastructure projects.
Transport also has significant impacts on the natural environment. Sustainability is at the heart of levelling-up. People everywhere feel the benefits – villages, towns, cities and countryside will be cleaner, greener, healthier and more prosperous and pleasant environments in which to live and work.
The 25 year environment plan set out a vision to leave the environment in a better state than we found it. Achieving this will require significant action across all sectors of the UK economy, including transport.
The department’s progress towards a decarbonised transport system plays a vital role in delivering net zero across the wider economy by 2050. The department continued to engage with colleagues across local and central government, including the net zero lead Business, Energy and Industrial Strategy (BEIS) and nature lead the Department for Environment, Food and Rural Affairs (defra), to ensure decarbonisation and environmental strategies and policies are aligned.
Progress made by the department in 2021 to 2022 is summarised below.
Transport decarbonisation plan
Work continues across the department to decarbonise the transport sector and secure substantial co-benefits. Following several commitments on transport policy in the Prime Minister’s 10 point plan for a green industrial revolution, the most significant step this year was publication of the landmark TDP.
The TDP sets out a green print for the zero-emission transport future, identifying for the first time the clear steps and actions needed to clean up and decarbonise every form of transport.
In October 2021, BEIS published the Net zero strategy (NZS) with new commitments on the introduction of a zero-emission vehicle mandate for manufacturers of new cars and vans in the UK in 2024 and targets for sustainable aviation fuel (SAF).
Attention has now turned to delivery of the 78 commitments in the TDP to ensure the department meets the economy wide carbon reduction targets set out in legislation and the department’s NZS sector goals.
Delivery highlights:
- transport day at COP26 saw 30 countries and 6 of the world’s largest car manufacturers agreeing to deliver 100% zero emission vehicle sales by 2035 in developed markets, and by 2040 globally by signing the presidency declaration
Cars and vans decarbonisation
The government is committed to a successful transition of the UK fleet of road vehicles to fully zero emission vehicles, reducing emissions and improving air quality. The department will deliver the 2035 delivery plan, as well as design and implement a new regulatory framework that will ensure the net zero ambitions for road transport are enforced through legislation.
Delivery highlights:
-
published the Transitioning to zero emission cars and vans: 2035 delivery plan, which sets out investment and policy initiatives to deliver the end of sales dates for new non-zero emission cars and vans, including how the department will monitor progress. More than 395,000 battery-electric cars were registered in 2021, showing a growth of 92% on 2020
-
published the Green paper on a new road vehicle CO2 emissions regulatory framework consultation
-
E10 petrol (petrol with up to 10% ethanol) introduced as standard fuel in the UK
Aviation decarbonisation
The Jet Zero consultation set out the government’s vision for how the aviation sector can achieve net zero by:
- increasing the efficiency of the existing aviation system
- developing a UK SAF industry
- accelerating development of zero emission flight
- developing and utilising carbon markets and greenhouse gas removal methods helping consumers to make sustainable travel choices
It is clear that international action on aviation emissions is essential given the global nature of the sector. Alongside ambitious action domestically, the UK is fully committed to global action through international processes and will take a leading role in the work of international civil aviation organization (ICAO) to reduce emissions from international aviation.
Delivery highlights:
-
published the Jet Zero Consultation and SAF mandate consultation in July 2021
-
awarded £15 million to 8 projects to support the development of SAF in the UK and announced a further £180 million of new funding for SAF in October 2021
-
awarded funding for 15 projects to undertake research into the requirements of airports and airfields to handle zero emission aircraft
-
launched a new international aviation climate ambition coalition of states at COP26, representing over half of global aviation emissions, to show support for ICAO adopting a 1.5°C long-term goal at the 41st Assembly in 2022
Maritime decarbonisation
The government is committed to supporting decarbonisation in the domestic maritime sector, through the development and deployment of innovative zero emission technology and infrastructure solutions. This will enable significant fleet-wide emissions reduction in the 2030s and net zero shipping by 2050.
In September 2021, the department announced the winners of a £23 million Clean maritime demonstration competition, which will lay the foundations for a network of technology demonstrations and support a multi-year competition to be launched in 2022 to 2023 as part of the department’s programme of investment under UK shipping office for reducing emissions (SHORE).
Delivery highlights:
-
published a Call for evidence on onshore power in February 2022, delivering the department’s TDP commitment to consult on how government can best support the uptake of shore power in the UK
-
the department secured a coalition of 22 state signatories to the COP26 Clydebank declaration to work together to develop green shipping corridors and launched operation zero, an industry coalition, convened by the department, to accelerate the decarbonisation of operation and maintenance vessels in the North Sea offshore wind sector
Heavy goods vehicle (HGV) decarbonisation
The government is committed to decarbonising road freight and transitioning to a net zero future. The department is removing barriers to the uptake of zero emission HGVs by providing purchase incentives and designing new regulation to increase their uptake. These actions will ensure reductions in carbon emissions, improve air quality, and create new jobs across the UK.
The department will support industry to meet the phase out dates for the end of sale of new non-zero emission HGVs by 2040 (HGVs under 26 tonnes by 2035), by undertaking at-scale trails of zero emission HGV technologies, developing an evidence base for future infrastructure decisions, and giving the confidence needed for investment in zero emission technologies.
Delivery highlights:
-
as part of the zero-emission road freight demonstrator programme, the department funded 6 feasibility studies for potential future years trials of hydrogen fuel cell and electric road systems and are committed to expand this work at scale on road demonstrations. The department supported the deployment of UK-built 19t battery electric HGVs
-
confirmed end of sales dates for new, non-zero emission HGVs in the UK following public consultation and committed to consulting with industry in 2022 to identify suitable derogations for HGVs below 26 tonnes that need further time to transition
-
the plug-in truck grant will continue to encourage the uptake of zero-emission HGVs by reducing the purchase price of zero-emission commercial vehicles
Electric vehicle charging infrastructure
The government is committed to accelerating the rollout and improving access to convenient, affordable, and reliable charging infrastructure for cars and vans. Between 2020 and the end of 2021, close to 7,500 charge points were added to the UK network.
The department will continue to invest over £1.3 billion to accelerate the roll out of infrastructure, targeting support on rapid chargepoints on motorways and major roads, as well as on-street chargepoints near homes and workplaces to make charging reliable and easy.
To ensure the private sector can expand the charging network at pace in the 2020s, the government will continue to invest a total of £950 million in future proofing grid capacity along the SRN for zero emission cars and vans ahead of need.
Delivery highlights:
-
awarded £20 million funding for collaborative R&D projects that will advance innovative zero emission vehicle and infrastructure technologies in the UK
-
in December 2021, the government introduced legislation which requires new residential and non-residential buildings to have a changepoint or cable routes where there is associated parking. This will lead to the installation of up to 145,000 new changepoints across England every year
-
confirmed the introduction of new rules that will increase confidence in electric vehicle (EV) charging infrastructure by mandating new standards to ensure reliable charging for EV drivers, ensuring that consumers are able to find the chargepoints through open data, and that consumers will be able to easily compare costs across networks which will be in a recognisable format similar to pence per litre for fuel
-
in November 2021 the Prime Minister announced that the government will mandate a minimum payment method, such as contactless (note the distinction not mandating the actual payment method) at new chargepoints over 7.1 kW
Green public transport, cycling and walking
The government is committed to the green transformation of the bus and coach sectors, whilst maintaining a high standard of public service, supporting modal shift to active transport, increasing cycling and walking and making the roads safer for all vulnerable road users. The benefits of these measures will include delivering health benefits, reducing congestion on roads and improving air quality.
To deliver these benefits, the department set out to deliver the Bus back better: national bus strategy for England, which sets out the vision and opportunity to deliver a green bus revolution, and the zero emission buses regional area (ZEBRA) scheme, allowing LTAs to bid for funding to purchase zero-emission buses and associated infrastructure.
The department has made good progress delivering commitments in the 2020 gear change strategy, including towards setting up Active Travel England (ATE) as a new executive agency.
ATE will be responsible for driving up the standards of cycling and walking infrastructure and managing the national active travel budget, awarding funding for projects that meet the new national standards set out in 2020. It will also be a statutory consultee on major planning applications to ensure new developments properly cater for pedestrians and cyclists.
Delivery highlights:
-
Gear change: One year on document published in July 2021, setting out progress delivering the commitments in the Prime Minister’s plan
-
ZEBRA scheme competition launched, worth up to £270 million to help LTAs introduce zero-emission buses, cut carbon emissions from local public transport, and improve air quality
-
five areas received funding from the fast-track ZEBRA round, standard track recipients were chosen at the end of March 2022
-
first 130 zero emission buses (ZEBs) for Coventry: all electric bus city have been ordered, out of the total c.300
-
initial consultation ran on Ending the sale of new diesel buses – the department will shortly launch a second consultation seeking views on the appropriate timescale
-
published BSIP guidance in May 2021 to ensure buses are attractive for passengers to support modal shift away from more carbon intensive forms of transport. 100% of LAs submitted BSIP by 31 October 2021 deadline
-
confirmation that ATE will be an executive agency
Reduce environmental impacts: Priority outcome indicators
These indicators were agreed as part of the SR20 settlement to show performance against the priority outcome. Unless otherwise stated, metrics have been drawn from the sources referred to in the department’s 2021 to 2022 outcome delivery plan.
Greenhouse gas emissions from domestic transport, including HGVs (million tonnes of CO2 equivalent), UK
| 2019 | 2020 | 2021 |
|---|---|---|
| 122.2 | 98.80 | 107.50 |
New registrations of zero and ultra-low emission vehicles, proportion of new registrations, UK (%) – zero emission vehicles
| March 2021 | June 2021 | September 2021 | December 2021 | March 2022 |
|---|---|---|---|---|
| 9% | 6% | 8% | 11% | 16% |
New registrations of zero and ultra-low emission vehicles, proportion of new registrations, UK (%) – ultra low emission vehicles
| March 2021 | June 2021 | September 2021 | December 2021 | March 2022 |
|---|---|---|---|---|
| 14% | 11% | 13% | 17% | 23% |
Average (mean) number of cycling trips as proportion of total trips, England (%)
| 2018 | 2019 | 2020 |
|---|---|---|
| 2% | 2% | 3% |
Total number of cycling stages, England
| 2018 | 2019 | 2020 |
|---|---|---|
| 1006 | 964 | 1196 |
Average (mean) number of walking trips as proportion of total trips, England (%)
| 2018 | 2019 | 2020 |
|---|---|---|
| 27% | 26% | 32% |
Average (mean) annual number of walking stages per person, England
| 2018 | 2019 | 2020 |
|---|---|---|
| 347 | 332 | 281 |
Increasing our global impact
Boosting our influence as a leading trading nation, and seizing the opportunities presented by Brexit to strengthen ties with countries around the world.
Priority outcome overview
Increasing our global Impact ensures that transport plays a significant role in the government’s vision for a global Britain, making the most of the UK’s status as a fully sovereign, trading nation.
This new position on the world stage offers benefits and opportunities as well as risks. The priority assists the department in maintaining and extending its influence with international partners, including ensuring high standards of transport safety, security, and environmental protection to boost UK trade, exports and inward investment.
This priority outcome aims to:
-
reinvigorate international transport cooperation by collaborating with others to address global challenges and support the UK’s domestic transportation priorities through international engagement
-
maintaining the country’s global supply chains
-
enable exports and inward investment to benefit the UK transport sector and to grow and level up the economy
-
enhance our global leadership in tackling transport’s contribution to climate change by reducing carbon emissions
-
continue to lead the UK’s international transport relationships, including efforts to liberalise air services with other countries, and ensure the highest levels of safety and security in aviation, maritime, and other international modes of transportation
-
enable UK innovators to be the best and engage fully with the international transport sector, building-in and adopting a risk appetite in our work and enabling and promoting innovation through our procurement approach and collaboration with international partners
-
support the UK’s goal of becoming a science superpower by 2030, with transport serving as a hub for the development of internationally exportable science skills, research, and information
Increasing our global impact will also act as an enabler for the department’s other strategic priorities.
Progress made by the department in 2021 to 2022 is summarised below.
Impact of the new relationship with the EU for 2021 to 2022
The UK’s relationship with the EU – its institutions and member states – continues to be important and is now governed by the withdrawal agreement (WA) and the UK and EU trade and cooperation agreement (TCA). The FCDO has overall responsibility for UK and EU relations.
The TCA provides the legal basis for air, road freight and road passenger transport operations between the UK and EU. Ensuring effective implementation of the department’s responsibilities under the TCA, as well as handling issues under the WA and completion of the department’s EU transition portfolio have been main elements of the department’s EU work during 2021 to 2022.
Delivery highlights:
-
providing effective governance of the department’s responsibilities under the TCA and the WA
-
co-chairing 3 specialised committees under the TCA - air transport, aviation safety, and road transport
-
publishing 4 transport-related frameworks, setting out decision-making and dispute resolution mechanisms to manage the possibility of divergent approaches between the UK and Devolved Administrations where powers have returned from the EU
-
supporting the government’s regulatory reform agenda
-
successful delivery of a provisional GB vehicle approval scheme by the vehicle certification agency (VCA), and the development of a full scheme
-
continued investment into future skills by VCA in the connected and autonomous vehicle area, to underpin the development of the GB connected and automated vehicles: process for assuring safety and security (CAVPASS) scheme
Ensuring policy decisions are taken with a full understanding of the department’s commitments under the TCA and WA, and the associated risks and opportunities, will remain a priority.
Moving forward, the focus will be centred around action, diplomacy and outreach with European partners to deliver the department’s priority outcomes.
Policy and diplomacy engagement
International ministerial engagement plan.
At important global events, the department had opportunities to exhibit soft power and promote UK transport leadership and innovation through participation in international events such as conferences and exhibitions.
For example, at London international shipping week 2021, the leading maritime sector event, the ministers met with VIP delegates and high-level government and industry leaders across all sectors of the international shipping industry to promote HMG’s work to a global audience and encourage global trade, exports, and investment.
Delivery highlights:
-
Minister Harrison’s visit to Los Angeles, USA in November as part of her attendance at a major international conference on the future of mobility – CoMotion
-
overseas territories transport day in January enabled the department to engage with representatives from the UK’s overseas territories on how the department could support them, including in delivering their international obligations
-
the department prepared for the UK’s 2022 to 2023 presidency of the international transport forum (ITF), an Organisation for Economic Co-operation and Development (OECD)-hosted global think tank for transport policy. We assumed the Presidency at the ITF summit in Leipzig in June 2022. The Secretary of State attended the summit in person and took part in a series of engagements to promote the UK Presidency
Prosperity
Free trade agreements (FTA), trade policy, and exports and investment work.
The department pursued a wide spectrum of ministerially approved prioritised objectives in FTA negotiations related to transport services. These directly supported the UK government’s economic growth objectives and also achieved wider political goals, for example influencing other countries’ policies on climate change.
The department promoted trade opportunities for UK transport companies to export and encouraged foreign direct investment to support UK transport objectives.
Delivery highlights:
-
the department participated in the Department for International Trade (DIT) led global investment summit held on 18 to 20 October 2021. Aimed at galvanizing foreign investment in UK green industries, ministers met with global investors to discuss investment opportunities in the UK’s net zero transport priorities
-
in October 2021, the department hosted a ministerial roundtable with industry representatives from the UK connected and automated mobility (CAM) sector to discuss barriers and opportunities to exports and inward investment, in a sector projected to be worth £42 billion for the UK by 2035
Crossrail international continues to create export opportunities for the UK supply chain. Crossrail international’s current work on the Tel Aviv metro, a £33 billion underground network, featured as a case study in the HMG exports strategy in November 2021.
Crossrail international’s role on the development of UK-Israeli relations in the infrastructure sector will lead to further opportunities for other UK suppliers to enter the market.
Capability
To support the international trade profession, raise international awareness and deliver DfT’s international capability lighthouse project.
DfT aims to strengthen its capability through its people, systems, and processes to work effectively internationally. The department defines international capability as being the skills and knowledge that the staff need to help them work effectively internationally.
To support this, the department developed a bespoke international prospectus which outlines the international trade profession standards and the learning and development offer available across government to support colleagues.
The provision of wider international learning and developmental opportunities are supported by the department’s international capability fund, and the department is working with OGD’s to co-ordinate its international capability work and share best practice and resources.
Delivery highlights:
-
the department has approved plans to develop the international capability lighthouse project which aims to identify and address gaps in international capability across the department
-
the department actively promoted the international learning and development prospectus, which supports the capability workstream and is contributing to best practice across Whitehall
Be an excellent department
Being a well-run department that looks to improve how it operates and where people feel well supported and enjoy working.
Priority outcome overview
Distinct from the other priority outcomes, ‘be an excellent department’ is an area everyone within the organisation should be able to easily relate their work and activity to, and it sits at the centre of everything we do. It is about challenging ourselves to think about how we continue to be the best that we can be.
As well as doing our work in an efficient and effective way, it is also about how we can bring innovation into our work and continuously improve on the work that we do.
By delivering this priority outcome we can help to enable the delivery of the department’s other priority outcomes.
The department set the vision for ‘Being a well-run department that looks to improve how it operates and where people feel supported and enjoy working.’
Progress made by the department in 2021 to 2022 is summarised below.
Great people: Workforce, skills, and location
At the heart of DfTc’s priority to be an excellent department is the ambition to have a highly professional, skilled, diverse, and motivated workforce. The department has focussed on building skills and capability at all levels of the organisation.
A 3-year skills and capability plan is under development to ensure that DfTc can develop the skills it needs to deliver all its strategic priorities into the future. The plan will also demonstrate fulfilling development opportunities available to staff across the organisation to encourage our talented people to build their careers and achieve their potential.
Throughout this, there is a strong focus on leadership and management of change, building core skills as well as developing professional capability including project delivery and commercial skills.
The future DfTc programme is driving the efforts to build a more flexible workforce, transforming both where and how we work, opening new permanent offices in Birmingham and Leeds and launching initiatives to drive recruitment outside of London and policies to support voluntary relocation of existing staff.
DfTc has committed to 681 roles in Leeds and Birmingham and 7 in Edinburgh by 2025, including 41 SCS roles.
In 2021 to 2022 DfTc added a further 180 roles to Birmingham and Leeds, meaning over 280 roles, including 9 Senior Civil Service roles, were based there by the end of the year. Ministers have spent time at and worked from both the Birmingham and Leeds offices.
In line with the government’s COVID-19 roadmap for England, and the Welsh government’s law and guidance for Wales, a rigorous return to office programme, focussed on a safe and positive return, was rolled out. A new group HR policy to support hybrid working across the department is now in place supporting our smarter working agenda.
Building an inclusive and more diverse workforce continues to be a priority for the department. Our 2022 to 2025 diversity, inclusion and wellbeing strategy is in development and will be published in the autumn.
The strategy will be supported by annual action plans for the central department and each executive agency. A new inclusion and wellbeing dashboard, accessible to all staff has been created to increase transparency and accountability by allowing everyone to see the current diversity profile of the department.
The DfTc’s career development programme ascend launched 3 cohorts for staff from ethnic minority backgrounds and /or those with disabilities to provide support with future career development and progression.
The DfTc’s people survey engagement score in 2021 was 68% (2% above the Civil Service benchmark) – an increase of 1%. Four out of 5 engagement questions also saw an increase of between 1 to 3% points.
New ideas: Innovation, technology and data
The department’s continued focus on improving digital and cyber security has enabled the department to become a 100% cloud-hosted organisation. This provides a step-change in our resilience, and the use of cloud technology has also enabled the department to deliver digital services in-house, deploying them rapidly and to scale appropriately for use by users.
The department has made significant progress on a number of key services to support the department’s strategic outcomes. For example, the rollout of a new digital service to facilitate application for financial support for bus service operators during the pandemic.
Feedback shows the new service has made it simpler and easier for users, whilst also enhancing the assurance, audit, fraud, and error approach for the scheme.
As a provider of in-house digital technology, the department has maintained a high score for the people survey’s workplace technology question across Whitehall, with 87% of staff saying they are provided with the technology to easily connect and collaborate with each other and to be effective in their role.
The department’s ongoing investment in digital, data and technology services has continued to support effective working away from the office throughout 2021 to 2022. The department has been able to sustain its core business with ease, while securely accessing all the tools, applications and data required to carry out its roles efficiently and effectively.
Equipping colleagues with digital tools to support hybrid working across multiple locations continues to be an important part of how we work. In 2021 to 2022 that provision was extended to hundreds of new colleagues joining our new Birmingham and Leeds locations.
Sustainability
Sustainability underpins all our work across the department; not only in setting national transport policy to tackle climate change, but also in how we operate as a department.
In November, we published the department’s Operational sustainability strategy 2021 to 2025, which sets out the actions we will take as a department to improve our sustainable performance and achieve our greening government commitments (GGCs) by 2025.
The department also undertook a number of significant activities towards delivering this strategy:
-
setting a clear governance framework for internal reporting and accountability against the GGCs across our public bodies
-
replacing 137 diesel and petrol cars in 2021 to 2022 with hybrid or electric alternatives, bringing our car fleet to 26% ultra low emission vehicles (ULEV)
-
undertaking net zero carbon benchmarking of 40% of our building estate, which has identified future decarbonisation opportunities and will advise strategic property decisions
-
launching a carbon literacy training programme to increase staff awareness and capability on carbon
The department’s total emissions for 2021 to 2022 have reduced by 10.7% from last year, which is 26.6% down from a 2017 to 2018 baseline. This puts us on track to meet the department’s carbon target for 2024 to 2025.
Full details of the department’s sustainability performance are provided in DfT’s sustainability report.
Better outcomes: Shareholding and corporate sponsorship
As part of the department’s commitment to promoting good governance, it worked closely with its public bodies to oversee and drive performance against key departmental priorities; and to ensure effective governance, controls and risk management were in place.
Work with ministers to provide clear objectives for public bodies
The department is prioritising reviews across its key delivery bodies as part of the Cabinet Office public bodies review programme. Framework documents for 2 important delivery bodies are being updated, as part of a successful Cabinet Office pilot and roll-out, which provide greater clarity on accountabilities and relationships between the department and those organisations.
Refreshed guidance for Chair letters and objective setting, aligned to the department’s top priorities has been rolled out.
Support robust ongoing relationships between ministers and the organisations
A new sponsorship code has been co-developed with Cabinet Office, alongside an enhanced set of departmental gold standards for sponsorship, which clarifies the shareholder role and the relationships which underpin successful sponsorship.
DfT will be assessing itself against these standards to ensure that it is supporting its public bodies to effectively and efficiently deliver services, functions and ministerial priorities.
Ensure public body boards are capable and diverse
There has been a continued focus on strengthening boards and leadership of public bodies, with important non-executive and executive appointments across the department’s delivery bodies.
The HS2 Ltd Chair appointment process was not concluded within the planned timeframe, but the department has robust interim arrangements to ensure the Board continues to function effectively until the position is filled.
Work with public bodies to ensure effective governance, controls, and risk management
The department has worked internally to promote continuous improvement in shareholder sponsorship across the department and worked with Cabinet Office and HM Treasury to shape emerging central guidance on good governance of public bodies. This will continue in 2022 to 2023, alongside further work on the successful implementation of GBR.
Science, innovation and technology
The government is committed to growing the investment in, and impact of, science and technology in the UK, maintaining and enhancing the UK’s position as a global science superpower.
Science, innovation and technology are crucial to achieving the department’s priority outcomes. In 2021 a new chief scientific adviser joined the department, who helped make the case for, and will steer the delivery of, the marked uplift in the department’s research and development budget: the 2021 spending review saw the R&D budget rise to £575 million over the next 3 years.
Delivery highlights
-
delivered a series of pilots and trials as the foundation for the ongoing portfolio of decarbonisation research and development, notably the:
-
continued to prioritise innovation, supporting a wide range of innovation initiatives, including:
- running the transport research and innovation board (TRIB), which brings together the UK’s transport research and development funders
- our largest ever transport research and innovation grant (TRIG) competition
- parallel competitions focused on drones and accessibility
- another successful year of our First of a Kind rail innovation competition
-
updated and refreshed the membership of our Science advisory council to ensure we have access to the right skills, expertise and perspectives to meet our priority outcomes and the challenges ahead
Further information on science, engineering, innovation and technology in the department can be found in the DfT’s science plan.
Our research priorities can be found in our Areas of research interest.
Sustainability report
UN sustainable development goals
The 2030 agenda for sustainable development is a historic global agreement which aims to eradicate extreme poverty, fight inequality and injustice, and leave no one behind. It was agreed by world leaders at the UN in 2015.
The UK is committed to the delivery of the sustainable development goals (SDGs) and the department is working towards directly contributing to the achievement of the following goals.
Good health and well-being (SDG3)
Ensure healthy lives and promote well-being for all at all ages.
Quality education (SDG 4)
Ensure inclusive and equitable quality education and promote lifelong learning opportunities for all.
Decent work and economic growth (SDG 8)
Promote sustained, inclusive and sustainable economic growth, full and productive employment and decent work for all.
Industry, innovation, and infrastructure (SDG 9)
Build resilient infrastructure, promote inclusive and sustainable industrialization and foster innovation.
Sustainable cities and communities (SDG 11)
Make cities and human settlements inclusive, safe, resilient, and sustainable.
Climate action (SDG 13)
Take urgent action to combat climate change and its impacts.
DfT activities to support the delivery of the SDGs
Good health and well-being
The department published the TDP, which sets out the commitments and the actions needed to decarbonise the entire transport system in the UK. Alongside this, 2 consultation documents were published:
-
Transitioning to zero emission cars and vans: 2035 delivery plan, which sets out significant milestones towards the phase out dates for petrol and diesel cars and vans
-
Green paper on a new road vehicle CO2 emissions regulatory framework for the UK to ensure that we have the legislation necessary to deliver the 2030 and 2035 phase out targets
The department has also published the transport chapter as part of BEIS Net Zero strategy, which included our intention to introduce a new zero emission vehicle mandate, setting targets for a % of manufacturers’ new car and van sales to be zero emission each year from 2024.
The department also established the Jet Zero council, bringing together industry and government. The council members include senior leaders in aviation, aerospace and academia and will consider new technologies and innovative ways to cut aviation emissions, with aim to deliver zero-emission flight across the Atlantic within a generation. The Jet Zero consultation (JZC) was also published in July 2021.
The consultation focused on the rapid development of technologies in a way that maintains the benefits of air travel and maximises the opportunities that decarbonisation can bring to the UK.
Quality education
As part of the department’s carbon management programme, the department is seeking to develop staff knowledge and understanding of decarbonisation and the environmental challenges. The department is now supporting public bodies and other departments to develop and roll-out training.
Decent work and economic growth
Decarbonising transport should lead to the creation of green jobs across the automotive, public transport, cycling, and green aviation and maritime sectors. The department expects to see progress in key areas – for example as supply chains for green buses and cycle gear and infrastructure develop.
The department continues to undertake a programme of work to better understand, define and monitor green jobs in transport, internally through the transport employment and skills taskforce, and supporting BEIS’s green skills mapping. This workstream aims to standardise the defining and reporting of green jobs across the department, in line with OGDs.
Build resilient infrastructure
The department has focused on meeting this sustainable development goal in 2 ways:
- reducing the whole life carbon (WLC) of infrastructure projects
- delivering a resilient transport system in the future
In reducing the WLC of infrastructure projects, the department supports efforts in meeting carbon budgets and reducing the impact on the environment.
By February 2022, the department delivered a major milestone in ensuring that all tier one projects or projects with estimated WLC impact of 1 MtCO2e would include WLC impacts at all major business case stages, and monitor this against actual figures during construction and operation. The framework for managing WLC is being applied by the public bodies and any tier 1 project reaching a major business case stage will include WLC impacts.
Internally, the department has improved focus on climate change resilience increased senior focus. Going forward, the department will create a transport system resilient to the impacts of climate change.
Sustainable cities and communities
The joint air quality unit continued to support LAs to develop and implement measures to address their NO2 exceedances, which included introducing 2 new clean air zones in Bath and Birmingham in June 2021.
Also, in June 2021, the department delivered a minimum viable product for a central digital infrastructure system, including vehicle checker and payments delivered, ready to be integrated with the local authority systems for launches.
The department also continued to deliver the zero emission bus regional areas (ZEBRA) scheme, announced by the Prime Minister in February 2020. In July 2021, the fepartment announced that a further 17 LTAs were selected under the standard process to progress to phase 2 of the competition.
The fepartment announced that funding worth almost £71 million was awarded to the first 5 LTAs selected under the fast-track process in October 2021. This scheme will provide support for LTAs, outside London, to introduce zero-emission buses, improving the air quality in our towns and cities.
Climate action
The department continued to hold sessions for staff to improve the environmental capability in the department.
The department continued to monitor and support with the development of the Environment Bill (now the Environment Act 2021), supporting with a write round from Defra on public authority biodiversity reporting duties, and remained informed to any stretching targets and their potential impact on the department.
Work began on addressing how the department:
- embedded the environment bill into the department’s work
- ensured the department could respond to the new governance
- developed plans to meet new environmental targets and biodiversity requirements
- prepared a biodiversity net gain action plan
Maintaining and enhancing biodiversity is a key consideration for the department when designing and building new transport infrastructure. For example, in 2013 HS2 Ltd committed to achieving no net loss in biodiversity across phases one and 2a of the new railway. In 2021, DfT committed in the planning for phase 2b, to aim for a biodiversity net gain.
Climate change adaptation
The department continues its efforts in climate change adaptation, ensuring the transport system is responsive to the impacts of climate change, including those that it is already experiencing, and future impacts.
Actions in response to climate change risks are primarily taken by transport infrastructure operators, many of whom, including Network Rail, National Highways, airport and port operators, continue to build adaptation into their strategic planning.
Network Rail and National Highways were assessed highly for their adaptation plans by the climate change committee in the 2021 report to Parliament, however it was noted that continued action was required to mitigate the risks. Both organisations assessed their business for climate risk and published reports under the third round of the adaptation reporting power.
Sadly, extreme weather caused a fatal train derailment at Stonehaven (Carmont) in August 2020, leading to the deaths of 3 people. Following this, Network Rail commissioned 2 independent reports, by Lord Robert Mair and Dame Julia Slingo, into how the resilience of rail infrastructure to extreme weather conditions can be improved.
Lord Mair’s report on earthworks management and Dame Julia’s report on weather advice, published in March 2021, jointly contained nearly 60 recommendations. Network Rail has developed a set of 19 action plans aimed at implementing all the recommendations. Progress of the action plans will be tracked through a national assurance database, which will feed into a high-level dashboard report.
Network Rail delivered its third Adaptation Reporting Power submission in December 2021 which outlines how it intends to develop its capability on resilience and the actions it will take to improve weather and climate resilience.
Network Rail also developed a weather resilience and climate change adaptation strategy which has helped improve governance, knowledge, and practices. Looking to the longer-term, adaptation is now a core priority within Network Rail’s environmental sustainability strategy which outlines its adaptation roadmap, containing significant adaptation milestones up until 2050 and how it plans to achieve them.
Network Rail is an important stakeholder in the development of the 30-year whole industry strategic plan which will recognise that addressing weather resilience and adapting to the future climate is integral to the long-term sustainability of the railway.
The department continues to work with partners and across government to fulfil the legal obligation to address the transport-related risks identified in the third climate change risk assessment and set out mitigating actions in the third national adaption plan, due to be published in 2023.
Acknowledging the risk that climate change poses to the transport network and building on the work of the infrastructure operators and our NAP3 contribution, the department is developing an internal transport adaptation strategy.
The strategy will bring together ongoing work with industry and operators, and will explore expectations, inter-dependencies, standards, and scenario planning.
Rural proofing
The department understands that the transport needs of communities in rural areas differ from those in urban environments for a variety of reasons, which include demographics, lower population density and greater distances to travel.
The department’s appraisal system is consistent with DEFRA’s national rural proofing guidelines, ensuring that policy makers address the needs of rural areas throughout the policy cycle.
Delivery highlights:
-
demand responsive transport trials in Hertfordshire, Cheshire East and North Lincolnshire are among several to have launched, with funding through the department’s £20 million rural mobility fund
-
Defra will work with the department on a new co-chaired rural roads working group on road safety. This will also include highways authorities with the aim to reduce road traffic collisions on rural roads
-
the department awarded over £850,000 to Cornwall council in 2021 to 2022 to deliver the Cornwall e-cycle pilot
-
Cornwall council was awarded £23.5 million to undertake a 4-year bus fares pilot scheme to determine whether better value fares and a simplified fares structure would encourage more people to use the bus
-
the department provided sustrans with £30 million in 2021 to 2022 for the national cycle network to deliver a variety of improvements which will support a number of rural communities
-
development of the future of transport rural strategy is underway with the aim to deliver the strategy in 2022. This will explore how transport innovation and interventions can tackle rural mobility issues, improve connectivity and accessibility, increase low carbon travel options and deliver more integrated transport services
-
the department’s tackling loneliness with transport project will award a total of £5 million in grant funds to local authorities and charities in 2022 to support innovative pilots to tackle loneliness through transport and increase the knowledge base in this area. Successful delivery partners will launch their pilots across England, including rural areas
Sustainable development
Alongside the department’s work to deliver a more sustainable transport system, it also recognises the environmental impact that our own estate and business operations can have, and we work to ensure these are managed in an equally sustainable way.
The department is part of the government greening commitments (GGCs), which provide the structure and standard of sustainability performance for all government departments to achieve. A new phase of GGC targets for 2021 to 2025 were published by Defra.
The department reports its performance against the GGC targets quarterly to Defra, who produce a cross-government annual report. The data provided to Defra and outlined below covers the operations of the department, it’s 4 executive agencies and 8 public bodies.
More detail on the activities of individual organisations to improve their own sustainable performance can be found in their individual annual report and accounts.
In November, the department published the operational sustainability strategy 2021 to 2025, setting out the actions the department will take to meet the GGCs by 2025 and providing an indicative pathway to net zero by 2050.
Information and communications technology (ICT)
The department has taken steps to reduce its greenhouse gas emissions associated with digital services by transforming its data estate and moving its operations fully to the cloud. This has allowed us to benefit from the significant improvements in energy efficiency being achieved by the large cloud providers.
Prior to the pandemic, the department had moved its user base to portable devices allowing them to work effectively from any location. The department has a ‘hybrid’ working policy that blends the benefits of office-working with the efficiencies of homeworking, which we support by equipping our users and offices with the technology required to work effectively from any location.
The department has worked to improve the management of ICT resources and waste to ensure that no ICT waste goes to landfill. All digital contracts that the department signed in 2021 to 2022 are waste electrical and electronic equipment regulations compliant. At the end of use, all ICT devices are sent back to suppliers for reuse, refurbishment, or recycling.
Summary of performance
2021 to 20122 performance shows the department is on track to meet 8 of our 9 quantitative GGC targets (Table 1).
Table 1: Performance against the GGCs
| Theme | Measure | 2017 to 2018 baseline | 2024 to 2025 target | 2021 to 2022 target | 2021 to 2022 actual performance | |
|---|---|---|---|---|---|---|
| Mitigating climate change | Total emissions (tCO2e) | 412,459 | 156,734 (-62%) | 266,331 (-35%) | 265,132 (-36%) | |
| Direct emissions (tCO2e) | 37,948 | 30,738 (-19%) | 33,828 (-11%) | 29,232 (-23%) | ||
| ULEV cars (% car fleet) | n/a | 25% (Dec 2022) | 24% | 25% | ||
| Domestic Flights (tCO2e) | 867 | 607 (-30%) | 718 (-17%) | 243 (-72%) | ||
| Minimising waste | Total waste (tonnes) | 795,249 | 675,962 (-15%) | 727,085 (-9%) | 1,007,326 (+27%) | |
| Waste to landfill (%) | 7% | less than 5% | 6% | 0.01% | ||
| Waste recycled (%) | 91% | more than 70% | 70% | 99% | ||
| Paper use (reams) | 255,431 | 127,716 (-50%) | 182,451 (-29%) | 68,759 (-73%) | ||
| Reducing water use | Water use (m3) | 2,219,366 | 2,041,817 (-8%) | 2,117,910 (-5%) | 1,349,664 (-39%) |
The department’s performance has continued to be impacted by the coronavirus pandemic and the resultant changes to working patterns across all organisations. Increased remote working has led to significant reductions in paper use, water use and domestic flights, seeing us exceed our target trajectory in all 3 areas. We hope to maintain these low levels to 2024 to 2025 through sustained behaviour changes and staff awareness campaigns.
The department’s overall and direct emissions, however, have not seen as large a reduction as we have kept sites open throughout the year and have increased fleet travel due to staff being advised to travel separately rather than car sharing as would be usual practice.
DfT hopes to return to usual practice and bring down fleet emissions in 2022 to 2023 following the removal of social distancing guidance and with the ever-increasing electrification of our fleet.
Network Rail produces large volumes of industrial waste from maintenance of the railway. These volumes fluctuate depending on the scale of works required each year so is not within the department’s direct control and has increased from its baseline.
Network Rail do, however, ensure waste is recycled and diverted from landfill wherever possible so the department is exceeding targets in both these areas.
A full breakdown of the department’s sustainability metrics is provided in the following tables.
The organisations in scope of sustainability reporting have been updated in line with the latest phase of GGCs - those included now are:
- DfTc
- DVSA
- DVLA
- British Transport Police
- Vehicle Certification Agency
- High Speed 2 Ltd
- Maritime and Coastguard Agency
- National Highways
- Network Rail
- East West Rail
- Northern Lighthouse Board
- Trinity House
- Office of Rail and Road
Therefore, figures provided in the tables below will differ to those included in previous annual reports and accounts. Further information can be found in the public bodies own annual reports and accounts.
Table 2: Greenhouse gas emissions
| Greenhouse gas emissions | 2018 to 2019 | 2019 to 2020 | 2021 to 2022 | |||
|---|---|---|---|---|---|---|
| Gross emissions (tonnes CO2e)25 | Scope 1: direct emissions | 109,005 | 103,720 | 110,046 | 98,791 | |
| Scope 2: energy indirect emissions | 217,178 | 183,186 | 168,476 | 146,225 | ||
| Scope 3: business travel emissions | 35,042 | 29,994 | 18,256 | 20,116 (*) | ||
| Total emissions | 361,224 | 316,900 | 296,778 | 265,132 | ||
| Related energy consumption (kWh) | Office grid electricity | 75,874,324 | 69,970,643 | 65,570,660 | 69,984,658 (*) | |
| Non-office grid electricity | 691,348,257 | 646,721,001 | 657,066,891 | 651,079,042 | ||
| Renewable electricity | 30,608 | 30,867 | 28,226 | 30,103 | ||
| Gas | 108,552,513 | 109,880,602 | 94,342,680 | 133,619,370 (*) | ||
| Other heating | 36,857,576 | 36,260,045 | 36,984,860 | 27,157,129 | ||
| Related business travel | Fleet road travel (litres of fuel) | 9,351,575 | 6,049,015 | 6,193,811 | 20,711,353 (**) | |
| Fleet road travel (km) | 224,178,160 | 247,770,528 | 297,826,976 | 39,709,470 (**) | ||
| Non-fleet road travel (km) | 54,077,381 | 47,090,685 | 19,303,054 | 35,016,912 | ||
| Public transport (km) | 123,047,582 | 117,161,164 | 884,943 | 13,384,912 (*) | ||
| Domestic flights (km) | 6,161,778 | 6,101,606 | 252,321 | 1,867,071 (*) | ||
| Financial indicators | Energy expenditure | £490,194,041 | £543,237,838 | £494,666,555 | £558,404,402 | |
| Business travel expenditure | £44,521,774 | £44,777,322 | £7,090,490 | £19,278,238 |
(*) Increases are due to more staff returning to offices and more face-to-face activities being undertaken.
(**) Fluctuations as Network Rail have moved to reporting fuel use rather than kilometres travelled.
Table 3: Waste minimisation and management
| Non-financial and financial indicator | Waste | 2017 to 2018 | 2018 to 2019 | 2019 to 2020 | 2020 to 2021 | |
|---|---|---|---|---|---|---|
| Non-financial indicators | Total waste generated | 794,910 | 1,072,035 | 1,025,083 | 1,007,326 | |
| Waste sent to landfill | 57,154 | 8,043 | 3,330 | 103 (*) | ||
| Waste recycled | 724,875 | 1,053,494 | 1,008,080 | 996,396 | ||
| Waste incinerated | 12,882 | 10,498 | 13,672 | 10,827 | ||
| Financial Indicators | Expenditure on waste | n/a | n/a | n/a | n/a (**) |
(*) Waste to landfill reduction is as a result of Network Rail having undertaken a waste audit and diverted waste to other waste streams.
(**) This is not available as waste services are provided as part of a total facilities management contract, so specific spend on waste only is not able to be separated out.
Table 4: Finite resource consumption
| Non-financial and financial indicator | Finite resources | 2017 to 2018 | 2018 to 2019 | 2019 to 2020 | 2020 to 2021 | |
|---|---|---|---|---|---|---|
| Non-financial indicators | Total water consumption (m3) | 2,240,145 | 1,360,739 | 1,349,664 | ||
| Office-only water consumption (m3) | 311,511 | 275,675 | 190,709 | 234,496 | ||
| Office water use per head | 11.12 | 9.73 | 6.73 | 8.11 | ||
| Paper use (reams A4 equivalent) | 259,281 | 239,229 | 158,720 | 68,759 | ||
| Financial indicators | Expenditure on water | £5,352,588 | £5,863,594 | £4,052,419 | £4,608,006 | |
| Expenditure on paper | n/a | n/a | n/a | n/a (*) |
(*) This is not available as paper is provided as part of a wider office supplies contract, so specific spend on paper only is not able to be separated out.
Sustainable procurement
The department’s procurement function is managed through a collaborative operating model, which includes DfTc, the executive agencies, government owned companies and non-nepartmental public bodies, also known as the DfT Group.
DfT group organisations are predominantly responsible for conducting their own procurements but can draw on central support from DfTc and assurance for most projects is carried out by a central function within DfTc. Each organisation has their own delegated authority, but as a rule their major spend will go through the DfTc assurance function. They also must comply with central policy either produced by DfTc, or OGD’s such as the Cabinet Office.
As a group, the department recognise the significant impact procurement decisions have on sustainability outcomes, therefore the department is committed to ensuring the supply chain supports sustainable development goals.
The department is committed to embedding sustainability into the procurement processes, and developed several tools to support this, including through:
-
the guidance is available to all procurement and contract management staff on the intranet and is regularly checked and updated when policy changes
-
training is given to all staff involved in procurement and have access to the sustainable development eLearning on Civil Service Learning and are actively encouraged to undertake it. Some executive agencies include sustainable procurement in their annual performance targets for procurement officers, and contract managers, while others provide general sustainable procurement training to all commercial staff. Staff with more responsibility for sustainable procurement have undertaken advanced training. The department has the CIPS kite mark, a statement of our commitment to ethical sourcing and supplier management
-
the commercial lifecycle assurance function team provide assurance of all major procurement processes in the department, to provide confidence to investment boards that they are being managed effectively, efficiently, and compliantly. This includes consideration of the inclusion of relevant sustainability targets, by ensuring consultation with appropriate sustainability experts at appropriate points in the procurement phase
-
the department has fully implemented procurement policy note 6, 2021 and is now requiring all suppliers bidding for contracts with a value of £5 million per annum to submit carbon reduction plans, or face being excluded from the procurement. Carbon reduction plans are challenging suppliers to change their behaviour and detail their own carbon reduction policies within their organisation, as well as providing their current and baseline emissions. This is a major initiative to reduce the carbon footprint of our supply chain
-
the department’s major procurements (above public procurement thresholds) must now attribute a minimum 10% weighting to a social value outcome as part of the tender evaluation criteria, potentially including outcomes which focus on environmental concerns and decarbonisation with a significant factor in winning government work linked to such an outcome, the aim is to drive supplier behaviour to supporting strong decarbonisation initiatives. Initiatives which may be assessed include supplier’s ability to work towards net zero emissions, increased biodiversity, improved air quality, creation of green spaces, and a reduction in waste throughout the contract and down the supply chain
-
Cabinet Office’s procuring for growth balanced scorecard helps procurers consider criteria such as cost balanced against social, economic, and environmental considerations. It is mandated for construction and infrastructure contracts above £10 million as part of the industrial strategy. In the department, the balanced scorecard is embedded within the commercial case guidance, and the ongoing commercial lifecycle assurance process, thereby helping ensure it is considered at the earliest stages of projects
-
the department is committed to full implementation of the construction playbook by 2023, a best-practice principles framework published in 2020, aimed at getting construction projects right from the start as green as possible, through requirements for net zero 2050 strategies, whole life carbon cost assessments such as PAS2080 and an emphasis on modern methods of construction and off-site construction where possible, which is much less carbon intensive than traditional construction
As well as these established policies, the department is developing a sustainable procurement strategy. Where previous strategies have focused solely on how the department can conduct procurement business in a sustainable way, this will look further at how specifically the department can leverage its buying power to achieve sustainable outcomes most effectively, specifically in its supply chain.
The department is investigating the further use of:
- carbon-focused key performance indicators (KPIs) for our contracts
- setting science-based targets for the organisation and our suppliers, as championed by Network Rail
- model clauses with carbon considerations
- carbon baselining and carbon incentivisation systems
- incentivisation versus mandating low carbon materials, primarily steel and concrete
Disclosure and reporting systems able to track whole-life carbon through the contract lifecycle, in line with policies announced at COP26 requiring disclosure of embodied-carbon levels in projects by 2025.
Bernadette Kelly DCB
18 July 2022
Permanent Secretary and Principal Accounting Officer
Department for Transport
Great Minster House
33 Horseferry Road
London SW1P 4DR
Accountability report
Report from the lead non-executive board member
During 2021 to 2022, the department has continued to deliver on its priority outcomes, with major emphasis on the effective and efficient delivery of its large-scale infrastructure projects and on the provision of safe and accessible services to the public and businesses. SR21 provides the department with a continued challenging and ambitious agenda.
The priorities around reducing environmental impact, growing and levelling up the economy and improving transport for the user were agreed as priority outcomes by HM Treasury and No.10 and form the basis of departmental performance reporting. Delivery of one will in many cases contribute to the delivery of the others. The priority outcomes also support wider government priorities, including build back better, levelling up and net zero greenhouse emissions by 2050.
Given the cross-cutting nature of these initiatives a second Permanent Secretary was appointed to achieve these priority outcomes in January 2022.
The publication of the transport decarbonisation plan, integrated rail plan, delivery of the national bus strategy, as well as, the announcement of Great British Railways, demonstrate the department’s commitment and progress towards achieving its priority outcomes.
The non-executive board members (NEBMs) are fully engaged across the department, providing support, scrutiny, experience, and expertise. They are well represented on the main department’s committees, including:
- DfT board
- executive non-executive meeting
- investment, portfolio, delivery committee
- chairing the group audit, risk and assurance Committee
- charing the nominations committee
Each NEBM has also been allocated oversight of a specific priority outcome aligned to their area of expertise.
The NEBMs have engaged in cross Whitehall groups such as:
- the government infrastructure steering group
- the cross-government union forum
- individual one-off reviews which utilised their existing knowledge and expertise
This included efficiency reviews for HM Treasury as well, providing support to another government department by conducting an effectiveness review of their audit and the executive risk committee.
Some of the key areas that have been considered in the Committees NEBMs sit on include:
- the government and the department’s priority outcomes
- decarbonisation and the impact of COP26
- levelling up and the UCR
- the impact of COVID-19 on the transport sector and emerging from the pandemic
- the future of the aviation sector
- cyber security deep dive
- diversity of public appointments
- portfolio reviews within the main delivery bodies
- HS2 performance review
Richard Pennycook, lead non-executive director at the Department for Education (DfE), undertook an independent board effectiveness evaluation on behalf of the department, to identify how well the board and its sub-committees were performing and to identify any areas for improvement.
The feedback from the independent evaluation was largely positive, with the department’s committee structure particularly noted as being robust and effective. The department’s NEBM’s were also recognised for the positive contributions they played in delivering effective governance to the department.
Helpfully, the evaluation also raised a few areas, where the department could make improvements to the quality and structure of its committees and their governance, as the department transitions to a more business as usual stance. I will be working closely with the department to take forward and implement these recommendations.
Over the past 12 months, the department has driven forward an ambitious programme of work to make journeys cleaner, improve the experiences of those using the transport network, and support productivity and economic growth.
The portfolio of the department is extensive, with its core priority outcomes central to government policy. As the department emerges from the acute stage of the pandemic, transport will play a crucial role in supporting the government’s levelling up mission.
Ian King, Lead NEBM.
The corporate governance report
The corporate governance report explains the composition and organisation of the department’s governance structures and shows how they support the achievement of the department’s objectives. It comprises of 3 sections:
- report from the lead non-executive board member
- statement of principal accounting officer’s responsibilities
- directors’ report
Statement of principal accounting officer’s responsibilities
Under the government resources and accounts act 2000 (the GRAA), HMT has directed me, Bernadette Kelly DCB, to prepare consolidated accounts for each financial year detailing the resources acquired, used or disposed of, during the year by my department.
This included its public bodies and other public bodies designated by order made under the GRAA by statutory instrument 2021 no 1441 (together known as the departmental group, consisting of the department and designated bodies listed in note 25 to the Accounts.
The accounts are prepared on an accruals basis and must give a true and fair view of the department and the departmental group and of the net resource outturn, application of resources, changes in taxpayers’ equity and cash flows for the financial year.
In preparing the accounts, I am required to comply with the requirements of the government financial reporting manual and in particular to:
-
observe the accounts direction issued by HM Treasury, including the relevant accounting and disclosure requirements, and apply suitable accounting policies on a consistent basis
-
ensure that the department has in place appropriate and reliable systems and procedures to carry out the consolidation process
-
make judgements and estimates on a reasonable basis, including those judgements involved in consolidating the accounting information provided by non-departmental and other delivery bodies
-
state whether applicable accounting standards as set out in the government financial reporting manual have been followed and disclosed and explained any material departures in the accounts
-
prepare the accounts on a going concern basis
-
confirm that the annual report and accounts as a whole is fair, balanced and understandable and take personal responsibility for the annual report and accounts and the judgements for determining that it is fair, balanced and understandable
HMT has appointed me as the principal accounting officer for DfT.
I have appointed the chief executive of each sponsored delivery body as the accounting officer for their delivery body.
As the department’s principal accounting officer, I am responsible for ensuring that appropriate systems and controls are in place to ensure that any grants that the department makes to its sponsored bodies are applied for the purposes intended and that such expenditure and the other income and expenditure of the sponsored bodies are properly accounted for, for the purposes of consolidation within the resource accounts.
Under their terms of appointment, the accounting officers of the sponsored bodies are accountable for the use, including the regularity and propriety, of the grants received and the other income and expenditure of the sponsored bodies.
The general responsibilities of an accounting officer, which includes responsibility for the propriety and regularity of the public finances for which the accounting officer is answerable; for keeping proper records; and for safeguarding the assets of the DfTc or non-departmental and other delivery bodies for which the Principal Accounting Officer is responsible, are set out in full in section 3.3.3 of Managing public money published by HMT.
As the principal accounting officer, I have taken all necessary steps to make myself aware of any relevant audit information, and to establish that the National Audit Office (NAO) has been made aware of all relevant information connected with its audit. Insofar as I know, there is no audit information of which the NAO is not aware.
I confirm that the annual report and accounts as a whole are fair, balanced and understandable. I take personal responsibility for the annual report and account and the judgements required for determining that they are fair, balanced and understandable.
Directors’ report
The Secretary of State for Transport, appointed by the Prime Minister, has overall responsibility for the department and its public bodies. The Permanent Secretaries are responsible for the effectiveness and efficiency of the department’s work to support ministerial policies and objectives.
In 2021 to 2022, Permanent Secretary Bernadette Kelly DCB was the principal accounting officer, responsible for the propriety and regularity of the department’s group expenditure. See information about the Principal Accounting Officer’s responsibilities on page 84.
The department’s funding sits in several categories, and HM Treasury holds the department accountable to agreed funding limits for each category. Detail of outturn against these funding limits is shown in the statement of outturn against Parliamentary supply (from page 165). The Permanent Secretaries are also responsible for the department’s leadership, management, and staffing.
Introduction
The governance statement describes how the DfT board and its supporting governance structures work and how they have performed. It provides an assessment of how the department is managed, including the effectiveness of the systems of internal control, risk management and accountability.
The Secretary of State is supported by the Permanent Secretaries, ministers, NEBMs, and directors general. The structure of these fora is set out in figure 13. The composition of the board is set out on the next section.
Departmental Board members as of 31 March 2022
- RT Hon Grant Shapps MP Secretary of State
- Chris Heaton-Harris MP (left 19 December 2021)
- Andrew Stephenson MP (left 7 July 2022)
- Rachel Maclean MP (left 16 September 2021)
- Baroness Vere Parliamentary Under Secretary
- Robert Courts MP
- Trudy Harrison MP (appointed 16 September 2021)
- Wendy Morton MP (appointed 19 December 2021)
- Karl McCartney MP (appointed 8 July 2022)
- Bernadette Kelly DCB Permanent Secretary
- Gareth Davies DG Second Permanent Secretary (from January 2021)
- Emma Ward DG Road Places and Environment
- Clive Maxwell DG High Speed Rail Group
- Nick Joyce DG Corporate Delivery
- David Hughes DG Rail Infrastructure
- Conrad Bailey DG Rail Strategy and Services (promoted 14 June 2021)
- Rannia Leontaridi (interim DG, Aviation Maritime and Security
- Ian King Lead NEBM
- Richard Keys NEBM
- Tracy Westall NEBM
- Tony Poulter NEBM
- Ranjit Baxi NEBM (appointed 1 April 2021)
- Dame Sara Storey NEBM (appointed 1 April 2021)
Register of interests
The register of ministers’ interests is maintained by the Cabinet Office. NEBMs are asked to declare any personal or business interests that may cause a conflict of interest; influence or appear to influence their judgement in performing their obligations to the department. A central register is maintained by the department.
Details of relevant declared interests are outlined below:
| Name | Company or organisation | Position held in DfT | Type of Interest (for example, pay, fees, shareholding) | Other relevant information |
|---|---|---|---|---|
| Richard Keys | NATS Holdings | DfT NEBM and GARAC chair | director of NATS Holdings | Registered interest in 2018 and recuses from any discussion relating NATS Holdings and all NATS Group matters |
| Tony Poulter | Pensions infrastructure platform ltd (PIP) | DfT NEBM | Non-executive chair of the PIP | Registered interest in mid-2017 of a possible acquisition by PIP of a portfolio of assets that included minority stakes in 2 project companies that were each party to a local authority highways PFI contract. Mr Poulter recuses from discussions on all local authority PFI contracts at the department’s investment, portfolio and delivery committee (IPDC). |
| Tony Poulter | London and Continental Railways Ltd | DfT NEBM | Special director | Registered interest in April 2021 and recuses from any discussion on London Continental Railways Ltd |
| Ian King | HS2 Ltd | HS2 Ltd | Special director | Registered role in August 2021 as interim Special Director. This position ended in January 2022 |
| Mark Bayley | Network Rail | DfT NEBM | Non-executive director | Not applicable |
| Kathryn Cearns | National Highways | DfT NEBM | National Highways NEBM and GARAC chair | Not applicable |
Civil servants
The department has existing procedures in place to implement the requirements of section 4.3 of the Civil Service management code. The standards of personal conduct expected of all civil servants are set out in Chapter 3.2 of the DfT Staff handbook with policies on business appointment rules (BAR), outside interests and activities and conflicts of interest.
These require that:
-
where the BAR rules apply, any applications for Senior Civil Servants (SCS) will require approval from the Permanent Secretary and HR Director. Members of the SCS at pay bands 3 or 4 are required to submit their applications to the advisory committee on business appointments who will consider the application and publish their decision. The HR Director or Senior HR business partner on their behalf considers and approves applications made from staff below the SCS
-
departmental approval is required for any activity or position that would require attendance during working hours whether paid or unpaid. Where an approach is made by an outside employer offering employment outside normal working hours for which approval is required under the business appointment rules (or seems likely to lead to such an offer) members of the SCS must inform the Permanent Secretary. All other employees must inform their countersigning manager
-
any conflicts of interest must be declared, with SCS asked to declare conflicts as part of the recruitment process. During 2021 to 2022 there were less than 5 conflicts of interest declared by the department’s SCS. Declarations for all other staff are handled by local management
-
employees may also not accept a directorship, except as a nominee of the government, in any company holding a contract with the department without the express permission of the Permanent Secretary. Where it is considered to be in the interests of the department, employees may seek approval to take up a position, for example a non-executive directorship, with an outside organisation and take time off from to undertake duties in connection the position. Advice on the acceptance of such positions is provided by HR
Special advisers
In line with the current declaration of interests policy for special advisers, all special advisers have declared any relevant interests or confirmed they do not consider they have any relevant interests. The Permanent Secretary considered the returns, and the following relevant interests are set out in public:
In compliance with business appointment rules, the department is transparent in the advice given to individual applications for senior staff, including special advisers. See advice regarding DfT specific business appointments for more information.
| Name | Interest |
|---|---|
| Neil Tweedie | Mr Tweedie holds a paid role as a Company Director of Edwin Street Media. Since taking up his role as a special adviser with the Department, Mr Tweedie has not been active in this capacity and has not undertaken any work on behalf of Edwin Street Media. The process to wind up the company is near to completion. |
The departmental family
The organisational structure, as set out in figure 12, consists of DfTc and its public bodies which deliver, regulate, or advise on a broad portfolio of functions.
The Cabinet Office and the Office for National Statistics (ONS) classify public bodies into 3 broad categories.
Central Government
Collectively known as arm length bodies (ALBs), they are:
- executive agencies
- non-departmental public bodies
- non-ministerial departments (NMDs)
Public corporations
Market bodies controlled by either central government or local government. Market bodies are defined as entities that gain over 50% of their income from purely commercial activities.
Local government
Public administrative bodies that cover a specific locality and any non-market bodies controlled and mainly financed by them.
The department works in partnership with several other entities such as expert committees and advisory groups.
These entities operate independently but are accountable to the department.
Figure 12: DfT organisational classification.

Overview of the DfTc groups, as of 31 March 2022
The department is organised into 7 groups. The decarbonisation, technology and strategy group is led by the second Permanent Secretary and the 6 other groups are each led by a director general.
The main responsibilities for these groups are set out below.
Following the announcement of the second Permanent Secretary, the department restructured the Aviation, Maritime and International Security Group. From 1 January, the Group was split into 2 new groups:
- aviation, maritime and security (AMS)
- decarbonisation, technology and strategy and private office (DTS)
AMS is responsible for leading the response work including COVID-19 as well aviation and maritime. DTS hold responsibility for COP26, environment and future mobility as well as international and science.
Decarbonisation, technology and strategy
Leads on:
- transport decarbonisation
- future transports systems and environment
- science, technology and innovation
- international
- analysis
- strategy and private office
Rail infrastructure group
Leads on:
- rail infrastructure South
- rail infrastructure North
- rail infrastructure Central
- integrated rail plan and Northern powerhouse rail
High speed rail group
Leads on:
- Euston project
- HS2 phases 1, 2a, and 2b
- programme integration
Rail strategy and services group
Leads on:
- rail strategy analysis
- rail workforce and pensions
- integration and security
- passenger services
- rail transformation programme
Corporate delivery group
Leads on:
- portfolio and project delivery
- corporate finance and property
- shareholding and corporate sponsorship
- group finance
- group commercial
- group human resources
- group assurance and digital
- group communications
- acceleration unit
Aviation, maritime and security group
Leads on:
- international
- transport security, resilience and response
- airports, infrastructure and commercial interventions
- aviation
- maritime
- accident investigation branches
- maritime and coastguard agency
Roads, places and environment group
Leads on:
- driving and vehicle standards agency (DVSA)
- driver and vehicle licensing agency (DVLA)
- vehicle certification agency
- COP 26
- environment and future mobility
- road safety, standards and services
- local transport
- regions, cities and devolution
- strategic roads, economics and statistics
- domestic COVID-19 directorate
Non-group
Comprised of legal.
The system of corporate governance, management, and internal control
The department is governed by:
- the Secretary of State’s overall responsibility for the department
- the Permanent Secretary’s responsibilities, both to the Secretary of State and directly to Parliament, as the principal accounting officer for the department’s expenditure and management
- the departmental board’s collective responsibility for overseeing the work of the department
- providing layers of control, scrutiny, and assurance to ensure that the department is achieving its aims and objectives with an appropriate level of control
The system of control includes the DfT board sub-committees, the Executive Committee and its sub-committees, and the department’s public bodies.
These are governed by the control framework, which is supported by internal and external assurance processes. Figure 13 provides an illustration of the board and the sub-committee structure in the department and the chair of each committee.
Figure 13: Governance bodies – board and sub-committee structure

DfT board and sub-committees
Departmental board
The Secretary of State chairs the departmental board. The board has oversight of 5 main areas, as outlined in the table below.
It advises and challenges the department on its strategic direction, and on the operational implications and effectiveness, of its portfolio. It operates by delegating several of its responsibilities to sub-committees, and retains accountability for the department’s public bodies, from which it can request periodic updates.
The board achieves this by drawing on the commercial, operational and political expertise of its members, which comprises of ministers, Civil Service leaders and NEBMs.
During 2021 to 2022, the board met 4 times. A summary of the discussions during 2021 to 2022 is provided below.
Responsibility of the board
Table 5: Overview of the board’s discussions
| Theme | Responsibilities | Topics discussed |
|---|---|---|
| Performance | Scrutinising the performance of the department and its public bodies. Setting standards and values | Milestones and delivery were discussed at each meeting as part of the management information report |
| Strategy | Setting the priority outcomes and ensuring activities contribute towards them. Advising on major policies, projects and programmes | The department’s COVID-19 response, EU transition decarbonisation, growing the economy union connectivity |
| Resources | Ensuring sound financial management. Considering the appropriate allocation of departmental resources | The board discussed resourcing and its allocation across the department, as part of the standing management information update to the board |
| Capability | Ensuring the department has the capability to deliver. Ensuring the department plans to meet current and future needs | The management information report provides an overview of the department’s resources and capabilities. Business planning 2021 to 2022 |
| Risk | Setting the risk appetite. Reviewing main departmental risks. Ensuring controls are in place to manage risk | Aspects delegated to ExCo and GARAC. Conducted a series of deep dives on the main risks on behalf of the Board. These risks included the risks the department faces in meeting its commitments to address climate change by decarbonising transport, cyber and information risk, and transport recovery |
Compliance with HM Treasury’s corporate governance code
The department has assessed its compliance with the corporate governance code for central government departments and is committed to the code and remained compliant with the spirit and principles of the code.
Board effectiveness evaluation
As per the department’s obligations under the code the department is required to carry out a board effectiveness evaluation annually, with independent input at least once every 3 years.
Richard Pennycook, the lead NEBM for Department for Education (DfE) was commissioned by Ian King to conduct the department’s independent evaluation. As part of the evaluation Richard observed committee meetings, reviewed meeting papers and met with members of the Board.
Feedback on the evaluation was largely positive, with the committee structure regarded as being robust and effective. There was also recognition that adaptations to remote working had been necessary and well handled.
Areas identified for improvement and review included:
- strengthening of the DfT board and engagement between ministers and NEBM
- development of a competency framework to support NEBM rotation
- review of meeting protocols
The department is using these recommendations as areas of focus in improving corporate governance arrangements in 2022 to 2023.
Executive Committee (ExCo)
The Committee met 45 times between April 2021 and March 2022 and held regular discussions around key areas including:
- levelling up/growing the economy
- strategic priorities
- management Information – including the department’s principal risks
- COVID-19
- security and resilience
- local authority capacity and capability
- annual report and accounts
- rail reform/rail transformation
- workforce review
- spending review
- race action plan
- land use planning and consenting
- programme phase 2 progress update
- winter resilience
- train operator company business
- internal outcome delivery plan 2022 to 2025
- acceleration of places for growth commitments
- statutory instruments
- inflation
- acceleration unit update
- transport safety
Executive and Non-Executive Meeting (ENEM)
Considered:
- the department’s strategic priorities
- future ways of working
- efficiency review and spending review
- winter resilience 2020 review - lessons learned
- winter resilience 2021
- buses and local transport strategy
- outcome delivery plan
- People survey 2021
- National Highway’s roads investment strategy, including major road schemes such as the Lower Thames Crossing, projects on the A358, A428, A303, A12, A14 and Smart Motorways
- portfolio reporting for the department’s tier 1 and tier 2 investments, as well National Highway’s capital portfolio and delivery framework and benefits management and evaluation
Nominations committee
The Committee provides assurance to the board that the department has the capability to deliver and plan to meet current and future needs for talented people.
It has an advisory role in scrutinising and challenging processes for developing talent, succession planning for both the department’s executive appointments, as well as the department and public bodies non-executive appointments, anchored in a broad understanding of the department’s overall people strategy.
Key areas the committee considered were:
- key public appointment activity, processes and succession planning across the department and public bodies
- public appointment diversity strategy
- increased Non-Executive ALB engagement and the implementation of a new shareholder / sponsorship directorate to deliver this
- Directors General and Director talent and succession planning
- DfT Board effectiveness evaluation results
Group audit and risk assurance committee (GARAC)
Key areas the committee considered were:
- annual report and accounts
- executive risk committee update
- the department’s audit plan (included updates from the executive risk committee, and reviewing the risk management process)
- decarbonising transport / net zero
- cyber and information security risks
- strategic workforce planning
- supply chain management
- HS2 risks
- GIAA and NAO findings and updates
- controls and counter-fraud
- raising a concern
Investment portfolio and delivery committee (IPDC)
The Committee increased the frequency with which it sat during the period of 2021 to 2022, with 34 meetings held during this time. Meeting on a regular basis enabled the assurance and controls to be maintained on decisions for investments and other financial interventions. This also ensured that business cases were considered in a timely manner and that the review of procurement activity across several different areas was maintained regularly throughout the year.
The Committee managed the department’s project portfolio and scrutinised projects during their delivery phase. Projects and programmes considered during 2021 to 2022 included:
- COVID-19 bus and light rail funding packages and COVID-19 trackers
- rail infrastructure projects including Crossrail, rail decarbonisation, Midland Main Line, TransPennine Rail Upgrade and Thameslink programme closure
- the High-Speed Rail 2 portfolio – including scope options, market engagement, Euston, procurement strategy, rolling stock procurement interactions, lessons learned, project lifecycle and baseline approvals, and scrutiny on costs, schedule, affordability and HS2 Management Information quarterly reports.
Table 6: Overview of board and sub-committee attendance up to 31 March 2022
| Board member | DfT board | Executive and non-executive meeting (ENEM) | ExCo | GARAC – There were also deep dive sessions scheduled for select members for particular topics of interest | IPDC | Nominations and governance committee (NGC) |
|---|---|---|---|---|---|---|
| Rt Hon Grant Shapps | 3/4 | |||||
| Chris Heaton-Harris MP | 0/3 | |||||
| Andrew Stephenson MP | 3/4 | |||||
| Baroness Vere | 4/4 | |||||
| Rachel Maclean MP | 0/1 | |||||
| Wendy Morton MP | 1/1 | |||||
| Robert Courts MP | 2/4 | |||||
| Ian King | 4/4 | 4/4 | 34/34 | 3/3 | ||
| Tony Poulter | 3/4 | 4/4 | 34/34 | |||
| Richard Keys | 4/4 | 3/4 | 7/7 | |||
| Tracy Westall | 4/4 | 4/4 | 3/3 | |||
| Ranjit Baxi | 4/4 | 4/4 | 6/7 | |||
| Dame Sarah Storey | 4/4 | 4/4 | ||||
| Bernadette Kelly DCB | 4/4 | 4/4 | 42/45 | 3/7 | 24/34 | 3/3 |
| Gareth Davies | 2/4 | 3/4 | 42/45 | 24/34 | 1/1 | |
| Nick Joyce | 4/4 | 4/4 | 43/45 | 7/7 | 23/34 | 3/3 |
| Clive Maxwell | 3/4 | 3/4 | 44/45 | 30/34 | ||
| Emma Ward | 3/4 | 4/4 | 44/45 | 22/34 | ||
| David Hughes | 4/4 | 2/4 | 35/45 | 31/34 | ||
| Conrad Bailey | 3/4 | 4/4 | 44/45 | 31/34 | ||
| Rannia Leontaridi – interim | 1/1 | 1/1 | 12/12 | 7/9 | ||
| Amarjit Atkar | 7/7 | |||||
| Kathryn Cearns | 7/7 | |||||
| Mark Bayley | 7/7 |
Governance of public bodies
Much of the department’s business is conducted with and through its public bodies. Within the department a sponsor team – or separate client and shareholder teams in the case of government-owned companies – manages the relationship with a public body at working level by following the principles set out in a framework document.
Framework documents
There is a framework document in place between the department and each of its public bodies, in line with HMT’s guidance set out in managing public money.
Framework documents are developed in collaboration with each public body to set out respective responsibilities, accountabilities, governance arrangements and financial management, and include expectations for the relationship between each public body and the department.
Additionally, relevant controls set out by the department, HMT, and Cabinet Office that define the parameters within which the organisation must operate are detailed, including reporting requirements.
As part of a 2021 update to managing public money, HMT provided specimen templates for government-owned companies, non-departmental public bodies and non-ministerial departments.
Executive agency and public corporation specimen templates are expected to be published in 2022. HMT aims to promote consistency of governance arrangements for each classification of public body.
The department supports sponsor and shareholder teams in ensuring that all framework documents are fit for purpose and compliant with managing public money.
Public body review
Cabinet Office launched its new public bodies review programme in January 2022, including guidance for departments. The department is working with its public bodies, Cabinet Office, and HMT to plan an ambitious programme of public body reviews over the next three financial years.
Non-executive board appointments and diversity
Ministers appoint around 150 non-executive board members including chairs to the department’s public bodies each year. These roles provide a link between the department and its public bodies, providing their boards with the required expertise and experience to enable delivery of government objectives.
NEBMs also provide constructive challenge to the public bodies noards, to ensure good governance is in place. Most of the department’s public appointments are regulated by the Office of the Commissioner for Public Appointments, in compliance with the government’s governance code for public appointments.
The government has set an aspiration that by 2022, 50% of all public appointees across government should be female and that 14% of appointments should be from BAME backgrounds. As of March 2022, 33% and 8% of the department’s public appointees were female and BAME respectively. This is an increase from the previous year in which 30% were female and 4% BAME.
To meet this challenge the department has developed a strategy for diversity in public appointments aiming to:
- improve data
- attract more diverse talent
- develop a more inclusive application processes
- provide more ongoing candidate support
The department also continued to build a talent pool of credible and diverse candidates, with a range of skills and experience including:
- promoting the non-executive roles among diversity networks
- participating in cross-government initiatives aimed at attracting candidates and raising awareness of public appointments
These efforts have been reflected in increased diversity of applicants for roles; those progressing to the later stages of competitions and actual appointments. For example, a campaign for the CAA had 11% BAME applicants and the campaign for East West Rail chair had 3 BAME and 2 female candidates on the shortlist of 6, with Neil Sachdev appointed.
The department’s work on diversity is strengthened by its sponsorship of the disabled peoples transport advisory committee, which has a majority disabled membership and a strong record of attracting disabled candidates. Accordingly, the department has 11.3% of appointees declaring a disability, which is the highest proportional across Whitehall.
Ministerial directions
There were no ministerial directions during 2021 and 2022.
Our approach to risk
The department’s risk management policy promotes a no surprises, no blame culture, where well managed risk taking is encouraged and managers are asked to lead by example. Risk management behaviours should be embedded into all departmental activities.
The department’s leadership understands that considered and well-managed risk taking is necessary to deliver business objectives. As a result, there is regular monthly reporting of the groups top risks to ExCo, and additional reporting to ENEM and the DfT board. The executive risk committee to include a deep dive of a specific principal risk and also of a group top risk each month.
During the year, the department reviewed and developed a set of principal risks to replace the existing cross cutting risks for the department. The purpose is to update, clarify and clearly identify the department’s top risks. These risks were managed and mitigated throughout the year and will continue to be updated to provide a forward look and will be managed and mitigated on an ongoing basis.
These principal risks are being used to support the risk management process by requiring directorates from across the department to consider how their analysis of main risks support the effective management of the principal risks.
There is no principal risk around legal, however we are mindful that we work in an environment and deliver projects and programmes that can attract legal challenge, and it is important that we operate within the law.
Legal risks are assessed, monitored and mitigated project by project and programme by programme and we take appropriate measures to meet legal or regulatory requirements or to protect our assets.
The department is fully engaged on cross-government improvement work to strengthen risk management – the department’s principal risks align closely to the Civil Service principal risks and are used to provide an update to the Civil Service board.
The department recognises that many risks are carried by the public bodies and works with them to ensure that risks are widely understood, and opportunities are taken to collectively manage them, as part of the shareholder role. The risk escalation protocol promulgated in 2018 continues to give direction to the public bodies on what they need to escalate to the department and when.
The reporting year has again brought many challenges and as a result, the department took forward a risk action plan to further address and strengthen risk management.
This plan was agreed and supported by the executive risk committee (incorporating departmental risk champions) as well as by ExCo and GARAC. The main elements of the plan included:
- more consistency with how risks are managed by the top boards
- strengthening the feedback loops across the whole department
- renewing the commitment to build staff capability
Increased, dedicated, risk management training for all staff is to be taken forward during the coming year.
Principal risks
The next table sets out the principal risks that the department managed during the year. These risk themes represent the department’s view on the overall risk profile, considering the risks carried and managed by the public bodies.
More information on the department’s response to COVID-19 can be found at the start of the performance report. As well as handling COVID-19 outbreak and lockdown restrictions, the department has also worked hard to manage the risks around the UK’s transition from the EU and how this has affected our freight, trade and passenger travel to the EU, particularly through our channel ports.
Table 7: Principal risks
The direction of the risk trend indicates whether the probability of the aggregate likelihood and impact of the risk materialising increased, decreased, or remained the same over the period of this report.
| Principal risk | Mitigating activities taken during 2021 to 2022 | Direction of risk trend at year end |
|---|---|---|
| The department is not able to afford to deliver all of its priorities in the medium to long-term, in particular due to inflationary pressures or cost of living crisis | The department: secured the Spending Review 2021 settlement and undertook a business planning review to allocate funds across the departments priorities, this allowed us to better understand residual pressures, made continued use of sound finance clearance processes to advise Ministers, ExCo and wider department on future affordability risks until the SR was completed | Current exposure score remains unchanged |
| The department is not able to deliver its major projects to time or cost or deliver the expected benefits | The department: used quarterly IPDC Portfolio meetings to monitor, analyse and report on progress of tier 1 projects, in particular project delivery capability via delivery confidence assessments and performance such as cost, schedule, benefits, resourcing and underpinning metrics, engaged with SROs and portfolio risk owners to improve analysis and reporting, using their expertise to scrutinise project data and provide better assessment of project risk exposure and mitigations, improved mitigation actions by risk owners acting to drive awareness and co-ordination of actions across the department | Current exposure score remains unchanged |
| There is a significant loss of life within the transport (or international) network due to system or infrastructure failure, accident, or security breach | The department: worked with the Office of Rail and Road (ORR), Rail Safety and Standards Board (RSSB) and Rail Accident Investigation Branch (RAIB) to maintain and improve safety regulation and culture, ensured that Network Rail were aware of their responsibilities and implemented recommendations made by the RAIB following any investigation for example, derailment, and operational faults, and that ORR focus on areas identified as high risk, utilising a tracker to monitor progress of RAIB recommendations allocated to the department, and ensured Network Rail set aside funds to facilitate numerous level crossing closures, upgrades and renewals over the period 2019 to 2024, worked closely with CAA to ensure safety risks and oversight are effective including regular State Safety Board meetings, established a new forum since leaving the EU (Air Safety Committee, rule-making board, and Industry engagement forum) and it continued oversight of overseas territories and crown dependencies through existing governance channels | Current exposure score remains unchanged |
| The transport network is forced to close due to a major incident or is unable to restart transport activities after a major incident, pandemic, or natural catastrophe | The department: held regular planning meetings between TSOC and modes helped the department prepare for major incidents. TSOC and modes also have plans in place to respond to no-notice incidents. These plans are regularly reviewed and exercised based on risk, regularly engaged with Transport Operators to ensure their preparedness for key risks and to ensure clear lines of communication and timely reporting. There was extensive engagement on winter risks, both traditional winter weather risks as well as supply chain and workforce issues which have the potential to exacerbate impacts over the winter period, set up a departmental response cohort, a permanent resource of 160 response staff that can be called upon to respond to a disruptive event. Members received training in either a policy, operations, or senior management role, to ensure they have the right skills required to respond to any incident on behalf of the department, continued to deliver internal capability training through the training and exercising programme to upskill new staff and maintain skills of existing staff. Internal and cross-government exercises continue to test plans and skills of both TSOC and modal teams, fully engaged in the refresh of the National Security Assessment which highlights the most critical risks facing the country in terms of likelihood and impact | Current exposure score remains unchanged |
| The department does not deliver sufficient action in the transport sector to provide carbon savings, meet air quality and biodiversity targets, and mitigate against climate change adaption, as required by law | The department: developed our EV Infrastructure Strategy, which sets out its long-term vision for zero emission vehicle infrastructure in the UK; its response to the consultation on future CO2 emissions regulations for new vehicles; and a ZEV mandate Worked with public bodies to ensure consistency in how it measured and reported carbon across DfT, portfolio and integrating carbon into the 5-case assessment model for project decision making, commissioned a feasibility study to assess the potential impacts on DfT infrastructure pipeline of a proposed 30 to 50% emission reduction target in the embodied emissions of government projects by 2030, against a baseline set in 2023 to 2024, worked with HS2 Ltd on developing their biodiversity action plan, which included a phase 2b net gain delivery plan to support the Bill process, provided support on Natural England’s formal assurance role in providing advice and assistance in identifying potential BNG partners, which includes stakeholder engagement and assuring HS2’s biodiversity metrics | Current exposure score remains unchanged |
| Key transport corridors and workers (for example, HGV drivers) that are needed to maintain the transport of goods and people become unavailable | The department: completed 32 short, medium and long-term interventions and the development of long-term work programmes on lorry parking and driver terms and conditions, increased HGV testing capacity and cleared the backlog in processing provisional licences and renewals, funded 2 new apprenticeship routes and delivered 11,000 bootcamp places which significantly increased routes to entry along with initiatives targeted at HGV drivers, ensured clear accountabilities and consistent messaging with OGDs ahead of the border control changes following the EU exit, established a weekly check in with Maritime Operations, established an ongoing programme of weekly and monthly engagement with industry and OGDs to gather intelligence and identify potential issues, worked closely with Border Protocol Delivery Group on increasing the department’s access to financial data and next steps, drafted the roll on, roll off passenger strategy which set out its objectives, risks / mitigations, and stakeholder management | Current exposure score has increased slightly |
| The department does not have the capacity and / or capability to deliver its priorities and objectives, with additional effect on the wellbeing of departmental staff | The department: conducted quarterly workforce reviews with good results which enabled timely decisions on workforce re-alignments and the management of workforce risks and issues. These reviews also resulted in a prioritisation framework being developed, which in turn will facilitate an ongoing re-alignment of the workforce to the highest priority work across the department, worked with external partners to fully understand the size and nature of available talent in regional locations to inform the best resourcing strategies, adopted a volume recruitment strategy, using pre-emptive (rather than reactive) campaigns in its largest professions of policy and project delivery to fill immediate vacancies while also stocking good quality, reserve Lists that were actively managed to provide an always on pipeline in between campaigns, launched work with an external employer brand partner to build awareness and the reputation of the department as a great place to work, with particular focus on building presence in regional locations and across a more diverse market In line with the commitments set out in the inclusion and wellbeing and race action plans, undertook significant activity to strengthen and diversify the pipeline into more senior leadership roles within the department | Current exposure score has decreased slightly |
| Transport systems are unable to function due to a critical market, supplier or supply failure in key network and delivery tools | The department: undertook regular financial monitoring, business continuity and risk assessments of the department’s group strategic and critical suppliers including the production of weekly intelligence across strategic suppliers and key markets, undertook strategic supplier engagement through a strategic partnering initiative, and industry body engagement through a supply chain working group to ensure strategic alignment and identification of risks and opportunities, produced a bi-annual UK construction market health dashboard and presentation to IPDC, worked with all ALBs to understand their pipelines and pinch points, analysing pipeline data to identify pinch points by category, commodity, or skill. Modelled worst case scenarios, for example, if everyone ordered everything at the same time, could the market/current suppliers satisfy demand, if not how do we work with the market / suppliers to increase overall supply, set up a working group to work closely with ALBs to investigate commodities such as steel and cement and take a much wider view of overall demand for key/essential commodities | Current exposure score remains unchanged |
| DfT and transport digital systems become compromised due to a hostile cyber environment and increase in cyber-attacks | The department: created a security improvement project to ensure awareness of and fixing of vulnerabilities, implementing improved monitoring and review how we conduct our monitoring / fixing capability, tendered for a security operations centre system – 24/7 monitoring on our systems to mitigate risks further. The department put in place extra support and capability to monitor its services out of hours and contracted with Deloitte to provide this extra resource, patched its cyber services regularly and used multiple layers of security to protect its estate. The department met with suppliers who briefed it on threats that they were seeing as part of the wider online environment Issued extra communications out to the DfT staff reminding them to be ultra-cautious | Current exposure score has increased slightly |
| DfT does not adequately forecast / horizon scan for future changes in the transport system, resulting in ineffective decision making (for example, demand forecasting, scenarios, or future projects) | The department: engaged in a cross-departmental futures programme to increase the resilience of policy, strategy and investment decisions by: anticipating and understanding future risks and opportunities to the transport system, allowing the department to be proactive rather than reactive in its response, supported and built capacity in making resilient decisions under uncertainty, utilising futures scenarios, and tools. Building agility into long term plan | Current exposure score remains unchanged |
| DfT does not adequately prepare to meet the challenges posed by international crises, in particular economic instability, movement of people and supply chain issues | The department: engaged with stakeholders to identify threats to critical resources, examining alternative sources and routes of supply in order to inform intervention and mitigating opportunities, engaged with OGDs to ensure that our and their solutions are not dependent upon the same suppliers / supply chain | Current exposure score remains unchanged |
The department’s principal risks were developed part way through the year and continuously reviewed thereafter to keep them live and relevant. Examples of this evolution can be seen in the first and last principal risk noted specifically references to inflation or cost of living crisis and international conflict respectively, as these inclusions were not added and mitigated against as part of the principal risk list until later in the year.
Framework of internal control
Robust control arrangements within the department provide assurance to the board, the principal accounting officer and ministers that public money and resources are used properly and efficiently.
The department continued to deal with COVID-19 interventions, ensuring clear governance and cross-stakeholder engagement were in place to support decision making. Controls were strengthened and implemented whilst the department worked at pace.
Financial governance, management and control
The department’s business planning process allocates the budget voted by Parliament to all parts of the department. Financial plans are agreed between the department and HMT through the spending review process.
At the commencement of each financial year, Parliament provides statutory authority for the department’s budget through the main estimate. In parallel, the principal accounting officer formally delegates budgets to directors general and the department’s public bodies.
The department, through ExCo, reviews actual and forecast outturn each month to ensure that spending is managed in-line with approved budgets and takes any required action to enable and control this. This monitoring is designed to ensure that the department does not breach any of the spending control limits approved by Parliament, while also providing advice on options to ensure the best use of available resources to ministers and the board in order to deliver the department’s priority outcomes.
Requests for budget changes are agreed with HMT during the year alongside strategic decisions made by ministers and the Board. The department seeks statutory authority from Parliament for changes to budgets in-year through the supplementary estimate.
In parallel, final budget delegations for the year are issued to directors general and public bodies. Actual spending for the year is compared with the final budgets approved by Parliament in the statement of outturn against Parliamentary supply – X ref.
Spending on COVID-19 interventions
The department’s spending requirements on interventions across the transport sector in response to COVID-19 were authorised by HMT and closely managed in 2021 to 2022. ExCo monitored these costs monthly against forecasts which were updated throughout the year as the spending requirements arising from COVID-19 developed.
Parliament formally approved any changes to these spending requirements on COVID-19 interventions through the supplementary estimate. Fraud risk assessments and additional due diligence was prioritised for COVID-19 schemes to help identify risks and any fraud and error loss to the department.
Fraud risk assessments were undertaken for grant areas assessed as high risk and awareness raised across the department to make sure control procedures were reviewed and assessed for continuing effectiveness.
Financial control, counter fraud and raising a concern
The department has a zero-tolerance attitude towards fraud, bribery and corruption. Any such acts are investigated and, where appropriate, disciplinary and or legal actions are taken, in line with CO guidelines.
The department continued to deliver against the counter fraud, bribery and corruption strategy in countering fraud, reducing risk, and raising awareness across the department. The department participated in the international fraud awareness week by working with internal and external stakeholders to help raise awareness of counter fraud, bribery, and corruption.
The department participated in the national fraud initiative in 2021 to 2022 as part of the wider detection activity and rolled out spotlight, a due diligence tool to support identification of risk areas that may require further investigation and detection of fraud and error.
Quarterly meetings were held comprising of senior fraud officers, government internal audit agency and other representatives from the department and its public bodies.
It considered updates from group members on counter-fraud activity, advice and initiatives from the CO, information sharing, best practice and any areas of concern impacting on the group’s policies and procedures.
This collaborative approach allowed the department to raise awareness of counter fraud activity and better understand the risk landscape across the department. Significant progress has been made in meeting the requirements of the government’s counter fraud functional standard.
All staff in the department are required to undertake annual online fraud awareness training.
The department continues to implement Cabinet Office’s cross-government internal fraud policy where employees dismissed for fraud, bribery or corruption are placed on to the Cabinet Office internal fraud database and are not able to gain re-employment across the Civil Service for a period of 5 years. During 2021 to 2022, one case fell within scope and resulted in an addition to the database.
Where appropriate, any cases of reported fraud during the same period within the department’s public bodies are noted in their own governance statements.
The department remains committed to building a culture where people feel safe to speak up about perceived wrongdoing and inappropriate behaviour and to report any concern in the knowledge that these will be heard, and concerns taken seriously.
To improve awareness of reporting routes, in September 2021 the department participated in the Civil Service-wide speak up – it’s just having a quiet word campaign. A series of events were delivered with a particular focus on unfair treatment, including bullying, harassment, and discrimination, reminding employees of the informal and formal reporting routes and support available to individuals.
The people survey also provides the department with useful information and insight on how employees feel about the organisation at a point in time. This data provides an opportunity to improve, develop and strengthen existing processes and practice going forward.
Some of the main findings from the 2021 people survey results included:
-
65% of the department respondents said they were aware of how to raise a concern under the Civil Service Code – below the Civil Service benchmark of 68%. This was a small decrease from 67% in 2020
-
confidence that a concern raised would be properly investigated remained stable at 77% – above the Civil Service benchmark of 76%
-
73% of the department respondents said they felt able to challenge inappropriate behaviour which was an improvement on the 2020 response of 70% – above the Civil Service benchmark of 70%
The results indicate there is more to do to improve employee understanding and awareness of the Civil Service Code, routes to raise concerns and the protections available to them. Plans are in place to improve employee understanding and awareness going forward.
Investigation into London and South Eastern Railway Ltd
On 9 May 2022, the department issued a final penalty notice on London and South Eastern Railway Ltd (LSER), following investigation of alleged breaches by LSER of the Franchise Agreements entered between the Secretary of State and LSER in September 2014 and March 2020.
The department concluded LSER had breached the good faith obligation in these franchise agreements. The investigation identified financial irregularities by LSER, including:
- non-disclosure of overpayments of subsidy from the department
- deliberately reporting non-specific liabilities in LSER’s financial records, in order to conceal the true financial position of amounts properly due to the department
- deliberately mis-allocating liabilities between different historic franchise agreements in order to reduce LSER’s profit-share payable to the department
Full details of the alleged irregularities and the conclusions are set out in the final penalty notice (PDF).
The department recovered the sums and interest associated with the financial irregularities identified from LSER in-full: accordingly, the matters identified do not represent a financial loss to the department or taxpayer.
In addition, the Secretary of State issued a penalty of £23.5 million on LSER as a sanction for LSER’s breach of the franchise agreement. As required under managing public money, this fine was remitted to the exchequer upon receipt in May 2022.
LSER’s latest franchise agreement with the department expired in October 2021. The Secretary of State elected not to extend the contract with LSER. Consequently, since 17 October 2021 the department has operated the contract directly under the operator of last resort arrangement.
Considering the issues identified, the department has reviewed its contracts with other rail operators and strengthened its contract management controls.
In addition, government internal audit agency (GIAA) was commissioned to review the department’s oversight and financial control over the department’s contracts with train operating companies.
Management assurance
The 2021 to 2022 management assurance review of DfTc based on director level assessments resulted in an overall opinion judged to be within the substantial range, with overall 22 of the 40 areas of internal control reported by business units as substantial (with the remainder being reported overall as ‘moderate’).
There were 2 individual ‘unsatisfactory’ rating identified in 2 different categories for 2 different business units of DfTc in 2021 to 2022. Year-on-year, the process is bringing greater visibility to the importance of controls and requirements.
Results are reported to ExCo and GARAC focusing on the lower scoring categories, with action plans identifying improvements with a number of actions already undertaken.
Noting that while these are the lowest scoring categories, they are in the Moderate range and therefore are not flagged as ‘urgent action required’:
- tier 2 and 3 project delivery – lowest scoring
- IT of third-party suppliers
- business continuity
- knowledge and information management
- directorate performance management – KPIs and milestones
The department’s overall approach to management assurance is a 2-stage review, consisting firstly of the director level assessments of the assurance they have over main control areas within their responsibility.
Secondly, an independent view of assurance against those same control areas by subject matter experts, which could result in adjustment to the overall judgements made. The 2021 to 2022 assurance rating of substantial is based solely on director level assessments. Subject matter expert opinions are due to be completed later in 2022.
Project assurance
Project delivery capability
Capable project delivery professionals are a critical component of successful project delivery. The department remains committed to supporting our people to ensure they have the project delivery capabilities they need to do their jobs to a high standard.
Steered by the head of profession and supported by the project delivery profession board, the department has continued to make ongoing investment in individuals continued professional development.
The department invested in its experienced project delivery professionals through:
-
funding for 11 staff on the major projects leadership academy
-
funding for 23 staff on the project leadership programme
-
funding for 16 through the project delivery development programme during 2021 to 2022
The ongoing commitment to improving project delivery builds on the Lessons from transport for the sponsorship of major projects report, with the department committed to delivering the next phase of the project delivery improvement programme.
Project assurance
The department works closely with the infrastructure and projects authority (IPA). The department is a major contributor to cross-government workstreams, and actively supports the professionalisation of project delivery.
This has included supporting the rollout of central initiatives such as the government project delivery framework and updating the government functional standard for project delivery and associated guidance.
The department’s project delivery centre of excellence provides a central source of advice, guidance, and support to our project delivery community. The centre of excellence also provides expert project assurance to support the monitoring of projects and inform the department’s investment decision making processes.
This is supplemented by the department’s lessons team and though its established community of practice, which shared project delivery lessons, themed best practice and profession insights from across industry all through a series of events held over the year.
The department operates a tiering system for projects and provides assurance through governance boards who monitor and make investment decisions at set points in a project’s lifecycle. The scale or scope, level of strategic risk and expected costs determine the level of governance oversight a project requires.
The department’s major projects portfolio – comprising 29 projects at the end of March 22 – includes the largest, riskiest, and most costly projects. The tier 1 portfolio reports to the department’s topmost investment decision making board (IPDC).
A sub-set of this portfolio of projects – 23 projects – forms part of the government major projects portfolio and reports quarterly to the IPA. An overview of our tiering system is provided in figure 14.
DfT group investment approval structure
Investment approvals are required whenever there is a contract award or investment, and approval must be gained from the appropriate investment board, as shown in figure 14.
Figure 14: Investment approvals structure.

All tier 1 projects must undergo independent project assurance reviews at particular stages in their lifecycle aligned to these investment approvals, and those reviews carried out this year by IPA accredited reviewers are provided in figure 15.
Figure 15: Overview of tier 1 project assurance reviews in 2021 to 2022

Analytical assurance
Analytical quality assurance (AQA) involves the consideration and communication of the strengths, weaknesses and limitations of analysis. This allows decision makers to better understand the quality of the evidence base they use.
The department’s analytical assurance framework, strength in numbers, aims to strengthen the standard of analytical quality assurance in the department. It is now well embedded within the department and the executive agencies.
As part of the framework, the department maintains and publishes a register of business-critical models, each of which has an appointed senior model owner responsible for ensuring appropriate governance and quality assurance of the model and its outputs throughout its lifecycle.
Business critical models are used to drive essential decisions and have robust governance regimes in place to assure against errors which could cause serious financial, legal and/or reputational damage to the department.
There are currently 98 business critical models used across the department and the executive agencies, 50 of which are based in the department.
Where analysis is used to inform or underpin decision-making, papers must include an analytical assurance statement. These statements highlight the strengths, limitations, and uncertainties in the analysis, ensuring decision-makers are fully informed. When included in submissions to ministers and tier 1 and tier 2 investment boards, they must be reviewed by an independent assurer to make sure all relevant information has been communicated, and the extent to which the analysis is considered reasonable and robust is clear.
There is good governance and assurance of analysis produced by public bodies to inform decisions taken by the department, facilitated by strong working relationships between analysts across the organisations. Where responsibility for decision-making is delegated to public bodies, responsibility for AQA is also delegated. The department’s community of practice brings together colleagues responsible for AQA from the department and the executive agencies to share good practice and ensure continuous improvement.
Independent assurance
DfT’s internal audit service is provided by the GIAA, an executive agency of HM Treasury. GIAA operates to the public sector internal audit standards, confirmed through its last external quality assessment undertaken by the institute of internal auditors between July and October 2020.
The group head of internal audit (group HIA) provides the department’s accounting officer with an independent opinion on the adequacy and effectiveness of the department’s systems of internal control and makes recommendations for improvement.
The work of GIAA is based on its analysis of the department’s risks and its audit programme, which is approved by GARAC. Regular reports are provided by GIAA to the department’s management, GARAC and to the executive committee.
The group HIA has provided the Permanent Secretary with an annual report on internal audit activity in the department and its ALBs over the course of 2021 to 2022. This report summarises:
- each of the individual head of internal audit annual opinions for the department and its ALBs
- movement from 2020 to 2021 and provides the group HIA’s independent opinion for 2021 to 2022 on the level (for example, substantial, moderate, limited, unsatisfactory) of assurance that can be placed on the adequacy and effectiveness of the department and ALB’s governance, risk management and internal control arrangements
The report showed that across the department and its ALBs, internal audit found evidence that the control environment established over recent years has broadly been sustained. All the HIAs of the DfT bodies reported a moderate opinion or above. As a result, the group internal audit opinion for 2021 to 2022 is moderate.
Looking ahead, as the country moves on from the pandemic, the department is subject to high levels of challenge with COVID-19 decisions being reviewed, the ongoing rail restructure, including the creation of Great British Railways, the heightened focus on :
- decarbonisation
- industrial action
- Ukraine war
- recent government objectives in headcount reduction across the Civil Service
With senior management attention directed to these it remains also important that there is adequate oversight and capability across the core areas, particularly digital to ensure the department’s wider objectives are supported on firm foundations of security, control, and risk management.
External review
The department was the subject of 4 NAO reports during 2021 to 2022. The Permanent Secretary and members of her leadership team attended 5 hearings at the Public Accounts Committee (PAC) to give evidence on recent developments. Further detail can be found on the PAC website and the NAO website.
Accounting officer system statement
The department published the latest Accounting officer system statement in March 2022.
Correspondence
The department aims to respond to correspondence from members of the public in 20 working days. In 2021 to 2022, 28,622 cases were received which is a 34% increase on the previous financial year. 88% of replies were sent on time.
The target response time for correspondence from MPs, peers and main stakeholders is 7 working days. The department received 16,094 cases in 2021 to 2022 and 68% of replies were sent by the target deadline.
Information rights, including personal data related incidents
Information rights
The department and its executive agencies received 2890 requests for information under either the freedom of information (FOI) act or the environmental information regulations (EIR). The department met the 20 working day statutory response deadlines in 95% of these cases.
The department also answered 19,993 valid requests from individuals exercising their rights under data protection legislation. These consisted mainly of subject access requests, 97% of which were answered within the statutory deadline despite changes to our physical working arrangements necessitated by COVID-19.
The department publishes a list of FOIs and EIR responses where some or all the requested information has been disclosed.
Personal data related incidents
The department holds personal data on millions of the UK population, including drivers, vehicle keepers, those taking driving tests, driving instructors, and seafarers. Every year, we process millions of transactions involving this and other personal data and take very seriously our responsibility to keep the data secure.
The department notified 12 separate breaches to the Information Commissioner’s Office (ICO). The department continues to take steps to reduce the number of all kinds of personal data related incidents.
Complaint’s handling PHSO investigations
The Parliamentary and Health Service Ombudsman (PHSO) investigates complaints about the department and its delivery bodies when referred by a member of Parliament on behalf of a complainant. Generally, the PHSO will expect the independent complaint assessors to have reviewed the matter before they consider investigating.
Where the PHSO believes there is evidence that there has been maladministration, unfair treatment, or poor service, it will investigate the issues, review the remedy provided, and may recommend further actions to resolve the matter. All recommendations made by the PHSO were implemented in the year by the department.
Table 7: Number of complaints investigated, upheld, and not upheld by PHSO
| Organisation | Complaints accepted for detailed investigation | Investigations upheld or partly upheld | Investigations not upheld or discontinued | ||||||
|---|---|---|---|---|---|---|---|---|---|
| 2021 to 2022 | 2020 to 2021 | 2019 to 2020 | 2021 to 2022 | 2020 to 2021 | 2019 to 2020 | 2021 to 2022 | 2020 to 2021 | 2019 to 2020 | |
| DfTc | 0 | 0 | 0 | 0 | 0 | 0 | 0 | 0 | 0 |
| DfT Independent Complaints Assessors | 2 | 0 | 0 | 1 | 0 | 0 | 1 | 0 | 0 |
| CAA | 1 | 0 | 0 | 1 | 0 | 0 | 0 | 0 | 0 |
| DVLA | 4 | 12 | 10 | 5 | 4 | 3 | 2 | 8 | 8 |
| DVSA | 0 | 0 | 0 | 0 | 0 | 0 | 0 | 0 | 0 |
| NH | 0 | 0 | 1 | 0 | 0 | 0 | 0 | 0 | 1 |
| HS2 Ltd | 2 | 0 | 1 | 2 | 0 | 0 | 0 | 0 | 1 |
| MCA | 0 | 0 | 0 | 0 | 0 | 0 | 0 | 0 | 0 |
| VCA | 0 | 0 | 0 | 0 | 0 | 0 | 0 | 0 | 0 |
| Total | 9 | 12 | 12 | 9 | 4 | 3 | 3 | 8 | 10 |
When PHSO concludes an investigation, it may do so in the year or the years following when it was accepted. In addition, there can be several recommendations made to the department or its public bodies to:
- resolve a complaint
- the time between the conclusion of an investigation
- issue of a report with recommendations, and when those recommendations are complied with or not can fall into a subsequent year
The following table includes the number of recommendations made by PHSO and those complied with in 2021 to 2022.
Table 8: Recommendations made by PHSO and compliance with them
| DfTc or Public Body | No. of Cases with Recommendations | No. of Recommendations | Closed: Complied With | Open: In Compliance | ||||||||
|---|---|---|---|---|---|---|---|---|---|---|---|---|
| 2021 to 2022 | 2020 to 2021 | 2019 to 2020 | 2021 to 2022 | 2020 to 2021 | 2019 to 2020 | 2021 to 2022 | 2020 to 2021 | 2019 to 2020 | 2021 to 2022 | 2020 to 2021 | 2019 to 2020 | |
| DfT | 1 | 0 | 0 | 1 | 0 | 0 | 1 | 0 | 0 | 0 | 0 | 0 |
| DVLA | 5 | 3 | 3 | 9 | 6 | 8 | 8 | 6 | 8 | 1 | 0 | 0 |
| HS2 | 2 | 0 | 0 | 2 | 0 | 0 | 2 | 0 | 0 | 0 | 0 | 0 |
| CAA | 1 | 0 | 0 | 1 | 0 | 0 | 1 | 0 | 0 | 0 | 0 | 0 |
Better regulation
The department has continued to ensure that regulation in the transport sector is proportionate and does not impose unwarranted burdens on business. The department will continue to assess the proportionality of its regulations on an ongoing basis and seek opportunities for regulatory reform.
The government’s benefits of Brexit paper announced an ambition to cut £1 billion of regulation from business. This paper, included the department’s plans to reform its regulatory landscape, including where and how it will take advantage of new regulatory freedoms post-Brexit.
This year has seen a number of urgent regulations made, relating to both the continued impacts of COVID-19 and the resulting HGV driver shortage. The department has ensured this legislation has been informed by a proportionate level of evidence and been consistent with its duties under the small business, enterprise and employment act 2015.
For all regulatory policies, resources have focused on measures with the highest impact to ensure that burdens are minimised. Small and micro business assessments are carried out for all regulatory measures to avoid those businesses being disproportionately affected by regulation where possible.
The department has continued a rolling programme of post-implementation reviews to check regulations affecting business are working. The department also makes use of alternatives to regulation where possible, for example through awareness campaigns about drink and drug driving and updating the highway code.
It is important that the highway code is updated regularly to keep account of changes to legislation and the introduction of new technologies or new road infrastructure. It is crucial that anyone using the road knows how to do so safely.
Over the last reporting period the highway code was updated to improve road safety for cyclists, pedestrians and horse riders introducing a hierarchy of road users and strengthened priorities for those most at risk when using our roads. Other updates included amending guidance for drivers and riders using high speed roads and motorways and reflecting the changes in legislation on use of mobile phones when driving.
In response to strong feedback from business, the better regulation unit works with the department’s public bodies and independent regulators to build capability and make sure the regulations are proportionate and do not impose unwarranted burdens on business in line with the better regulation framework.
Auditor
This section sets out the costs of auditing the DfT group accounts along with the costs of auditing the organisations which form part of the DfT group. Audit fees are not included in this section for other entities who are outside the department’s consolidation boundary.
The comptroller and auditor (C&AG) general carries out the audit of the consolidated accounts of the DfT group, as well as the audits of the following executive agencies:
- MCA
- DVLA
- DVSA
- VCA
These audits are conducted under the government resources and accounts act 2000 (GRAA), at an annual notional cost of £916,500 – which in 2020 to 2021 was £761,000.
The DVSA was audited in 2020 to 2021 under the government trading funds act 1973 at a cost of £99,500. It was reclassified to central government from 1st April 2021 and is therefore audited under GRAA.
The audits of the following entities are completed by the comptroller and auditor general, but incur a cash or real charge of £1,412,750:
- Network Rail Ltd (and its substantial subsidiary bodies, Network Rail Infrastructure Ltd and Network Rail Infrastructure Finance plc)
- National Highways
- British Transport Police Authority
- HS2 Ltd
- Transport Focus
- CTRL section 1 Finance PLC
- LCR Finance PLC
- East West Rail Ltd
In 2020 to 2021, the real charge was £1,327,500.
Network Rail’s audit fee of £615,250 includes £32,500 for other audit-related services including the audit of the Network Rail regulatory accounts.
In addition to these entities, the C&AG audits the accounts of the general lighthouse fund (GLF), which consolidates the general lighthouse authorities (GLAs).
While the GLAs are consolidated into the DfT group, the GLF is not consolidated. As such, the audit fee for the GLF is not included in this total. The audit fee for the GLF for 2021 to 2022 is £102,500 – which was £102,500 in 2020 to 2021.
PwC audits the following entities, providing audit assurance to the Comptroller and Auditor General as the group auditor. These audits incur a real cost charge of £208,086 - which was £182,000 in 2020 to 2021.
Smaller Network Rail subsidiary bodies
- Train Fleet (2019) Ltd
Directly Operated Railways Limited is exempt from audit of its account by virtue of s479A of Companies Act 2010.
Deloitte audits the following entity, providing audit assurance to the comptroller and auditor general as the group auditor. This audit incurs a real cost charge of £90,535 – which was £75,000 in 2020 to 2021.
- Air Travel Trust Fund
BDO LLP audits the following entity, providing audit assurance to the comptroller and Auditor General as the group auditor. This audit incurred a real cost charge of £9,300 –which was £8,400 in 2020 to 2021.
- Air Safety Support International Ltd
The NAO in its work to scrutinise public spending for Parliament also performs other work under statute, including value-for-money and assurance work.
Health and safety
Health and safety remain a top priority for DfT and its executive agencies. Health and safety teams played an integral role during our response to COVID-19, by ensuring locations and frontline activities were assessed against government requirements.
Making sure controls and arrangements were implemented for staff and visitor safety, so that activities and services continued wherever possible.
Table 9 sets out the number of reporting of injuries, diseases and dangerous occurrence regulations (RIDDOR 1998) reports to the Health and Safety Executive for the year 2021 to 2022 and previous years.
The figures also include non-staff, including those involving a member of the public taking their module 1 motorcycle riding test on a DVSA site and MCA volunteers, during their activities.
Table 9: Reporting of injuries, diseases and dangerous occurrences regulations
| Organisation | 2021 to 2022 | 2020 to 2021 | 2019 to 2020 | 2018 to 2019 |
|---|---|---|---|---|
| DfTc | 0 | 0 | 0 | 0 |
| DVLA | 1 | 4 | 8 | 9 |
| DVSA[footnote 10] | 8 staff 12 non-staff | 2 staff 1 non-staff | 2 staff 4 non-staff | 2 staff 7 non-staff |
| MCA[footnote 11] | 1 staff 4 non-staff | 1 staff 7 non-staff | 8 | 7 |
| VCA | 0 | 0 | 0 | 0 |
| Total | Staff: 10. Non-staff:16 | Staff :7. Non-staff: 8 | Staff: 16. Non-staff: 4 | Staff: 18. Non-staff:7 |
Conclusion
As Principal Accounting Officer, I have responsibility for reviewing the effectiveness of the system of internal control. I am supported by the work of internal audit, by the management assurance reporting of the executive managers within DfT, who are responsible for the development and maintenance of the internal control framework, and by comments made by the external auditors in their management letter and other reports.
In addition, I am supported by the Accounting Officers at our agencies and ALBs who are responsible for their internal controls and delegated spending. Based on these assurances, I am content that DfT upheld a satisfactory level of internal control and corporate governance throughout the reporting period.
People and remuneration report
Introduction
To support DfT’s strategic objectives, we agreed 5 priority themes for our 2021 to 2022 people strategy. They are:
- building a flexible workforce
- learning for all
- inspiring leaders and effective managers
- inclusive and supportive workplace
- people centred systems and policies
Building a flexible workforce (future DfT)
The DfTc future DfT programme was set up in 2020 to transform where and how we work:
- delivering DfT’s commitment to the places for growth programme
- renewing our ways of working to support an increasingly dispersed organisation to operate in a hybrid manner
On 15 March 2021, the Secretary of State announced plans for growing our presence in Birmingham and Leeds, with an initial commitment of 650 roles across both locations by 2025, creating opportunities in the regions of the UK which previously did not exist, and embedding our staff closer to the cities and regions we serve. In the Levelling Up White Paper this was revised to 688 roles, with a primary focus on Birmingham and Leeds, and – to a much smaller extent – in Edinburgh.
By the end of 2021 to 2022, we have already filled 288 roles in Birmingham and Leeds, including 9 Senior Civil Service roles, through a combination of recruitment and voluntary relocation of existing staff, and begun building a small presence in the new government hub in Edinburgh.
Ministerial visits have taken place to both Birmingham and Leeds including Minister Andrew Stephenson working from our Leeds office for a week in February 2021. Ministerial office accommodation is being designed into our new workspace in Birmingham.
Furthermore, in line with HM government’s roadmap for England and the Welsh Government’s law and guidance for Wales to remove COVID-19 restrictions, DfT as a whole has been steadfast in its approach to enable and encourage colleagues to work from our offices once again as part of our new hybrid working model.
A major aspect of managing the return to workplaces has been to ensure colleagues had a safe and positive experience when working in the office. Rigorous health and safety risk assessments and COVID-19 - mitigation measures were agreed with trade unions and the accounting officer in line with relevant government guidance at the time.
A comprehensive programme of communication and engagement across all channels and at all levels was undertaken to ensure staff were kept informed and had a clear understanding of the expectation on them.
New group workplace and location principles, supporting the hybrid working model, have been launched which affords staff more flexibility in how and where they work. Staff are expected to spend a minimum proportion of their working time in their principal workplace, supported by improvements to office accommodation and digital tools on offer to staff which enable new ways of working, with the flexibility to work remotely for the remainder if they choose to.
More widely, over the last year we have made further progress to build additional flexibility and resilience into our workforce. We stepped down our COVID-19 and EU transition response teams, moving staff to new roles elsewhere in the department and releasing secondments and contingent labour.
We have now implemented a crisis response cohort to provide immediate cover in the case of significant future crises and ensure the resilience of any future response activity.
DfT has been re-structured with the addition of a second Permanent Secretary from 1 January 2022, to enable us to step up and accelerate the DfT’s focus on de-carbonisation, the economy and levelling up.
The further strengthening of our workforce planning and insight capability across the employee lifecycle is allowing us to understand the scale and nature of our workforce risks better than ever before and to be proactive in taking mitigating action.
This includes:
- continuing with the quarterly cycles of workforce reviews
- work to re-define our employer brand to ensure we are attracting the very best talent from across the UK, especially in those parts of the country where we are significantly growing our presence in support of the ‘levelling-up’ agenda
- moving us closer to ‘always on’ recruitment channels for our largest professions
We continue to be an active participant of government internships, life chances and outreach initiatives and have increased our ambition year-on-year in support of these schemes.
In 2022, DfT hosted:
- 46 summer diversity interns
- 4 autism exchange interns
- 1 care leaver intern
- 2 digital T-Level students
- 3 prison leavers to diversify and strengthen early talent pipelines
DfT has also committed to supporting 8 interns through the pilot summer internship programme which focuses on building employability skills and broadening entry routes into the Civil Service in a range of geographical locations, supporting places for growth.
We’ve introduced a comprehensive wrap-around support offer to all interns who join DfT with a focus on building employability skills and raising awareness of Civil Service entry-routes alongside their core placement.
In addition, DFT continues to support the movement to work initiative which provides work experience opportunities to 18 to 30-year-old NEET candidates who are in receipt of Universal Credit.
DfTc deliver this workshop-based initiative across the country with a strong focus on preparing candidates to apply for future Civil Service apprenticeship opportunities. To date, 75% of participants have secured gainful employment following completion of their placement.
Learning for all
Growing our skills and capability is vital to our development as an excellent department. We continue to make a significant investment in building the skills and capability of all our people, ensuring that our learning and development curriculum is closely aligned with the evolving government campus.
We continue to work with the government skills and curriculum unit to help shape this work and the implementation of the new government curriculum.
Our learning priorities for the year have focused on:
- building core skills
- building leadership and management capability
- building professional capability (working closely with heads of professions across DfT to deliver with particular focus on project delivery and commercial)
In 2020 to 2021, due to the impact of the COVID-19 pandemic, all learning was delivered virtually, and we have built on this shift this year while also incorporating some face-to-face learning.
We have seen improvements in accessing learning opportunities – attendance rates rose to 91% in 2021 to 2022, up from 70% in 2019 to 2020 – while maintaining a high-quality learning offer – 94% of learners rated learning as good or excellent.
This year we have also focused on streamlining our learning systems and processes (including the roll-out of a new learning management system) to better manage access to learning opportunities and putting in place a robust evaluation strategy to assess the impact of learning interventions.
The government campus curriculum includes project delivery, from introductory e-learning courses such as ‘how projects run’ to professional qualifications like agile project management (APM) and PRojects IN Controlled Environments (PRINCE2). These opportunities were advertised as part of the core learning offer and funded by the central learning and development team.
Longer term project delivery development programmes have built the following professional capabilities:
-
project delivery development programme (PDDP) in-house: cohort of 15 higher executive officers (HEO) and senior executive officers (SEOs) – including 3 OGD candidates – completed the 12 month development programme, preparing people for leadership roles in project delivery
-
project leadership programme (PLP) Cabinet Office led programme: cohort of 23 G6 and G7s enrolled and graduated. This programme develops the skills and capability of project leaders, improving the way projects are led across government
-
major projects leadership academy (MPLA) run in partnership with Oxford Said Business School: cohort of 10 SCS, G6 and G7s enrolled and are on track to complete. This programme helps develop project leaders to become world-class at successfully leading major projects
Apprenticeships
DfT remains fully committed to supporting the government’s pledge to increase the quantity and quality of apprenticeships to drive the development of a diverse, inclusive, and productive workforce that meets the capacity and capability needs of a modern Civil Service.
Our departmental apprenticeship offer continues to go from strength to strength. By March 2022, DfTc exceeded the annual 2.3% headcount target for apprenticeships by onboarding 83 apprentice starts against last years’ 66 apprentice starts.
We continue to adopt a cohort-based model of recruitment and engage in proactive outreach in close partnership with our apprenticeship communities and alumni, to enhance our employer brand and maximise the diversity and regional spread of our early talent pipelines.
DfT have also transitioned a pre-existing 3-year commercial graduate programme to now include a more inclusive apprenticeship offer – focusing on building Commercial and leadership capability and encouraging applicants from non-traditional routes as part of our aim to increase social mobility.
We will continue to utilise apprenticeships to support the development of existing staff; supporting career pathways and professions skills-building within the organisation.
Inspiring leaders and effective managers
Leadership and management development remains a priority for us and forms a major strand of the government curriculum.
We continue to work closely with the government skills and curriculum unit to help shape the government-wide approach to leadership and management development, including the development of common management standards and the new leadership and management core curriculum.
As well as helping to shape this work we will ensure that our leaders benefit from the development opportunities provided by the new government curriculum. This year we have delivered a significant programme of work to build line management capability, as well as continuing to review this as the requirements of line managers have evolved –especially in response to changes in workplace polices linked to COVID-19 and the evolution of hybrid working.
We launched a hybrid working development package for line managers earlier this year including a new ‘managing hybrid working teams’ module, which now forms part of our modular management development programme, and a range of online resources.
We also launched a core SCS leadership development offer with a particular focus on inducting senior leaders into the organisation. Our focus for 2022 and 2023 will be on the implementation of a targeted departmental offer for senior leaders.
We continue to offer accelerated development schemes at both a departmental (stepping into leadership, interdepartmental talent partnership) and cross-government level (future leaders academy, fast stream, future leaders scheme, senior leaders scheme) to equip our high potential talent with the skills, tools, and professional networks to progress into future leadership roles and maximise their personal impact.
We have also put in place initiatives to help us to diversify the talent pipeline into more senior leadership roles and share experience across DfT. This includes the delivery of 3 cohorts of ascend, a career and leadership development programme aimed at ethnic minority and disabled colleagues at all grades to provide support with future career development and progression.
This year we have matched over 200 SCS with a reverse mentor as part of the DfT’s reverse mentoring scheme, encouraging the sharing of knowledge and lived experience through all levels of the organisation.
To improve the joining and leaving experience, new line manager online checklists have been created, covering all corporate functions to ensure the right steps are followed at the right time to improve both employee/manager experience and compliance.
Inclusive and supportive workplace
Dft publishes its equality monitoring data annually on DfT’s website.
Bernadette Kelly DCB, our Permanent Secretary, is the inclusion champion leading on socioeconomic diversity for the Civil Service and the theme lead for locations.
Within DfT, we have senior champions (at Director General and Director level) who take personal responsibility for leading and supporting their area. The champions in this period were:
- Gareth Davies for social mobility
- Rannia Leontaridi for gender
- David Hughes for age and carers
- Nick Joyce for LGBT+
- Clive Maxwell for disability and wellbeing
- Emma Ward for race
- Nick Bisson for faith and belief
These champions are responsible for reinforcing and role modelling our commitment to representing the communities we serve and to being an inclusive employer.
The work of these champions is supported and driven by a vibrant collection of inclusion and wellbeing employee networks.
DfT also has a dedicated professional wellbeing and workplace adjustments team, which provides tailored support for colleagues working in particularly pressured and challenging environments to enhance and protect their health and wellbeing.
We want to create an environment where people belong, where they can bring their whole self to work and where they can thrive.
The new DfT group diversity, inclusion and wellbeing strategy 2022 to 2025 which is currently in development sets out a framework which, over the next 3 years, will help us achieve our business goals. It provides a high-level road map for effectively creating and sustaining a workplace culture where we can all work together in respectful and inclusive ways, without fear of bullying, harassment or discrimination.
This strategy comprises of 4 overarching priorities, which will enable delivery of targeted action plans at business unit level across the central department and agencies. They are:
-
representing the communities we serve – recruiting from a diverse pool which is reflective of the various communities we serve and providing opportunities to progress locally
-
being confidently inclusive – fostering a healthy and supportive culture where colleagues feel confident bringing the full range of their background, experiences, and skills to work
-
maximising potential for all – creating an empowering environment where everyone feels a sense of connection with DfT and sees opportunities to thrive and develop their careers
-
building a transport network that works for everyone – making our transport system safer, more inclusive and better for all users
All our diversity, inclusion and wellbeing actions sit underneath each of these 4 priorities and contribute to the aims of the public sector equality duty under the Equality Act 2010.
Gender pay gap reporting
DfT’s gender pay gap (GPG) information is published as part of our annual Gender Pay Gap Report.
The 2021 median gender pay gap is 5.8% – which was 13.8% in 2020 – and the mean pay gap is 7.8% – which was 15.2% in 2020. While we were pleased to see a reduction in our gender pay gap this year, we are by no means complacent.
Having undertaken extensive analysis of our data we know that the DfT’s GPG is affected by several contributory factors.
The GPG is largely driven by disproportionate gender representation across the SEO, G7 and G6 grades. There are also fewer women in some of the specialist, technical roles, which attract additional allowances, and the external market from which we draw is male dominated. In 2021, we saw an improvement in part due to how bonuses were awarded and the increased representation of women in senior roles.
To continue narrowing the gap we are focused on ensuring DfT:
- has an inclusive culture where women can thrive
- removes barriers in attraction and recruitment
- supports women to develop and progress with good quality talent development interventions and robust talent pipelining into senior roles
Employee Engagement
The annual Civil Service people survey looks at civil servants’ attitudes to, and experience of working in government departments. Every year, a Civil Service benchmark report is published along with a summary of main department scores.
DfTc saw a 1pp increase to 68% and sits in the top 5 departments across Whitehall for engagement. A positive result given the challenging backdrop DfTc had been operating against.
At DfT group level the overall engagement score decreased by 6% points to 58% in 2021.
This decrease was largely driven by lower engagement scores in comparison with the previous year, reflecting challenging operational and employee relations environments in both DVSA – 9% points lower – and DVLA – 10% points lower.
MCA and VCA saw smaller falls in engagement by 2% points and 3% points, respectively.
We have used the data from the survey to inform actions at both a local and departmental level to address main themes.
Civil Service and DfT group’s people survey engagement scores 2017 to 2021
| Engagement Index (%) | 2021 | 2020 | 2019 | 2018 | 2017 |
|---|---|---|---|---|---|
| Civil Service | 66 | 66 | 63 | 62 | 61 |
| DfTc and agencies | 58 | 64 | 61 | 59 | 59 |
| DfTc | 68 | 67 | 64 | 64 | 65 |
| DVLA | 53 | 63 | 63 | 61 | 62 |
| DVSA | 53 | 62 | 57 | 52 | 49 |
| MCA | 66 | 68 | 65 | 65 | 65 |
| VCA | 65 | 68 | 63 | 64 | 61 |
People centred systems and policies
We are committed to providing people centred systems and policies for our people.
The current future of shared services (FoSS) programme, aims to produce a ‘tell us once’ suite of cohesive systems covering HR, finances and expenses, and commercial for our people to use.
In 2020 and 2021, the FoSS programme delivered a new expenses system. This solution offers new functionality, is easier to use and can be used on mobile devices. This is a significant milestone with the first visible change for end users and enhanced user experience.
To continue to support the workforce through the COVID-19 pandemic response and during the lifting of restrictions and return to workplaces a series of new or revised policies were delivered during 2021 and 2022. This includes:
- COVID-19 policies and guidance were updated throughout to reflect the changes in government guidance and to support employees and the business
- workplace and location principles were developed to clarify arrangements around principal workplace (or workplaces if specified in contracts) and expectations of workplace attendance as a percentage of working time
- a change of principal workplace location policy was put in place to support our departmental location strategy focused on growing our locations in Leeds and Birmingham
- our flexible working policies and homeworking guidance were updated to include hybrid working arrangements and to clarify pay implications on becoming a contractual homeworker
- to support our employees who may be subject to media scrutiny as a result of their work or role, a media attention duty of care policy and guidance was implemented in DfT at the end of March 2022
Trade unions
The trade union side in DfT is made up of FDA, PCS and prospect unions. In addition, drivers in the government car service are represented by Unite.
In 2021 and 2022 DfT engaged with its trade union representatives over a number of issues, the most important being our response to the COVID-19 pandemic and the planning of the DfT’s return to workplaces following an extended period of lockdown.
DfT and its agencies held weekly briefing sessions with union representatives to keep them up to date and consult on such matters as how to manage ongoing dispute resolution and absence management while managers and their staff were unable to meet face to face.
The unions were also invited to conduct health and safety inspections to confirm compliance with social distancing and other safety measures for those workplaces staff were required to attend during the pandemic, and made a valuable contribution by providing additional challenge and reassurance to this safety process.
Industrial action by PCS union in DVLA over safety conditions resulted in the loss of 18,522 working days and an estimated 400,000 items added to the backlog. Attempts to resolve the dispute were unsuccessful but a second ballot held by the union failed to reach the threshold required to extend the mandate.
No industrial action took place in other parts of DfT and the plan to reopen workplaces and implement hybrid working was successfully implemented in March 2022.
Due to a national Civil Service pay pause, pay negotiations were restricted and a pay award limited to staff earning less than £24,000 was imposed without agreement with the unions.
Facility time is granted to accredited representatives for trade union duties (TUD) and trade union activities (TUA) in line with legislation, the Cabinet Office framework on trade union facilities, and departmental policy.
Paid time off is permitted for TUD and unpaid time off for TUA. Trade union representatives must have a role in DfT that will normally take up at least 50% of their paid time.
Facility time usage is significantly down on previous years. The reduction of travel time through increased use of video-conferencing has been a factor in this. It is also noted that some members of staff spent periods on special leave through being unable to carry out duties during lockdown, and were not been required to record union time (TUA or TUD) during these absences.
Table 10: TU representation – the number of TU representatives employed by the Department and the cost of facility time
| Number of employees who were relevant union officials during the relevant period | FTE employee number |
|---|---|
| 135 | 127.3 |
Table 11: Percentage of time spent on facility time – how employees, who were TU representatives’ officials, employed during the relevant period spent their time
| Percentage of time | Number of employees |
|---|---|
| 0% | 41 |
| 1 to 50% | 94 |
| 51% to 99% | 0 |
| 100% | 0 |
Table 12: Percentage of pay bill spent on facility time
| Total cost of facility time | £0.13 million |
|---|---|
| Total pay bill | £737 million[footnote 12] |
| Percentage (%) of the total pay bill spent on facility time, calculated as: (total cost of facility time divided by the total pay bill) times by 100 | 0.02% |
Table 13: Time spent on paid TU activities
| Time spent on TU activities | % |
|---|---|
| Time spent on paid TU activities as a percentage of total paid facility time hours calculated as: (total hours spent on paid TU activities by TU representatives during the relevant period divided by the total paid facility time hours) times by 100 | 0% |
No paid time is given for Trade Union activities.
8.7 average working days were lost to sickness absence for the 12-month period ending.
31 March 2022 for the central department and its executive agencies. This is an increase of 2.9 days on the year to 31 March 2021. Absences caused by the COVID-19 pandemic have been included in average working days lost reporting for DfT for 31 March 2022 but were not included in the 31 March 2021 figure.
The increase in average working days lost when compared to the previous year is attributed a numbers of causes:
- firstly the removal of COVID-19 restrictions meaning that all of the workforce have returned to work during this period
- secondly the average working days lost figure includes absences as a result of COVID-19 where in particular front line staff were unable to work while following government guidelines if they tested positive for COVID-19
- finally the return of all staff to offices over the year is likely to have increased the incidence of absences from coughs, colds and flu
All absence is reviewed to ensure that support is offered and occupational health reports, action plans and interventions are progressed as appropriate. Absences have continued to be actively managed during 2021 and 2022 even where staff and their line manager have needed to do this remotely. DfT is focused on improving wellbeing, with a range of support in place that staff can access.
Our staff numbers
The tables on staff numbers and staff costs are subject to audit.
Details on the average number of whole-time equivalent persons employed during the year, the staff costs and gender composition are set out in the tables below.
Table 14: Staff numbers (departmental group including delivery bodies)
| Average number of staff | Permanently employed staff | Others | Ministers | Special advisers (*) | 2021 to 2022 Total | 2020 to 2021 Total (**) |
|---|---|---|---|---|---|---|
| DfTc | 3,535 | 47 | 6 | 4 | 3,592 | 3,145 |
| Agencies | 11,179 | 355 | 0 | 0 | 11,534 | 11,400 |
| Other delivery bodies | 56,193 | 1,937 | 0 | 0 | 58,130 | 57,624 |
| Total average number of persons employed | 70,907 | 2,339 | 6 | 4 | 73,256 | 72,169 |
(*) Special adviser numbers are taken on a snapshot date of 31 March 2022 and are not an average.
(**) Restated to include DVSA which was outside the accounting boundary until 1 April 2021. This is to allow a direct comparison between 2020 to 2021 and 2021 to 2022.
Table 15: Staff costs (departmental group including public bodies)
This table displays staff costs to the nearest £ million.
| Area | Permanently employed staff (£ million) | Other staff (£ million) | 2021 to 2022 total (£ million) | 2020 to 2021 total (£ million) |
|---|---|---|---|---|
| Wages and salaries | 3,440 | 58 | 3,498 | 3,416 |
| Social security costs | 380 | 0 | 380 | 355 |
| Other pension costs | 351 | 1 | 352 | 331 |
| Sub Total | 4,171 | 59 | 4,230 | 4,102 |
| Less: recoveries in respect of outward secondments | (2) | 0 | (2) | (2) |
| Less: staff costs capitalised | (1,239) | (19) | (1,258) | (1,243) |
| Total staff costs recognised in the Group Financial Statements | 2,302 | 40 | 2,970 | 2,857 |
| Of which: core department and agencies | 713 | 24 | 737 | 705 |
Staff costs for 2020 to 2021 restated to include DVSA which was outside the accounting boundary until 1 April 2021. This is to allow a direct comparison between 2020 to 2021 and 2021 to 2022
‘Other staff’ includes ministers and special advisers, who were paid £272,000 and £000,000 respectively (2020 to 2021: £274,000 and £000,000).
Special Advisers are temporary civil servants. In order to improve efficiency, the administration of staff costs for all Special Advisers across government was moved to the Cabinet Office in July 2019, with corresponding budget cover transfers. Therefore special adviser costs are now reported in the Cabinet Office Annual Report and Accounts. Special advisers remain employed by the respective departments of their appointing Minister.
No staff costs in 2021 to 2022 were covered using the COVID-19 job retention scheme.
Table 16: Number of employees at DfT and executive agencies and their sex as at 31 March 2022
| Department or executive agency | Men at 31 March 2022 | Women at 31 March 2022 | Men at 31 March 2021 | Women at 31 March 2021 |
|---|---|---|---|---|
| DfTc Permanent Secretary and Directors General | 4 | 2 | 4 | 2 |
| Senior managers of DfTc of the Senior Civil Service (excluding above) | 113 | 104 | 121 | 96 |
| DfTc | 1,919 | 1,524 | 1,976 | 1,538 |
| DfT agencies[footnote 13] | 6,904 | 5,887 | 6,744 | 5,798 |
Staff movement
This data refers to the central department only.
The departmental turnover rate at 31 March 2022 was 18.6%. This is an increase on turnover rate when compared to the 31 March 2021 rate of 11.6%.
This increase in leavers from the department is attributed to the buoyant UK labour market with UK job vacancies reaching a high of 1.25 million in January 2022, along with cost-of-living rises causing staff to seek new roles with higher wages to maintain their standard of living.
These 2 factors together are contributing to higher numbers leaving the department than in previous years. More detailed analysis into the reasons for staff leaving has been started in 2022 to identify options to reduce future turnover.
Table 17: Staff loaned into DfT
| Staff grade loaned in to DfT | Total loaned in | Short term loan (6 months or less) | Long term loan (more than 6 months) | Average loan in (months) |
|---|---|---|---|---|
| EO | 1 | 1 | 0 | 2 |
| HEO | 6 | 2 | 4 | 11 |
| SEO | 5 | 2 | 3 | 10 |
| Grade 7 | 17 | 8 | 9 | 8 |
| Grade 6 | 8 | 2 | 6 | 12 |
| SCS | 3 | 3 | 0 | 3 |
| Total | 40 | 18 | 22 | 9 |
Loaned in are classed as an administration cost. The cost of staff on loan to the department in 2021 to 2022 is £714,000 (2020 to 2021: £762,000). There were 17 staff on loan to the department where we did not pay their salary costs which will have been paid for by their home department.
During 2021 to 2022, there was very slight decrease in the number of loans into the department, but the total number has remained broadly consistent with the previous year.
Loans have been used largely as a short term solution for resourcing priority areas. There are a number of longer term loans in place to fill key roles and support the career development of these individuals, this can be seen in an increase in the average duration of loans.
Table 18: Staff loaned out of DfT
| Staff grade loaned out of DfT | Numbers of staff | Short term loan (6 months or less) | Long term loan (more than 6 months) | Average loan in (months) |
|---|---|---|---|---|
| EO | 2 | 0 | 2 | 13 |
| HEO | 3 | 2 | 1 4 | |
| SEO | 3 | 1 | 2 | 7 |
| Grade 7 | 3 | 2 | 1 | 5 |
| Grade 6 | 2 | 1 | 1 | 6 |
| SCS | 0 | 0 | 0 | 0 |
| Total | 13 | 7 | 6 | 6 |
Staff on loan from the department will continue to be paid for by their home department for loans under 6 months in duration, in line with the agreed government recharging agreements. This cost for short terms loans in 2021 to 2022 is £229,000, the cost of other loans out of the department where DfT met the staff administration costs is £188,000.
Resourcing
The department and its executive agencies have control systems requiring recruitment to be approved by departmental HR Directors and controlled from a single point. 3139 posts were recruited externally during 2021 to 2022.
During the reporting year, there were 46 exceptions to the general recruitment principles in relation to fair and open competition. These were spread among the executive agencies in a manner consistent with recruitment volume, although the central department did have a slightly higher trend of exceptions.
Temporary appointments of up to 2 years accounts for just over a quarter of the total exceptions (13), this is down from just over half last year. The most common use of exception in this period was secondment (16) closely followed by reinstatement of formal Civil Servant (15).
Service contracts
The constitutional reform and governance act 2010 requires Civil Service appointments to be made on merit based on fair and open competition. The recruitment principles published by the Civil Service commission specify the circumstances when appointments may be made otherwise.
Unless otherwise stated below, the officials covered by this report hold appointments which are open-ended. Early termination, other than for misconduct, would result in the individual receiving compensation as set out in the Civil Service compensation scheme.
See the work of the Civil Service commission for more information.
Remuneration
Remuneration policy – Senior Civil Service
Senior Civil Service (SCS) pay and conditions are not delegated to individual departments. The SCS is a corporate resource, employed with a common framework of terms and conditions across government departments.
Recommendations on SCS remuneration are provided by the review body on senior salaries (SSRB) in an annual report to the Prime Minister. See the SSRB’s work and copies of its annual reports for more information.
The government’s response to the recommendations of the SSRB is communicated to departments by the Cabinet Office, and the remuneration of the department’s senior Civil Servants is determined by the department’s pay and performance committee in accordance with that central guidance.
Performance management – Senior Civil Service
Performance against Cabinet Office-determined core objectives, and relative to SCS peers, determines allocation to a performance group, to which non-consolidated variable pay is linked. There are 3 performance groups:
- top
- achieving
- low
To be allocated to the top performance group, an individual must deliver to the highest standards in all objective categories.
The annual value of non-consolidated performance pay and base pay is set within the limits determined by the government’s response to the recommendations of the review body on senior salaries. In 2020 to 2021, base pay increases were not available for members of the SCS due to the pay pause, in line with SCS Pay Policy determined by the HMT public sector pay pause.
Number of SCS staff by band
The number of SCS employed by the department, including its executive agencies, as at 31 March 2022, is disaggregated in the table below.
Table 19: Number of SCS within the department and its agencies by salary range
| Salary range (*) | Staff numbers (**) |
|---|---|
| £70,000 to £74,999 | 78 |
| £75,000 to £79,999 | 55 |
| £80,000 to £84,999 | 23 |
| £85,000 to £89,999 | 13 |
| £90,000 to £94,999 | 25 |
| £95,000 to £99,999 | 9 |
| £100,000 to £104,999 | 7 |
| £105,000 to £109,999 | 11 |
| £110,000 to £114,999 | 6 |
| £115,000 to £119,999 | 8 |
| £120,000 to £124,999 | 4 |
| £125,000 to £129,999 | 5 |
| £130,000 to £134,999 | 2 |
| £135,000 to £139,999 | 0 |
| £140,000 to £144,999 | 2 |
| £145,000 to £149,999 | 2 |
| £150,000 to £154,999 | 2 |
| £155,000 to £159,999 | 0 |
| £160,000 to £164,999 | 0 |
| £165,000 to £169,999 | 0 |
| £170,000 to £174,999 | 1 |
| £175,000 to £179,999 | 0 |
| £260,000 to £264,999 | 1 |
| Total SCS staff numbers | 254 |
(*) Information is for all SCS in the department and its executive agencies as at 31 March 2022, including those on fixed-term contracts, and paid loans in (excluding outward loans and secondments). Salary is the basic annual full-time equivalent salary effective from 31 March 2022, and excludes non-consolidated performance related pay.
(**) The minimum annual salary for SCS is £71,000.
(***) Staff numbers are actual, not full-time equivalents, so a part-time member of staff counts as 1.
Pay and performance committee
This committee comprises the department’s Permanent Secretary (as Chair), all Director Generals, and the Group HR Director.
For the year to 31 March 2022, its members were:
- Bernadette Kelly DCB - Permanent Secretary, DfT
- Gareth Davies - Director General, Aviation, Maritime, International and Security (to 31 December 2021) Second Permanent Secretary, DfT (from 1 January 2022)
- Clive Maxwell - Director General, High Speed Rail
- Nick Joyce - Director General, Corporate Delivery
- Emma Ward - Director General, Roads, Places and Environment
- David Hughes - Director General, Rail Infrastructure
- Conrad Bailey (from 23 February 2021) - Temporary Director General, Rail Strategy and Services (previously named Rail Group) (from 23 February 2021) Director General Rail Strategy and Services (permanent from 14 June 2021)
- Marianthi Leontaridi (from 10 January 2022) - Temporary Director General Aviation, Maritime and Security
- Christina Duncan (to 22 July 2021) - Group HR Director
- Kate Caulkin (from 5 July 2021 to 8 October 2021) - Interim Group HR Director
- James Norton (from 1 November 2021) – Group HR Director
The committee’s remit includes making pay and talent decisions for directors and deputy directors. The Permanent Secretary decides on pay for Directors General.
Remuneration (including salary) and pension entitlements
The following sections on executive Board members’ remuneration and pension disclosures are subject to audit.
Executive members of the DfT Board
Salary
Salary includes:
- gross salary
- reserved rights to London weighting or London allowances
- recruitment and retention allowances
- private office allowances
- any other allowance to the extent that it is subject to UK taxation.
This report is based on accrued payments made by the department, and thus recorded in these accounts.
Bonus
Bonuses are based on performance levels attained, and are made as part of the appraisal process. Bonuses are paid in arrears, and relate to the performance in the previous year, in which it is payable to the individual.
The bonuses reported in 2021 to 2022 relate to performance in 2020 to 2021 and the comparative bonuses reported for 2020 to 2021 relate to the performance in 2019 to 2020.
Benefit in kind
The monetary value of benefits in kind covers any benefits provided by the department and treated by HM Revenue and Customs as a taxable emolument. There were no benefits in kind reported in 2021 to 2022 or 2020 to 2021 for executive board members.
Compensation payments
There were no compensation payments for executive members of the DfT board in 2021 to 2022.
Table 20: Officials’ remuneration
| Officials | 2021-22 salary (£000) | 2021-22 full year equivalent salary (£000) | 2021-22 bonus payments (£000) | 2021-22 pension benefits (£0007, 8, 9) | 2021-22 total benefits (£000) | 2020-21 salary (£000) | 2020-21 full year equivalent salary (£000) | 2020-21 bonus payments (£000) | 2020-21 pension benefits (£000) | 2020-21 total benefits (£000) |
|---|---|---|---|---|---|---|---|---|---|---|
| Bernadette Kelly DCB [1] (Permanent Secretary) | 170-175 | 170-175 | 15-20 | 25 | 215-220 | 170-175 | 170-175 | 0 | 67 | 240-245 |
| Gareth Davies [2] (Director General) to 31 December 2021 (Permanent Secretary) From 1 January 2022 | 140-145 | 140-145 | 5-10 | 51 | 200-205 | 135-140 | 135-140 | 10-15 | 61 | 205-210 |
| Nick Joyce (Director General) | 140-145 | 140-145 | 5-10 | 42 | 190-195 | 140-145 | 140-145 | 5-10 | 63 | 210-215 |
| Clive Maxwell (Director General) | 150-155 | 150-155 | 0-5 | 28 | 180-185 | 150-155 | 150-155 | 10-15 | 74 | 235-240 |
| Emma Ward (Director General) | 125-130 | 125-130 | 10-15 | 34 | 175-180 | 125-130 | 125-130 | 0 | 100 | 225-230 |
| David Hughes [3] (Director General) From 18 January 2021 | 145-150 | 145-150 | 0 | 22 | 165-170 | 30-35 | 145-150 | 0 | 12 | 40-45 |
| Conrad Bailey [4] (Temporary Director General) From 23 February 21 (Director General) From 14 June 21 | 120-125 | 120-125 | 10-15 | 186 | 320-325 | 10-15 | 120-125 | 0 | 83 | 95-100 |
| Marianthi Leontaridi [5] (Temporary Director General) from 10 January 2022 | 25-30 | 120-125 | 0 | 26 | 55-60 | N/A | N/A | N/A | N/A | N/A |
| Ruth Hannant [6] (Director General) to 26 February 2021 | N/A | N/A | N/A | N/A | N/A | 80-85 | 130-135 | 5-10 | 41 | 130-135 |
| Polly Payne [6] (Director General) to 26 February 2021 | N/A | N/A | N/A | N/A | N/A | 80-85 | 130-135 | 5-10 | 40 | 125-130 |
[1] Bernadette Kelly DCB changed her pension scheme from Alpha to the Partnership pension arrangement from 1 December 2020. 2021 to 2022 pensions benefits are the employer contribution made during the year.
[2] Gareth Davies was made Second Permanent Secretary of the department from 1 January 2022.
[3] David Hughes is a member of the Partnership pension arrangement 2021 to 2022. Pensions benefits are the employer contribution made during the year.
[4] Conrad Bailey pension disclosure for 01.04.2020 to 31.03.2021 covers the full year not only the time in post as a Director General at Department for Transport.
[5] Marianthi Leontaridi pension disclosure is from 01.04.2021 to 31.03.2022, covering the full year not only the time in post as a Director General at Department for Transport.
[6] Ruth Hannant and Polly Payne shared a Director General role. Individual remuneration figures reflect part-time working arrangements.
[7] Pension data is provided by My CSP. The value of pension benefits accrued during the year is calculated as (the real increase in pension multiplied by 20) plus (the real increase in any lump sum) less (the contributions made by the individual). The real increases exclude increases due to inflation or any increase or decreases due to a transfer of pension rights.
[8] From 17 January 2020 GMP adjustment factors are no longer applied in calculations for members who reach State Pension age on or after 06 April 2016.
[9] From some officials 2021 to 2022 Pensions Benefits have decreased when compared to 2020 to 2021 Pension Benefits this is because these individuals have transferred to Alpha pensions scheme during this year and further details on the impact of this is disclosed in the pensions section.
Table 21: Officials’ pension benefits
| Officials | Accrued pension at Pension age as at 31 March 2022 and related lump sum (£000) | Real increase in pension and related lump sum at pension age (£000) | CETV at 31 March 2022 (£000) | CETV at 31 March 2021 (£000) | Real increase in CETV (£000) | Employer contribution for those with a partnership pension account (nearest £100) |
|---|---|---|---|---|---|---|
| Bernadette Kelly DCB [1] Permanent Secretary | n/a | n/a | n/a | n/a | n/a | 25,400 |
| Gareth Davies [2] Permanent Secretary | 55 to 60 | 2.5 to 5 | 807 | 739 | 24 | n/a |
| Nick Joyce Director General | 45 to 50 | 2.5 to 5 | 707 | 649 | 19 | n/a |
| Clive Maxwell Director General | 65 to 70 plus a lump sum of 125 to 130 | 0 to 2.5 plus a lump sum of 0 | 1,139 | 1,071 | 4 | n/a |
| Emma Ward Director General | 40 to 45 plus a lump sum of 65 to 70 | 0 to 2.5 plus a lump sum of 0 | 634 | 586 | 12 | n/a |
| David Hughes [3] Director General | n/a | n/a | n/a | n/a | n/a | 21,700 |
| Conrad Bailey [4] [5] Temporary Director General from 23 February 2021 and Director General from 14 June 2021 | 55 to 60 | 7.5 to 10 | 862 | 688 | 131 | n/a |
| Marianthi Leontaridi [6] Temporary Director General from 10 January 2022 | 35 to 40 | 0 to 2.5 | 603 | 563 | 20 | n/a |
[1] Bernadette Kelly DCB changed her pension scheme from Alpha to the Partnership pension arrangement from 1 December 2020. 2021 to 2022 Pensions benefits are the employer contribution made during the year
[2] Gareth Davies was made Second Permanent Secretary of the department from 1 January 2022.
[3] David Hughes is a member of the Partnership pension arrangement 2021 to 2022. Pensions Benefits are the employer contribution made during the year.
[4] Conrad Bailey was promoted to be a permanent Director General from 14 June 2021. The opening balance at the start of the default period scheme year does not agree with the closing balance confirmed in the previous year, due to a change in the added years contract.
[5] Conrad Bailey pension disclosure for 1 April 2020 to 31 March 2021 covers the full year not only the time in post as a Director General at DfT.
[6] Marianthi Leontaridi pension disclosure for 2021 and 2022 cover the full year not only the time in post as a Director General at DfT.
[7] For individuals in defined contribution pension schemes (for example, Partnership), the value of pension benefits is the employer’s contribution during the year. For individuals in defined benefit pension schemes ( for example, Classic, Alpha) the pension data is provided by My CSP. The value of pension benefits accrued during the year is calculated as (the real increase in pension multiplied by 20) plus (the real increase in any lump sum) less (the contributions made by the individual). The real increases exclude increases due to inflation or any increase or decreases due to a transfer of pension rights.
[8] From some officials 2021-22 Pensions Benefits have decreased when compared to 2020-21 Pension Benefits this is because these individuals have transferred to Alpha pensions scheme during this year and further details on the impact of this is disclosed in the pensions section. Where individuals retain part or all of their benefits in pension schemes with a final salary element, real increases in pension can be significant in the period shortly after the point the individual’s remuneration increased, for example following promotion.
Civil Service pensions
Pension benefits are provided through the Civil Service pension arrangements. From 1 April 2015 a new pension scheme for civil servants was introduced – the Civil Servants and Others Pension Scheme or alpha, which provides benefits on a career average basis with a normal pension age equal to the member’s state pension age (or 65 if higher).
From that date all newly appointed civil servants and the majority of those already in service joined alpha. Prior to that date, civil servants participated in the PCSPS. The PCSPS has 4 sections:
- 3 providing benefits on a final salary basis (classic, premium or classic plus) with a normal pension age of 60
- one providing benefits on a whole career basis (nuvos) with a normal pension age of 65
These statutory arrangements are unfunded with the cost of benefits met by monies voted by Parliament each year. Pensions payable under classic, premium, classic plus, nuvos and alpha are increased annually in line with pensions increase legislation. Existing members of the PCSPS who were within 10 years of their normal pension age on 1 April 2012 remained in the PCSPS after 1 April 2015.
Those who were between 10 years and 13 years and 5 months from their normal pension age on 1 April 2012 switched into alpha sometime between 1 June 2015 and 1 February 2022. Because the Government plans to remove discrimination identified by the courts in the way that the 2015 pension reforms were introduced for some members, it is expected that, in due course, eligible members with relevant service between 1 April 2015 and 31 March 2022 may be entitled to different pension benefits in relation to that period (and this may affect the cash equivalent transfer values shown in this report – see below).
All members who switch to alpha have their PCSPS benefits ‘banked’, with those with earlier benefits in one of the final salary sections of the PCSPS having those benefits based on their final salary when they leave alpha. (The pension figures quoted for officials show pension earned in PCSPS or alpha – as appropriate. Where the official has benefits in both the PCSPS and alpha the figure quoted is the combined value of their benefits in the 2 schemes.) Members joining from October 2002 may opt for either the appropriate defined benefit arrangement or a defined contribution (money purchase) pension with an employer contribution (partnership pension account).
Employee contributions are salary-related and range between 4.6% and 8.05% for members of classic, premium, classic plus, nuvos and alpha. Benefits in classic accrue at the rate of 1/80th of final pensionable earnings for each year of service. In addition, a lump sum equivalent to three years initial pension is payable on retirement. For premium, benefits accrue at the rate of 1/60th of final pensionable earnings for each year of service. Unlike classic, there is no automatic lump sum. classic plus is essentially a hybrid with benefits for service before 1 October 2002 calculated broadly as per classic and benefits for service from October 2002 worked out as in premium.
In nuvos a member builds up a pension based on his pensionable earnings during their period of scheme membership. At the end of the scheme year (31 March) the member’s earned pension account is credited with 2.3% of their pensionable earnings in that scheme year and the accrued pension is uprated in line with pensions increase legislation. Benefits in alpha build up in a similar way to nuvos, except that the accrual rate in 2.32%. In all cases members may opt to give up (commute) pension for a lump sum up to the limits set by the Finance Act 2004.
The partnership pension account is an occupational defined contribution pension arrangement which is part of the legal and general mastertrust. The employer makes a basic contribution of between 8% and 14.75% (depending on the age of the member). The employee does not have to contribute, but where they do make contributions, the employer will match these up to a limit of 3% of pensionable salary (in addition to the employer’s basic contribution). Employers also contribute a further 0.5% of pensionable salary to cover the cost of centrally-provided risk benefit cover (death in service and ill health retirement).
The accrued pension quoted is the pension the member is entitled to receive when they reach pension age, or immediately on ceasing to be an active member of the scheme if they are already at or over pension age. Pension age is 60 for members of classic, premium and classic plus, 65 for members of nuvos, and the higher of 65 or State Pension age for members of alpha. (The pension figures quoted for officials show pension earned in PCSPS or alpha – as appropriate. Where the official has benefits in both the PCSPS and alpha the figure quoted is the combined value of their benefits in the 2 schemes, but note that part of that pension may be payable from different ages.)
See Civil Service pension arrangements for more information.
Cash equivalent transfer values
A cash equivalent transfer value (CETV) is the actuarially assessed capitalised value of the pension scheme benefits accrued by a member at a particular point in time. The benefits valued are the member’s accrued benefits and any contingent spouse’s pension payable from the scheme.
A CETV is a payment made by a pension scheme or arrangement to secure pension benefits in another pension scheme or arrangement when the member leaves a scheme and chooses to transfer the benefits accrued in their former scheme. The pension figures shown relate to the benefits that the individual has accrued as a consequence of their total membership of the pension scheme, not just their service in a senior capacity to which disclosure applies.
The figures include the value of any pension benefit in another scheme or arrangement which the member has transferred to the Civil Service pension arrangements. They also include any additional pension benefit accrued to the member as a result of their buying additional pension benefits at their own cost. CETVs are worked out in accordance with the occupational pension schemes (transfer values) (amendment) regulations 2008 and do not take account of any actual or potential reduction to benefits resulting from lifetime allowance tax which may be due when pension benefits are taken.
Real increase in the value of the CETV
This reflects the increase in CETV that is funded by the employer. It does not include the increase in accrued pension due to inflation, contributions paid by the employee (including the value of any benefits transferred from another pension scheme or arrangement) and uses common market valuation factors for the start and end of the period.
Pay multiples for DfT and its executive agencies (including agency staff and secondees)
The following section on pay multiples is subject to audit.
Reporting bodies are required to disclose the relationship between the remuneration of the highest-paid director in their organisation and the lower quartile, median and upper quartile remuneration of the organisation’s workforce.
Table 22: Percentage change in salary and bonuses for the highest paid Director and the staff average for 2021 to 2022
| Staff | Salary and allowances (%) | Bonus payments (%) |
|---|---|---|
| Staff average | 2.2% | 8.5% |
| Highest paid director | 0% | n/a[footnote 14] |
Table 23: Ratio between the highest paid directors’ total remuneration and the lower quartile, median and upper quartile for staff pay
| 2021 to 2022 | 2020 to 2021 | |
|---|---|---|
| Band of highest paid board member’s total remuneration (£000) | 185 to 190 | 170 to 175 |
| Median remuneration (£) | 26,963 | 26,382 |
| Ratio | 7.0 | 6.5 |
| 25th percentile remuneration (£) | 22,326 | 22,229 |
| Ratio | 8.4 | 7.8 |
| 75th percentile remuneration (£) | 38,061 | 36,447 |
| Ratio | 4.9 | 4.7 |
Table 24: Lower quartile, median and upper quartile for staff pay for salaries and total pay and benefits
| Lower quartile | Median | Upper quartile | ||||
|---|---|---|---|---|---|---|
| 2021 to 2022 | 2020 to 2021 | 2021 to 2022 | 2020 to 2021 | 2021 to 2022 | 2020 to 2021 | |
| Salary | 21,841 | 21,591 | 26,778 | 26,382 | 37,338 | 35,432 |
| Total pay and benefits | 22,326 | 22,229 | 26,963 | 26,382 | 38,061 | 36,447 |
The banded remuneration of the highest paid executive board member in the department in the financial year 2021 to 2022 was £185,000 to £190,000 (2020 to 2021: £170,000 to £175,000). This increase in remuneration was due to a bonus payment that was received in 2021 to 2022.
This was 7.0 times the median remuneration of the workforce, which was £26,963 (2020 to 2021: 6.5 times and £26,382); 8.4 times the lower quartile remuneration of the workforce, which was £22,326; and 4.9 times the upper quartile remuneration of the workforce, which was £38,061. This increase in pay multiples was due to a bonus payment being awarded in 2021 to 2022 to the highest paid executive board member.
The ratios are calculated by taking the mid-point of the banded remuneration of the highest paid executive board member and calculating the ratio between this and the lower quartile, median and upper quartile remuneration of the department’s staff. This ratio is based on the full-time equivalent staff of the department at the end of March on an annualised basis. This calculation includes the central department, DVLA, DVSA, MCA and VCA.
In 2021 to 2022 one employee (2020 to 2021: one employee) received remuneration more than the highest paid executive board member. Remuneration ranged from £17,273 to £264,000 (2020 to 2021: £16,934 to £262,500).
Total remuneration includes salary, non-consolidated performance-related pay and benefits in kind. It does not include severance payments, employer pension contributions and the cash equivalent transfer value of pensions.
This section includes updated figures for 2020 to 2021 as the annual report and accounts 2020 to 2021 was not required to include data from DVSA. By including DVSA in our figures for 2020 to 2021 and 2021 to 2022, we aim to provide a more accurate comparison between years.
Pension arrangements across the departmental group
Employees of entities included in these accounts benefit from a range of pension scheme arrangements. Some are members of employee-specific defined benefit schemes, set out in note 24 to the financial statements. Others may be members of the principal Civil Service pension scheme (PCSPS), or of defined contribution arrangements. The key schemes and associated costs for the departmental group are disclosed below.
The PCSPS is an unfunded multi-employer defined benefit scheme, but DfT is unable to identify its share of the underlying liabilities. A full actuarial valuation was carried out in 2016. Details can be found in the resource accounts of the Cabinet Office: Civil Superannuation.
For 2021 to 2022, employers’ contributions of £130.94 million were payable to the PCSPS (2020 to 2021: £93 million) at one of 4 rates in the range 26.6% to 30.3% (2020 to 2021: 26.6% to 30.3%) of pensionable pay, based on salary bands.
The scheme’s actuary reviews employer contributions every 4 years following a full scheme valuation. The contribution rates are set to meet the cost of the benefits accruing during 2021 to 2022 to be paid when the member retires and not the benefits paid during this period to existing pensioners.
Employees can opt to open a partnership pension account – a stakeholder pension with an employer contribution. For 2021 to 2022, employers’ contributions of £ 1.22 million (2020 to 2021: £1.13 million) were paid to legal and general. Employer contributions are age-related and range from 8% to 14.75% of pensionable pay. Employers also match employee contributions up to 3% of pensionable pay.
In addition, employer contributions of £41,857 0.5% (2020 to 2021: £31,628, 0.5%) of pensionable pay, were payable to the PCSPS to cover the cost of the future provision of lump sum benefits on death in service and ill health retirement of these employees.
The core department and its executive agencies neither owed or had prepaid any contributions to partnership pension providers as at 31 March 2022, (2020 to 2021 £21,000 due to the partnership pension).
To note all figures for contributions for 2021 to 2022 now include DVSA and 2020 to 2021 figures have been restated to now include DVSA.
There were 5 early retirements as a result of ill-health (2020 to 2021: 21). Figures for 2020 to 2021 and 2020 to 2021 include any ill-health retirements from DVSA.
Network Rail has 2 defined pension schemes. The RPS and CARE schemes are both shared cost in nature, so the cost of benefits being earned and the cost of funding any shortfall in the schemes are normally split in the proportion 60:40 between the group and the members.
In practice, the contributions are adjusted at each triennial valuation to reflect the funding position of the schemes at that time. For 2021 to 2022, the current service cost was £378 million (2020 to 2021: £266 million).
On 1 April 2004, a defined contribution pension scheme was introduced, the Network Rail Defined Contribution Pension Scheme (NRDCPS). This is an auto-enrolment scheme for all new employees of Network Rail, except those who have the legal right to join the Railway Pension Scheme (RPS), in compliance with regulations made under the Pensions Act 2008.
Any employee who wishes to transfer from the Network Rail Section of the RPS to the NRDCPS is entitled to do so. For 2021 to 2022 employers’ contributions of £23 million were payable into this scheme (2020 to 2021: £24 million).
The National Highways pension plan is a defined contribution group personal pension plan administered by a third-party provider. Highways England matches employee contributions to personal pension plans on a 2:1 basis, up to a maximum of 10% of gross salary. The default contributions are 5% (employee) and 10% (employer).
In addition, life insurance cover is provided for members of the plan at an average cost of 0.55% of gross salary. This meets National Highways’ statutory obligation to provide a workplace pension under current legislation.
As this is a defined contribution scheme, National Highways incurs no liability for future pension costs of members of the pension plan. For 2021 to 2022, employers’ contributions of £14 million (2020 to 2021: £13 million) were payable to the plan.
The Mercers Defined Benefits Master Trust is a master-trust defined benefit pension plan, administered by PAN Trustees. Employer contributions are set between 38.3% and 56.8% of pensionable earnings (dependent upon contractual employee contribution rates at the time of transfer). Employer’s contributions of £0.4 million were paid during 2021 to 2022 (2020 to 2021: £0.6 million). The contribution rates were set based on an actuarial valuation of the scheme at inception in July 2016.
British Transport Police has 2 defined benefit pension schemes:
- the British Transport Police Force Superannuation Fund – Police Officer scheme
- the British Transport Police Shared Cost Section of the Railways Pension Scheme – Staff scheme
Both schemes registered pension schemes are intended to be a fully funded providing benefits on a ‘defined benefit’ basis. For 2021 to 2022, the current service cost for both schemes was £110 million (2020 to 2021: £65 million).
Ministers
The following sections on ministerial remuneration and pension disclosures are subject to audit.
Salary
Salary’ includes gross salary; overtime; reserved rights to London weighting or London allowances; recruitment and retention allowances; private office allowances and any other allowance to the extent that it is subject to UK taxation. This report is based on accrued payments made by DfT and thus recorded in these accounts.
In respect of Ministers in the House of Commons, departments bear only the cost of the additional Ministerial remuneration. The salary for their services as an MP £81,932 (from 1 April 2020) and various allowances to which they are entitled are borne centrally.
However, the arrangement for Ministers in the House of Lords is different in that they do not receive a salary but rather an additional remuneration, which cannot be quantified separately from their Ministerial salaries.
This total remuneration, as well as the allowances to which they are entitled, is paid by DfT and is therefore shown in full in the figures below.
Benefits in kind
The monetary value of benefits in kind covers any benefits provided by DfT and treated by HM Revenue and Customs as a taxable emolument. There were no benefits in kind reported in 2021 to 2022 for Ministers.
Compensation for loss of office
There were no compensation payments for loss of office in 2021 to 2022.
Table 25: Ministers’ remuneration
| Ministers | Salary 2021 to 2022 (£) | Full year equivalent salary 2021 to 2022 (£) | Pension benefits 2021 to 2022 (to nearest £1000) | Total benefits 2021 to 2022 (to nearest £1000) | Salary 2020 to 2021 (£) | Full year equivalent salary 2020 to 2021 (£) | Pension benefits 2020 to 2021 (to nearest £1000) | Total benefits 2020 to 2021 (to nearest £1000) |
|---|---|---|---|---|---|---|---|---|
| Rt Hon Grant Shapps MP Secretary of State From 24 July 2019 | 67,505 | 67,505 | 17,000 | 85,000 | 67,505 | 67,505 | 17,000 | 85,000 |
| Chris Heaton-Harris MP Minister of State From 25 July 2019 to 18 December 2021 | 23,760 | 31,680 | 6,000 | 30,000 | 31,680 | 31,680 | 8,000 | 40,000 |
| Andrew Stephenson MP Minister of State From 13 February 2020 | 31,680 | 31,680 | 8,000 | 40,000 | 31,680 | 31,680 | 8,000 | 40,000 |
| Baroness Vere [1] Parliamentary Under Secretary of State From 2 August 2019 | 74,729 | 74,729 | 18,000 | 93,000 | 74,729 | 74,729 | 17,000 | 92,000 |
| Robert Courts MP Parliamentary Under Secretary of State From 8 September 2020 | 22,375 | 22,375 | 6,000 | 28,000 | 11,188 | 22,375 | 3,000 | 14,000 |
| Rachel Maclean MP Parliamentary Under Secretary of State From 13 February 2020 to 16 September 2021 | 10,255 | 22,375 | 3,000 | 13,000 | 22,375 | 22,375 | 5,000 | 27,000 |
| Trudy Harrison Parliamentary Under Secretary of State From 17 September 2021 | 12,120 | 22,375 | 3,000 | 15,000 | N/A | N/A | N/A | N/A |
| Wendy Morton [2] Parliamentary Under Secretary of State From 19 December 2021 | 3,429 | 22,375 | 2,000 | 10,000 | N/A | N/A | N/A | N/A |
| Wendy Morton Minister of State From 8 February 2022 | 5,087 | 31,680 | N/A | N/A | N/A | N/A | N/A | |
| Kelly Tolhurst MP Parliamentary Under Secretary of State From 13 February 2020 to 8 September 2020 | N/A | N/A | N/A | N/A | 11,188 | 22,375 | 2,000 | 13,000 |
[1] Baroness Vere is a Minister in the House of Lords. She receives £3,760 in respect of the Lords’ Office Holders’ Allowance, which is included in the Salary column. As a Lords Minister she is not entitled to claim her day rate for attendance.
[2] Wendy Morton joined as Parliamentary Under Secretary of State from 19 December 2021 and was shortly after made Minister of State from 8 February 2022. The pension benefit disclosure for the full period is provided against the role as Minister of State.
[3] The value of pension benefits accrued during the year is calculated as (the real increase in pension multiplied by 20) less (the contributions made by the individual). The real increase excludes increases due to inflation or any increase or decrease due to a transfer of pension rights.
Ministerial pensions
Pension benefits for Ministers are provided by the Parliamentary Contributory Pension Fund (PCPF). The scheme is made under statute and the rules are set out in the Ministers’ etc. Pension Scheme 2015.
Those Ministers who are Members of Parliament may also accrue an MP’s pension under the PCPF (details of which are not included in this report). A new MP’s pension scheme was introduced from May 2015, although members who were MPs and aged 55 or older on 1 April 2013 have transitional protection to remain in the previous MP’s final salary pension scheme.
Benefits for Ministers are payable from State Pension age under the 2015 scheme. Pensions are re-valued annually in line with Pensions Increase legislation both before and after retirement. The contribution rate from May 2015 is 11.1% and the accrual rate is 1.775% of pensionable earnings.
The figure shown for pension value includes the total pension payable to the member under both the pre-and post-2015 Ministerial pension schemes.
Table 26: Ministerial pensions
| Ministers | Accrued pension at age 65 as at 31 March 2022 (£000) | Real increase in pension at age 65 (£000) | CETV at 31 March 2022 (£000) | CETV at 31 March 2021 (£000) | Real increase in CETV funded by taxpayer (£000) |
|---|---|---|---|---|---|
| Rt Hon Grant Shapps MP Secretary of State From 24 July 2019 | 5 to 10 | 0 to 2.5 | 90 | 70 | 9 |
| Chris Heaton-Harris MP Minister of State From 25 July 2019 to 18 December 2021 | 0 to 5 | 0 to 2.5 | 33 | 26 | 3 |
| Andrew Stephenson MP Minister of State From 13 February 2020 | 0 to 5 | 0 to 2.5 | 24 | 17 | 2 |
| Baroness Vere Parliamentary Under Secretary of State From 2 August 2019 | 5 to 10 | 0 to 2.5 | 84 | 63 | 10 |
| Robert Courts MP Parliamentary Under Secretary of State From 8 September 2020 | 0 to 5 | 0 to 2.5 | 7 | 2 | 2 |
| Rachel Maclean MP Parliamentary Under Secretary of State From 13 February 2020 to 16 September 2021 | 0 to 5 | 0 to 2.5 | 10 | 7 | 2 |
| Trudy Harrison Parliamentary Under Secretary of State From 17 September 2021 | 0 to 5 | 0 to 2.5 | 2 | 0 | 1 |
| Wendy Morton Parliamentary Under Secretary of State From 19 December 2021 Minister of State From 8 February 2022 | 0 to 5 | 0 to 2.5 | 20 | 19 | 1 |
Cash equivalent transfer values
This is the actuarially assessed capitalised value of the pension scheme benefits accrued by a member at a particular point in time. The benefits valued are the member’s accrued benefits and any contingent spouse’s pension payable from the scheme. A CETV is a payment made by a pension scheme or arrangement to secure pension benefits in another pension scheme or arrangement when the member leaves a scheme and chooses to transfer the pension benefits they have accrued in their former scheme.
The pension figures shown relate to the benefits that the individual has accrued as a consequence of their total Ministerial service, not just their current appointment as a Minister. CETVs are calculated in accordance with The Occupational Pension Schemes (Transfer Values) (Amendment) Regulations 2008 and do not take account of any actual or potential reduction to benefits resulting from Lifetime Allowance Tax which may be due when pension benefits are taken.
Real increase in the value of the CETV
This is the element of the increase in accrued pension funded by the Exchequer. It excludes increases due to inflation and contributions paid by the Minister. It is worked out using common market valuation factors for the start and end of the period.
Non-Executive Board Members
The following section on Non-Executive Board Members’ (NEBM) remuneration is subject to audit.
Each of the NEBMs:
- Ian King
- Richard Keys
- Tony Poulter
- Tracy Westall
- Ranjit Baxi
- Dame Sarah Storey
Are entitled to claim annual fees, currently £15,000 per annum, and reasonable expenses (including travel and subsistence in line with the DfT’s policy on such expenses). Ranjit Baxi and Dame Sarah Storey appointments commenced on 1 April 2021.
Ian King, as the lead NEBM, receives an additional £5,000 in recognition of this role. Similarly, Richard Keys, as Chair of the department’s GARAC, receives an additional £5,000 per annum in recognition of this role.
Richard Keys also receives emoluments as a non-executive director of NATS Holdings Ltd, which is an organisation that DfT has a 48.9% investment stake in (see the financial statements for further information).
NEBMs are appointed on fixed terms. Their fees for 2021 to 2022 are set out in the table below. In addition, the membership of the GARAC includes Amarjit Atkar, Kathryn Cearns and Mark Bayley, who receive a fee for attending and preparing for meetings. Ranjit Baxi also sits as a member of GARAC but receives no additional fee.
Table 27: Non-executive board members’ fees 2021 to 2022
| Non-executive board member fees | 2021 to 22 (£000) | 2020 to 21 (£000) |
|---|---|---|
| Ian King | 20 to 25 | 20 to 25 |
| Richard Keys | 20 to 25 | 20 to 25 |
| Tracy Westall | 15 to 20 | 15 to 20 |
| Anthony Poulter | 15 to 20 | 15 to 20 |
| Ranjit Baxi (from 1 April 2021) | 15 to 20 | n/a |
| Dame Sarah Storey (from 1 April 2021) | 15-20 | n/a |
| Richard Aitken-Davies (to 31 March 2021) | n/a | 15 to 20 |
| Group Audit and Risk Assurance Committee Member Fees | 2021 to 2022 (£000) | 2020 to 2021 (£000) |
| Kathryn Cearns [1] | 0 to 5 | 0 to 5 |
| Amarjit Atkar | 0 to 5 | 0 to 5 |
| Mark Bayley (from 1 October 2020) | 0 to 5 | 0 to 5 |
| Bridget Rosewell (to 30 September 2020) | n/a | 0 to 5 |
[1] Kathryn Cearns is also remunerated by the department for her work as an Elizabeth Line Special Representative. This disclosure relates to her role on GARAC.
Off-payroll engagements
As part of the review of tax arrangements of public sector appointees published by the Chief Secretary to HM Treasury on 23 May 2012, departments and their public bodies were asked to report on their off-payroll engagements.
Data on these appointments are set out in tables below.
Table 28: Off-payroll engagements as at 31 March 2022, earning £245 per day or greater
| Engagements | DfTc | BTPa | DVSA | DVLA | National Highways | HS2 Ltd | MCA | National Rail | VCA | East West Rail co | VCA |
|---|---|---|---|---|---|---|---|---|---|---|---|
| Total existing engagements (*) | 29 | 8 | 18 | 12 | 11 | 179 | 21 | 1,070 | 9 | 28 | 1,385 |
| Engagements existed for less than 1 year | 22 | 7 | 15 | 7 | 10 | 114 | 11 | 559 | 4 | 19 | 768 |
| Engagements existed between 1 and 2 years | 6 | 1 | 3 | 5 | 1 | 33 | 6 | 363 | 1 | 8 | 427 |
| Engagements existed between 2 and 3 years | 1 | 0 | 0 | 0 | 0 | 23 | 4 | 97 | 2 | 1 | 128 |
| Engagements existed between 3 and 4 years | 0 | 0 | 0 | 0 | 0 | 3 | 0 | 36 | 0 | 0 | 39 |
| Engagements existed for 4 or more years | 0 | 0 | 0 | 0 | 0 | 6 | 0 | 15 | 2 | 0 | 23 |
(*) The table reflects changes in HM Treasury guidance and scope of reporting. Organisations with a nil return are not included in this table.
The department, its executive agencies, and public bodies have clearly defined governance and challenge processes in place to ensure they are compliant with the off-payroll (IR35) working rules. The departmental approvals committee provides independent challenge and seeks assurance from the core department and the executive agencies that: every effort is being made to reduce its reliance on off-payroll resource that a process is in place to transfer skills from off-payroll resource to permanent staff, and that alternative resourcing options have been considered. Similar governance arrangements exist within the arm’s length bodies.
The department undertakes a risk-based sampling exercise where a selection of engagements, which include those previously assessed as being out-of-scope, are reassessed for consistency to ensure that the status of the role has not changed, which would thus deem them to be in-scope of IR35 legislation. Table above shows the number of engagements that were reassessed for consistency purposes during the 2021 to 2022 financial year.
The department confirms that all the engagements reported in table above and the expenditure on consultancy and temporary staff table have been considered using HMRC’s IR35 assessment tool, apart from those in HS2 Ltd, where the default is that all roles are assessed as being in scope of the off-payroll working rules. The assessment tool is then only used when a role is identified to be out of scope, to assess its compliance against the legislation.
Table 29: All off-payroll engaged at any point between 1 April 2021 and 31 March 2022, earning £245 per day or greater
Organisations with a nil return are not included in this table.
| Engagements | DfTc | BTPa | DVSA | DVLA | National Highways | HS2 Ltd | MCA | National Rail | VCA | East West Rail co | VCA |
|---|---|---|---|---|---|---|---|---|---|---|---|
| Total engagements (*), of which: | 63 | 18 | 41 | 26 | 18 | 294 | 31 | 1,728 | 17 | 93 | 2,329 |
| Not subject to off-payoll legislation | 51 | 7 | 33 | 24 | 16 | 0 | 0 | 1,472 | 3 | 93 | 1,699 |
| Assessed as in scope of IR35 | 10 | 11 | 8 | 1 | 1 | 274 | 14 | 222 | 0 | 0 | 541 |
| Assessed as out of scope of IR35 | 2 | 0 | 0 | 1 | 1 | 20 | 17 | 34 | 14 | 0 | 89 |
| Reassessed for consistency /assurance purposes during the year (**) | 45 | 2 | 0 | 9 | 1 | 13 | 4 | 20 | 8 | 25 | 127 |
| Engagements whose IR35 status changed following reassessment | 0 | 0 | 0 | 0 | 0 | 0 | 1 | 8 | 0 | 0 | 9 |
(*) The above table reflects changes in HM Treasury guidance and scope of reporting which has seen an increase in engagements not subject to IR35.
(**) These figures represent the number of engagements which were reassessed during the period to ensure compliance with IR35 legislation.
Core department (DfTc): engagements deemed in-scope of the legislation are recruited through the Public-Sector resourcing framework and placed on the payroll of the department’s chosen commercial framework supplier to ensure tax deductions are taken at source.
Most off-payroll engagements were via umbrella companies and as a result, not subject to the IR35 legislation. 45 engagements were reassessed for consistency and compliance purposes, without resulting in a change to the initial status.
British Transport Police Authority (BTPa): a robust governance process is in place to challenge and control the use of off-payroll engagements and ensure compliance. 2 engagements were reassessed for consistency and compliance without resulting in a change to initial status.
DVSA: majority of engagements were not subject to the IR35 legislation, which is due to recent changes in HM Treasury guidance and scope of reporting. No sample tests were undertaken to reassess for consistency and compliance.
DVLA: all engagements are assessed for compliance prior to recruitment. Quarterly reviews were undertaken to assess engagements both in scope and out of scope of the IR35 legislation for consistency. Nine engagements were reassessed for consistency and assurance purposes, without resulting in a change to their initial status.
National Highways (NH): a robust governance process is in place to challenge and control the use of off-payroll engagements and ensure compliance. Majority of engagements were not subject to the IR35 legislation, which is due to recent changes in HM Treasury guidance and scope of reporting. One sample test was undertaken to reassess for consistency and compliance without resulting in a change to its initial status.
HS2: a central recruitment authorisation panel ensured governance and challenge for the recruitment off-payroll workers. A process is in place to provide independent assessment of engagements deemed out-of-scope of the IR35 legislation to ensure compliance. Changes have been implemented to strengthen the process for assessing off-payroll engagements. Thirteen engagements were reassessed for consistency and compliance without resulting in a change to their initial status.
MCA: a robust recruitment process is in place to challenge business on the use of off-payroll engagements. Hiring managers critically consider alternative resourcing options including looking at in-house capability before off-payroll engagements are approved. Four engagements were reassessed for consistency and compliance purposes, resulting in one change to their initial status.
Network Rail (NR): robust processes and procedures are in place to determine the status of off-payroll engagements against the IR35 legislation. Random reviews of determinations are carried out during the year to ensure accuracy. This provides assurance that all workers engaged in the business are being correctly paid and fulfilling all income tax and national insurance obligations. Due to recent changes in HM Treasury guidance and scope of reporting, a significant number of engagements with off-payroll workers were not subject to the IR35 legislation i.e., sole traders or workers engaged through an umbrella company. Twenty engagements were reassessed for consistency and compliance, resulting in eight changes to their initial status.
VCA: a process is in place to assess compliance with the IR35 legislation. Most off-payroll engagements were for ongoing business transformation, which required a varied and high-level skillset to meet the demand. Eight engagements were reassessed for consistency and compliance, without resulting in a change to their initial status.
East West Rail Company Limited (EWRco): a robust process is in place to manage compliance and recruitment of off-payroll engagements. All requests for, and extensions of, off-payroll engagements go through the spend approvals committee, chaired by the CEO, for authorisation. Due to recent changes in HM Treasury guidance and scope of reporting, all engagements are outside the scope of IR35 legislation.
Table 30: Off-payroll engagements of board members, and / or, senior officials with significant financial responsibility, between 1 April 2021 and 31 March 2022
| DfTc | BTPa | Directly Operated Railways Ltd | DVSA | DVLA | National Highways | HS2 Ltd | MCA | Northern Lighthouse Board | Network Rail | Transport Focus | Trinity House Lighthouse Services | VCA | Total | ||
|---|---|---|---|---|---|---|---|---|---|---|---|---|---|---|---|
| No. of off-payroll engagements of board members, and/or, senior officials with significant financial responsibility | 0 | 0 | 0 | 0 | 0 | 0 | 2 | 0 | 0 | 0 | 0 | 0 | 0 | 0 | 2 |
| Total individuals that have been deemed ‘board members, and/or, senior officials with significant financial responsibility’. This figure should include both on payroll and off-payroll engagements | 58 | 10 | n/a (*) | 5 | 9 | 12 | 35 | 12 | 3 | 17 | 12 | 4 | 5 | 6 | 188 |
(*) Directly Operated Railways Ltd does not have any officials; all financial decision making is undertaken by DfT officials.
Details of the exceptional circumstances that led to the above off-payroll engagements with significant financial responsibility, and the duration of the engagement is as follows:
HS2: from 28 April 2021 to 21 October 2021, a Procurement and Supply Chain Director was engaged temporarily to enable the creation of the Chief Commercial Directorate prior to the role being filled permanently. Accounting Officer approval was obtained for the temporary engagement.
From 12 July 2021 to 10 December 2021 phase 2b, a Development Director was engaged temporarily to work on the phase 2 business case and development plans prior to the role being filled permanently. Accounting Officer approval was obtained for the temporary engagement.
Consultancy and temporary staff costs
During 2021 to 22, the department and its delivery bodies employed a number of consultancy and temporary staff.
Consultancy is the provision of objective advice relating to strategy, structure, management or operations of an organisation in pursuit of its purposes and objectives. Such advice is provided outside the ‘business-as-usual’ environment when inhouse skills are not available and will be time-limited. Consultancy may include the identification of options with recommendations, or assistance with (but not the delivery of) the implementation of solutions.
Consultancy costs are incurred primarily on specialist transport-related activities across the Group, notably in Network Rail, East West Rail, High Speed 2 and the central department.
Temporary staff costs are incurred when staff are brought in to supplement the existing workforce, this could be due to a surge in demand, to address a short term resourcing need or in a temporary capacity for specialist skills.
Temporary staff costs are incurred primarily in major infrastructure programme across the Group, notably in Network Rail, High Speed 2 and East West Rail and continue to be the most significant driver of these costs.
During 2021 to 22 the largest cost increases in consultancy and temporary staff were in High Speed 2, where significant construction is continuing and progress has been made on a number of key procurements and East West Rail, with the restoration of the railway flyover at Bletchley and continued progress on the rest of the route.
Table 31: Expenditure on consultancy and temporary staff
| Organisation | Consultancy | Temporary staff | Total |
|---|---|---|---|
| Network Rail | 86,640,738 | 136,159,923 | 222,800,661 |
| DfTC | 87,503,961 | 8,585,503 | 96,089,464 |
| High Speed 2 | 1,358,431 | 20,416,345 | 21,774,776 |
| East West Rail | 11,968,183 | 9,443,983 | 21,412,166 |
| DVLA | 2,544,014 | 4,298,892 | 6,842,906 |
| DVSA | 1,367,165 | 3,671,781 | 5,038,946 |
| National Highways | 3,900,000 | 1,600,000 | 5,500,000 |
| BTP | 845,518 | 1,104,637 | 1,950,155 |
| MCA | 1,706,088 | 2,632,042 | 4,338,130 |
| VCA | 45,908 | 384,197 | 430,105 |
| Northern Lighthouse Board | 0 | 669,847 | 669,847 |
| Trinity House | 0 | 402,984 | 402,984 |
| Transport Focus | 0 | 0 | 0 |
| Commission for Irish Lights | 0 | 66,120 | 66,120 |
| ATTF | 0 | 0 | 0 |
| Directly Operated Railways Ltd | 0 | 0 | 0 |
| LCR Finance Company | 0 | 0 | 0 |
| CTRL Finance Company | 0 | 0 | 0 |
| Air Safety Support International | 91,434 | 38,350 | 129,784 |
| Trainfleet | 30,283 | 0 | 30,283 |
| Total | 198,001,723 | 189,474,60 | 387,476,327 |
Exit packages
The following section on exit packages is subject to audit
Exit packages table 1 – core department and agencies
Table 32: Reporting of Civil Service and other compensation schemes – exit package
| Exit package cost band | Compulsory redundancies 2021 to 2022 | Compulsory redundancies 2020 to 2021 | Other departures agreed 2021 to 2022 | Other departures agreed 2020 to 2021 | Total exits 2021 to 2022 | Total exits 2020 to 2021 |
|---|---|---|---|---|---|---|
| Under £10,000 | 0 | 0 | 8 | 12 | 8 | 12 |
| £10,000 to £25,000 | 0 | 0 | 7 | 12 | 7 | 12 |
| £25,000 to £50,000 | 0 | 0 | 7 | 11 | 7 | 11 |
| £50,000 to £100,000 | 0 | 0 | 2 | 6 | 2 | 6 |
| £100,000 to £150,000 | 0 | 0 | 0 | 2 | 0 | 2 |
| £150,000 to 200,000 | 0 | 0 | 0 | 0 | 0 | 0 |
| Over £200,000 | 0 | 0 | 0 | 0 | 0 | 0 |
| Total number of exit packages | 0 | 0 | 24 | 43 | 24 | 43 |
| Total cost | 0 | 0 | 495,077 | 1,245,549 | 495,077 | 1,245,549 |
2020 to 2021 figures have been restated to include DVSA who were outside of the accounting boundary until 1 April 2021. DVSA figures are also included for 2021 to 2022
Exit packages table 2 – whole departmental group
Table 33: Reporting of Civil Service and other compensation schemes – exit package costs
| Exit package cost band | Compulsory redundancies 2021 to 2022 | Compulsory redundancies 2020 to 2021 | Other departures agreed 2021 to 2022 | Other departures agreed 2020 to 2021 | Total exits 2021 to 2022 | Total exits 2020 to 2021 |
|---|---|---|---|---|---|---|
| Under £10,000 | 46 | 99 | 31 | 15 | 77 | 114 |
| £10,000 to £25,000 | 81 | 81 | 299 | 21 | 378 | 102 |
| £25,000 to £50,000 | 160 | 141 | 347 | 22 | 508 | 163 |
| £50,000 to £100,000 | 41 | 36 | 226 | 9 | 268 | 45 |
| £100,000 to £150,000 | 11 | 3 | 33 | 3 | 44 | 6 |
| £150,000 to 200,000 | 3 | 6 | 5 | 0 | 8 | 6 |
| Over £200,000 | 1 | 5 | 0 | 0 | 1 | 5 |
| Total number of exit packages | 343 | 371 | 941 | 70 | 1,284 | 441 |
| Total cost | 11,916,618 | 11,745,056 | 38,245,263 | 2,122,233 | 50,161,881 | 13,867,289 |
2020 to 2021 figures have been restated to include DVSA who were outside of the accounting boundary until 1 April 2021. DVSA figures are also included for 2021 to 2022.
Redundancy and other departure costs have been paid in accordance with the provisions of the Civil Service compensation scheme, a statutory scheme made under the Superannuation Act 1972 (with the exception of Network Rail, which is not governed by Cabinet Office controls and runs separate exit schemes).
Exit costs are accounted for in full in the year of departure. Where the department has agreed early retirements, the additional costs are met by the department and not by the Civil Service pension scheme. Ill-health retirement costs are met by the pension scheme and are not included in the table.
In line with the Constitutional Reform and Governance Act 2010 and the model contract for special advisers, a special adviser’s appointment automatically ends when their appointing Minister leaves office. Special Advisers are not entitled to a notice period but receive contractual termination benefits to compensate for this. Termination benefits are based on length of service and capped at 6 months’ salary.
If a Special Adviser returns to work for HM Government following the receipt of a severance payment, the payment is required to be repaid, less a deduction in lieu of wages for the period until their return. Termination costs for special advisers are reported in the Cabinet Office Annual Report and Accounts.
Statement of outturn against Parliamentary supply
In addition to the primary statements prepared under IFRS, the government FReM requires the department to prepare a statement of outturn against Parliamentary supply (SOPS) and supporting notes. The SOPS and supporting notes are a major accountability statement that show, in detail, how an entity has spent against their supply estimate.
Supply is the monetary provision (for resource and capital purposes) and cash (drawn primarily from the Consolidated Fund) that Parliament gives statutory authority for entities to utilise. The estimate details supply and is voted on by Parliament at the start of the financial year through the main estimate and updated later in the financial year through the supplementary estimate. The format of the SOPS mirrors the Supply Estimates, to enable comparability between what Parliament approves and the final outturn.
The SOPS and related notes are subject to audit, as detailed in the certificate and report of the comptroller and auditor general to the House of Commons.
The SOPS contain a summary table, detailing performance against the control limits on which Parliament has voted on, cash spent (budgets are compiled on an accruals basis and so outturn will not exactly agree to cash spent) and administration.
Government departments are not authorised to exceed the values that Parliament authorises in the supply estimate. These voted totals, or budgetary control totals, are outlined in the tables below. Any breach of these control totals will result in a qualified audit opinion due to an excess vote.
The supporting notes detail the following:
- outturn by estimate line, providing a more detailed breakdown (SOPS 1)
- a reconciliation of outturn to net operating expenditure in the Statement of comprehensive net expenditure, to tie the SOPS to the financial statements (SOPS 2)
- a reconciliation of outturn to net cash requirement (SOPS 3)
- an analysis of income payable to the consolidated fund (SOPS 4)
The SOPS and estimates are compiled against the budgeting framework, which is similar to, but different from, IFRS. An understanding of the budgeting framework and an explanation of key terms is provided in the financial overview section. Further information on the Public Spending Framework and the reasons why budgeting rules are different from IFRS can also be found in chapter 1 of the Consolidated Budgeting Guidance. A glossary of these financial terms can also be found in Annex A.
In SOPS 1, spending is split into departmental expenditure limits (DEL) and annually managed expenditure (AME), and within those categories spending is further split between resource and capital. These spending categories include:
- cash expenditure for transactions that require the transfer of money
- non-cash expenditure relating to changes in the valuation of assets (depreciation, pensions etc.
AME includes areas of spending that HM Treasury deems unpredictable, difficult to control and of a size that departments would have difficulty managing within DEL budgets.
DEL is usually set for the term of the spending review, whereas AME is forecast on a yearly basis. Departments are set annual budgets split between resource/capital and DEL/AME.
As required by the 2021 to 2022 FReM, the SOPS is presented in £000s. The financial statements are presented in £ million.
Summary of resource and capital outturn 2021 to 2022
Figures in the columns labelled ‘voted’ cover the control limits voted by Parliament. Further information about the Supply process control limits voted by Parliament can be found in the estimates manual.
Detailed explanations of significant variances between estimate and net resource outturn and are shown after SOPS note 1.2.
Table 34: Resource and capital outturn 2021 to 2022
| 2021 to 2022 | 2020 to 2021 | |||||||||||
|---|---|---|---|---|---|---|---|---|---|---|---|---|
| Type of spend | SoPS note | Outturn | Estimate | Outturn vs. Estimate saving/ (excess) | Outturn vs. Estimate saving/ (excess) | Prior Year Outturn Total 2020 to 2021 | ||||||
| Voted (£000) | Non-Voted (£000) | Total (£000) | Voted (£000) | Non-Voted (£000) | Total (£000) | Voted (£000) | Total (£000) | Total (£000) | ||||
| DEL) | ||||||||||||
| Resource | 1.1 | 18,569,577 | 14,488 | 18,584,065 | 20,881,682 | 15,036 | 20,896,718 | 2,312,105 | 2,312,653 | 23,670,861 | ||
| Capital | 1.2 | 19,151,091 | – | 19,151,091 | 19,420,864 | – | 19,420,864 | 269,773 | 269,773 | 17,032,402 | ||
| Total | 37,720,668 | 14,488 | 37,735,156 | 40,302,546 | 15,036 | 40,317,582 | 2,581,878 | 2,582,426 | 40,703,263 | |||
| AME | ||||||||||||
| Resource | 1.1 | 3,449,396 | 4,874 | 3,454,270 | 4,425,677 | 4,874 | 4,430,551 | 976,281 | 976,281 | 1,439,671 | ||
| Capital | 1.2 | 78,337 | – | 78,337 | 350,245 | – | 350,245 | 271,908 | 271,908 | 53,950 | ||
| Total | 3,527,733 | 4,874 | 3,532,607 | 4,775,922 | 4,874 | 4,780,796 | 1,248,189 | 1,248,189 | 1,493,621 | |||
| Total Budget | ||||||||||||
| Resource | 1.1 | 22,018,973 | 19,362 | 22,038,335 | 25,307,359 | 19,910 | 25,327,269 | 3,288,386 | 3,288,934 | 25,110,532 | ||
| Capital | 1.2 | 19,229,428 | – | 19,229,428 | 19,771,109 | – | 19,771,109 | 541,681 | 541,681 | 17,086,352 | ||
| Total budget expenditure | 41,248,401 | 19,362 | 41,267,763 | 45,078,468 | 19,910 | 45,098,378 | 3,830,067 | 3,830,615 | 42,196,884 |
Figures in the columns labelled ‘voted’ cover the control limits voted by Parliament. Further information about the Supply process control limits voted by Parliament can be found in the estimates manually.
Detailed explanations of significant variances between Estimate and Net Resource Outturn and are shown after SOPS note 1.2.
Net cash requirement
The net cash requirement is the limit voted by Parliament reflecting the maximum amount of cash that can be released from the consolidated fund to the department in support of expenditure in its estimate.
Table 35: Net cash requirement
| 2021 to 2022 | 2020 to 2021 | ||
|---|---|---|---|
| Note | £’000 | £’000 | |
| Estimate | 37,079,601 | 40,264,204 | |
| Outturn | SOPS 3 | 30,367,987 | 36,228,707 |
| Under / (over) spend against estimate | 6,711,614 | 4,035,497 |
Administration costs
The administration budget is a Treasury control on resources consumed by the department and forms part of the departmental expenditure limit (DEL).
The administration budget is not a separate voted limit, but any breach of this limit will also result in an excess vote. Administration costs include items not directly associated with frontline service delivery.
| 2021 to 2022 | 2020 to 2021 | ||
|---|---|---|---|
| Note | £’000 | £’000 | |
| Estimate | 360,242 | 311,587 | |
| Outturn | SOPS 1.1 | 329,144 | 293,510 |
| Under / (over) spend against estimate | 31,098 | 18,077 |
The total estimate columns include virements. Virements are the reallocation of provision in the estimates that do not require Parliamentary authority (as Parliament does not vote to that level of detail and delegates this power to HM Treasury). Further information on virements can be found in the estimates manual.
The outturn vs estimate column is based on the total including virements. The estimate total prior to virements is included to provide comparison to the estimates as laid before Parliament.
SOPS 1. Net outturn by estimate line
Table 36: SOPS 1.1 analysis of net resource outturn by estimate line
| 2021-22 resource outturn administration gross £’000 | 2021-22 resource outturn administration income £’000 | 2021-22 resource outturn administration net £’000 | 2021-22 resource outturn programme gross £’000 | 2021-22 resource outturn programme income £’000 | 2021-22 resource outturn programme net £’000 | 2021-22 resource outturn programme net total £’000 | 2021-22 total £’000 | 2021-22 estimate virements £’000 | 2021-22 estimate total inc. virements £’000 | 2021-22 outturn vs. estimate, saving/(excess) £’000 | Prior year outturn total 2020-21 £’000 | |
|---|---|---|---|---|---|---|---|---|---|---|---|---|
| Voted: | ||||||||||||
| A: Tolled crossings | - | - | - | 39,410 | (146,184) | (106,774) | (106,774) | (101,641) | - | (101,641) | 5,133 | (77,560) |
| B: Local authority transport | - | - | - | 460,539 | (22) | 460,517 | 460,517 | 476,653 | - | 476,653 | 16,136 | 519,395 |
| C: Highways England (net) | 45,292 | - | 45,292 | 2,347,998 | - | 2,347,998 | 2,393,290 | 2,595,725 | - | 2,595,725 | 202,435 | 2,291,640 |
| D: Funding of other ALBs (net) | 996 | - | 996 | (16,838) | - | (16,838) | (15,842) | (1,465) | - | (1,465) | 14,377 | 15,619 |
| E: Other railways | - | - | - | 333,164 | (193,170) | 139,994 | 139,994 | 161,204 | - | 161,204 | 21,210 | 86,679 |
| F: Sustainable travel | - | - | - | 148,322 | (2,719) | 145,603 | 145,603 | 159,150 | (2,832) | 156,318 | 10,715 | 183,175 |
| G: Bus subsidies and concessionary fares | - | - | - | 762,701 | (7,616) | 755,085 | 755,085 | 811,401 | - | 811,401 | 56,316 | 1,531,819 |
| H: GLA transport grants | - | - | - | 1,719,404 | - | 1,719,404 | 1,719,404 | 2,106,465 | - | 2,106,465 | 387,061 | 2,459,882 |
| I: Crossrail | - | - | - | 1,863 | (29,701) | (27,838) | (27,838) | (27,587) | - | (27,587) | 251 | (899) |
| J: Aviation, maritime, security and safety | - | - | - | 284,387 | (67,022) | 217,365 | 217,365 | 242,602 | - | 242,602 | 25,237 | 259,831 |
| K: Maritime and Coastguard Agency | 7,922 | (459) | 7,463 | 377,754 | (15,918) | 361,836 | 369,299 | 389,891 | - | 389,891 | 20,592 | 371,753 |
| L: Motoring agencies | - | - | - | 1,164,221 | (1,134,883) | 29,338 | 29,338 | 154,033 | - | 154,033 | 124,695 | 193,379 |
| M: Science, research and support functions | - | - | - | 25,515 | (369) | 25,146 | 25,146 | 28,369 | - | 28,369 | 3,223 | 23,096 |
| N: Central administration | 285,198 | (11,844) | 273,354 | 72,972 | (26,878) | 46,094 | 319,448 | 460,376 | - | 460,376 | 140,928 | 287,903 |
| O: Support For passenger rail services | - | - | - | 4,509,724 | - | 4,509,724 | 4,509,724 | 5,670,835 | - | 5,670,835 | 1,161,111 | 8,459,067 |
| P: High Speed Rail | - | - | - | (5,064) | - | (5,064) | (5,064) | 18,497 | - | 18,497 | 23,561 | 67,168 |
| Q: Transport Development Fund | - | - | - | 47,556 | - | 47,556 | 47,556 | 44,724 | 2,832 | 47,556 | - | 300 |
| R: High Speed Two Limited (net) | 1,834 | - | 1,834 | 217,412 | - | 217,412 | 219,246 | 279,875 | - | 279,875 | 60,629 | 106,785 |
| S: East West Rail Company Limited (net) | 171 | - | 171 | 74,187 | - | 74,187 | 74,358 | 82,526 | - | 82,526 | 8,168 | 36,293 |
| T: Network Rail (net) | - | - | - | 7,299,722 | - | 7,299,722 | 7,299,722 | 7,330,049 | - | 7,330,049 | 30,327 | 6,841,392 |
| Total voted resource DEL | 341,413 | (12,303) | 329,110 | 19,864,949 | (1,624,482) | 18,240,467 | 18,569,577 | 20,881,682 | - | 20,881,682 | 2,312,105 | 23,656,717 |
| Non voted: | ||||||||||||
| U: Funding of ALBs (net) | 34 | - | 34 | 14,454 | - | 14,454 | 14,488 | 15,036 | - | 15,036 | 548 | 14,144 |
| Total resource DEL | 341,447 | (12,303) | 329,144 | 19,879,403 | (1,624,482) | 18,254,921 | 18,584,065 | 20,896,718 | - | 20,896,718 | 2,312,653 | 23,670,861 |
| Spending in annually managed expenditure (AME): | ||||||||||||
| Voted: | ||||||||||||
| V: Highways England (net) | - | - | - | 9,380 | - | 9,380 | 9,380 | 2,897 | 6,483 | 9,380 | - | 22,113 |
| W: Network Rail (net) | - | - | - | 3,136,601 | - | 3,136,601 | 3,136,601 | 3,983,416 | - | 3,983,416 | 846,815 | 1,234,751 |
| X: Funding of other ALBs (net) | - | - | - | 87,277 | - | 87,277 | 87,277 | 101,645 | - | 101,645 | 14,368 | 29,808 |
| Y: Other railways | - | - | - | 409,092 | (209,434) | 199,658 | 199,658 | 230,752 | - | 230,752 | 31,094 | 132,247 |
| Z: Aviation, maritime, security and safety | - | - | - | - | (1,421) | (1,421) | (1,421) | (1,421) | - | (1,421) | - | (1,726) |
| AA: Maritime and Coastguard Agency | - | - | - | 1,212 | - | 1,212 | 1,212 | 13,510 | - | 13,510 | 12,298 | 613 |
| AB: Motoring agencies | - | - | - | (5,476) | - | (5,476) | (5,476) | (2,310) | - | (2,310) | 3,166 | (1,569) |
| AC: Central administration | - | - | - | 17,888 | - | 17,888 | 17,888 | 96,106 | (16,112) | 79,994 | 62,106 | 21,705 |
| AD: High Speed Rail | - | - | - | 13 | - | 13 | 13 | 1,446 | - | 1,446 | 1,446 | (1,188) |
| AE: High Speed Two Limited (net) | - | - | - | 4,264 | - | 4,264 | 4,264 | - | 4,264 | 4,264 | - | 2,906 |
| AF: East West Rail Company Limited (net) | - | - | - | - | - | - | - | 5,001 | - | 5,001 | 5,001 | 11 |
| Total voted resource AME | - | - | - | 3,660,251 | (210,855) | 3,449,396 | 3,449,396 | 4,431,042 | (5,365) | 4,425,677 | 976,281 | 1,439,671 |
| Non voted | ||||||||||||
| AG: Funding of ALBs (net) | - | - | - | 4,874 | - | 4,874 | 4,874 | (491) | 5,365 | 4,874 | - | - |
| Total resource AME | - | - | - | 3,665,125 | (210,855) | 3,454,270 | 3,454,270 | 4,430,551 | - | 4,430,551 | 976,281 | 1,439,671 |
| Total resource outturn | 341,447 | (12,303) | 329,144 | 23,544,528 | (1,835,337) | 21,709,191 | 22,038,335 | 25,327,269 | - | 25,327,269 | 3,288,934 | 25,110,532 |
Table 37: SOPS 1.2: analysis of net capital outturn by estimate line
| Resource Outturn | Estimate | Outturn vs. Estimate, saving / (excess) | Prior year Outturn Total, 2020 to 2021 | |||||||||
|---|---|---|---|---|---|---|---|---|---|---|---|---|
| Administration | Programme | total | Virements | Total inc. virements | ||||||||
| Gross | Income | Net | Gross | Income | Net | Net Total | ||||||
| £’000 | £’000 | £’000 | £’000 | £’000 | £’000 | £’000 | £’000 | £’000 | £’000 | £’000 | £’000 | |
| Spending in Departmental Expenditure Limit (DEL): | ||||||||||||
| Voted: | ||||||||||||
| A: Tolled Crossings | - | - | - | 39,410 | -146,184 | -106,774 | -106,774 | -101,641 | - | -101,641 | 5,133 | -77,560 |
| B: Local Authority Transport | - | - | - | 460,539 | -22 | 460,517 | 460,517 | 476,653 | - | 476,653 | 16,136 | 519,395 |
| C: National Highways (net) | 45,292 | - | 45,292 | 2,347,998 | - | 2,347,998 | 2,393,290 | 2,595,725 | - | 2,595,725 | 202,435 | 2,291,640 |
| D: Funding of other ALBs (net) | 996 | - | 996 | -16,838 | - | -16,838 | -15,842 | -1,465 | - | -1,465 | 14,377 | 15,619 |
| E: Other Railways | - | - | - | 333,164 | -193,170 | 139,994 | 139,994 | 161,204 | - | 161,204 | 21,210 | 86,679 |
| F: Sustainable Travel | - | - | - | 148,322 | -2,719 | 145,603 | 145,603 | 159,150 | -2,832 | 156,318 | 10,715 | 183,175 |
| G: Bus Subsidies & Concessionary Fares | - | - | - | 762,701 | -7,616 | 755,085 | 755,085 | 811,401 | - | 811,401 | 56,316 | 1,531,819 |
| H: GLA Transport Grants | - | - | - | 1,719,404 | - | 1,719,404 | 1,719,404 | 2,106,465 | - | 2,106,465 | 387,061 | 2,459,882 |
| I: Crossrail | - | - | - | 1,863 | -29,701 | -27,838 | -27,838 | -27,587 | - | -27,587 | 251 | -899 |
| J: Aviation, Maritime, Security and Safety | - | - | - | 284,387 | -67,022 | 217,365 | 217,365 | 242,602 | - | 242,602 | 25,237 | 259,831 |
| K: Maritime and Coastguard Agency | 7,922 | -459 | 7,463 | 377,754 | -15,918 | 361,836 | 369,299 | 389,891 | - | 389,891 | 20,592 | 371,753 |
| L: Motoring Agencies | - | - | - | 1,164,221 | -1,134,883 | 29,338 | 29,338 | 154,033 | - | 154,033 | 124,695 | 193,379 |
| M: Science, Research and Support Functions | - | - | - | 25,515 | -369 | 25,146 | 25,146 | 28,369 | - | 28,369 | 3,223 | 23,096 |
| N: Central Administration | 285,198 | -11,844 | 273,354 | 72,972 | -26,878 | 46,094 | 319,448 | 460,376 | - | 460,376 | 140,928 | 287,903 |
| O: Support For Passenger Rail Services | - | - | - | 4,509,724 | - | 4,509,724 | 4,509,724 | 5,670,835 | - | 5,670,835 | 1,161,111 | 8,459,067 |
| P: High Speed Rail | - | - | - | -5,064 | - | -5,064 | -5,064 | 18,497 | - | 18,497 | 23,561 | 67,168 |
| Q: Transport Development Fund | - | - | - | 47,556 | - | 47,556 | 47,556 | 44,724 | 2,832 | 47,556 | - | 300 |
| R: High Speed Two Limited (net) | 1,834 | - | 1,834 | 217,412 | - | 217,412 | 219,246 | 279,875 | - | 279,875 | 60,629 | 106,785 |
| S: East West Rail Company Limited (net) | 171 | - | 171 | 74,187 | - | 74,187 | 74,358 | 82,526 | - | 82,526 | 8,168 | 36,293 |
| T: Network Rail (net) | - | - | - | 7,299,722 | - | 7,299,722 | 7,299,722 | 7,330,049 | - | 7,330,049 | 30,327 | 6,841,392 |
| Total Voted Resource DEL | 341,413 | -12,303 | 329,110 | 19,864,949 | -1,624,482 | 18,240,467 | 18,569,577 | 20,881,682 | - | 20,881,682 | 2,312,105 | 23,656,717 |
| Non-Voted: | ||||||||||||
| U: Funding of ALBs (net) | 34 | - | 34 | 14,454 | - | 14,454 | 14,488 | 15,036 | - | 15,036 | 548 | 14,144 |
| Total Resource DEL | 341,447 | -12,303 | 329,144 | 19,879,403 | -1,624,482 | 18,254,921 | 18,584,065 | 20,896,718 | - | 20,896,718 | 2,312,653 | 23,670,861 |
| Spending in Annually Managed Expenditure (AME): | ||||||||||||
| Voted:- | ||||||||||||
| V: National Highways (net) | - | - | - | 9,380 | - | 9,380 | 9,380 | 2,897 | 6,483 | 9,380 | - | 22,113 |
| W: Network Rail (net) | - | - | - | 3,136,601 | - | 3,136,601 | 3,136,601 | 3,983,416 | - | 3,983,416 | 846,815 | 1,234,751 |
| X: Funding of other ALBs (net) | - | - | - | 87,277 | - | 87,277 | 87,277 | 101,645 | - | 101,645 | 14,368 | 29,808 |
| Y: Other Railways | - | - | - | 409,092 | -209,434 | 199,658 | 199,658 | 230,752 | - | 230,752 | 31,094 | 132,247 |
| Z: Aviation, Maritime, Security and Safety | - | - | - | - | -1,421 | -1,421 | -1,421 | -1,421 | - | -1,421 | - | -1,726 |
| AA: Maritime and Coastguard Agency | - | - | - | 1,212 | - | 1,212 | 1,212 | 13,510 | - | 13,510 | 12,298 | 613 |
| AB: Motoring Agencies | - | - | - | -5,476 | - | -5,476 | -5,476 | -2,310 | - | -2,310 | 3,166 | -1,569 |
| AC: Central Administration | - | - | - | 17,888 | - | 17,888 | 17,888 | 96,106 | -16,112 | 79,994 | 62,106 | 21,705 |
| AD: High Speed Rail | - | - | - | 13 | - | 13 | 13 | 1,446 | - | 1,446 | 1,433 | -1,188 |
| AE: High Speed Two Limited (net) | - | - | - | 4,264 | - | 4,264 | 4,264 | - | 4,264 | 4,264 | - | 2,906 |
| AF: East West Rail Company Limited (net) | - | - | - | - | - | - | - | 5,001 | - | 5,001 | 5,001 | 11 |
| Total Voted Resource AME | - | - | - | 3,660,251 | -210,855 | 3,449,396 | 3,449,396 | 4,431,042 | -5,365 | 4,425,677 | 976,281 | 1,439,671 |
| Non-Voted: | ||||||||||||
| AG: Funding of ALBs (net) | - | - | - | 4,874 | - | 4,874 | 4,874 | -491 | 5,365 | 4,874 | - | |
| Total Resource AME | - | - | - | 3,665,125 | -210,855 | 3,454,270 | 3,454,270 | 4,430,551 | - | 4,430,551 | 976,281 | 1,439,671 |
| Total Resource Outturn | 341,447 | -12,303 | 329,144 | 23,544,528 | -1,835,337 | 21,709,191 | 22,038,335 | 25,327,269 | - | 25,327,269 | 3,288,934 | 25,110,532 |
DVSA is consolidated for the first time in 2021 to 2022: its resource outturn is reported within ‘L: Motoring Agencies’ and ‘AB: Motoring Agencies’. National Highways is still referred to as Highways England in the estimates process.
Variances
The department estimates the costs for each budget type and monitors these throughout the year. Final budgets for the year are authorised through the supplementary estimate. Significant variances between outturn and estimates before virements are set out in the tables below.
Table 38: Resource DEL outturn, estimates and variances
| Expenditure Line | Outturn | Estimate | Variance (over)/ under | Explanation of variance |
|---|---|---|---|---|
| £’000 | £’000 | |||
| Resource DEL | ||||
| Highways England | 2,393,290 | 2,595,725 | 202,435 | Depreciation on the Strategic Road Network was lower than forecast, arising from changes in the methodology used to calculate structure conditions and improved survey data |
| GLA transport grants | 1,719,404 | 2,106,465 | 387,061 | The estimate was based on a scenario of reduced passenger volumes for the last quarter of the year due to prolonged impacts of Omicron, which did not materialise |
| Motoring Agencies | 29,338 | 154,033 | 124,695 | There is a net underspend for this estimate line due to various factors including both higher incomes and lower expenditures: Motoring Agencies underspent by £50 million on operational expenditure and realised better than planned income (£20 million) for Sale of Marks. Additionally, £44 million less than planned was spent on Information and Advice sites for EU Transition as the number of live sites reduced |
| Central Administration | 319,448 | 460,376 | 140,928 | The non-cash impairment expense for the adjustment of Land & Property inventory assets to net realisable value was lower than the maximum authorised under the Estimate. |
| Support for Passenger Rail Services | 4,509,724 | 5,670,835 | 1,161,111 | The Estimate was based on a scenario of reduced passenger volumes for the last quarter of the year due to prolonged impacts of Omicron, which did not materialise |
| Resource AME | ||||
| Network Rail | 3,136,601 | 3,983,416 | 846,815 | Derivatives and interest outturn were lower than allowed for in the estimate |
| Capital DEL | ||||
| Local Authority Transport | 1,810,158 | 1,662,491 | (147,667) | Increased approved expenditure on Local Maintenance compared to planned levels through the estimate |
| Highways England | 3,184,289 | 3,045,722 | (138,567) | Delivery ahead of schedule on renewals and Major Projects in the final quarter of the year due to better weather conditions and fewer delays due to Omicron than anticipated |
| Sustainable Travel | 788,934 | 987,192 | 198,258 | Delayed spend on areas, such as Clean Air Zones, because implementation dates shifted post estimate |
| Support for Passenger Rail Services | 296,649 | 464,182 | 167,533 | Operators’ capital requirements were lower than authorised at the estimate |
| Capital AME | ||||
| Highways England | (156,443) | 89,025 | 245,468 | National Highways experienced delays to some new CPO acquisitions for road schemes compared with forecasts submitted for the estimate |
SOPS 2: reconciliation of outturn to net operating expenditure
As noted in the introduction to the SOPS above, outturn and the estimates are compiled against the budgeting framework, which is related to the IFRS-based FReM accounting framework. Therefore, this reconciliation bridges the gap between the resource outturn and net operating expenditure, linking the SOPS to the financial statements.
Table 39: SOPS 2 reconciliation of outturn to net operating expenditure
| 2021 to 2022 | 2020 to 2021 (restated) | |||
|---|---|---|---|---|
| Note | (£000) | (£000) | ||
| Total resource outturn | SOPS 1.1 | 22,038,335 | 25,110,532 | |
| Add: | Capital grants | 3.3 | 3,933,944 | 3,783,359 |
| Research and development | 3.2 | 105,126 | 56,697 | |
| Research and development grants | 3.3 | 18,546 | 13,618 | |
| EU grants | 3.3 | 1,427 | 1,155 | |
| Capital subsidies for rail operators | 321,519 | 135,519 | ||
| Share of loss in associates | 2,865 | 46,607 | ||
| less: | Capital income | (481,862) | (526,394) | |
| Non-budget CFER income | (179,129) | (436,696) | ||
| Other adjustments | N/A | 90,520 | ||
| Net expenditure in the statement of comprehensive expenditure | SOCNE | 25,760,771 | 28,274,917 |
Capital grants, research and development and EU capital grants are budgeted for as capital DEL but accounted for as expenditure in the SOCNE, and therefore function as a reconciling item between resource and net operating expenditure. The increase in capital subsidies to rail operators reflects the DfT’s capital payments towards fixed assets at the end of some ERMA contracts.
Capital income is budgeted for as capital DEL but accounted for as income in the SOCNE, and therefore functions as a reconciling item between resource and net operating expenditure. Network Rail and National Highways received material levels of capital incom - these relate to contributions from other bodies towards capital projects.
Other adjustments of £91 million in the restated 2020 to 2021 comparatives reflects the prior-year restatement for the first time consolidation of DVSA. The department confirmed with HM Treasury that this additional expenditure in the prior period does not comprise a non-budget outturn in 2021 to 2022, because the restatement arises in respect of a statistical reclassification of DVSA by ONS.
The non-budget CFER income of £179 million in 2021 to 2022 comprises £192 million of CFERs recognised in-year (as shown on the face of the SOCTE) less £12 million of general lighthouse fund loan repayments credited to the balance sheet and £1 million of loan interest that is classified as RAME.
Share of profit and loss in associates is not included in budgets and has no impact on outturn.
SOPS 3: reconciliation of net outturn to net cash requirement
As noted in the introduction to the SOPS above, outturn and the estimates are compiled against the budgeting framework, not on a cash basis. Therefore, this reconciliation bridges the gap between the resource and capital outturn and the net cash requirement.
Table 40: SOPS 3 reconciliation of net outturn to net cash requirement
| Note | Net outturn (£) | Estimate (£) | Net outturn vs estimate (£) | |
|---|---|---|---|---|
| Resource outturn | SOPS 1.1 | 22,038,335 | 25,327,269 | 3,288,934 |
| Capital outturn | SOPS 1.2 | 19,229,428 | 19,771,109 | 541,681 |
| Total outturn | 41,267,763 | 45,098,378 | 3,830,615 | |
| Accruals to cash adjustments for core department and agencies | ||||
| Depreciation, amortisation and impairments | 3.4 | (219,327) | (328,538) | (109,211) |
| Provisions (non-cash movements) | 23 | (489,958) | (139,561) | 350,397 |
| Other non-cash items | 3, 4 | 3,777 | (54,935) | (58,712) |
| Adjustments to reflect movements in working capital balances in core department and agencies | ||||
| Increase / (decrease) in receivables | 17 | (414,814) | 635,000 | 1,049,814 |
| (Increase) / decrease in payables | 19, 20 | 407,724 | 1,544,555 | 1,136,831 |
| Utilisation of provisions | 23 | 259,408 | 256,123 | (3,285) |
| Adjustments for arm’s length bodies: | ||||
| Remove: voted resource and capital | N/A | (27,075,353) | (28,163,512) | (1,088,159) |
| Add: grant-in-aid, grants and loans to ALBs | 3.3, 11 | 24,889,646 | 18,246,636 | (6,643,010) |
| Less: repayments from ALBs to DfT | 11 | (8,254,604) | N/A | 8,254,604 |
| Removal of non-voted budget items | ||||
| Remove non-voted spending | N/A | (19,363) | (14,545) | 4,818 |
| CFER income included in budgets | N/A | 13,088 | N/A | (13,088) |
| Net cash requirement | N/A | 30,367,987 | 37,079,601 | 6,711,614 |
SOPS 4: income payable to the consolidated fund
Table 41: SoPS 4.1 analysis of income payable to the consolidated fund
In addition to income retained by the department, the following income is payable to the consolidated fund is displayed below.
| 2021 to 2022 | 2020 to 2021 | |||
|---|---|---|---|---|
| Income accrued | Cash received | Income accrued | Cash received | |
| £’000 | £’000 | £’000 | £’000 | |
| Operating income outside the ambit of the estimate – resource | 180,549 | 419,028 | 438,421 | 178,368 |
| Operating income outside the ambit of the estimate – capital | 11,667 | 11,667 | 20,000 | 20,000 |
| Total income payable to the consolidated fund | 192,216 | 430,695 | 458,421 | 198,368 |
The income above includes:
- £150 million of fees relating to the sale and transfer of personalised registration marks by DVLA(2020 to 2021: £150 million). Amounts earned by DVLA above £150 million are retained by the department and are reinvested in transport activities
- £13 million in loan repayments and interest payments made to the department from the general lighthouse fund (2020 to 2021: £22 million)
- £23.5 million penalty income levied following the termination of the fepartment’s rail contract with London and South Eastern Railway Ltd
SOPS 4.2: consolidated fund income
The consolidated fund income shown in SOPS 4.1 above does not include any amounts collected by the department where it was acting as agent for the consolidated fund rather than as principal. The amounts collected as agent for the consolidated fund (which are otherwise excluded from these financial statements) were:
Table 42: SOPS 4.2 consolidated fund income
| Consolidated fund income | 2021 to 2022 (£000) | 2020 to 2021 (£000) |
|---|---|---|
| Licence fees, penalties and fines | 214,400 | 80,922 |
| Costs of collection – where deductible | (42,184) | (17,460) |
| Amounts payable to the consolidated fund | 172,215 | 63,462 |
| Balance held at the start of the year | 6,618 | 5,141 |
| Payments into the consolidated fund | (172,096) | (61,985) |
| Balance held on trust at the end of the year | 6,737 | 6,618 |
The amount payable to the Consolidated Fund (net income) above includes:
- £120 million levied under the Renewable Transport Fuel Obligation (2020 to 2021 £43 million)
- £45 million of late licensing penalties and enforcement activities (net of cost of collection) relating to the vehicle excise duty (VED) collected by the DVLA (2020 to 2021: £16 million)
- £5 million of graduated fixed penalties and deposits income in DVSA (2020 to 2021: £4 million)
- £3 million of COVID-19 related-fines levied on air passengers by the CAA, which were surrendered to HM Treasury via the department (2020 to 2021: £nil)
In addition to the values above, the DVLA collects VED and pays it directly to the consolidated fund. Further details are given in the trust statement within the DVLA financial statements.
Parliamentary accountability disclosures
In addition to the statement of outturn against Parliamentary supply, all of the following sections are subject to audit, i.e. losses and special payments, fees and charges, and remote contingent liabilities.
Losses and special payments
This section reports the total number of cases and value of losses and special payments, and details of any losses or special payments that exceed £300,000.
Losses statement
Losses may relate to cash and store losses, bookkeeping losses, losses arising from a failure to make adequate charge for the use of public property or services, fruitless payments, claims abandoned and frauds. The increase in the total amount of losses is largely driven by non-recurring amounts relating to the HS2 and railway network assets, as described below.
| 2021 to 2022 | 2020 to 2021 (restated) | |||
|---|---|---|---|---|
| Core department and agencies | Departmental group | Core department and agencies | Departmental group | |
| Total number of cases | 8,934 | 44,442 | 10,952 | 41,846 |
| Total amount £000 | 54,642 | 397,158 | 41,833 | 112,796 |
Dartford-Thurrock river crossing charging scheme
The department suffers losses due to motorists’ failure to pay amounts due on the Dartford-Thurrock river crossing charging scheme following the introduction of a free-flowing scheme from 1 December 2014 to reduce congestion. Until 30 November 2014, drivers using the Dartford-Thurrock river crossing had to stop at barriers to pay the road-user charge, which resulted in significant levels of congestion.
From 1 December 2014, a new scheme was introduced. The scheme introduced a barrier-less, free-flowing charging operation (Dart Charge) which requires drivers to pay for their crossing during chargeable hours, either in advance or by midnight the day after using the crossing. Road users have access to a variety of methods to pay the charge including:
- payments online – via phone or at retail outlets
- payments by registered customer accounts
If a payment is not made in the allotted time, the scheme operator will issue a penalty charge notice (PCN). If required, penalty and recovery processes are employed to enforce the charging scheme and collection of charges.
After a period of time, when the scheme operator considers that it is no longer able to collect against the PCN, it then regards the charge as being irrecoverable and writes off the amount that was due.
The 2021 to 2022 losses include £41,933,000 in relation to 2020 to 2021 Dartford Crossing charges (2020 to 2021: £34,954,000 in relation to 2019 to 2020).
Of this, £40,333,000 relates to the write-off of receivables for both road user charges and PCNs that became irrecoverable, and an estimated amount of up to £1,600,000 relates to PCNs that were not issued (2020 to 2021: £32,754,000 and £2,200,000 respectively in relation to 2019 to 2020).
There are several circumstances in which PCNs are not issued, including:
- vehicle keeper details not being available
- poor images
- mis-read number plates
- system errors
- illegal activity / evasion (for example, cloned vehicles)
The increase in write offs is largely due to limitations on enforcement activity due to COVID-19 restrictions in 2020 to 2021.
EU exit – contingency planning
From 2019 to 2020, contingency measures were put in place to handle potential for disruption to haulage following the UK’s departure from the EU. These included rental, security and staffing of additional lorry parking facilities near Ashford.
As this border readiness measure was not operationally required for most of the year, the associated costs during that period of £2,907,740 (2020 to 2021: £5,405,400) are recognised as constructive losses in the table above.
HS1 domestic underpinnings
High Speed One (HS1) Ltd is the current concession holder for the Channel Tunnel Rail Link, which carries high speed domestic and international rail services between London and the Channel Tunnel. Under the domestic underpinning agreement between HS1 Ltd and the Secretary of State for Transport, HS1 Ltd receives income from DfT if the minimum number of domestic high speed rail paths is not met by rail operators in a timetable period.
Due to the impact of COVID-19 on passenger demand, the domestic high speed operating timetable was below this threshold during financial year 2021 to 2022. As required through this arrangement, the department paid HS1 Ltd £8,954,570.06 during the year. Accordingly, this amount is recorded as a constructive loss in the table above.
Network Rail
Network Rail incurred a total of £190 million costs on development and design options for the Transpennine route upgrade that were not taken forward in the final programme design. These amounts are included as a constructive loss in the table above.
Of this £190 million:
- £50 million was expenditure on the design and project management of upgrades that are no longer relevant
- £140 million was expenditure on developing programme options between 2016 to 2017 and 2019 to 2020 that became obsolete following changes in scope
Network Rail incurred two additional losses above £300,000. One loss for £730,313 relates to a fine in April 2021, following an investigation by the Office of Rail and Road into a safety incident at Godinton substation in Kent at the end of 2018. Network Rail also incurred one store loss of goods valued at £300,000.
High Speed Two (HS2)
There was one case above £300,000 during the reporting period under losses. There is a non-cash impairment charge of £105.6 million including VAT, which relates to the design change for Euston Station that was formally instructed by DfT on 3 September 2021 in order to provide an alternate and more efficient option after a study led by the SRO. The assessment for the value is based on expert opinions of the design team and consultations with the HS2 design engineers.
National Highways Ltd
There was one book-keeping loss greater than £300,000 in the period to 31 March 2022. The book-keeping loss for £9.6 million relates to aged unreconciled VAT balances.
Special payments
Table 44: Special payments
Special payments include extra-contractual, special severance, ex gratia and compensation payments.
| 2021 to 2022 | 2020 to 2021 (restated) | |||
|---|---|---|---|---|
| Core department and agencies | Departmental group | Core department and agencies | Departmental group | |
| Total number of cases | 5,350 | 5,517 | 5,338 | 5,498 |
| Total amount £000 | 8,204 | 23,851 | 16,000 | 19,058 |
Core department – Industrial disease and injury claims
A total of £7,566,252.41 was paid to settle 148 industrial disease and injury claims from former British Rail employees (2020 to 2021: 194 cases totalling £13,000,996), of which 3 cases exceeded £300,000. Note 22 of the financial statements provides further information about these claims.
National Highways Ltd
There were 2 special payments with a value greater than £300,000 which related to early reservation of a land fill site as part of the Lower Thames Crossing project (£2.4 million) and for the impact on a housing development at the A27 Arundel bypass (£11.7 million).
Fees and charges information
The majority of the departmental group’s income, described at Note 4, arises either under contract or resulting from railway industry regulation. The table below describes the subset of the departmental group’s income relating to fees and charges made directly to public service users, which are within the scope of managing public money, and describes both the income relating to those services, along with the full cost of providing them. It does not constitute an IFRS 8 (operating segment reporting) disclosure.
Table 45: Fees and charges information
| 2021 to 2022 | 2020 to 2021 (restated) | |||||
|---|---|---|---|---|---|---|
| Income (£ million) | Full cost (£ million) | Surplus/ (deficit) (£ million) | Income (£ million) | Full cost (£ million) | Surplus/ (deficit) (£ million) | |
| MCA | ||||||
| Fees and charges | 7 | 8 | (1) | 5 | 5 | – |
| VCA | ||||||
| Product certification | 20 | 22 | (2) | 20 | 22 | (2) |
| DVLA | ||||||
| Fees and charges | 441 | 307 | 134 | 365 | 285 | 80 |
| DVSA | ||||||
| Fees and charges | 380 | 365 | 15 | 169 | 360 | (191) |
| 848 | 702 | 146 | 559 | 672 | (113) |
MCA and VCA fees and charges are set in line with a full cost recovery objective. DVLA is required to target full cost recovery of its fees and charges on a pooled basis for core service delivered.
As described in note 2 of DVLA’s annual report and accounts, the fees received for cherished transfers (personalised registrations) are payable to HM Treasury and the core department.
DVSA levies fees and charges in respect of driving tests and HGV testing. DVSA’s deficit in 2020 to 2021 was due to slowdown of activity during the COVID-19 pandemic. Activity increased during 2021 to 2022.
Additional information regarding these fees and charges (including the financial objective and performance against this) can be found in the published financial statements for each of the agencies.
Remote contingent liabilities
Contingent liabilities are presented here where the likelihood of a transfer of economic benefit in settlement is judged remote. They do not meet the IAS 37 (provisions, contingent liabilities and contingent assets) criteria for disclosure in the financial statements but are presented here for transparency purposes.
These predominantly relate to situations where guarantees or indemnities have been entered into by the department, but where there are no significant indications that these will be drawn upon. Contingent liabilities for which the probability of crystallisation is rated as greater than remote are disclosed in note 23 in the financial statements.
Quantifiable remote contingent liabilities
This table summarises quantifiable remote contingent liabilities by their nature and purpose, with the amounts disclosed reflecting the highest reasonable estimate of the possible liability.
Table 46: Quantifiable remote contingent liabilities
| Quantifiable remote contingent liabilities | Note | 31 March 2022 (£ million) | 31 March 2021 (£ million) |
|---|---|---|---|
| Inter city express eolling stock | In 2012 the Secretary of State agreed to quantifiable (disclosed) and unquantifiable assurances, warranties, indemnities and potential losses under the Inter City Express Rolling Stock contracts with Agility Consortium and previously with Network Rail, covering the termination of the contract due to force majeure events and unavailability of commercial insurance. They expire in 2044 | 5,900 | 5,900 |
| HS1 | The HS1 concession agreement between the Secretary of State and HS1 Ltd specifies that the Secretary of State would be liable to pay compensation if the contract were terminated due to legal changes, either in the UK or Europe (‘change in circumstances’) or a change directed by another part of the government (‘government change’). The amount payable is formalised in the agreement, but depends on the cause of the termination, and includes capital expenditure, increases in operating costs and losses of revenue | 4,112 | 4,037 |
| Passenger rail franchise agreements | Rolling Stock The Railways Act 1993 and Transport Act 2000 permit the Secretary of State to give guarantees to promote investments in railway assets, which include undertakings within passenger rail franchise agreements and guarantees to leasing companies. The value of this liability is based on the remaining value of rolling stock and depots covered by these guarantees, which tend to decrease over time. This liability could increase if new rolling stock or depots are introduced, where these are covered by guarantees | 488 | 907 |
| Thameslink | To support the Thameslink programme, in 2013 the Secretary of State agreed to quantifiable (disclosed) and unquantifiable assurances, warranties, indemnities and potential losses with the major stakeholders: Siemens, Network Rail and Cross London Trains. This reflects assurances, warranties and indemnities covering ongoing contracts between the stakeholders | 702 | 724 |
| Passenger rail franchise agreements | Legacy guarantees were given by the Strategic Rail Authority (and previously by the Director of Passenger Rail Franchising), and novated to the department, in relation to new, replacement and extended passenger rail franchise agreements | 141 | 149 |
| Channel tunnel restoration | The department has a statutory liability under the Channel Tunnel Act 1987 that if, after termination of the Channel Tunnel concession, it appears to the Secretary of State that the operation of the Tunnel will not be resumed in the near future, he shall take the necessary steps to ensure that the land is left in a suitable condition in accordance with the scheme | 100 | 100 |
| Premises for IMO | The department provides premises in London for the IMO, a United Nations agency. In view of the fact that government departments generally self-insure, a guarantee has been given to the IMO that should the building be partially or completely destroyed, the department would be obliged to reconstruct the building, or suspend or reduce the rent for a period of 3 years and fund alternative accommodation | 90 | 91 |
| Network Rail | Guarantees issued by Network Rail to its affiliate entities which are not consolidated in these accounts. These obligations primarily relate to banking facilities. Further information about the entities can be found in note 25 | 50 | 51 |
| Business indemnities | Indemnities issued to businesses at rail privatisation by the British Rail Board (Residuary) Ltd, which were transferred to the department when the Board closed in 2013 | 10 | 10 |
| Transport disaster indemnities | Letters of comfort have been issued, providing an indemnity in relation to legal action taken against the judge, counsel, solicitors and secretariat to the Thames safety inquiry and the victim identification inquiry, which reported in 2000 and 2001 respectively, following major transport disasters | 6 | 6 |
| Non-executive member indemnities | Indemnities have been issued to non-executive members of the departmental board, and to civil servants appointed to represent the department on the boards of other organisations | 2 | 2 |
| Other contingent liabilities, including legal claims | N/A | 15 | 15 |
| Total | n/a | 11,616 | 11,992 |
Unquantifiable remote contingent liabilities
The department has obligations under agreements entered into by the Office of Passenger Rail Franchising (also known as the Director of Passenger Rail Franchising) prior to privatisation which indemnified rolling stock companies for the costs of industrial disease claims, personal injury claims and property damage claims. On abolition of the Office of Passenger Rail Franchising in 2001, the obligation novated to the Strategic Rail Authority. On abolition of the Strategic Rail Authority in 2006, the obligation novated to the department.
National Highways, formerly Highways England, holds indemnities embedded within some procurement contracts. These indemnities are a promise by the company to compensate another for losses (such as asset damage, contamination or loss of income) suffered as a consequence of works undertaken on the strategic road network.
The most significant indemnities relate to construction that occurs near to gas and electricity infrastructure, or requires infrastructure to be moved. The approximate value of these indemnities is dependent upon the outcome of uncertain events and as such they cannot be accurately estimated. There have been no claims made against National Highways since its formation (as Highways England) in 2015.
The department is party to a NATO agreement relating to indemnification of civil aircraft in respect of their use on NATO tasks in times of crisis and war.
Marine and Aviation Insurance Act 1952, s1: Government war risk reinsurance for British ship owners insuring their vessels with the British mutual war risks associations (clubs). Under the current agreement with clubs, the government provides 95% reinsurance for Queen’s enemy risks (QER). A contingent liability arises from the continuous QER cover for the hull and machinery value of British flag vessels entered with the Clubs.
The department has statutory responsibility for the maintenance of all railway structures. The contingent liability for this responsibility applies to legacy structures that have been sold to, and are controlled by, external parties. There have been no claims and there is no reasonable basis under which to quantify this risk.
The department has a potential constructive obligation to cover the costs of managing the SS Richard Montgomery, which ran aground off Sheerness in 1944, with a cargo of munitions. The department has funded the costs of marking, guarding, inspections and mitigation works, indicating that it would fund other works as required. The potential cost is considered to be unquantifiable.
Bernadette Kelly DCB
18 July 2022
Permanent Secretary and Principal Accounting Officer
Department for Transport
Great Minster House
33 Horseferry Road
London
SW1P 4DR
Financial statements
Download a spreadsheet of the annual report tables and financial statements (ODS, 122KB).
-
£5,113 million COVID-19 spending on Rail exceeds the £4,805 million Support for Passenger Rail Services in figure 3.1 because the costs recorded in figure 3.1 are net of other contractual adjustments which do not directly relate to the current year COVID-19 subsidy. ↩
-
Projects are deemed to be on track to delivery if they are assessed as amber/red or above. ↩
-
Due to a methodology change, results before March 2020 and result since April 2021 are not directly comparable. Between March 2020 and April 2021, the survey was paused, and moved from face-to-face interviews to an online survey. ↩
-
Data from the Bus Passenger Survey is no longer available. ↩
-
Average delay is in seconds per vehicle per mile and is the difference between speed limit and recorded average journey times. ↩
-
Average delay is in seconds per vehicle per mile and is the difference between speed limit and recorded average journey times. ↩
-
This survey has not been run since the onset of the pandemic. However, weekly user experience surveys have been run by TransportFocus since September 2021, with overall satisfaction in the 85 to 88% range. ↩
-
Metrics includes data from strategic roads, local roads, and Devolved Administrations. ↩
-
Provisional results subject to change. ↩
-
Non-staff includes those who have an injury on one of our sites, such as a visitor or contractor, a DVSA motorcycle test, candidate, or an MCA volunteer. Under some circumstances, these become RIDDOR reportable. ↩
-
Ibid. ↩
-
Based on payroll data April 2021 to March 2022 for DfT(core), DVLA, DVSA, MCA and VCA only. ↩
-
2020 to 2021 figures have been restated to include DVSA which was outside the accounting boundary until 1 April 2021, for 2021 to 2022 DVSA figures are also included. ↩
-
Although a £17,500 bonus was received in 2021 to 2022, no bonus was received in 2020 to 2021 so a percentage difference cannot be calculated. ↩