Methods for compliance assessment against the Air Quality Standards Regulations (2010)
Published 9 October 2026

© Crown copyright 2026
This publication is licensed under the terms of the Open Government Licence v3.0 except where otherwise stated. To view this licence, visit nationalarchives.gov.uk/doc/open-government-licence/version/3 or write to the Information Policy Team, The National Archives, Kew, London TW9 4DU, or email: psi@nationalarchives.gov.uk.
Where we have identified any third party copyright information you will need to obtain permission from the copyright holders concerned.
This publication is available at https://www.gov.uk/government/publications/air-pollution-in-the-uk-2025/methods-for-compliance-assessment-against-the-air-quality-standards-regulations-2010
Compliance with the Air Quality Standards Regulations (2010), is assessed annually using a combination of ambient air quality measurements and air quality modelling.
This compliance assessment determines whether concentrations of regulated pollutants comply with the relevant legal requirements across each of the UK’s 43 air quality reporting zones.
The assessment uses a range of evidence and is designed to provide representative estimates of pollutant concentrations across locations where people or ecosystems may be exposed.
The assessment is undertaken separately for each pollutant defined in the Air Quality Standards Regulations (2010), by comparing concentration levels against limit values, target values, long-term objectives and critical levels; which are set either for the protection of health or ecosystems.
Progress towards additional particulate matter (PM2.5) targets in England, which target reductions in the concentrations of PM2.5 and the population’s exposure, is published separately to this compliance assessment.
1. Data sources
The 2025 compliance assessment is based on a combination of:
- measurements from monitoring stations
- air quality modelling
The air quality assessment for compliance against the Air Quality Standards Regulations (2010) is derived from a combination of measured pollutant concentrations from the national monitoring networks together with modelling using the CMAQ-Urban model.
Where both measurements and CMAQ-Urban modelled results are available, the assessment of compliance is based on the higher concentration of the two.
This applies to the assessment of all pollutants except nitrogen dioxide (NO2) at the roadside. When NO2 measurements are available, then these are always used to estimate NO2 concentrations for the entire length of a given road, in preference to the CMAQ-Urban model output (see nitrogen oxides section 7 for details of this approach).
2. Monitoring
Location of monitoring stations
Monitoring stations used within the assessment must be located in accordance with the ‘siting requirements’ specified in the Air Quality Standards Regulations (2010).
Macro-scale siting
Macro-scale siting includes ensuring there are air quality monitors in the areas representative of the exposure of the general population. Monitoring is not conducted in very small micro-environments. Sampling points targeted at the protection of ecosystems or vegetation have a separate set of criteria.
Micro-scale siting
Micro-scale siting includes ensuring the flow around the inlet sampling probe is unrestricted without any obstructions affecting the airflow in the vicinity of the inlet. That is, some metres away from buildings, balconies, trees and other obstacles.
Representativeness of the surrounding area
Representativeness of the surrounding area means avoiding measuring in localised micro-environments.
Monitoring station ‘site types’
Monitoring stations are assigned a site type which is determined by both:
- environment type
- air pollution source type
Environment types for monitoring stations
Urban
A continuously built-up urban area meaning complete (or at least highly predominant) building-up of the street front side by buildings with at least 2 floors or large detached buildings with at least 2 floors - for the measurement of ozone, this is defined as locations such as residential and commercial areas of cities, parks (away from the trees), big streets or squares with very little or no traffic.
Suburban
A largely built-up area mixed with non-urbanised areas (for example agricultural, lakes, woods), with a lower building density than an urban area – for the measurement of ozone, suburban areas include where population, sensitive crops or natural ecosystems are located in the outer fringe of an agglomeration.
Rural
Areas of vegetation and natural ecosystems more than 20 km away from agglomerations and more than 5 km away from other built-up areas, industrial installations, motorways or major roads.
Air pollution source type for monitoring stations
Background
A site located such that its pollution level is not influenced significantly by any single source or street, but rather by the integrated contribution from all sources upwind of the station.
Traffic
A site located such that its pollution level is determined predominantly by the emissions from nearby traffic (roads, motorways, highways). Air sampled at traffic sites must be representative of air quality for a street segment no less than 100 m length. Sampling probes shall be at least 25 m from the edge of major junctions and no more than 10 m from the kerbside.
Industrial
A site located such that its pollution level is influenced predominantly by emissions from nearby single industrial sources or industrial areas with many sources. Industry sources include sources like power generation, incinerators and waste treatment plants.
Monitoring instruments
Air quality concentrations are measured using reference measurement methods, or methods that have been demonstrated to be equivalent to the relevant reference methods, in accordance with the Air Quality Standards Regulations (2010).
Monitoring is undertaken at the locations described above. Each monitoring station may have multiple sampling points; that is to say that they may contain one or more analysers measuring different air pollutants.
See UK standards for air quality continuous monitoring instruments for further information on the reference methods, equivalent methods, type approval requirements and monitoring techniques used within the UK monitoring networks.
A small number of monitoring stations operate multiple analysers for the same pollutant. These parallel measurements support quality assurance and quality control activities, including:
- instrument performance checks
- auditing
- verification of measurement consistency
This helps ensure that the monitoring data used for compliance assessment are accurate, reliable and comparable across the monitoring network.
Data quality
The Air Quality Standards Regulations (2010) establishes data quality objectives. These requirements are intended to ensure measurements are sufficiently complete to support assessment of annual means, exceedance statistics and other compliance metrics. These cover matters such as:
- measurement uncertainty
- minimum data capture
- minimum time coverage
- comparability of methods
- quality assurance and quality control procedures
Monitoring equipment used for regulatory assessment are expected to operate under documented quality systems, with calibration, audit and validation procedures in place to ensure that reported concentrations are fit for purpose. The detailed performance criteria vary between pollutants and measurement techniques.
Classification of sampling points
Measurements are classified according to the data quality objectives achieved by the monitoring method. This distinguishes between:
Fixed measurements
Measurements meeting all of the data quality objectives, with equal to or above 85 per cent data capture. These measurements are used for compliance decisions.
Indicative measurements
Indicative measurement being measurements which are performed at reduced regularity (that is, annual data capture of above 75 per cent but below 85 per cent) but fulfil the other data quality objectives. These measurements are used for compliance decisions.
The UK Urban NO2 Network (UUNN) also provides additional supplementary data at roadside locations across the UK for assessment against the NO2 limit value. Data from UUNN monitoring stations are always treated as indicative measurements.
Objective estimation measurements
Measurements that do not meet the data quality objectives are not taken forward for compliance assessment – this includes data from monitoring stations with less than 75 per cent annual data capture.
Number of monitoring stations
Air quality must be assessed within each of the UK’s 43 reporting zones (see section 4). Within the monitoring regime assessment, each zone is assigned a threshold assessment status, which is based on the level of pollution and the number of people living within the zone.
For ozone, the number of fixed measurements required within a zone for assessment against the ozone target values and long term objectives is determined by whether the zone had exceeded the long term objectives in any of the 5 years preceding this assessment.
For all other pollutants, zones can either be:
- below the lower assessment threshold
- between the upper and lower assessment threshold
- above the upper assessment threshold
The Air Quality Standards Regulations (2010) requires fixed measurements (see the above definition) which can be supplemented by modelling or indicative measurements of a pollutant in zones that have been classified as being ‘above the upper assessment threshold’.
In zones below the ‘lower assessment threshold’, modelling or objective estimation techniques or both may be used instead of measurement.
Between the upper and lower assessment thresholds, a combination of measurements and modelling may be used.
3. Modelling
The UK’s monitoring programmes are supplemented by air quality modelling as set out under the Air Quality Standards Regulations (2010).
There are several benefits of using modelling to complement the monitoring data gathered across the UK national monitoring networks.
Modelling allows:
- an assessment of levels of pollutants where monitoring does not take place – while monitoring networks are extensive, a monitoring site might not fully represent the wider region in which it is located due to local characteristics such as buildings affecting dispersion, localised or temporary sources
- information about the sources of pollutants to inform policy development
- an assessment of levels of pollutants both now and in future years to develop policies across government to continue to improve air quality in the UK
How the model works
The CMAQ-Urban model is used for the compliance assessment in 2025 for the first time.
This model uses emissions data, meteorological data, topography data, and an understanding of chemistry and physics, to estimate concentrations of air pollutants across the UK.
Estimates are calculated for pollutant concentrations at various spatial resolutions, for the relevant metrics for assessment against limit values, target values, long term objectives and critical levels.
There are 4 types of model output calculated.
Background concentrations for all pollutants
Background concentrations are modelled using a 1x1 km spatial resolution, representing ambient air quality concentrations at background locations.
Roadside concentrations for some pollutants (PM10, PM2.5, NO2, Benzene)
The model calculates concentrations at the roadside of major urban roads in the UK for pollutants that have significant traffic-related sources.
Industrial model outputs
In 2025, more detailed modelling was conducted at a finer spatial scale around industrial locations known to cause exceedances of nickel.
BaP was also modelled around industrial locations in Port Talbot, to confirm that there are no exceedances following the reporting of compliance of this zone in 2024.
This provides additional evidence on whether concentrations are high in the areas that the public may be exposed.
Vegetation model outputs
These are at a 1x1 km spatial resolution and represent ambient air quality concentrations at background locations in relevant ecosystem areas. These areas include locations that are more than 20km away from agglomerations or more than 5km away from other built-up areas, industrial sites or roads with high traffic volumes.
The model has been designed to assess compliance at locations defined by the Air Quality Standards Regulations (2010) as relevant for air quality assessment. Monitoring station data is used to validate modelled concentrations, and data quality is assessed.
For more information on the modelling methods and for access to the data, see the air quality compliance assessment 2025: modelled data and reports.
Modelled data is also made available in accessible formats within air quality compliance assessment 2025: results and data tables.
4. Assessment methodology
Compliance in 2025 is assessed against the specific pollutant metrics defined in the Air Quality Standards Regulations (2010), as shown in the table below.
Table 1: UK limit values, target values, critical levels and long-term objectives
| Pollutant | Objective type | Metric / threshold | Aggregation required for reporting |
|---|---|---|---|
| Nitrogen dioxide (NO2) | Hourly limit value | 200 µg/m³ not to be exceeded more than 18 hours per year | Number of hourly exceedances in 2025 |
| Nitrogen dioxide (NO2) | Annual limit value | 40 µg/m³ annual mean | Annual average concentration in 2025 |
| Nitrogen oxides (NOx) (vegetation protection) | Annual critical level | 30 µg/m³ annual mean | Annual average concentration in 2025 |
| Sulphur dioxide (SO2) | Hourly limit value | 350 µg/m³ not to be exceeded more than 24 hours per year | Number of hourly exceedances in 2025 |
| Sulphur dioxide (SO2) | Daily limit value | 125 µg/m³ not to be exceeded more than 3 days per year | Number of daily exceedances in 2025 |
| Sulphur dioxide (SO2) (ecosystem protection) | Critical level | 20 µg/m³ winter mean | Winter-period average concentration in 2025 |
| Ozone (O3) | Target value for human health | Maximum daily running 8-hour mean of 120 µg/m³, not to be exceeded on more than 25 days per calendar year averaged over 3 years | Number of exceedance days (2023, 2024 and 2025 average) |
| Ozone (O3) | Target value for protection of vegetation | AOT40 (May to July, daylight hours) | AOT40 value (µg/m³·hours) (2023, 2024 and 2025 average) |
| Ozone (O3) | Long-term objective (LTO) | Maximum daily running 8-hour mean of 120 µg/m³, with no exceedances | Number of exceedance days in 2025 |
| Ozone (O3) | Vegetation protection target / LTO | AOT40 (May to July, daylight hours) | AOT40 value in 2025 (µg/m³·hours) |
| Benzene | Annual limit value | 5 µg/m³ annual mean | Annual average concentration in 2025 |
| Carbon monoxide (CO) | Maximum daily 8-hour mean limit value | 10 mg/m³ | Maximum daily 8-hour running mean in 2025 |
| Lead (Pb) | Annual limit value | 0.5 µg/m³ annual mean | Annual average concentration in 2025 |
| Arsenic (As) in PM10 | Annual target value | 6 ng/m³ annual mean | 2025 annual average concentration in PM10 |
| Cadmium (Cd) in PM10 | Annual target value | 5 ng/m³ annual mean | 2025 annual average concentration in PM10 |
| Nickel (Ni) in PM10 | Annual target value | 20 ng/m³ annual mean | 2025 annual average concentration in PM10 |
| Benzo[a]pyrene (BaP) in PM10 | Annual target value | 1 ng/m³ annual mean | 2025 annual average concentration in PM10 |
| PM10 | Daily limit value | 50 µg/m³ not to be exceeded more than 35 days per year | Number of daily exceedances in 2025 |
| PM10 | Annual limit value | 40 µg/m³ annual mean | Annual average concentration in 2025 |
| PM2.5 | Annual limit value | 20 µg/m³ annual mean | Annual average concentration in 2025 |
| PM2.5 | National exposure reduction target (NERT) | Percentage reduction in AEI between baseline year (2010) and target year (2020) | Average exposure indicator (AEI): 3-year running mean of annual urban background PM2.5 concentrations averaged across designated AEI stations |
For each pollutant and metric, the assessment combines the available evidence to estimate the highest relevant concentration within each zone (see section 4) and determine whether the applicable legal threshold has been met. Where any line of evidence indicates an exceedance, that evidence is considered within the overall compliance determination.
The method for compliance assessment for each pollutant can be found on the respective page, as linked in Table 1.
In England, there are also targets set in the Environmental Targets (Fine Particulate Matter) (England) Regulations 2023. Progress on these targets are reported separately to this publication. See the Accredited Official Statistics for more information on these targets and the progress made so far.
5. The UK’s 43 reporting zones
The UK is divided into 43 zones for air quality assessment.
Each of the limit values, target values, and long term objectives are assessed independently within each of the 43 zones of the UK.
The critical levels set for the protection of vegetation are assessed within non-agglomeration areas only.
There are 28 agglomeration zones (these are large urban areas, defined as a conurbation with a population in excess of 250,000 inhabitants) and 15 non-agglomeration zones (with a population of less than 250,000 inhabitants). These are shown in Figure 1 and Table 2.
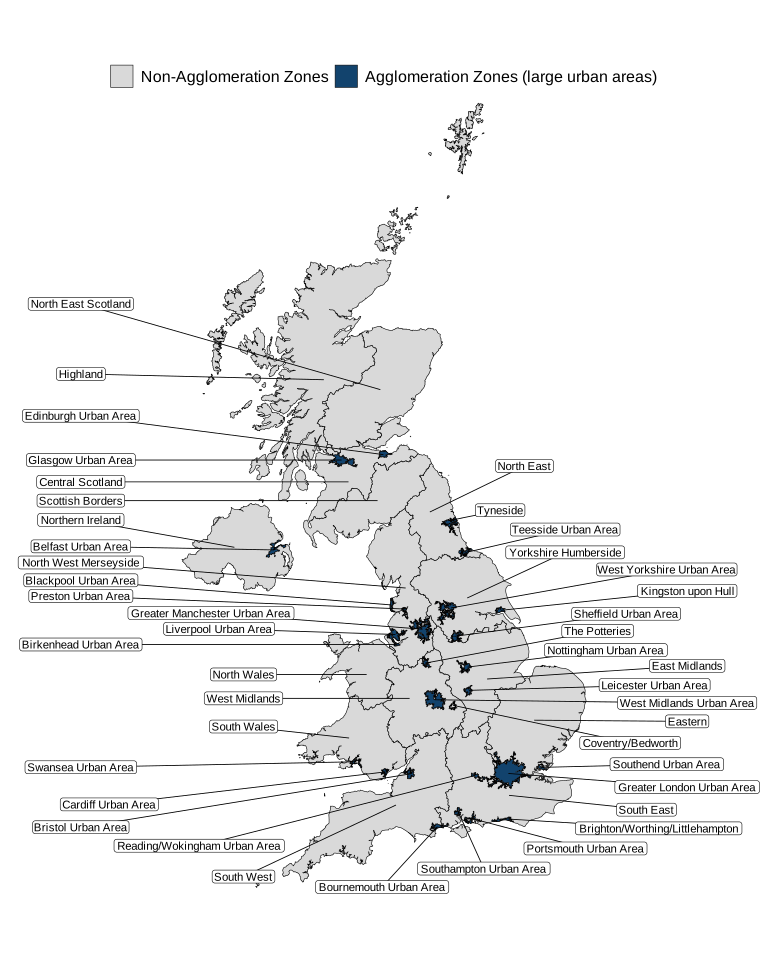
Figure 1: The UK’s 43 air quality reporting zones: 23 agglomeration zones (large urban areas) and 15 non-agglomeration zones
Table 2: The UK’s air quality reporting zones
| Zone name | Zone type | Size of zone (km2) |
|---|---|---|
| Greater London Urban Area | Agglomeration | 1618 |
| West Midlands Urban Area | Agglomeration | 605 |
| Greater Manchester Urban Area | Agglomeration | 554 |
| West Yorkshire Urban Area | Agglomeration | 352 |
| Tyneside | Agglomeration | 222 |
| Liverpool Urban Area | Agglomeration | 199 |
| Sheffield Urban Area | Agglomeration | 163 |
| Nottingham Urban Area | Agglomeration | 155 |
| Bristol Urban Area | Agglomeration | 139 |
| Brighton/Worthing/Littlehampton | Agglomeration | 94 |
| Leicester Urban Area | Agglomeration | 101 |
| Portsmouth Urban Area | Agglomeration | 98 |
| Teesside Urban Area | Agglomeration | 120 |
| The Potteries | Agglomeration | 91 |
| Bournemouth Urban Area | Agglomeration | 122 |
| Reading/Wokingham Urban Area | Agglomeration | 82 |
| Coventry/Bedworth | Agglomeration | 76 |
| Kingston upon Hull | Agglomeration | 85 |
| Southampton Urban Area | Agglomeration | 79 |
| Birkenhead Urban Area | Agglomeration | 97 |
| Southend Urban Area | Agglomeration | 67 |
| Blackpool Urban Area | Agglomeration | 75 |
| Preston Urban Area | Agglomeration | 60 |
| Glasgow Urban Area | Agglomeration | 367 |
| Edinburgh Urban Area | Agglomeration | 134 |
| Cardiff Urban Area | Agglomeration | 86 |
| Swansea Urban Area | Agglomeration | 84 |
| Belfast Urban Area | Agglomeration | 217 |
| Eastern | Non-Agglomeration | 19530 |
| South West | Non-Agglomeration | 24564 |
| South East | Non-Agglomeration | 19185 |
| East Midlands | Non-Agglomeration | 15472 |
| North West & Merseyside | Non-Agglomeration | 13585 |
| Yorkshire & Humberside | Non-Agglomeration | 15040 |
| West Midlands | Non-Agglomeration | 12229 |
| North East | Non-Agglomeration | 8441 |
| Central Scotland | Non-Agglomeration | 10046 |
| North East Scotland | Non-Agglomeration | 19066 |
| Highland | Non-Agglomeration | 44091 |
| Scottish Borders | Non-Agglomeration | 11437 |
| South Wales | Non-Agglomeration | 12753 |
| North Wales | Non-Agglomeration | 8766 |
| Northern Ireland | Non-Agglomeration | 14558 |