Particulate matter as PM10 compliance assessment 2025
Published 9 October 2026

© Crown copyright 2026
This publication is licensed under the terms of the Open Government Licence v3.0 except where otherwise stated. To view this licence, visit nationalarchives.gov.uk/doc/open-government-licence/version/3 or write to the Information Policy Team, The National Archives, Kew, London TW9 4DU, or email: psi@nationalarchives.gov.uk.
Where we have identified any third party copyright information you will need to obtain permission from the copyright holders concerned.
This publication is available at https://www.gov.uk/government/publications/air-pollution-in-the-uk-2025/particulate-matter-as-pm10-compliance-assessment-2025
This compliance assessment is part of Air pollution in the UK 2025. There is a page for each of 12 pollutants.
This page provides the UK’s compliance assessment for 2025 against the limit values for particulate matter less than 10 micrometres in diameter (PM10).
The compliance criteria is set in the Air Quality Standards Regulations (2010).
The Air Quality Standards Regulations (2010) require reporting of compliance on an annual basis. This report continues the series of annual compliance reporting.
1. PM10 pollution and its impacts
Particulate matter (PM) is a mixture of solid particles and liquid droplets suspended in air. It effectively includes everything in the air that is not a gas and therefore consists of a huge variety of chemical compounds and materials, some of which can be toxic.
Particulates are classified according to size. The UK regulates the fractions of PM where particles are less than 10 micrometres in diameter (PM10) and less than 2.5 micrometres in diameter (PM2.5), which is based on evidence on the effects of PM to health.
Due to the small size of many of the particles that form PM, these particles may enter the bloodstream and be transported around the body, lodging in the heart, brain and other organs. Therefore, exposure to PM can result in serious impacts on health, especially in vulnerable groups of people such as the young, elderly, and those with respiratory problems.
The UK has been compliant with PM10 limit values for over a decade. Nonetheless, public health benefits would be expected from further reductions, given that the available evidence has not identified a threshold below which no adverse health effects occur.
2. Sources of PM10 pollution
The release of pollutants into the atmosphere is known as emissions. Annual UK emissions of PM10 are estimated each year and are presented in Defra’s Accredited Official Statistics publication, Emissions of Air Pollutants. The latest estimates currently available are for 2024.
The National Atmospheric Emissions Inventory reports emissions of PM10 from human activities in the UK, but there are a few exceptions included as memo items, such as international shipping and aviation. The information presented here does not include memo items.
PM10 emissions across the UK have decreased by 69 per cent from 1990 to 2024.
Emissions of PM10 originate from a wide range of activity sources. Sources include the burning of wood or other fuels in residential or industrial settings. Emissions of PM10 from road transport include tailpipe emissions, but the majority comes from tyre and brake wear, and road abrasion. Quarrying activity can be a source of PM10 emissions, as can construction activity; of which, most emissions come from the construction of roads and non-residential buildings. Natural sources include wind-blown dust, sea salt, pollens, and soil particles.
PM10 can be ‘primary’ (emitted directly to the atmosphere) or ‘secondary’ (formed by the chemical reaction of other pollutants in the air). The National Atmospheric Emissions Inventory only estimates primary emissions.
PM10 typically remains in the atmosphere for a longer time than gases (such as nitrogen dioxide) and therefore can be transported further from the location it was first emitted. A proportion of the PM10 that we experience in the UK comes from transboundary sources, such as continental Europe. Previously deposited PM10 can also be resuspended into the air by activities such as road transport.
3. Trends in PM10 pollution
PM10 pollution has improved over recent decades. PM10 is typically higher at roadside monitoring sites compared to those in urban background locations.
Average annual mean concentrations of PM10 measured at the roadside steadily declined from 36.7 µg/m3 in 1997 to 15.8 µg/m3 in 2025.
PM10 measured at urban background locations reduced from 29.9 µg/m3 to 13.2 µg/m3 across the same period.
The annual air quality statistics published for particulate matter provide further information on trends in the pollutant as measured by the Automatic Urban and Rural Network (AURN).
4. Spatial variation in PM10 across the UK in 2025
Concentrations of PM10 can vary across different environments and parts of the UK. Concentrations are typically higher in the south and east, since this is closer to Europe (PM10 can travel to the UK from other countries).
Concentrations tend to be higher in urban environments due to their being more emissions in urban environments.
Figure 1 shows modelled annual mean PM10 concentrations in 2025 for each 1x1km grid square of the UK. The data comes from the CMAQ-Urban Model used for supplementary assessment against the PM10 limit values set for the protection of health, as set out in section 6. Figure 1 shows higher concentrations in the southeast and around major road links, while lower concentrations are experienced in the north and west.
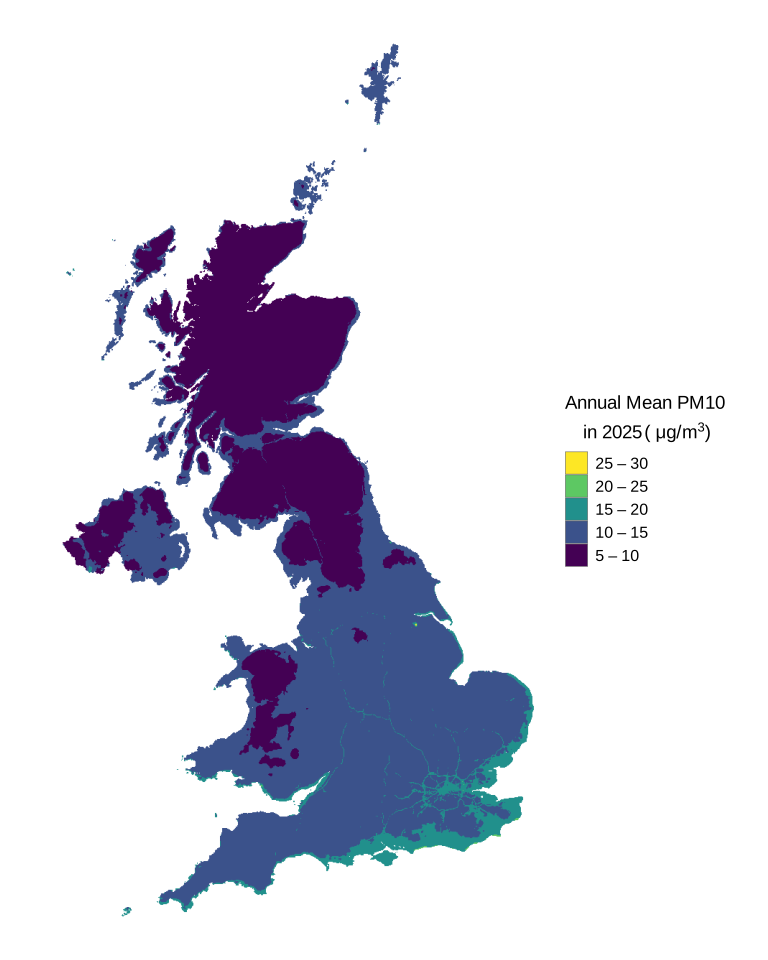
Figure 1: Modelled annual mean PM10 concentrations for 2025
Note that Figure 1 shows the modelled annual average background concentration of PM10 in each 1x1 km grid square of the UK. Within the grid squares, there may be local areas of higher concentration close to specific emission sources, such as construction sites or busy roads. These will not be visible in the background maps.
5. Episodes of PM10 pollution in 2025
This section looks at short term episodes of moderate, or above, PM10 pollution in the UK. Air pollution is communicated on the Daily Air Quality Index (DAQI), a simple scale that explains the short-term health risk of air pollution in words, numbers and colours.
See the guidance on pollutant concentrations for the DAQI.
Figure 2 is a calendar view of the DAQI for PM10 concentrations in 2025.
Each day in the year is represented by a coloured square. The majority of squares are coloured green, denoting that on most days all AURN monitoring sites recorded PM10 concentrations that fell within the ‘low’ pollution band. However, there were also 54 days which recorded ‘moderate’ PM10 concentrations, 6 days which recorded ‘high’ PM10 concentrations, and 5 days which recorded ‘very high’ PM10 concentrations. The ‘very high’ concentrations occurred on 16 January, 23 March, and the first 3 days in December. The month of March exhibited widespread concentrations at ‘moderate’ concentrations or above.
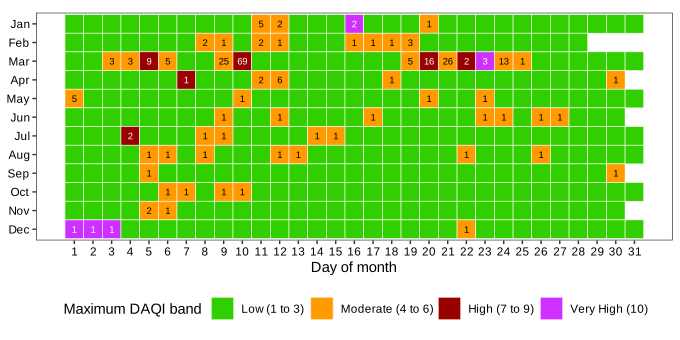
Figure 2: Calendar plot of the DAQI for PM10 at AURN monitoring sites in 2025
Note 1: The colour of each square represents the maximum DAQI across the national network. The number shown in each square is the total number of stations which recorded a ‘moderate’ concentration or above.
Figure 3 presents the daily mean PM10 concentration at all AURN monitoring sites in March and April 2025. Figure 3 shows how PM10 concentrations across most AURN sites tended to vary in a similar way.
For example, on 10 March 2025, it is clear that elevated PM10 concentrations were measured across most AURN monitoring sites. This is most likely due to the weather conditions during this period; the Met Office note that March was characterised by extensive high pressure, which would have resulted in less dispersion and may have brought pollutants from mainland Europe.
There were also numerous reports of wildfires across the UK in March, which may have contributed to elevated PM10 concentrations.
The ‘very high’ concentration recorded on 23 March was isolated to just a single AURN site in Aberdeen, which was corroborated by similar concentrations recorded at locally managed sites. The high PM10 concentrations on this day may have been in part influenced by sea salt particles due to the direction of the winds over that period.
The ‘very high’ concentrations recorded across the first 3 days of December were isolated to a single site in Bradford, which was not seen in the concentrations recorded at the nearby AURN sites in Leeds. This site also recorded elevated PM2.5 concentrations at the start of December.
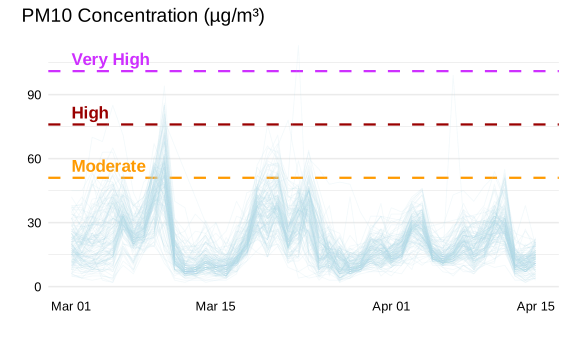
Figure 3: Daily mean PM10 concentration at AURN monitoring sites in March and April 2025
Note 1: Each separate light blue line denotes daily mean concentrations at AURN sites where PM10 is measured. Dotted horizontal lines indicate the minimum respective concentrations for the ‘moderate’, ‘high’, and ‘very high’ DAQI bands.
6. PM10 limit values
Table 1 outlines the limit values set for PM10 concentrations. Compliance against the PM10 limit values is assessed within each zone of the UK; for further information on the definition of agglomeration and non-agglomeration zones please see the methods for 2025 Air Quality Standards Regulations (2010) compliance assessment.
Table 1: PM10 compliance criteria
| Description | Averaging period | Metric |
|---|---|---|
| PM10 limit value | Daily mean | 50 µg/m3, not to be exceeded more than 35 times a calendar year |
| PM10 limit value | Annual mean | 40 µg/m3 |
The rules for assessing compliance are set out in the Air Quality Standards Regulations (2010), as amended.
7. Evidence used for assessing compliance
See the methods for 2025 Air Quality Standards Regulations (2010) compliance assessment.
The evidence base for the annual assessment of compliance against the above PM10 limit values is underpinned by a combination of measurements and the results of modelling assessments and objective estimation. The use of models enables air quality to be assessed at locations without monitoring sites. It has the added benefit of providing additional information on source apportionment and projections to support the development and implementation of air quality policies.
For further information on the data used in the 2025 compliance assessment, see air quality compliance assessment 2025: results and data tables.
Monitoring
In 2025, there were 118 monitoring stations from the AURN network which met the data quality requirements for assessment against the PM10 limit values. This includes:
- 64 background stations
- 29 roadside monitoring stations
- 7 industrial monitoring stations
- 18 rural background monitoring stations
Modelling
The CMAQ-Urban Model was used for compliance assessment against the annual mean limit value in 2025.
For assessment against the limit values for PM10, 2 model outputs were calculated:
- annual average PM10 concentrations for each 1x1km grid square of the UK
- annual average concentrations of PM10 at the roadside, 4m from the kerb, for each major urban road of the UK
For more information on the modelling methods and for access to the data, see the air quality compliance assessment 2025: modelled data and reports.
Modelled data is also made available in accessible formats within the air quality compliance assessment 2025: results and data tables.
Objective estimation
For assessment against the daily limit value for PM10, only fixed measurements are used in most zones (41 out of 43).
However, 2 of the UK’s 43 reporting zones do not have sufficient monitoring to determine compliance, and so objective estimation was performed within these 2 zones. These 2 zones are ‘Bournemouth Urban Area’ and the ‘Scottish Borders’.
Objective estimation is a method of assessing air quality using sources of information other than raw model outputs or fixed or indicative measurements. This may include simple calculations, emissions data, expert judgment, statistical relationships, or modelling. It is only used in areas where the risk of exceedance is low and pollutant concentrations within the zone are below the ‘lower assessment threshold’. See the methods for 2025 Air Quality Standards Regulations (2010) compliance assessment for more information on the threshold assessment classification which determines how many monitors are needed within each zone.
There is a statistical relationship between annual mean PM10 concentrations and exceedances of the daily mean PM10 limit value. Based on this relationship, an annual mean concentration of 31.5 µg/m3 corresponds to an exceedance of the daily limit value.
8. Compliance assessment for 2025
All zones were compliant with the limit value for daily mean PM10 concentrations in 2025.
All zones were compliant with the limit value for annual mean PM10 concentrations in 2025.
Under the Air Quality Standards Regulations (2010), the UK is required to identify any exceedances of PM10 limit values which are due to natural sources (for example, sea salt). Where this is the case, the contribution from natural sources can be subtracted from the total PM10 concentration.
Particulate matter from sea salt is modelled and has been used in the past to determine whether compliance with the limit values has been achieved. However, in 2025 there were no modelled exceedances of either the daily mean or annual mean limit values prior to any natural source correction.
The results of the assessment are also made available within the air quality compliance assessment 2025: results and data tables.
9. Changes in compliance over time
This section provides information on non-compliances in previous years from 2008 onwards. 2008 is the year that limit values for pollutants were set in the EU Air Quality Directive, which was subsequently transposed into UK legislation by the Air Quality Standards Regulations (2010).
Figure 4 summarises the results of the compliance assessment for PM10 in years from 2008 to 2025. All zones have been compliant with the PM10 annual mean limit value since 2008. Three zones exceeded the daily mean PM10 limit value in 2009, but since 2010 all zones have been compliant.
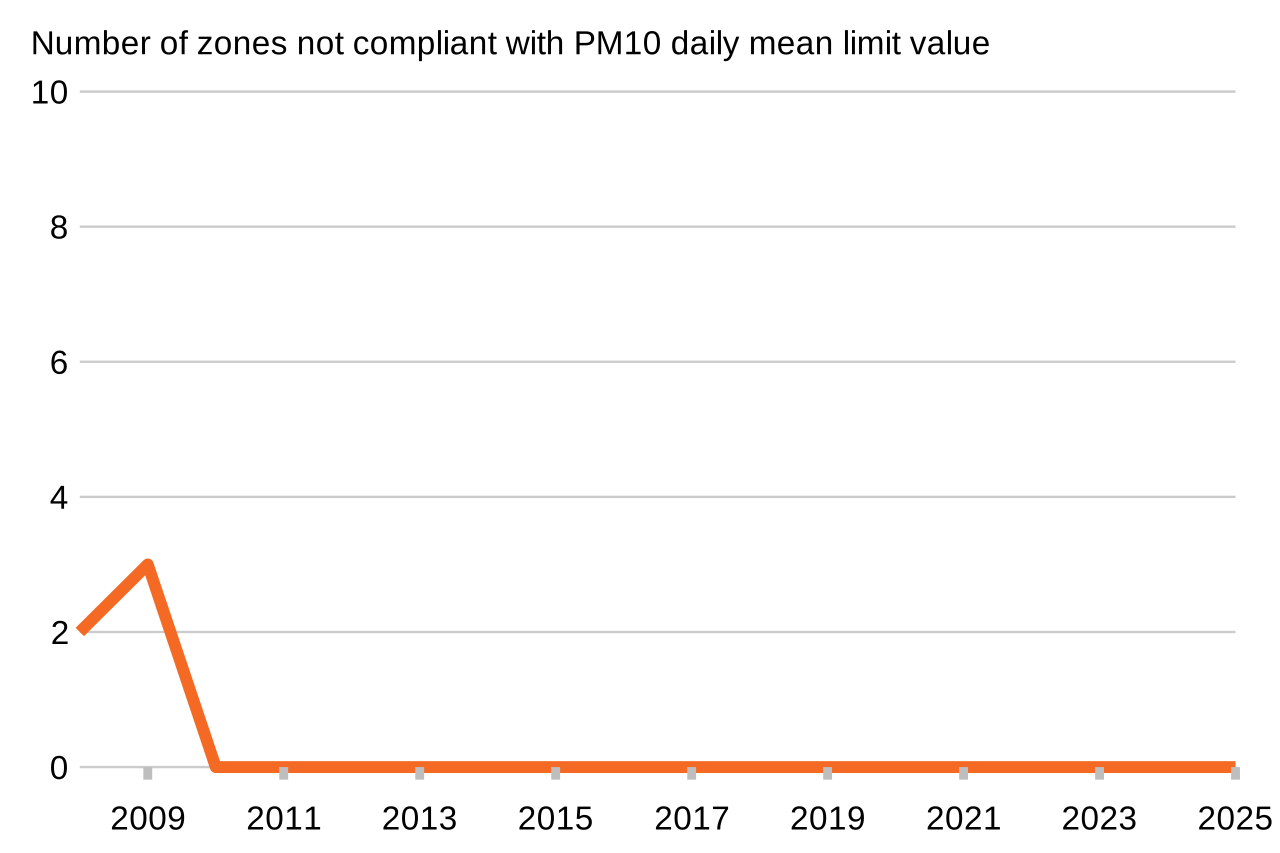
Figure 4: Number of zones not compliant with PM10 daily mean limit value (2008 to 2025)
Note 1: This graph does not include additional zones that were deemed compliant due to concentrations falling within a ‘margin of tolerance’ or after subtraction of natural contributions, or where a time extension had been granted. All time extensions ended in 2012.