Nitrogen oxides (NOx) compliance assessment 2025
Published 9 October 2026

© Crown copyright 2026
This publication is licensed under the terms of the Open Government Licence v3.0 except where otherwise stated. To view this licence, visit nationalarchives.gov.uk/doc/open-government-licence/version/3 or write to the Information Policy Team, The National Archives, Kew, London TW9 4DU, or email: psi@nationalarchives.gov.uk.
Where we have identified any third party copyright information you will need to obtain permission from the copyright holders concerned.
This publication is available at https://www.gov.uk/government/publications/air-pollution-in-the-uk-2025/nitrogen-oxides-nox-compliance-assessment-2025
This compliance assessment is part of Air pollution in the UK 2025. There is a page for each of 12 pollutants.
This page provides the UK’s compliance assessment for 2025 against the:
- nitrogen dioxide (NO2) limit values set for the protection of health
- critical level for nitrogen oxides (NOx) set for the protection of vegetation
The compliance criteria is set in the Air Quality Standards Regulations (2010).
The Air Quality Standards Regulations (2010) require reporting of compliance on an annual basis. This report continues the series of annual compliance reporting.
1. NOx pollution and its impacts
Nitrogen oxides (NOx) refer to a mixture of mainly nitric oxide (NO) and nitrogen dioxide (NO2), both of which are formed during combustion. NO can react with other gases in the atmosphere to form nitrogen dioxide (NO2). These reactions take place very quickly and are reversible, so the 2 gases are referred to together as NOx.
NO is not considered harmful to human health at the concentrations usually found in ambient air.
However, NO2 is a respiratory irritant. The World Health Organisation (WHO) has reported that short-term exposure to concentrations of NO2 higher than 200 µg/m3 can have significant respiratory health effects.
A review of the link between short-term exposure to pollutant concentrations and mortality reported a high level of confidence in an association between NO2 concentrations and increased mortality.
The direct health effects of NO2 at ambient concentrations are harder to identify because it is often emitted from the same sources as other pollutants, such as particulate matter. However, the Committee on the Medical Effects of Air Pollutants (COMEAP) has reported increasing evidence that NO2 itself is responsible for health effects at ambient levels.
NOx can be damaging to the environment. NOx in the air can have a direct toxic effect on plants. NOx can also be deposited into soil and water, and high levels of NOx deposition can harm plants. It contributes to acidification and eutrophication of terrestrial and aquatic ecosystems, damaging habitats and contributing to biodiversity loss.
NOx can also contribute to the formation of other pollutants. In the presence of sunlight, NOx can react with volatile organic compounds (VOCs) to produce photochemical pollutants, including ozone. NOx also contributes to particulate pollution, via the formation of secondary nitrate particles in the atmosphere.
2. Sources of NOx pollution
The release of pollutants into the atmosphere is known as emissions. Annual UK emissions of NOx are estimated each year and are presented in Defra’s Accredited Official Statistics publication, Emissions of Air Pollutants. The latest estimates currently available are for 2024.
The National Atmospheric Emissions Inventory reports emissions of NOx from human activities in the UK, but there are a few exceptions included as memo items, such as forest fires. The information presented here does not include memo items.
NOx comes from a variety of emission sources across the UK, though mainly from burning fossil fuels.
Road transport was a major source of UK emissions of NOx in 2024 , as well as other forms of transport (for example, aviation and shipping).
The burning of fuels in energy industries is also a major source; however, emissions from this source have decreased rapidly in recent years as the UK has moved away from using coal for energy production.
3. Trends in NOx pollution
How NOx concentrations have changed over time since 1990 is shown in Figure 1.
Average measured NOx concentrations have decreased from an annual mean of 178 µg/m3 in 1990, to 26 µg/m3 in 2025.
The average concentration has been calculated using data provided from all monitoring stations in the Automatic Urban and Rural Network that had an annual data capture greater than or equal to 75 per cent .
The shaded areas represent the 90 per cent confidence interval. The intervals narrow over time because of an increase in the number of monitoring stations and a reduction in the variation between annual means at monitoring stations. Trends over time can be influenced by changes to the number of monitoring sites and their locations. The pattern shown here will therefore exhibit some effect of changes to the structure of the monitoring network over time.
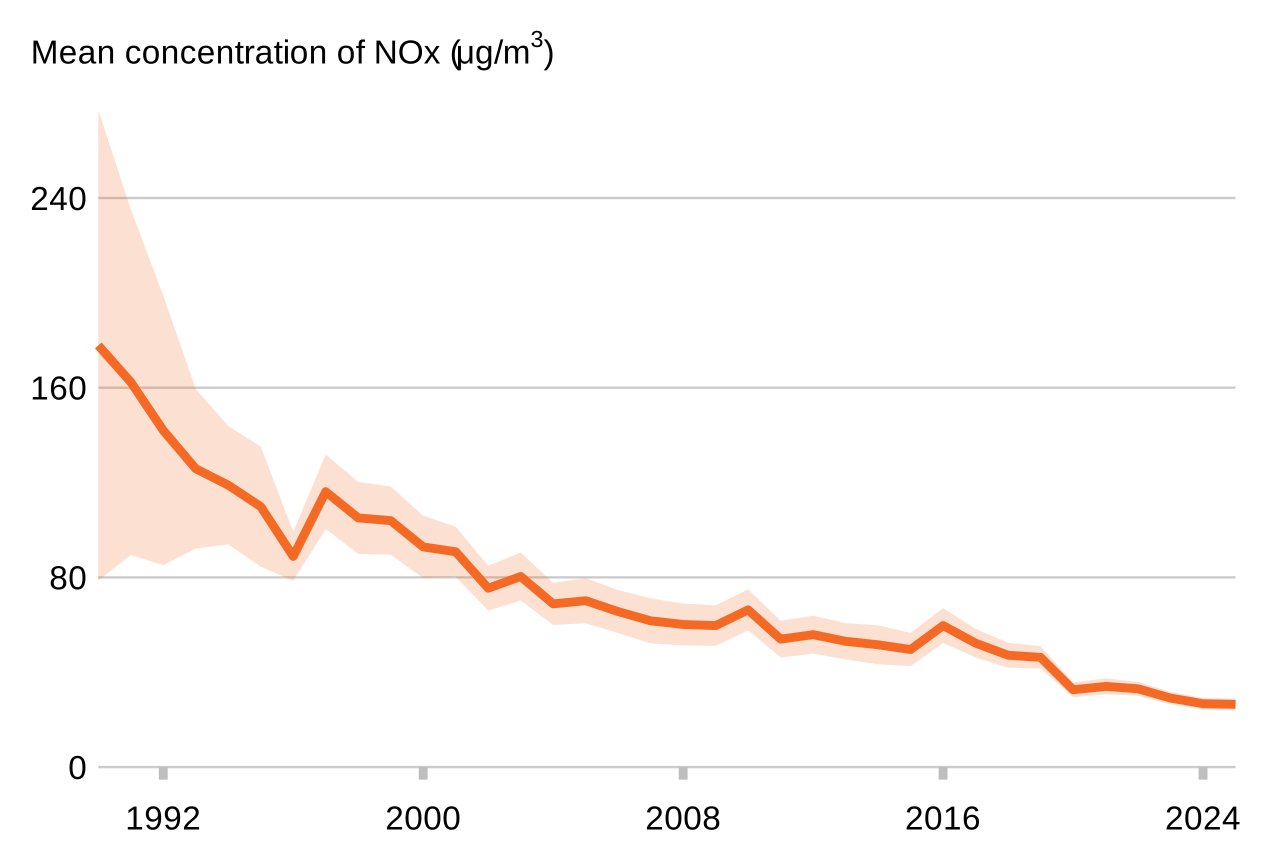
Figure 1: Annual mean concentrations of NOx in the UK, 1990 to 2025
Note 1: NOx is reported as the sum of NO and NO₂, expressed as NO₂-equivalent concentration (µg/m³), consistent with standard air-quality monitoring and assessment practice.
The annual air quality statistics published for NO2 provides further information on trends in NO2 as measured by the AURN since 1990.
NO2 pollution has improved over recent decades. NO2 is typically higher at the roadside and pollution levels are higher during the morning and evening ‘rush hour’, when people are travelling to and from work.
4. Spatial variation of NOx across the UK in 2025
Concentrations of NOx vary across different environments and parts of the UK. As noted above, concentrations are typically higher at the roadside due to the close proximity to road vehicles, which release NOx through exhaust fumes.
Concentrations also tend to be higher in urban environments due to increased road traffic, industry, and other combustion (for example domestic gas boilers).
Figure 2 shows modelled annual mean NO2 concentrations for 2025 for each 1x1 km grid square of the UK. The data comes from the CMAQ-Urban Model, used for supplementary assessment against the limit values set out in section 6.
Figure 2 shows higher concentrations of NO2 in urban areas. Lower concentrations are found in rural areas away from urban centres and major roads.
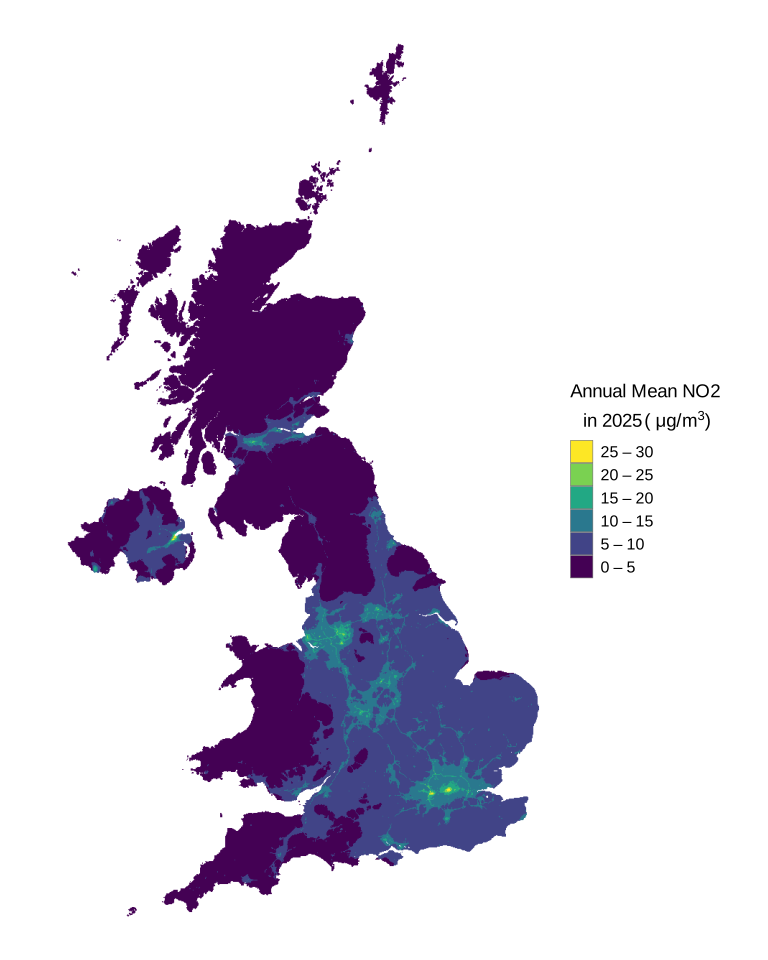
Figure 2: Modelled annual mean NO2 concentrations for 2025
Note that Figure 2 shows the modelled annual average background concentration of NO2 in each 1x1 km grid square of the UK. Within the grid squares, there may be local areas of higher concentration close to specific emission sources, such as busy roads. These will not be visible in the background maps.
NO2 concentrations are also modelled at the side of each major urban road of the UK within the CMAQ-Urban Model. This data supplements the data from monitoring stations and is used to assess compliance against the limit values set for NO2, as set out in sections 7 and 8.
5. Episodes of NO2 pollution in 2025
Air pollution is communicated through the Daily Air Quality Index (DAQI), a simple scale that explains the short-term health risk of air pollution in words, numbers and colours.
See the guidance on pollutant concentrations for the DAQI.
For NO2, the ‘low’ band refers to hourly mean concentrations of 200 µg/m3 or less.
The DAQI is a useful tool to identify short-term exposure to episodes of elevated pollutant concentrations, and to help understand when, where, and why such episodes occur. The DAQI does not, however, identify the long-term exposure risk from ambient NO2 concentrations. This is considered when assessing compliance with the annual mean limit value, which is outlined in section 6.
Figure 3 provides a calendar plot of the DAQI for NO2 concentrations in 2025.
Each day in the year is represented by a coloured square. All the squares in this plot are coloured green, denoting that every AURN monitoring site on every day of the year recorded an NO2 concentration that fell within the ‘low’ pollution band for short-term exposure.
While there were no short-term episodes of elevated NO2 concentrations in 2025 to investigate further, this does not mean that the annual mean limit value was met at all sites.
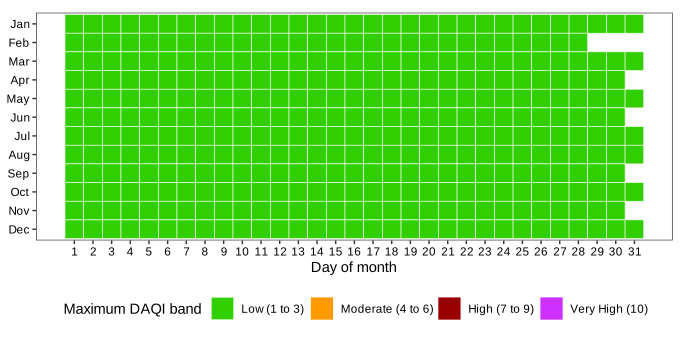
Figure 3: Calendar plot of the DAQI for NO2 at AURN monitoring sites in 2025
Note 1: The colour of each square represents the maximum DAQI across the national network.
Defra issues public information alerts through the Check Air Quality service when pollutant concentrations from monitoring stations breach certain alert thresholds.
The alert threshold for NO2 is when concentrations exceed 400 µg/m3 for 3 consecutive hours over a 100 km2 area or an entire zone, whichever is smaller.
There were no breaches of the alert threshold for NO2 in 2025.
6. NO2 limit values and NOx critical level
This section outlines the limit values set for NO2 concentrations and the critical level set for NOx concentrations, as set out in Table 1.
Compliance against the NO2 limit values is assessed within each zone of the UK.
Compliance against the NOx critical level set for the protection of vegetation is only assessed at areas of relevant ecosystem exposure. This does not include built up urban or industrial areas.
For further information on how critical levels are assessed within zones, see the methods for 2025 Air Quality Standards Regulations (2010) compliance assessment.
Table 1: NO2 and NOx compliance criteria
| Description | Averaging period | Metric | Information |
|---|---|---|---|
| NO2 limit value for health | 1-hour mean | 200 µg/m3 | Hourly mean (average) concentrations of NO2 must not exceed 200 µg/m3 more than 18 times in a calendar year, in any area of relevant public exposure. |
| NO2 limit value for health | Annual mean | 40 µg/m3 | Annual mean (average) concentrations of NO2 over a calendar year must not exceed 40 µg/m3 in any area of relevant public exposure. |
| NOx critical level for vegetation | Annual mean | 30 µg/m3 | Annual mean (average) concentrations of NOx over a calendar year must not exceed 30 µg/m3 in any area of relevant ecosystem exposure. |
Note 1: NOx is reported as the sum of NO and NO₂, expressed as NO₂-equivalent concentration (µg/m³), consistent with standard air-quality monitoring and assessment practice.
The rules for assessing compliance are set out in the Air Quality Standards Regulations (2010).
7. Evidence used for assessing compliance
See the methods for 2025 Air Quality Standards Regulations (2010) compliance assessment.
The evidence base for the annual assessment of compliance against the Air Quality Standards Regulations (2010) is underpinned by a combination of measurements and is supplemented by the results of modelling.
The use of models enables air quality to be assessed at locations without monitoring sites. It has the added benefit of providing additional information on source apportionment and the capability to model future years to support the development and implementation of air quality policies.
For further information on the measurements and the models used in the 2025 compliance assessment, and to download the data, see air quality compliance assessment 2025: results and data tables.
Monitoring
In 2025, there were 143 monitoring stations from the Automatic Urban and Rural Network (AURN) which met the data quality requirements for assessment against the NO2 limit values. This includes:
- 60 background stations
- 63 roadside monitoring stations
- 8 industrial monitoring stations
- 12 rural background monitoring stations
The UK Urban NO2 Network (UUNN) also provides additional supplementary data at roadside locations across the UK for assessment against the NO2 limit value. In 2025, 270 stations from the UUNN network met the data quality requirements for inclusion in the compliance assessment.
For assessment against the NOx critical level, there were 12 monitoring stations used from the AURN network.
Modelling
The CMAQ-Urban Model (which provides both ‘background’ and ‘roadside’ outputs) was used for compliance assessment in 2025.
For assessment against the NO2 annual mean limit value, 2 model outputs are calculated:
- the annual average NO2 concentration for each 1x1km grid square of the UK
- roadside annual average NO2 concentrations for each major urban road of the UK – data is provided for each stretch of road which is at least 100m in length and is not at a junction
For the assessment against the NOx critical level, one model output is calculated:
- the annual average NOx concentration for each 1x1 km grid square of the UK that is at least 20 km away from agglomerations or more than 5 km away from other built-up areas, industrial installations or motorways or major roads with traffic counts of more than 50,000 vehicles per day
For more information on the modelling methods and for access to the data, see the air quality compliance assessment 2025: modelled data and reports.
Modelled data is also made available in accessible formats within air quality compliance assessment 2025: results and data tables.
Approach for NO2 at the roadside
In compliance assessments for years up to and including 2020, both modelled and measured NO2 concentrations were reported for roadside locations. Where both a modelled and measured concentration were available for the same roadside location, the highest concentration was always used to determine compliance status.
This was a conservative approach in which an exceedance was always reported if any of the data indicated one, but it did not differentiate between the quality of the evidence available.
The availability of a new source of evidence – measurements from the UUNN, which was established in 2020 – prompted a review of the approach for NO2.
A study led by Defra and members of the independent Air Quality Expert Group (AQEG), compared the quality of modelled NO2 concentrations from Defra’s compliance model to measured concentrations from the UUNN and AURN. At the time this comparison took place the model used was the Pollution Climate Mapping (PCM) model.
This concluded that the AURN provides the most accurate assessment of NO2 concentrations at a local level, followed by the UUNN, and then the national model.
The method for determining compliance with the annual mean limit value for NO2 was therefore adjusted to reflect this.
In 2025, the model used for assessment changed from the PCM model to CMAQ-Urban. The analysis described above was repeated with the new modelling and the conclusions were found to be consistent, so the approach was retained.
High-quality measurements from the UUNN and AURN continue to provide the best available estimate of representative NO2 concentrations for a given major urban road, with lower uncertainty than concentrations modelled using the CMAQ-Urban approach.
As of 2021, all modelled and measured NO2 concentrations are still reported as part of the assessment, but the order of precedence, for estimating concentration levels for any given major urban road, is as follows:
1. If AURN measurements are available, these have been used to assess compliance in preference to values from either the UUNN or the model for the same major urban road.
2. If UUNN measurements (but not AURN measurements) are available, the UUNN measurements have been used to assess compliance in preference to values from the model for the same major urban road.
3. If no AURN or UUNN measurements are available, concentrations from the model have been used to assess compliance.
This order of precedence only applies to results for the same major urban road. Therefore, the NO2 compliance status of a given zone could still be determined on the basis of CMAQ-Urban modelling, if the highest concentration for that zone was a modelled value for a location without co-located monitoring. No change has been made to the method for determining compliance for other pollutants. This means that the most appropriate evidence-based approach is taken for each pollutant.
8. Compliance assessment for 2025
All non-agglomeration zones were compliant with the critical level for annual mean NOx concentrations in 2025.
All zones were compliant with the 1-hour mean NO2 limit value in 2025.
40 zones met the annual mean limit value for NO2, but the 3 zones that exceeded this limit value were:
- Greater London Urban Area
- Bristol Urban Area
- Glasgow Urban Area
In 2025, some local authorities reported exceedances of the annual mean limit value for NO2 from data collected locally, including data collected as part of the Local Air Quality Management framework. This data is not required to meet the stringent monitoring site location requirements of the Air Quality Standards Regulations (2010) for air quality data to be reported in the national assessment. These requirements seek to represent general exposure to air pollutants and Defra’s national monitoring networks and modelling have been specifically designed to meet these requirements.
Whilst local measurements cannot be included in the national assessment, they remain important in providing a more detailed picture of air quality at a local level, and when developing and evaluating local air quality improvement measures. Work is ongoing, including through the targeted deployment of additional local monitoring through Defra’s UUNN and the recent adoption of a new national model, to ensure that the national assessment is underpinned by the best available evidence.
The results of the assessment are also made available within the air quality compliance assessment 2025: results and data tables.
9. Changes in compliance over time
This section provides information on non-compliance in previous years from 2008 onwards. 2008 is the year that limit values for pollutants were set in the EU Air Quality Directive, which was subsequently transposed into UK legislation by the Air Quality Standards Regulations (2010).
Since 2008, all non-agglomeration zones within the UK have complied with the critical level for annual mean NOx concentration set for the protection of vegetation.
Figure 4 summarises the results of the compliance assessment for NO2 in years from 2008 to 2025.
The blue line in Figure 4 shows that the number of zones exceeding the one-hour mean NO2 limit value has decreased from 3 in 2008, to zero in all years since 2020. The orange line in Figure 4 shows that the number of zones exceeding the annual mean NO2 limit value has decreased from 40 in 2008 to 3 in 2025.
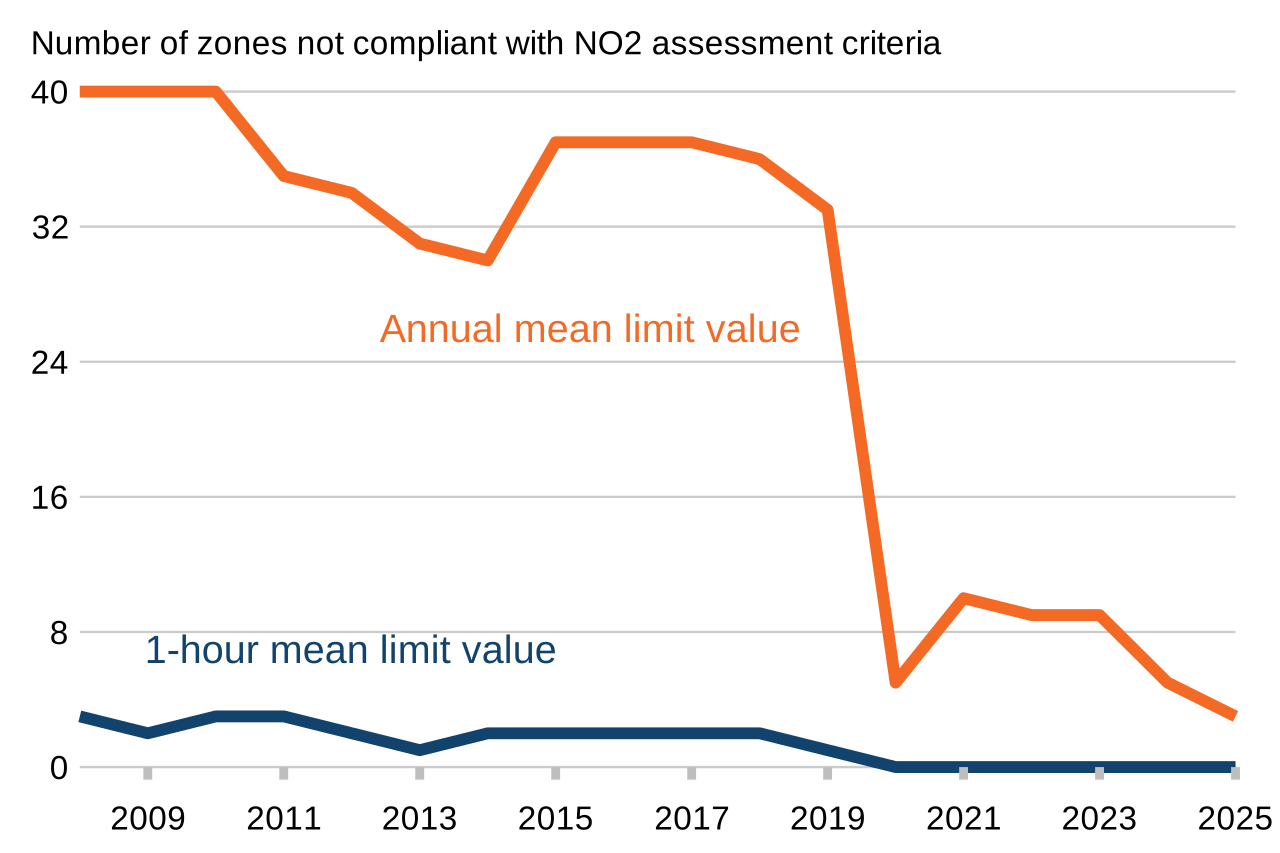
Figure 4: Number of zones not compliant with limit values for NO2 (2008 to 2025)
Note 1: This graph does not include additional zones that were deemed compliant due to concentrations falling within a ‘margin of tolerance’ and where a time extension had been granted. 2015 was the first year with no time extensions for NO2, hence the apparent increase in zones exceeding in 2015.