Ozone (O3) compliance assessment 2025
Published 9 October 2026

© Crown copyright 2026
This publication is licensed under the terms of the Open Government Licence v3.0 except where otherwise stated. To view this licence, visit nationalarchives.gov.uk/doc/open-government-licence/version/3 or write to the Information Policy Team, The National Archives, Kew, London TW9 4DU, or email: psi@nationalarchives.gov.uk.
Where we have identified any third party copyright information you will need to obtain permission from the copyright holders concerned.
This publication is available at https://www.gov.uk/government/publications/air-pollution-in-the-uk-2025/ozone-o3-compliance-assessment-2025
This compliance assessment is part of Air pollution in the UK 2025. There is a page for each of 12 pollutants.
This page provides the UK’s compliance assessment for 2025 against the target values and the long-term objectives for ozone (O3).
The compliance criteria is set in the Air Quality Standards Regulations (2010).
The Air Quality Standards Regulations (2010) require reporting of compliance on an annual basis. This report continues the series of annual compliance reporting.
1. Ozone pollution and its impacts
Ground-level ozone is damaging to human health and can trigger inflammation of the respiratory tract, eyes, nose and throat, as well as asthma attacks in susceptible individuals.
In addition, ozone can have adverse effects on the environment through oxidative damage to vegetation, reducing growth, flowering and seed-setting, including for crops. Ozone can also react with other chemicals in the air to form smog.
Ozone found in the upper atmosphere (stratospheric ozone) provides a beneficial effect to us by protecting us from ultraviolet (UV) radiation from the sun.
Concentrations of ozone presented on this page only refer to those measured at ground level (tropospheric ozone).
2. Sources of ozone pollution
In contrast to many air pollutants measured in the UK, there are no emission sources of ozone itself. Ozone is instead formed in the air from reactions between sunlight (UV radiation) and other pollutants (precursor pollutants):
- Nitrogen oxides (NOx), in particular nitrogen dioxide (NO2)
- Volatile organic compounds (VOCs)
NOx (including NO2) is emitted through the burning of fossil fuels (for example from car exhausts). VOCs can be both man-made (for example from paints and pesticides) and naturally occurring (for example. volcanic emissions and wildfires).
The concentrations of ozone that we experience depend on the balance between chemical reactions that create and destroy ozone.
Ozone is created when NO2 reacts with sunlight, splitting it into nitric oxide (NO) and a single oxygen atom (O). The single oxygen atom is highly reactive and combines with oxygen in the atmosphere (O2) to form ozone (O3).
Ozone is destroyed when NO reacts with O3 and converts it back to NO2 and O2. This cycle would likely result in relatively low levels of ozone, however, VOCs disrupt this cycle by reacting with NO and preventing it from breaking down O3.
The balance of this ozone chemistry is complex, especially in urban environments and along coastlines, but the main factors are:
- precursor pollutants need to be present (NOx and VOCs)
- sunlight is needed to start the chemical reactions
- the speed of the reactions increases with increased temperatures
High ozone concentrations typically occur in the UK during stable atmospheric conditions in spring and summer. These conditions result in less cloud cover and therefore more sunlight can reach the surface to start the reactions. During stable atmospheric conditions, wind speeds are also lower and therefore pollutants can build up. Higher temperatures on sunny days in spring and summer accelerate the reactions further.
Once ozone has formed, it can last in the atmosphere for a few hours to a few weeks.
3. Trends in ozone pollution
Ozone concentrations can vary substantially because of changes in the prevailing weather between years.
However, annual average ozone pollution measured at urban background sites has shown a long-term increase since measurements began in these locations in 1992.
Measurements taken at rural background sites show annual average concentrations have fluctuated since records began at these locations in 1987, but since 2018 concentrations have been consistently amongst the highest on record.
The future trend in concentrations may be increasingly dependent on global emissions of ozone precursor substances.
The annual air quality statistics published for ozone provides further information on trends in the pollutant as measured by the Automatic Urban and Rural Network (AURN).
4. Spatial variation of ozone across the UK in 2025
Concentrations of ozone vary across different environments and parts of the UK.
Concentrations are typically higher in the south and east, since these areas tend to experience warmer temperatures and more hours of sunlight, as well as being closer to Europe (once formed, ozone can travel to the UK from other countries). Concentrations tend to be lower in urban environments in comparison to rural environments, due to the presence of other pollutants (NO in particular) available to break-down ozone.
Figure 1 shows the number of days where ozone concentrations were modelled to be above 120 µg/m3 in 2025, for each 1x1km grid square of the UK. The data comes from the CMAQ-Urban model, and is the model output used for supplementary assessment against the ozone long-term objective set for the protection of health, as set out in sections 7 and 8.
Figure 1 demonstrates the spatial variation of ozone concentrations in 2025. The greatest number of days with concentrations above 120 µg/m3 occurred on the south coast of England (yellow).
However, it should be noted that uncertainty in ozone modelling is significantly higher when modelling concentrations of ozone in coastal regions due to the complexities of sea/land interactions (for example, due to the complex chemistry and meteorology in such coastal locations). Evaluation of the model results indicates that the model has the highest positive bias (consistently reports higher values) along the south coast when compared to data from monitoring stations along that coastal stretch (that is, the model may be overpredicting in those locations).
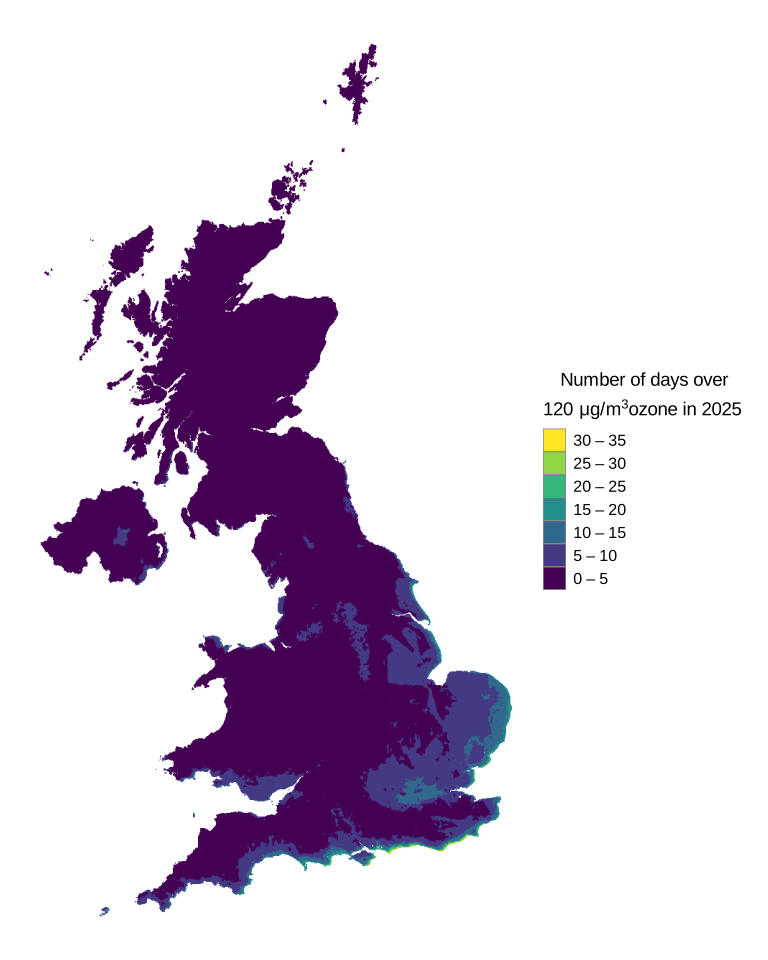
Figure 1: Modelled number of days of ozone concentrations above 120 µg/m3 for 2025
Note that Figure 1 shows the modelled number of days ozone levels are above 120 µg/m3 in 2025 in each 1x1km grid square of the UK. Within the grid squares, there may be local areas of higher or lower concentrations, but these will not be visible in the background maps.
5. Episodes of ozone pollution in 2025
This section looks at short-term episodes of moderate, or above, ozone pollution in the UK. Air pollution is communicated on the Daily Air Quality Index (DAQI), a simple scale that explains the short-term health risk of air pollution in words, numbers and colours.
See the guidance on pollutant concentrations for the DAQI.
Figure 2 is a calendar view of the DAQI for ozone concentrations in 2025. Each day in the year is represented by a coloured square. All the squares in January, February, September, October, November, and December are coloured green, denoting that every AURN monitoring site during these months recorded an ozone concentration that fell within the ‘low’ pollution band. Between March and August (inclusive) some of the squares are coloured orange and red, indicating recorded ozone concentrations on some days fell within the ‘moderate’ and ‘high’ pollution bands. The highest ozone concentrations on any given day in 2025 occurred on 19 June and 1 July 2025.
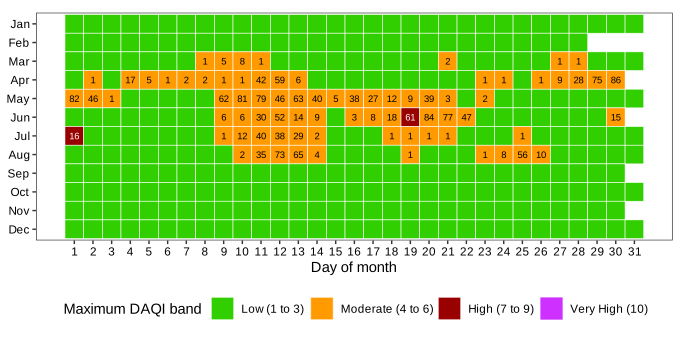
Figure 2: Calendar plot of the DAQI for ozone at AURN monitoring sites in 2025
Note 1: The colour of each square represents the maximum DAQI across the national network. The number shown in each square is the total number of stations which recorded a ‘moderate’ concentration or above.
Figure 3 displays the measured ozone concentrations at all AURN monitoring stations in the period of elevated concentrations between March and August (inclusive). The ‘high’ concentrations measured on 19 June and 1 July 2025 occurred at 5 sites within south-east England. The maximum 8-hour mean ozone concentration recorded in 2025 was 170 µg/m3. Air quality alerts were issued by Defra on both these days, and it was noted that dry and sunny weather along with light winds resulted in increased levels of pollution.
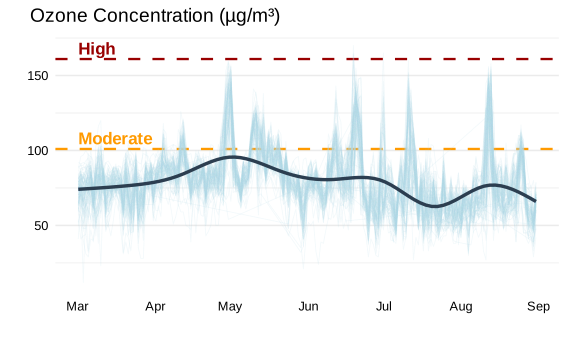
Figure 3: 8-hour mean ozone concentration at AURN monitoring sites between March and August (inclusive) 2025
Note 1: Each separate light blue line denotes the 8-hour mean concentration at AURN sites where ozone is measured. The dark blue line shows a smoothed trend across the period. Dotted horizontal lines indicate the minimum respective concentrations for the ‘moderate’ and ‘high’ DAQI bands.
The peak in the trend line in dark blue on Figure 3 indicates that ozone concentrations were, on average, highest across all sites at the end of April and start of May. 30 April marked the most widespread day of elevated ozone where 86 monitoring sites recorded ‘moderate’ concentrations and only 7 sites recorded ‘low’ concentrations (4 sites had missing data for this day). The ‘moderate’ concentrations were recorded at sites across the whole of the UK, from Plymouth in the south of England, to Strathvaich in the northern Highlands of Scotland. 30 April was documented by the Met Office as being the warmest and sunniest day in that month after a period of high pressure was established over the UK.
The 7 sites which recorded ‘low’ ozone concentrations on 30 April 2025 included sites in urban environments. In London, for example, there were sites close to each other that showed very different concentration patterns; the Marylebone Road monitor recorded ‘low’ ozone concentrations, while all other sites in London recorded ‘moderate’ concentrations, including the North Kensington site approximately 4 km west of Marylebone Road. The hourly time series of both Marylebone Road and North Kensington sites presented in Figure 4 demonstrate the complex atmospheric processes that influence ozone concentrations.
The left-hand pane of Figure 4 shows that concentrations of ozone (orange) at the London Marylebone site were low in the morning hours and steadily increased throughout the day as sunlight intensity increased, while concentrations of NOx (NO and NO2) were variable but also remained elevated throughout the afternoon. The highest ozone concentration of around 90 µg/m3 occurred between 15:00 and 18:00 and there is a clear corresponding drop in NO2, and also NO concentrations to a lesser extent.
In contrast, considering the right-hand pane of Figure 4, the ozone concentrations measured at the North Kensington site were low in the morning but rapidly increased from approximately 09:00 to reach a peak of around 150 µg/m3 just after 15:00, while concentrations of NOx also decreased in a way that corresponded to the ozone peak, and notably NO concentrations approached zero.
This comparison illustrates the complex balance of reactions that result in different ozone concentrations in different environments, which are influenced by varying local emission sources of precursor pollutants. The long-term trend in ozone concentrations in urban environments as concentrations of other pollutants decrease is explored further in the annual air quality statistics.
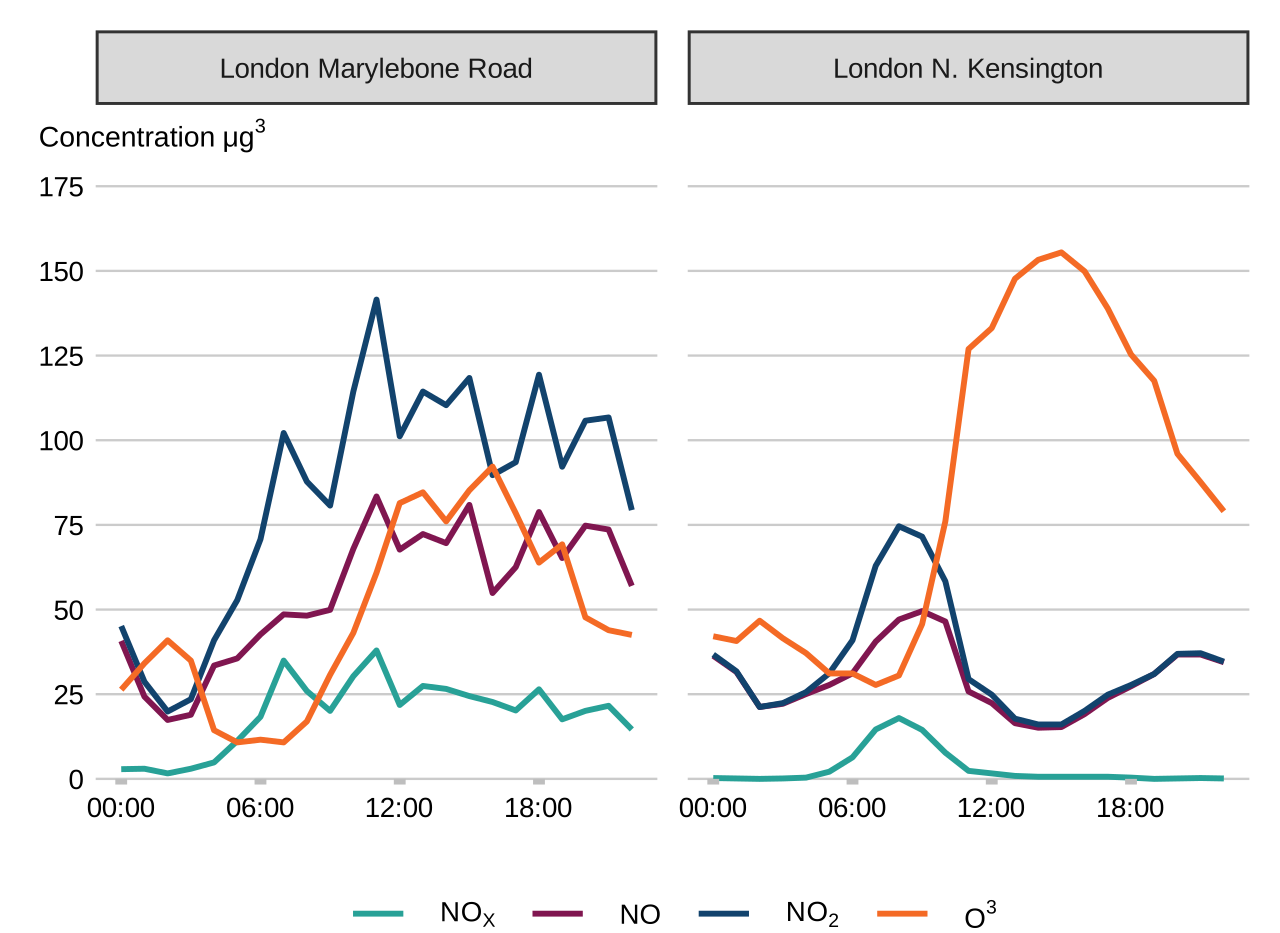
Figure 4: Hourly pollutant concentrations London Marylebone Road and North Kensington on 30 April 2025
Defra issues public information alerts via the Check Air Quality service when pollutant concentrations from monitoring stations breach certain alert thresholds.
The alert thresholds for ozone are when concentrations:
- exceed 180 µg/m3 for 1 hour (information)
- exceed 240 µg/m3 for 1 hour (alert)
There were 21 public pollution alerts issued relating to ozone concentrations issued in 2025.
6. Ozone target values and long-term objectives
This section details the target values and long-term objectives set for ozone concentrations, as outlined in Table 1.
Compliance against these values are assessed within each zone of the UK; for further information on the UK’s reporting zones please see the methods for 2025 Air Quality Standards Regulations (2010) compliance assessment.
Table 1: Ozone (O3) compliance criteria
| Description | Averaging period | Metric | Purpose |
|---|---|---|---|
| O3 Target Value | Maximum daily 8-hour mean | 120 µg/m3 not to be exceeded on more than 25 days per calendar year averaged over 3 years | For the protection of health |
| O3 Target Value | May to July | AOT40 averaged over 5 years (see full description below) | For the protection of vegetation |
| O3 Long-Term Objective | Maximum daily 8-hour mean | 120 µg/m3 assessed over a single year | For the protection of health |
| O3 Long-Term Objective | May to July | AOT40 assessed over a single year (see full description below) | For the protection of vegetation |
The target value for protection of vegetation is based on the accumulated ozone exposure over a threshold of 40 parts per billion (ppb) (AOT40) statistic. This statistic (expressed in µg/m3∙h) is the sum of the difference between hourly concentrations greater than 80 µg/m3 over a given period, using only the hourly mean values measured between 08:00 and 20:00 Central European Time each day from 1 May to 31 July each year, as an average over a 5-year period (80 µg/m3 is the same as 40 ppb for ozone).
For protection of both human health and vegetation there are also long-term objectives, which are based on the same numeric values as the target values, but are assessed over a single year rather than an average of 3 or 5 years.
The rules for assessing compliance are set out in the Air Quality Standards Regulations (2010), as amended.
7. Evidence used for assessing compliance
See the methods for 2025 Air Quality Standards Regulations (2010) compliance assessment.
The evidence base for the annual assessment of compliance against the Air Quality Standards Regulations (2010) is underpinned by a combination of measurements and the results of modelling assessments. The use of models enables air quality to be assessed at locations without monitoring sites. It has the added benefit of providing additional information on source apportionment and projections to support the development and implementation of air quality policies.
Modelling concentrations of ozone in coastal regions is subject to a higher level of uncertainty due the complex chemistry and meteorology in such locations. The model performs well when considering all monitoring sites across the UK but is seen to have a positive bias when performance is considered in coastal regions, particularly along the south coast of England . This will be explored further in the upcoming technical report for the modelling within the air quality compliance assessment 2025: modelled data and reports.
For further information on the measurements and the models used in the 2025 compliance assessment, and to download the data, see air quality compliance assessment 2025: results and data tables.
Monitoring
In 2025, there were 90 monitoring stations from the Automatic Urban and Rural Network (AURN) which met the data quality requirements for assessment against the ozone long-term objective for health. This includes:
- 63 background stations
- 2 roadside monitoring stations
- 4 industrial monitoring stations
- 21 rural background monitoring locations
Modelling
The CMAQ-Urban Model was used for compliance assessment in 2025.
For comparison against the target values and long-term objectives for ozone, 4 model outputs are calculated, one for each of the metrics set out in Table 1. All 4 of these model outputs provide estimated ozone concentrations for each 1x1 km grid square of the UK that are then compared to data derived from monitoring stations.
For more information on the modelling methods and for access to the data, see the air quality compliance assessment 2025: modelled data and reports.
Modelled data is also made available in accessible formats within air quality compliance assessment 2025: results and data tables.
8. Compliance assessment for 2025
All zones were compliant with the ozone target value for vegetation.
One zone exceeded the target value set for the protection of health in 2025. This exceedance was in the South East zone, with the other 42 zones remaining in compliance. This exceedance was identified from the model results. Note that modelling has indicated higher concentrations along the south coast than was seen in the monitoring data.
All 43 zones exceeded the long-term objective set for health in 2025.
32 zones exceeded the long-term objective for vegetation in 2025.
The 2025 compliance results for ozone are summarised in Table 2.
Table 2: Ozone (O3) compliance summary with the long-term objectives for 2025
| Zone | O3 target value for health | O3 long-term objective for health | O3 long-term objective for vegetation |
|---|---|---|---|
| Greater London Urban Area | Compliant | Exceedance | Exceedance |
| West Midlands Urban Area | Compliant | Exceedance | Compliant |
| Greater Manchester Urban Area | Compliant | Exceedance | Compliant |
| West Yorkshire Urban Area | Compliant | Exceedance | Exceedance |
| Tyneside | Compliant | Exceedance | Exceedance |
| Liverpool Urban Area | Compliant | Exceedance | Exceedance |
| Sheffield Urban Area | Compliant | Exceedance | Exceedance |
| Nottingham Urban Area | Compliant | Exceedance | Exceedance |
| Bristol Urban Area | Compliant | Exceedance | Compliant |
| Brighton/Worthing/Littlehampton | Compliant | Exceedance | Exceedance |
| Leicester Urban Area | Compliant | Exceedance | Exceedance |
| Portsmouth Urban Area | Compliant | Exceedance | Exceedance |
| Teesside Urban Area | Compliant | Exceedance | Exceedance |
| The Potteries | Compliant | Exceedance | Compliant |
| Bournemouth Urban Area | Compliant | Exceedance | Exceedance |
| Reading/Wokingham Urban Area | Compliant | Exceedance | Exceedance |
| Coventry/Bedworth | Compliant | Exceedance | Exceedance |
| Kingston upon Hull | Compliant | Exceedance | Compliant |
| Southampton Urban Area | Compliant | Exceedance | Exceedance |
| Birkenhead Urban Area | Compliant | Exceedance | Compliant |
| Southend Urban Area | Compliant | Exceedance | Exceedance |
| Blackpool Urban Area | Compliant | Exceedance | Exceedance |
| Preston Urban Area | Compliant | Exceedance | Compliant |
| Glasgow Urban Area | Compliant | Exceedance | Compliant |
| Edinburgh Urban Area | Compliant | Exceedance | Compliant |
| Cardiff Urban Area | Compliant | Exceedance | Exceedance |
| Swansea Urban Area | Compliant | Exceedance | Exceedance |
| Belfast Urban Area | Compliant | Exceedance | Compliant |
| Eastern | Compliant | Exceedance | Exceedance |
| South West | Compliant | Exceedance | Exceedance |
| South East | Exceedance | Exceedance | Exceedance |
| East Midlands | Compliant | Exceedance | Exceedance |
| North West & Merseyside | Compliant | Exceedance | Exceedance |
| Yorkshire & Humberside | Compliant | Exceedance | Exceedance |
| West Midlands | Compliant | Exceedance | Exceedance |
| North East | Compliant | Exceedance | Exceedance |
| Central Scotland | Compliant | Exceedance | Exceedance |
| North East Scotland | Compliant | Exceedance | Compliant |
| Highland | Compliant | Exceedance | Exceedance |
| Scottish Borders | Compliant | Exceedance | Exceedance |
| South Wales | Compliant | Exceedance | Exceedance |
| North Wales | Compliant | Exceedance | Exceedance |
| Northern Ireland | Compliant | Exceedance | Exceedance |
The results of the assessment are also made available within the air quality compliance assessment 2025: results and data tables.
9. Changes in compliance over time
This section provides information on non-compliances in previous years from 2008 onwards. 2008 is the year that limit values for pollutants were set in the EU Air Quality Directive, which was subsequently transposed into UK legislation by the Air Quality Standards Regulations (2010).
Table 3 summarises the results of the compliance assessment for ozone from 2008 to 2025.
All 43 zones have been compliant with the ozone target value for the protection of vegetation (AOT40) since 2008.
One zone was not compliant with the ozone target value for human health (8 hour mean) in 2008 and 2025.
Compliance with the long-term objectives for ozone has been variable. The number of zones not compliant with the long-term objective for vegetation has fluctuated between zero and 41, with 32 zones being not compliant in 2025. The number of zones not compliant with the long-term objective for health has fluctuated between 31 and 43; 43 zones were not compliant in 2025.
Weather plays a significant role in the UKs compliance with ozone targets and long-term objectives. The UK is committed to reductions in emissions of ozone precursors, NOx and VOCs, through the National Emissions Ceilings Regulations (2018). However, due to ozone’s transboundary and hemispheric characteristics, long term progress requires continued cooperation to reduce precursors, not just in the UK.
We are also improving how we communicate concentrations of air pollution to the public. This includes improvements to alert systems and public information provision, such as through the Check Air Quality service.
Table 3: Number of zones not compliant with assessment criteria for ozone, out of 43 (2008 to 2025)
| Year | O3 target value for health | O3 long-term objective for health | O3 target value for vegetation | O3 long-term objective for vegetation |
|---|---|---|---|---|
| 2008 | 1 zone (Eastern) | 43 zones | None | 41 zones |
| 2009 | None | 39 zones | None | 10 zones |
| 2010 | None | 41 zones | None | 6 zones |
| 2011 | None | 43 zones | None | 3 zones |
| 2012 | None | 41 zones | None | 3 zones |
| 2013 | None | 33 zones | None | 8 zones |
| 2014 | None | 32 zones | None | 3 zones |
| 2015 | None | 43 zones | None | 1 zone |
| 2016 | None | 42 zones | None | 5 zones |
| 2017 | None | 34 zones | None | None |
| 2018 | None | 43 zones | None | 38 zones |
| 2019 | None | 43 zones | None | 6 zones |
| 2020 | None | 40 zones | None | 16 zones |
| 2021 | None | 39 zones | None | 1 zone |
| 2022 | None | 43 zones | None | 11 zones |
| 2023 | None | 42 zones | None | 30 zones |
| 2024 | None | 31 zones | None | 4 zones |
| 2025 | 1 zone (South East) | 43 zones | None | 32 zones |