Carbon monoxide (CO) compliance assessment 2025
Published 9 October 2026

© Crown copyright 2026
This publication is licensed under the terms of the Open Government Licence v3.0 except where otherwise stated. To view this licence, visit nationalarchives.gov.uk/doc/open-government-licence/version/3 or write to the Information Policy Team, The National Archives, Kew, London TW9 4DU, or email: psi@nationalarchives.gov.uk.
Where we have identified any third party copyright information you will need to obtain permission from the copyright holders concerned.
This publication is available at https://www.gov.uk/government/publications/air-pollution-in-the-uk-2025/carbon-monoxide-co-compliance-assessment-2025
This compliance assessment is part of Air pollution in the UK 2025. There is a page for each of 12 pollutants.
This page provides the UK’s compliance assessment for 2025 against the carbon monoxide (CO) limit value set for the protection of health.
The compliance criteria is set in the Air Quality Standards Regulations (2010).
The Air Quality Standards Regulations (2010) require reporting of compliance on an annual basis. This report continues the series of annual compliance reporting.
1. Carbon monoxide pollution and its impacts
The effects of high levels of carbon monoxide on human health are well-known, and long-term low-level exposure may also lead to adverse health effects, as reported by the UK Health Security Agency.
Carbon monoxide is toxic: it affects the ability of the blood to take up oxygen from the lungs and can lead to a range of symptoms, causing death at high concentrations.
However, people are more likely to be exposed to dangerous concentrations of carbon monoxide indoors, due to faulty or poorly ventilated cooking and heating appliances. Cigarette smoke is also a major source of exposure.
In the environment, carbon monoxide can contribute to the formation of ground-level ozone.
2. Sources of carbon monoxide pollution
Carbon monoxide is produced when fuels containing carbon are burned with insufficient oxygen to convert all carbon inputs to carbon dioxide (CO2).
The release of pollutants into the atmosphere is known as emissions. Annual UK emissions of carbon monoxide are estimated each year in the National Atmospheric Emissions Inventory (NAEI). The NAEI provides estimates of the total amount emitted during a calendar year. The latest estimates currently available are for 2024.
The NAEI reports emissions of carbon monoxide from human activities in the UK, but there are a few exceptions included as memo items, such as international shipping and forest fires. The information presented here does not include memo items.
Figure 1 shows the split of emissions in 2024 between various sources. Industrial combustion was the largest single contributor of carbon monoxide emissions in 2024, followed by domestic combustion and road transport. Total UK emissions of carbon monoxide have decreased between 1990 and 2024.
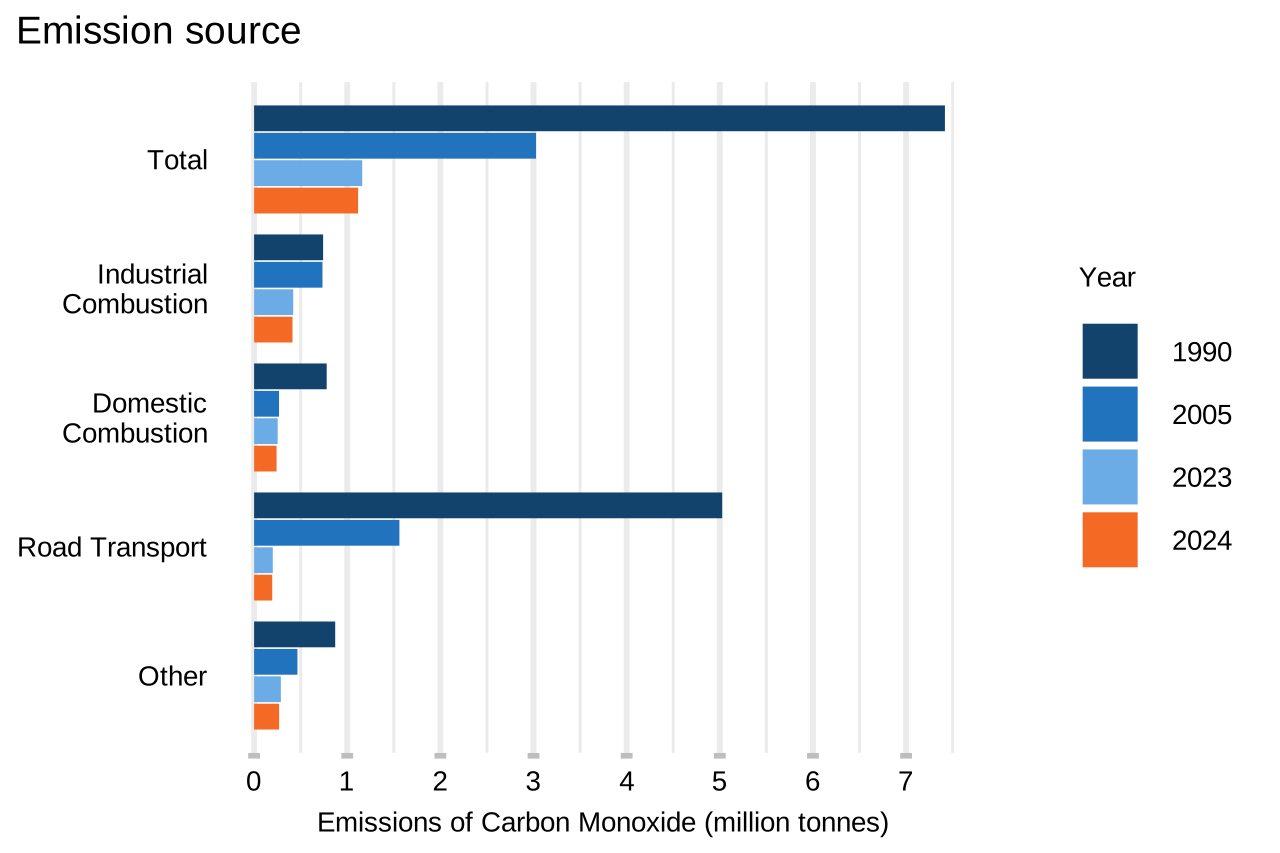
Figure 1: UK annual emissions of Carbon Monoxide by 2024 major emission source: 1990, 2005, 2023 and 2024
Notes:
- ‘Industrial combustion’ refers to the burning of fuels on manufacturing and construction sites, to generate energy for industrial use, for example to drive mobile machinery or to create heat or electricity for industrial processes.
- ‘Domestic combustion’ refers to households burning a variety of fuels, for example in stoves and fireplaces.
- Sources are ordered by emissions in 2024 from highest to lowest, excluding ‘Other’.
- Further detail on emission source categories is available in the latest Methods for NAEI emissions data document.
3. Trends in carbon monoxide pollution
How carbon monoxide concentrations have changed over time since 1990 is shown in Figure 2. Average measured carbon monoxide concentrations have decreased from an annual mean of 1.8 mg/m3 in 1990, to 0.1 mg/m3 in 2025.
The average concentration has been calculated from all stations in the Automatic Urban and Rural Network (AURN) that had an annual data capture greater than or equal to 75 per cent. The shaded areas represent the 90 per cent confidence interval. The intervals narrow over time because of an increase in the number of monitoring stations and a reduction in the variation between annual means at monitoring stations.
Trends over time can be influenced by changes to the number of monitoring sites and their locations. The pattern shown here will therefore exhibit some effect of changes to the structure of the monitoring network over time.
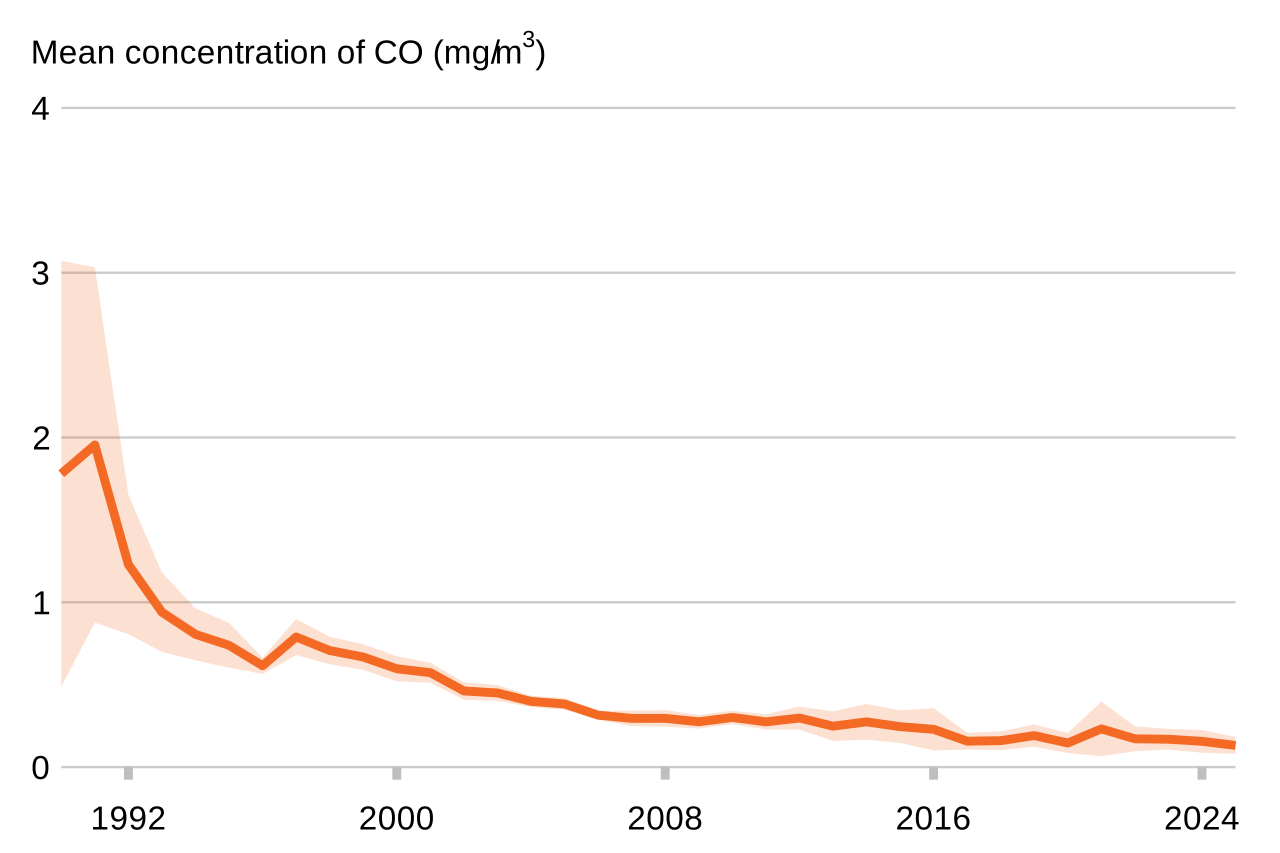
Figure 2: Annual mean concentrations of carbon monoxide in the UK, 1990 to 2025
4. Spatial variation
Figure 3 shows modelled maximum 8-hour mean carbon monoxide concentration in 2025 for each 1x1km grid square of the UK. The data comes from the CMAQ-Urban Model used for supplementary assessment against the carbon monoxide limit value set for the protection of health, as set out in section 6. The highest carbon monoxide concentrations in Figure 3 are around Greater London, while other areas of the UK generally experience very low carbon monoxide concentrations.
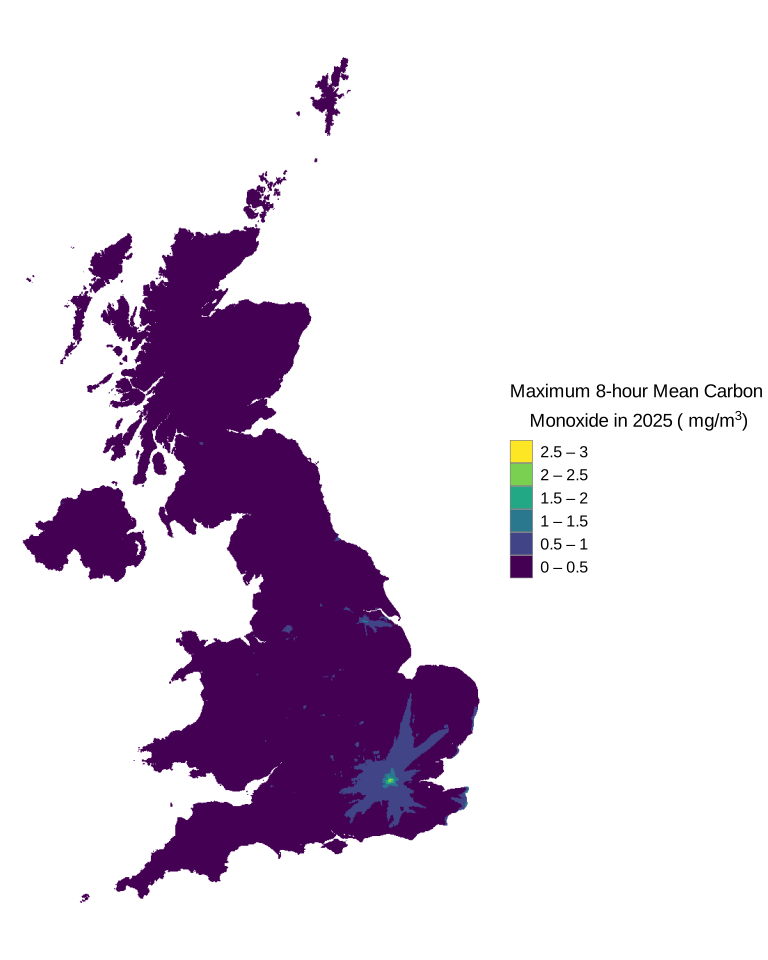
Figure 3: Modelled maximum 8-hour mean carbon monoxide concentrations for 2025
Note that Figure 3 shows the modelled annual average background concentration of carbon monoxide in each 1x1km grid square of the UK. Within the grid squares, there may be local areas of higher concentration close to specific emission sources. These will not be visible in the background maps.
5. Carbon monoxide limit value
This section outlines the limit value set for carbon monoxide concentrations.
Compliance against the carbon monoxide limit value is assessed within each zone of the UK. For further information on the definition of agglomeration and non-agglomeration zones see the methods for 2025 Air Quality Standards Regulations (2010) compliance assessment.
Table 1: Carbon monoxide (CO) compliance criteria
| Description | Averaging period | Metric |
|---|---|---|
| CO limit value for health | Maximum 8-hour running mean | 10 mg/m3 |
The rules for assessing compliance are set out in the Air Quality Standards Regulations (2010), as amended.
6. Evidence used for assessing compliance
See the methods for 2025 Air Quality Standards Regulations (2010) compliance assessment.
The evidence base for the annual assessment of compliance against the Air Quality Standards Regulations (2010) is underpinned by a combination of measurements and the results of modelling assessments.
The use of models enables air quality to be assessed at locations without monitoring sites. It has the added benefit of providing additional information on source apportionment and projections to support the development and implementation of air quality policies.
For further information on the measurements and the models used in the 2025 compliance assessment, and to download the data, see the air quality compliance assessment 2025: results and data tables.
Monitoring
In 2025, there were 7 monitoring stations from the AURN which met the data quality requirements for assessment against the carbon monoxide limit value. This includes:
- 5 background stations
- one roadside monitoring station
- one industrial monitoring station
The techniques used for monitoring gaseous pollutants within the AURN are the reference measurement methods defined in the Air Quality Standards Regulations (2010). Further information on the monitoring instruments used for measuring carbon monoxide are detailed in the Statistical Tables that accompany this release.
Modelling
The CMAQ-Urban Model was used for compliance assessment in 2025.
For assessment against the limit value for carbon monoxide one model output was calculated: annual average carbon monoxide concentrations for each 1x1km grid square of the UK.
For more information on the modelling methods and for access to the data, please see the air quality compliance assessment 2025: modelled data and reports.
Modelled data is also made available in accessible formats within the air quality compliance assessment 2025: results and data tables.
7. Compliance assessment for 2025
All zones were compliant with the limit value for carbon monoxide concentrations in 2025.
The results of the assessment are also made available within air quality compliance assessment 2025: results and data tables.
8. Changes in compliance over time
This section provides information on non-compliances in previous years from 2008 onwards. 2008 is the year that limit values for pollutants were set in the EU Air Quality Directive, which was subsequently transposed into UK legislation by the Air Quality Standards Regulations (2010).
The UK has been compliant with the limit value for carbon monoxide since 2008.