UK sub-national residual fuels 2005-2024 methodology summary
Published 30 July 2026

© Crown copyright 2026
This publication is licensed under the terms of the Open Government Licence v3.0 except where otherwise stated. To view this licence, visit nationalarchives.gov.uk/doc/open-government-licence/version/3 or write to the Information Policy Team, The National Archives, Kew, London TW9 4DU, or email: psi@nationalarchives.gov.uk.
Where we have identified any third party copyright information you will need to obtain permission from the copyright holders concerned.
This publication is available at https://www.gov.uk/government/statistics/uk-residual-fuel-consumption-at-regional-and-local-authority-level-2005-to-2024/uk-sub-national-residual-fuels-2005-2024-methodology-summary
Introduction
Background
This work provides estimates for ‘residual fuels’ at local authority area level, that is fuels used for purposes other than gas, electricity and road transport. Estimates for gas, electricity and road transport energy consumption at local authority area level are published separately. A time series relative to a 2005 base year is calculated annually. This forms part of the co-funded Department for Energy Security & Net Zero (DESNZ) / Department for Environment, Food & Rural Affairs (Defra) National Atmospheric Emissions Inventory (NAEI) work programme which uses Geographic Information Systems (GIS) tools to derive spatially resolved energy consumption estimates.
This report has been prepared by WSP (formerly Ricardo) on behalf of DESNZ and accompanies the detailed local authority data tables. It provides methodological details and highlights key features of the reported data and trends for the years 2005-2024. Note that the entire time series going back to 2005 is revised each year to take account of methodological improvements and data revisions, so the estimates presented here supersede previous ones. Datasets prepared for 2003 and 2004 are also available (BERR, 2008), but are not internally consistent with data presented in this report.
Quality Assurance and Quality Control (QA/QC)
A rigorous set of QA/QC procedures are applied across the NAEI work programme to minimise the risk of errors in all UK and sub-national energy and emissions outputs. Specific quality checks have been implemented in the compilation of this dataset, to complement the QA/QC conducted in the compilation of the national inventory database and upstream datasets such as the Digest of UK Energy Statistics (DUKES), from which the underlying methods and datasets are derived. The primary quality checks that are specific to the local authority energy statistics outlined in this report are as follows:
1. Completeness and time-series consistency. Data checks are conducted to verify that the scope of the sub-national ‘residual fuels’ estimates cover all of the fuels and economic sectors that are required to ensure complete coverage of energy use, with no double-counting of activity when considered in conjunction with the other sub-national energy datasets covering road transport fuels, gas and electricity. Checks are conducted to review the time-series of these data for UK local authority areas, and any outliers or major revisions to the statistics since the previous (2005-2023) dataset are investigated and documented.
2. Geographical allocation of fuels. Checks are conducted to verify that postcode-derived coordinates are correct and that energy use at installations is therefore allocated to the correct local authority area.
3. Consistency of national and sub-national energy totals. Checks are conducted to ensure that for every emission source (by economic sector) and fuel, the sum of the reported sub-national energy statistics is consistent with the national totals from the NAEI and DUKES.
In order to ensure that the sub-national energy datasets are transparent to users in their scope and usefulness, this report provides an explanation of the data sources, methods and key assumptions used to compile the sub-national energy estimates.
Data limitations
Good quality energy use data exist across the time series for many high-emitting energy and industrial installations, which can be readily allocated to a specific location and hence local authority area. However, for smaller-scale energy users such as residential and commercial sectors, there are limited bottom-up data, and hence an array of energy modelling approaches and assumptions concerning the use of fuels across the UK are applied in the derivation of these sub-national energy data estimates.
It is important that all users of the sub-national energy statistics understand the limitations of the data. If detailed local energy datasets are available, it is recommended that these are used for policy decision-making. The sub-national energy statistics team encourage users to contribute new data sources that may lead to future improvements to the UK-wide sub-national statistics by contacting:
EnergyEfficiency.Stats@energysecurity.gov.uk
Method overview: energy mapping for key sectors
WSP compiles fuel consumption and emissions estimates for many sources at 1x1km and local authority area level on an annual basis. This work forms part of the NAEI and Greenhouse Gas Inventory (GHGI) programme of work for Defra and DESNZ. Estimates of the distribution of fuel consumption from sources other than gas, electricity and road transport are available from the mapping work currently undertaken within this contract. The methodology used to compile these maps is described in the NAEI mapping methodology report (Tsagatakis, et al., 2025).
Source sector and fuel combinations mapped by this study are shown in Table 1. It is recognised, however, by DESNZ and WSP that it is not meaningful to allocate energy consumption locally or regionally for some activities. Therefore, fuel consumption from aviation, shipping and power stations are excluded from this study. In addition, for some fuel and sector combinations, no information is available for spatial mapping purposes. Where possible, fuels used for fuel transformation are excluded, for example coal used in coke ovens and blast furnaces, and coal and oils used in power stations. However, actual end-use of fuels is not always obvious from the raw datasets available.
Table 1. Sources and fuels that are mapped within the NAEI and used to derive sub-national energy estimates
| Fuel | Source |
|---|---|
| Petroleum | Industrial |
| Domestic | |
| Rail | |
| Public Administration | |
| Commercial | |
| Agriculture [note 1] | |
| Coal | Industrial |
| Domestic | |
| Rail | |
| Public Administration | |
| Commercial | |
| Agriculture | |
| Manufactured Solid Fuels | Industrial |
| Domestic | |
| Bioenergy & Wastes [note 2] | Industrial |
| Domestic |
Note 1: Agriculture petroleum excludes the consumption of propane.
Note 2: The bioenergy & wastes figures exclude bioenergy and wastes used for electricity generation.
The following sections of this report describe the methodology used to prepare the estimates of the fuel consumption in local authority areas throughout the UK.
The main steps of the method are to:
1. Obtain the national total fuel consumption for selected fuel types and sectors;
2. Spatially disaggregate the national totals onto a 1x1km grid or other geographical levels covering the UK;
3. Assign fuel activity to the relevant local authority areas and calculate total fuel consumption at local authority area level.
The results are summarised in this report and provided in detail in the data tables that this report accompanies. The results section also provides a summary of the effects of the methodological changes implemented since the data were last published.
National total fuel consumption by sector and fuel type
The NAEI calculates the total fuel consumption data for the fuel types and sectors considered in this study. The fuel types and sectors are listed in Table 2.
Table 2. NAEI fuel types and sectors reported in the ‘sub-national consumption of residual fuels’ dataset
| Fuel types | Sector | NAEI source names |
|---|---|---|
| Bioenergy & Wastes | Domestic | Domestic Fireplace - Standard |
| Domestic Closed Stove - Basic | ||
| Domestic Closed Stove - Upgraded | ||
| Domestic Closed Stove - EcoDesign | ||
| Domestic Boiler | ||
| Domestic Outdoor | ||
| Domestic Space Heater | ||
| Domestic Water Heater | ||
| Domestic Cooking and Other | ||
| Domestic Closed Stove - Advanced | ||
| Domestic Fireplace - Standard | ||
| Domestic Outdoor | ||
| Domestic Pellet Appliance - Basic | ||
| Domestic Pellet Appliance - EcoDesign | ||
| Domestic Woodchip Appliance - Basic | ||
| Domestic Woodchip Appliance - EcoDesign | ||
| Residential Outdoor - All Appliances | ||
| Residential Outdoor - Appliance including chimineas, firepits etc | ||
| Residential Outdoor - Bonfires | ||
| Industrial | Cement production - combustion | |
| Chemicals (combustion) | ||
| Food & drink, tobacco (combustion) | ||
| Incineration - clinical waste | ||
| Lime production - non decarbonising | ||
| Other industrial combustion | ||
| Pulp, Paper and Print (combustion) | ||
| Refineries - combustion | ||
| Coal | Agriculture | Agriculture - stationary combustion |
| Commercial | Miscellaneous industrial/commercial combustion | |
| Domestic | Domestic Fireplace - Standard | |
| Domestic Closed Stove - Basic | ||
| Domestic Closed Stove - Upgraded | ||
| Domestic Closed Stove - EcoDesign | ||
| Domestic Closed Stove - Advanced | ||
| Domestic Boiler | ||
| Domestic Outdoor | ||
| Domestic Space Heater | ||
| Domestic Water Heater | ||
| Domestic Cooking and Other | ||
| Industrial | Cement production - combustion | |
| Chemicals (combustion) | ||
| Collieries - combustion | ||
| Food & drink, tobacco (combustion) | ||
| Iron and steel - combustion plant | ||
| Lime production - non decarbonising | ||
| Non-Ferrous Metal (combustion) | ||
| Other industrial combustion | ||
| Pulp, Paper and Print (combustion) | ||
| Sinter production | ||
| Public Administration | Public sector combustion | |
| Rail | Rail - coal | |
| Manufactured Solid Fuels | Domestic | Domestic Fireplace - Standard |
| Domestic Closed Stove - Basic | ||
| Domestic Closed Stove - Upgraded | ||
| Domestic Closed Stove - EcoDesign | ||
| Domestic Closed Stove - Advanced | ||
| Domestic Boiler | ||
| Domestic Outdoor | ||
| Domestic Space Heater | ||
| Domestic Water Heater | ||
| Domestic Cooking and Other | ||
| Industrial | Brick manufacture - all types | |
| Cement production - combustion | ||
| Chemical industry - soda ash | ||
| Chemical industry - titanium dioxide | ||
| Chemicals (combustion) | ||
| Electric arc furnaces | ||
| Iron and steel - combustion plant | ||
| Lime production - non decarbonising | ||
| Other industrial combustion | ||
| Refineries - combustion | ||
| Sinter production | ||
| Petroleum | Agriculture | Agriculture - mobile machinery |
| Agriculture - stationary combustion | ||
| Commercial | Miscellaneous industrial/commercial combustion | |
| Domestic | Domestic Fireplace - Standard | |
| Domestic Closed Stove - Basic | ||
| Domestic Closed Stove - Upgraded | ||
| Domestic Closed Stove - EcoDesign | ||
| Domestic Boiler | ||
| Domestic Outdoor | ||
| Domestic Space Heater | ||
| Domestic Water Heater | ||
| Domestic Cooking and Other | ||
| House and garden machinery | ||
| Industrial | Aircraft - support vehicles | |
| Cement production - combustion | ||
| Chemicals (combustion) | ||
| Collieries - combustion | ||
| Food & drink, tobacco (combustion) | ||
| Industrial off-road mobile machinery | ||
| Iron and steel - combustion plant | ||
| Landfill gas combustion | ||
| Lime production - non decarbonising | ||
| Non-Ferrous Metal (combustion) | ||
| Other industrial combustion | ||
| Pulp, Paper and Print (combustion) | ||
| Refineries - combustion | ||
| Public Administration | Public sector combustion | |
| Rail | Railways - freight | |
| Railways - intercity | ||
| Railways - regional |
The NAEI obtains data on national fuel consumption from the Digest of UK Energy Statistics (DUKES). National totals based on these data are further refined for the industrial and energy generation sector taking into account other more detailed data. This study has utilised data that underpinned the UK 1990-2024 GHGI which, in turn derived its data from the 2024 statistics presented in DUKES (DESNZ, 2025). The UK Greenhouse Gas Inventory 1990-2024 report (Brown P, 2026) describes the methods used to adjust the DUKES totals in detail. The following sections provide a summary of the adjustments made.
Key differences between GHGI and DUKES
This section of the report sets out the key differences between the GHGI and DUKES estimates of fuel consumption. The GHGI includes three types of deviation compared with DUKES.
The first difference concerns fuel used for heat generation. The GHGI and local authority emissions datasets do not include heat generation as a separate category. Instead, fuel reported in DUKES for heat generation is re-allocated to final user sectors using data supplied by the DESNZ Energy Statistics team. Therefore, the fuel consumption data for ‘industry’ and ‘other’ in the GHGI are higher than the values published in DUKES. Details of the heat generation fuel reallocation are shown in table J1 of DUKES (DESNZ, 2025).
The other two types of deviation relate to the allocation of fuels to individual sectors due to alternative data to DUKES being used in the GHGI. As well as DUKES, the inventory team has access to alternative energy data such as that collected for the purposes of the EU and UK Emissions Trading Schemes (hereafter referred to as ‘ETS’), as well as data provided directly by industry. There are instances where these alternative data are both considered highly reliable, and also higher than DUKES estimates. In these cases, the inventory team adopts the conservative approach of using the higher, alternative, data in preference to the lower values from DUKES. Conversely, where the alternative energy data are lower than DUKES, then the inventory team will always use the DUKES estimates. This approach of using the higher, more conservative data in each case leads to two different situations:
- Alternative data for one or more sectors suggests that fuel use is higher in that sector than given in DUKES, but the overall UK demand estimate in DUKES is considered by the inventory team to be correct. Therefore, quantities of fuel are simply re-allocated between sectors so that while the sectoral allocations may differ to DUKES, the overall fuel use remains consistent. This is the most common type of deviation from DUKES.
- Alternative data for one or more sectors suggests that fuel use is higher than given in DUKES, but the sum of fuel consumption is also higher than the total UK demand figures given in DUKES. In this case it is impossible to reconcile the alternative data with the UK demand figures in the energy statistics, and therefore both the sectoral allocation and the overall UK demand estimate must deviate from DUKES. This type of deviation is only necessary for a small number of fuels, including gas oil, coke oven coke, and petroleum coke.
The UK Greenhouse Gas Inventory 1990-2024 report (Brown P, 2026) provides, in Annex 5.2, a full description of re-allocations for major fuels, including tables that quantify each re-allocation for the latest inventory year. A summary of the re-allocations for each fuel type used in the residual fuel statistics is given below.
Coal
Alternative data are used for coal burnt in cement kilns and lime kilns, as are operator data for coal use in coke ovens. These adjustments relative to DUKES are balanced by reducing coal usage by the source category ‘other industry’. As with other major fuels, consumption for heat generation is re-allocated to final users. The overall consumption of coal assumed in the GHGI remains the same as given in DUKES.
In the GHGI point source data, there is a further difference to both the GHGI itself and DUKES. Those both identify fuel consumed by autogenerators, whereas this is not possible in the point source data. Within DUKES, autogenerators are considered as a transformation fuel use and so they do not contribute to final consumption. However, autogenerators cannot be distinguished from ‘other’ industrial users in the datasets that underpin NAEI and GHGI mapping outputs and therefore we are unable to include autogeneration as a distinct source in the point source data. As a result, point source data for industrial coal use will include an indeterminate quantity of coal used for autogeneration. And because autogeneration and non-autogeneration coal use cannot be separated in the points, autogeneration is also not treated as a separate source in the final residual fuels outputs.
Petroleum
The GHGI includes many re-allocations for petroleum fuels. The most important sectoral re-allocations are described below. As with coal, it is not possible to identify autogenerators in the point source data for oils, and therefore autogeneration is not treated as a separate category for any petroleum fuels.
Oils used at power stations
The quantities of oils reported in DUKES as burnt in power stations are generally smaller than the figures reported by the operators either directly to the NAEI or via the ETS. The GHGI assumes that the larger quantities reported by operators to the NAEI or in ETS data are correct, rather than the lower figures given in the energy statistics. The inventory therefore uses these higher values but ensures that the total UK consumption of oils by industrial and other stationary source sectors is still consistent with DUKES figures by lowering the consumption in some sectors relative to DUKES by an equal and opposite amount to the changes for the power sector, so the various changes cancel each other out. For fuel oil, gas oil and burning oil, these balancing reductions are made to fuel used by the manufacturing industry sector.
Other uses of gas oil
The GHGI allocations of gas oil also deviate from DUKES because of the need to identify transport/mobile machinery and stationary sources separately in the inventory, whereas UK energy statistics just report total gas oil use by each economic sector. It is a requirement of national inventory reporting that for several economic sectors further detail should be reported, as the emission characteristics of mobile plants differ from stationary combustion plants. The main examples are that the NAEI must report emissions from gas oil and Diesel Engine Road Vehicle (DERV) used in road vehicles, off-road vehicles and mobile machinery, primarily in the industrial and agriculture sectors.
In addition, data available to the inventory from other sources, such as ETS, indicate that some reallocations of fuel compared with DUKES are necessary (for example, the changes to power station gas oil use already mentioned in the Oils used at power stations section).
This year, a new shipping model has been implemented into the NAEI. The fuel use within the shipping sector has been revised to be in line with the DUKES estimates so that emissions are estimated on a ‘fuel sold’ basis. In addition, the modelling and coverage of activities has been enhanced through incorporation of global Automatic Identification System (AIS) data from 2019. One effect of this has been a reallocation of fuel between international and domestic shipping fuel in the NAEI compared to DUKES. In previous years, the total UK demand estimates deviated from DUKES due to the use of bottom-up estimates of domestic shipping, inland waterways vessels, and port machinery in the GHGI which estimated significantly higher consumption of gas oil by shipping than is reported in DUKES – the use of bottom-up models without normalising against DUKES fuel use represented a ‘fuel used’ basis.
In addition to this, from 2022, changes to fuel duty exemptions mean that some former gas oil users now pay the same duty as road diesel users, and therefore appear in DUKES against DERV/white diesel instead of gas oil/red diesel. To maintain time-series consistency the NAEI reports non-road use of white diesel and all red diesel as gas oil.
As a result of this restructuring of gas oil consumer categories and reallocations of fuels between categories compared to DUKES, the GHGI data are different to those given in DUKES when compared by fuel and use. However, the total consumption of gas/diesel oil in the GHGI is identical to the total consumption of gas/diesel oil given in DUKES.
Further detail on the allocation of gas oil can be found in the UK Greenhouse Gas Inventory 1990-2024 report (Brown P, 2026), Annex A5.2.2.1.4.
Liquefied petroleum gas (LPG) and other petroleum gases
The GHGI reports all of the LPG reported in DUKES for the public, commercial, and agricultural sectors as industrial usage. This approach reflects the non-availability of data for the earlier part of the inventory time-series. Overall demand estimates are, however, kept consistent with DUKES.
For other petroleum gases, overall energy demand figures in the GHGI are higher than in DUKES. This is for two reasons:
- ETS data for crude oil refineries suggest higher use of these fuels than is given in DUKES (for many but not all years where we have ETS data).
- The GHGI includes off-gases used as fuels at petrochemical works, the most significant of which are off-gases generated and then burnt at ethylene crackers. These process off-gases are by-products of the use of chemical feedstocks to manufacture ethylene and other chemicals. Because the chemical feedstocks are already reported in DUKES as non-energy use, DUKES does not include the subsequent use of the off-gases as an energy use, since this would duplicate reporting. Whereas the inventory only needs to include all emissive sources and therefore just includes the fuel use.
Manufactured solid fuels
Coke oven coke and related fuels derived from coal
The DUKES aggregated energy balance includes all coal-based manufactured solid fuels (coke oven coke, coke breeze, and patent fuel) as well as benzole, tars, coke oven gas and blast furnace gas. In the GHGI, all use of benzole and coal tars is treated as non-energy consumption, whilst coke oven gas and blast furnace gas are categorised as transformation fuel uses. Some deviations from DUKES for both sectoral and UK demand estimates are necessary for coke oven coke. DUKES gives relatively little detail on sectoral usages of this fuel, but the GHGI needs to provide detail on industrial uses so uses a more detailed set of consumer categories. Since users identified in ETS and other datasets are estimated to consume more coke oven coke than the UK demand figure in DUKES in some years, deviations from those demand figures are necessary.
Petroleum coke
DUKES reports petroleum coke used by major power producers and crude oil refineries for energy purposes, as well as providing data for some years on consumption in manufactured fuels and use as a fuel by industry. All other deliveries of petroleum coke are reported as non-energy use within DUKES.
The GHGI includes estimates of the petroleum coke used in many sectors based on information made available from industry either directly to the NAEI or via the ETS, including various industrial processes, such as brickmaking, titanium dioxide manufacture and steel production. For some years, the NAEI estimates of petroleum coke consumption exceed the quantities given in DUKES for energy applications, and it is necessary to deviate from the energy use allocation in DUKES in order to maintain consistency with the high-quality data in ETS and other sources. For a number of years throughout the time series, the NAEI estimates of petroleum coke consumption exceed not only the energy uses in DUKES but even the combined energy and non-energy uses in DUKES, and so for these years only, the NAEI has a higher use of petroleum coke than given by DUKES.
Bioenergy & Wastes
The GHGI estimates for waste solvents and scrap tyre consumption refer to their use as fuel in the cement industry and various other sectors and are based on data from the Mineral Products Association and from ETS. Estimates for other wastes used as fuels are derived from the ETS data. There are no directly equivalent data in DUKES, although the energy statistics do include aggregated estimates for industrial use of wastes and renewables that may cover some or all of the usages by individual sites reported in the ETS.
Spatial disaggregation of fuel consumption
This section of the report describes how the national estimates of fuel consumption are spatially disaggregated throughout the UK.
Site-specific data for non-domestic consumers
The NAEI receives detailed data on individual ‘point sources’ in the industrial and commercial sectors. A point source is an emission source at a known location, which has grid references and therefore it can be mapped directly.
Point source emissions are compiled using a variety of data sources and techniques. The point source database is regularly updated to include new data reported through the ETS, and this study also takes account of relevant point source data reported after the UK Greenhouse Gas Inventory 1990-2024 report (Brown P, 2026) was prepared. More information on data sources can be found in the UK Emission Spatial Methodology (Tsagatakis, et al., 2025).
The data presented in this report are not fully consistent with the GHGI and DUKES because of the use of site-specific data in preference to UK-level data, in order to provide better information on the fuels used at individual industrial and commercial sites. The methodology used to calculate fuel use at site-specific sources is described in detail in the UK local and regional greenhouse gas emissions technical report, which includes information on where the differences between site-specific data and GHGI and DUKES are most significant.
Other non-domestic consumers
The consumption of fuels at specific sites described above represents a substantial proportion of the total industrial and commercial fuel consumption. Subtracting the site-specific fuel consumption from the NAEI sector total derives an estimate of remaining fuel consumption. This residual fuel consumption is allocated to each local authority area in the UK using distribution maps derived from employment statistics for each sector.
The document Employment based energy consumption mapping in the UK describes how the distribution maps were prepared. In summary:
1. Data on sectoral and site-specific fuel consumption, and employment estimates for regions and business types were used to develop fuel use distribution maps of the UK;
2. Point sources were matched to individual businesses by sector to give a residual amount of fuel consumption;
3. Where available, Energy Performance Certificates (EPC) and Display Energy Certificates (DEC) with estimated fuel use are matched with individual businesses
4. This residual amount was then combined with sectoral employment data to give a measure of employee-level fuel intensity for different fuels within each sector;
5. Employment totals at local authority resolution were then multiplied by the relevant employee fuel intensity to give fuel-use distribution across the UK;
6. This distribution was then refined by overlaying various additional datasets and applying expert knowledge to adjust fuel consumption.
Domestic
Domestic oil and solid fuel use distributions were created by spatially resolving detailed local information on central heating and house type data from the census. For oil use, data from the DESNZ National Household Model (NHM), which provides average household energy consumption estimates across 13 regions in England, Wales and Scotland is used. In the NHM, England is split into 9 regions following the regional classification scheme, Wales is treated as one region and Scotland is split into three regions following the Met Office 3-tier regional (Northern, Eastern and Western) classification so as to represent the spatial shifts in climate (Met Office, 2016). The census data (at output area level) were combined with full-address matched dwelling locations from Ordnance Survey data to give a more accurate distribution of households at local authority area level. This was done for both the 2011 and 2021 censuses and the results were interpolated for intervening years.
Solid fuel use was assigned to solid fuel burnt in boilers and non-boiler appliances (such as open fireplaces, closed stoves). It was assumed that solid fuel activity for boilers was used in properties which, according to the 2021 census, had solid fuel central heating. Solid fuel activity for non-boiler appliances was assumed to be used in houses and bungalows with no central heating. Supplementary heating from the same technologies was considered more likely to be located in houses and bungalows only. Apartments were excluded for solid fuel use to be consistent with DESNZ NHM assumptions on wood use. The number of supplementary heating users for wood was calibrated at regional level, urban status and smoke control area status by comparing the total wood user count (as derived from all the above assumptions) against the counts from the Defra domestic solid fuel use survey. Due to the lack of historical data in the solid fuel survey, only the 2021 census was used for domestic solid fuels.
As NHM does not include data for Northern Ireland, details of central heating use from the 2021 census provided the basis of the domestic fuel distributions.
Further information on the datasets and methodology used to develop the domestic model can be found in the UK Emission Mapping Methodology (Tsagatakis, et al., 2025).
Other sources
The national fuel emissions also include contributions from rail and agriculture sectors and from non-road mobile machinery (NRMM).
Rail sector diesel consumption is compiled for three journey types: freight, intercity and regional. Fuel use for rail was spatially disaggregated based on a Rail Safety and Standards Board (RSSB) project that mapped 2019 emission estimates for each line in Great Britain for passenger and freight trains. Activity along each rail link between Timing Point Locations (TIPLOCs) were assumed to be uniform along the length of the rail link, as no information on either load variation or when engines were on or off is yet available on a national basis. Rail fuel consumption across Northern Ireland is based on 2019 data from Translink on the number of services run on different routes. These data are for passenger trains only as there is no freight activity in Northern Ireland.
Coal-based emissions from heritage railways are considered separately.
The National Atmospheric Emissions Inventory (NAEI) splits NRMM use into twelve separate categories (Elliott, 2026): agriculture, airports, construction, forklifts, generators, mining & quarrying, other industry, refrigerated transport, house & garden, forestry, seaports, and waste. Data specific to each sector are used to distribute the fuel use to local authorities (except mining & quarrying).
Agricultural stationary combustion has been mapped using employment data, with the geographic distribution of solid and liquid fuels controlled by the location of smoke control areas and the geographical distribution of gas availability. Agricultural off-road data are distributed using a combination of arable, pasture and forestry land use data combined with information on the number of hours tractors and other machinery are used on these land use types.
More detailed descriptions of the data and methodologies used to develop estimates of fuel emissions totals for these source categories can be found in the UK Spatial Emission Methodology (Tsagatakis, et al., 2025).
Aggregation of fuel consumption to local authority level
The calculations of fuel consumption by sector were made using the NAEI distribution maps and energy consumption estimates for point sources at known locations. A map of local authority boundaries has been used to assign mapped fuel consumption estimates to a local authority area. Maps for each sector and fuel are generated by summing the spatially distributed NAEI/GHGI national totals.
Prior to the aggregation of the fuel consumption data to local authority level, data are converted to a common unit of energy. The fuel consumption data provided by the NAEI is available either in units of mega tonnes (solid or liquid fuels) or mega therms (gaseous fuels); these are converted to thousand tonnes of oil equivalent using the average gross calorific value of fuels and unit conversions presented in table A2 of DUKES (DESNZ, 2025).
Results
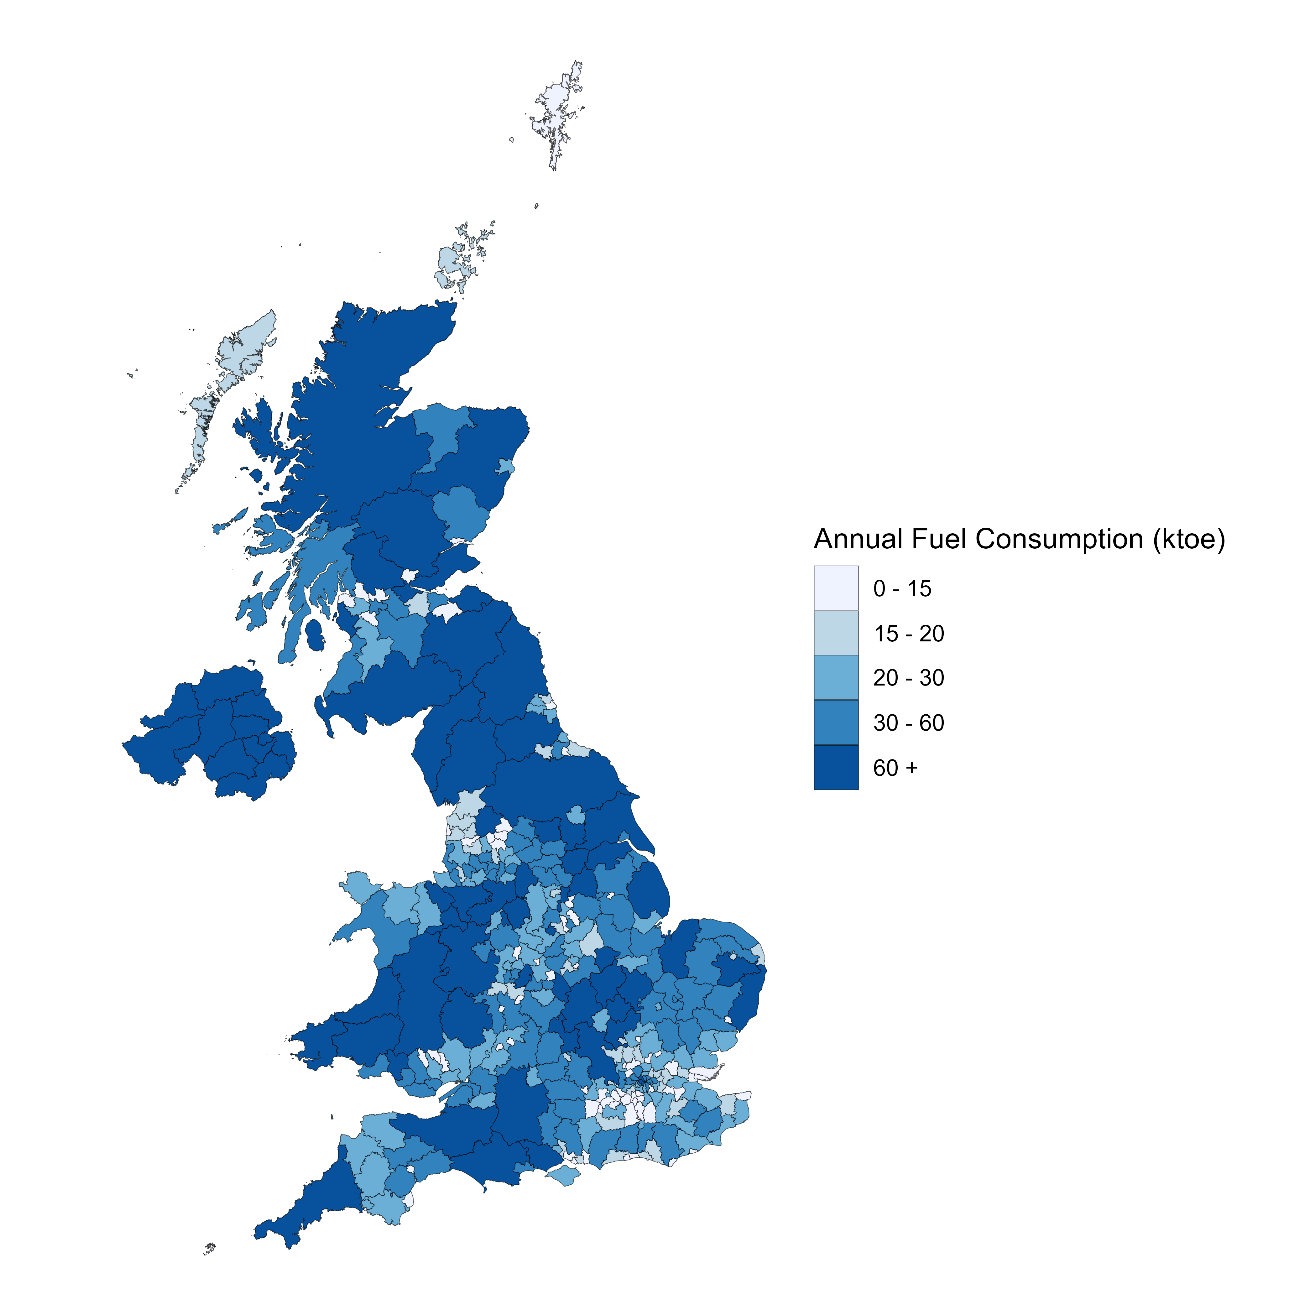
This section displays the mapped results of this study, comments on the changes to the methodology and data, and compares the sub-national other energy statistics with other published national and sub-national datasets. Based on the UK Greenhouse Gas Inventory, Figure 1 indicates the UK total residual fuel use trend 2005 – 2024 by each sector. Figure 2 shows residual fuel consumption by local authority area in 2024.
Figure 1. National total ‘residual fuel use’ trend by sector, 2005-2024 from GHGI data
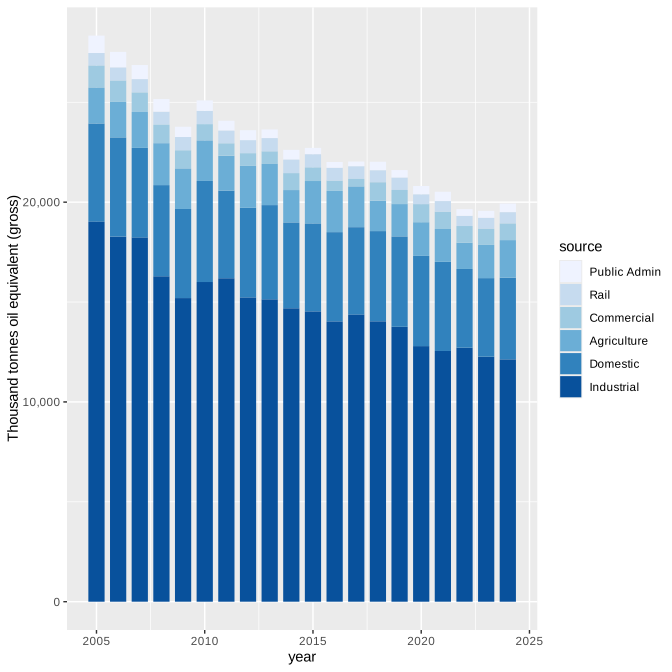
Figure 2. UK map of sub-national consumption of residual fuels in 2024
The data tables that this report accompanies provide a breakdown of fuel consumption by sector and by fuel for 2005-2024.
The effect of changes to the methodology and datasets
The entire time series is revised each year to take account of methodological improvements and data updates, most commonly because of revisions to the core energy statistics presented in DUKES. Updates, particularly involving revised methodologies, may affect the whole time-series, so estimates of emissions for a given year may differ from estimates of emissions for the same year reported previously. Therefore, comparisons between estimates made in different years should take account of whether there have been changes to the methodology, the activity data, or the spatial distribution.
For the 2024 dataset, no methodological updates were made to the spatial distribution of fuel use for the relevant source sectors. Any differences observed compared to previous years are therefore primarily attributable to underlying data revisions, including updates to statistical data (such as employment statistics from the Inter-Departmental Business Register) and changes within the NAEI, such as the revisions to gas oil described earlier in this report.
Comparison with other national and sub-national data
DUKES, GHGI & sub-national residual fuels statistics
Although DUKES, the GHGI and local authority fuel consumption estimates are well-correlated, these datasets are not fully internally-consistent. This arises from both the utilisation of the ETS datasets in the GHGI and sub-national data, and the re-allocation of gas and fuel oil between combustion sectors. Data from the ETS and direct from plant operators in some cases provides more accurate, detailed information on the fuels used at industrial and commercial sites, which may not have been available when the GHGI or DUKES were compiled.
Coverage of national and sub-national statistics
A comparison of the sectoral and geographic coverage of sub-national residual fuel, NAEI, GHGI and local authority area greenhouse gas emissions datasets is provided in Table 3 below. The local authority greenhouse gas emissions dataset is a spatial disaggregation of the GHGI on an end user basis. This means that emissions from the production and processing of fuels (including electricity) are reallocated to users of these fuels to reflect total emissions for each type of fuel consumed.
Table 3. Comparison of what is included in the sub-national residual fuel statistics with other NAEI outputs
| UK Air Quality Emissions Inventory | UK Greenhouse Gas Inventory | Local Authority Greenhouse Gas Emissions | Sub-national Residual Fuel Statistics | |
|---|---|---|---|---|
| Published Data | ||||
| Air Quality Pollutants | Yes | No | No | No |
| Greenhouse Gases | No | Yes | Yes | No |
| Energy | No | Yes | No | Yes |
| Data Types | ||||
| Point of Release | Yes | Yes | No | Yes |
| End-User | No | Yes | Yes | No |
| Report System | ||||
| United Nations Economic Commission for Europe (UNECE) | Yes | No | No | No |
| United Nations Framework Convention on Climate Change (UNFCCC) | No | Yes | No | No |
| Mapping Resolution | ||||
| 1x1 Km | Yes | Yes | No | No |
| Devolved Governments | Yes | Yes | Yes | Yes |
| Local Authorities | No | No | Yes | Yes |
| Sectors and Regions Included | ||||
| Power Stations | Yes | Yes | Yes [note 1] | No |
| Shipping | Yes | Yes | No | No |
| Aviation | Yes | Yes | No | No |
| Rail | Yes | Yes | Yes | Yes |
| Off-Shore Users | Yes | Yes | No | No |
| Crown Dependencies (Isle of Man, Guernsey and Jersey) | Yes | Yes | No | No |
| Overseas territories | Yes [note 2] | Yes | No | No |
Note 1: Emissions from power stations are reallocated to the end user national estimate, which then is allocated back to local authorities depending on the sector use and not according to the location of the power stations.
Note 2: Gibraltar only
Additional information
This section of the report describes how the national estimates of fuel consumption are spatially disaggregated throughout the UK.
Future updates to these statistics
The next publication of UK residual fuel consumption at regional and local authority level will be in July 2027.
Revisions policy
The DESNZ statistical revisions policy sets out the revisions policy for these statistics, which has been developed in accordance with the UK Statistics Authority Code of Practice for Statistics.
User engagement
Users are encouraged to provide comments and feedback on how these statistics are used and how well they meet user needs. Comments on any issues relating to this statistical release are welcomed and should be sent to EnergyEfficiency.Stats@energysecurity.gov.uk.
The DESNZ Public involvement and engagement strategy sets out our approach to engaging with users of our official statistics.
Accredited Official Statistics designation
Accredited Official Statistics are called National Statistics in the Statistics and Registration Service Act 2007.
These Accredited Official Statistics were independently reviewed by the Office for Statistics Regulation (OSR) in June 2014 and had their accreditation reviewed in September 2018. They comply with the standards of trustworthiness, quality and value in the Code of Practice for Statistics and should be labelled ‘Accredited Official Statistics’.
Our statistical practice is regulated by the OSR.
OSR sets the standards of trustworthiness, quality and value in the Code of Practice for Statistics that all producers of official statistics should adhere to.
DESNZ has published several Official Statistics standards and policies that it follows.
You are welcome to contact us by emailing EnergyEfficiency.Stats@energysecurity.gov.uk with any comments about how we meet these standards.
Alternatively, you can contact OSR by emailing regulation@statistics.gov.uk or via the OSR website.
Contact
Email: EnergyEfficiency.Stats@energysecurity.gov.uk
Media enquiries: 020 7215 1000
References
BERR. (2008). Sub-national consumption of other fuels. Retrieved from The National Archives: https://www.gov.uk/government/publications/sub-national-residual-fuel-consumption-experimental-estimates-2003-to-2004
Brown P, C. L. (2026). UK Greenhouse Gas Inventory, 1990 to 2024: Annual Report for Submission under the Framework Convention on Climate Change. Retrieved from https://naei.energysecurity.gov.uk/reports/uk-greenhouse-gas-inventory-1990-2024-annual-report-submission-under-framework-convention
DESNZ. (2025). Digest of United Kingdon Energy Statistics (DUKES) 2024: main chapters and annexes. Department for Energy Security & Net Zero. Retrieved from https://www.gov.uk/government/collections/digest-of-uk-energy-statistics-dukes
Elliott, M. I. (2026). UK Informative Inventory Report (1990 to 2024). Retrieved from https://naei.energysecurity.gov.uk/reports/uk-informative-inventory-report-1990-2024
Met Office. (2016). UK regional climates. Retrieved from https://www.metoffice.gov.uk/climate/uk/regional-climates
Tsagatakis, I., Richardson, J., Evangelides, C., Richmond, B., Hows, S., Pearson, B., . . . Pommier, M. (2025). UK Emission Spatial Methodology: A report of the National Atmospheric Emission Inventory 2023. Retrieved from https://naei.beis.gov.uk/reports/reports?report_id=1112
Note: the UK spatial emissions methodology report corresponding to the latest statistics for 2005-2024 has not been published yet. It will be accessible from the NAEI website once published