Tri-service families continuous attitude survey 2026 main report
Published 16 July 2026

© Crown copyright 2026
This publication is licensed under the terms of the Open Government Licence v3.0 except where otherwise stated. To view this licence, visit nationalarchives.gov.uk/doc/open-government-licence/version/3 or write to the Information Policy Team, The National Archives, Kew, London TW9 4DU, or email: psi@nationalarchives.gov.uk.
Where we have identified any third party copyright information you will need to obtain permission from the copyright holders concerned.
This publication is available at https://www.gov.uk/government/statistics/tri-service-families-continuous-attitude-survey-2026/tri-service-families-continuous-attitude-survey-2026-main-report
This annual statistical release provides harmonised results from the single Service Families Continuous Attitude Surveys along with results from previous years.
This report provides information on experiences of, and attitudes towards various aspects of Service family life.
Statistics from the Families Continuous Attitude Survey (FamCAS) are used by both internal Ministry of Defence (MOD) teams and external bodies to inform the development of policy and measure the impact of decisions affecting personnel and their families.
1. Main points and trends
Over half of Service spouses (55%) are satisfied with their quality of life as a Service family whilst 19% are dissatisfied
Figure 1.1: Satisfaction with the quality of life as a Service family between 2022 and 2026
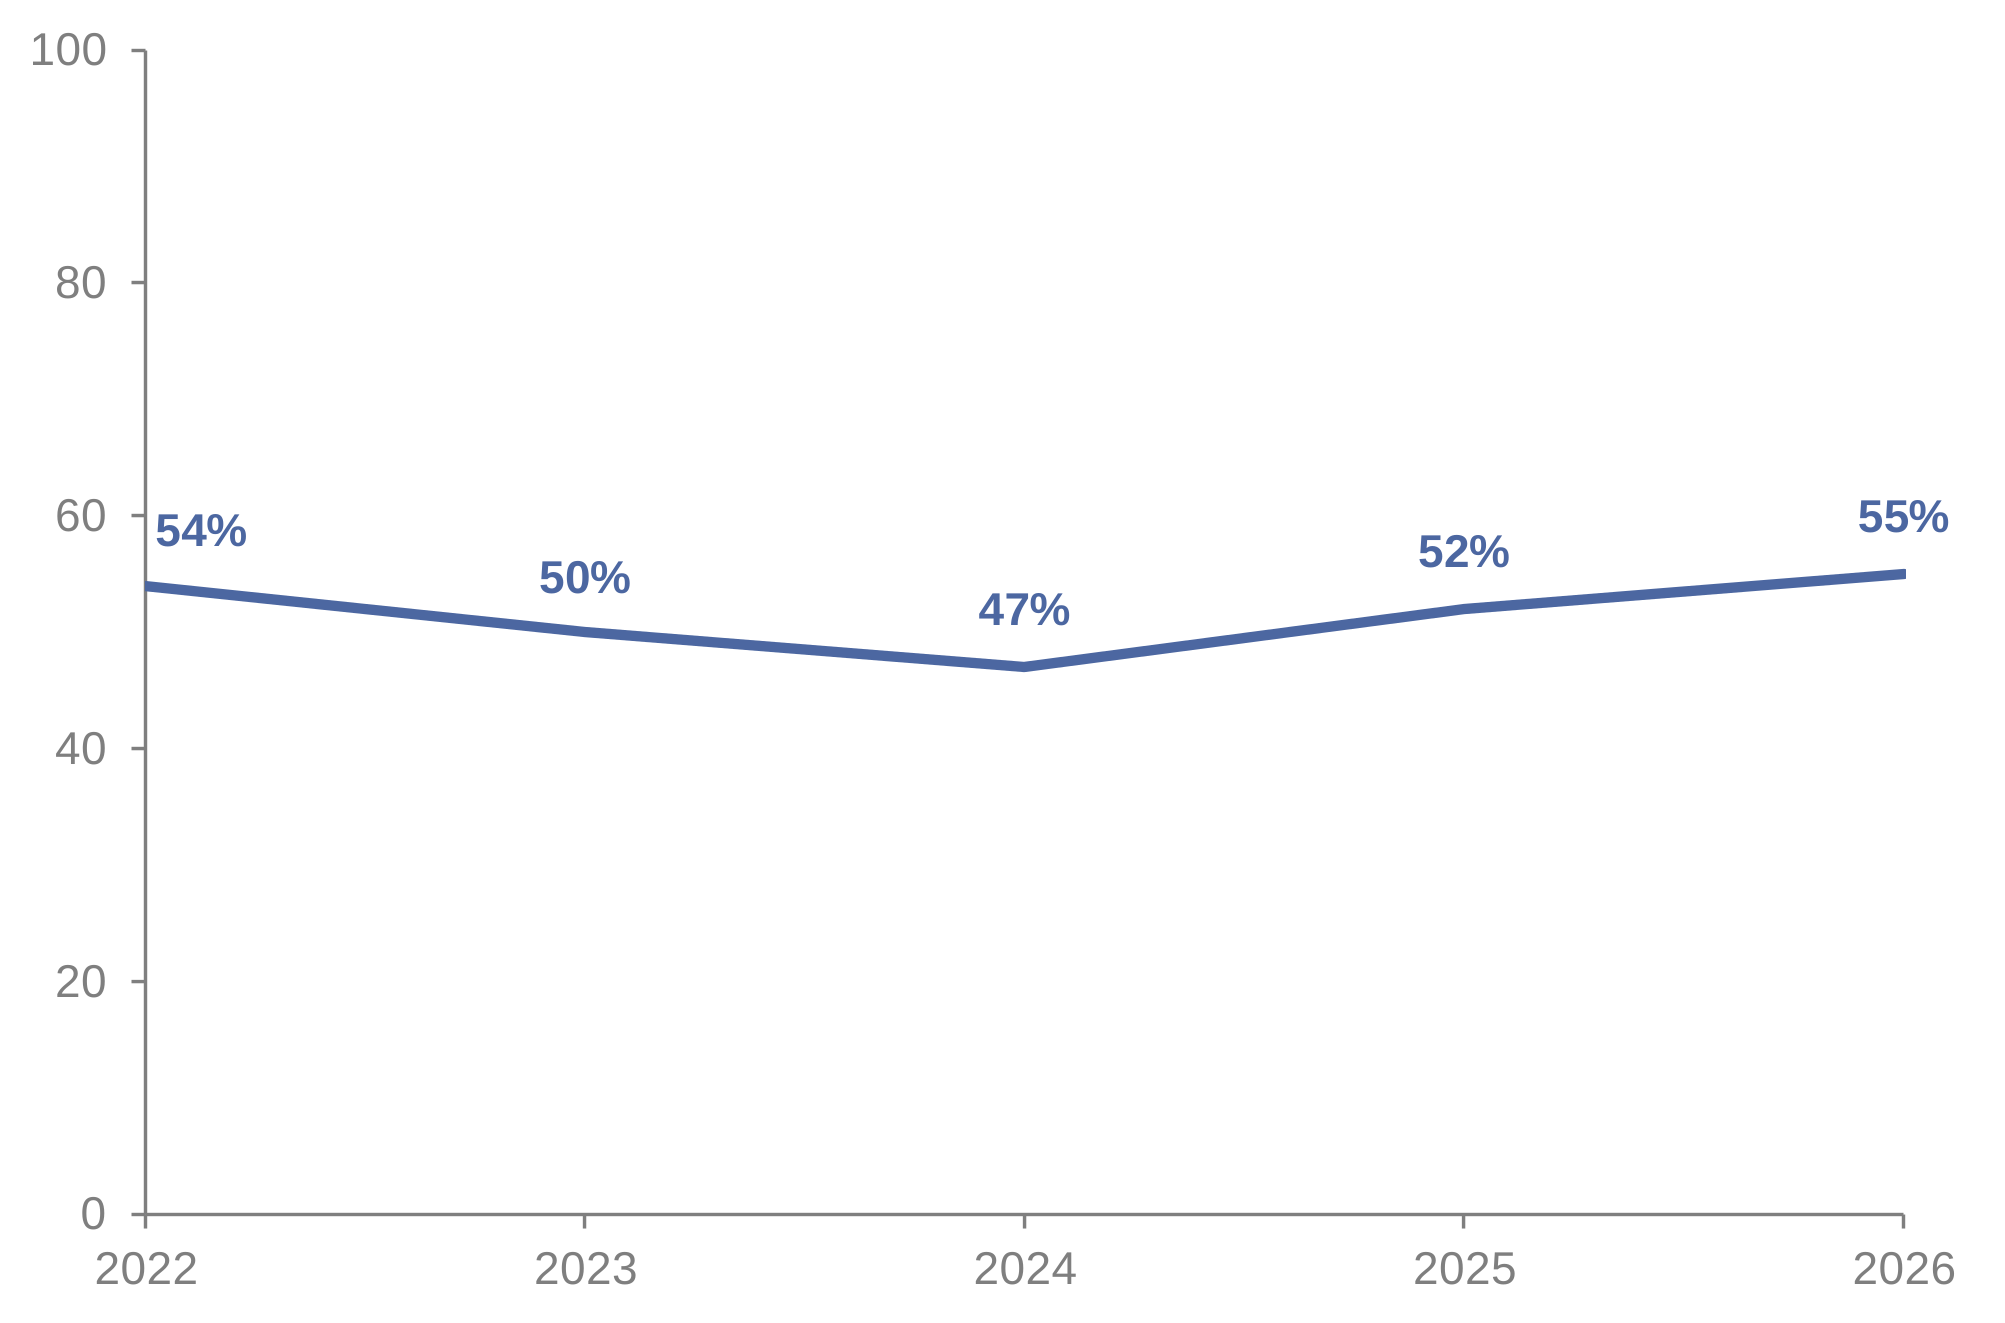
Figure 1.1 is a line graph that shows satisfaction with the quality of life as a Service family decreased from 54% in 2022 to 47% in 2024. Satisfaction improved to 52% in 2025, back in line with the level reported in 2022. Satisfaction remains at a similar level this year (55%).
Overall, there has been little change in FamCAS results in 2026. Several measures declined between 2022 and 2024, increased in 2025 to levels comparable with 2022, and remain at similar levels in 2026.
Nearly four in ten spouses (38%) disagree they are able to find out about support offered by the Service
Figure 1.2: Spouses agree or disagree they can get the information they need about support offered to them by the Service
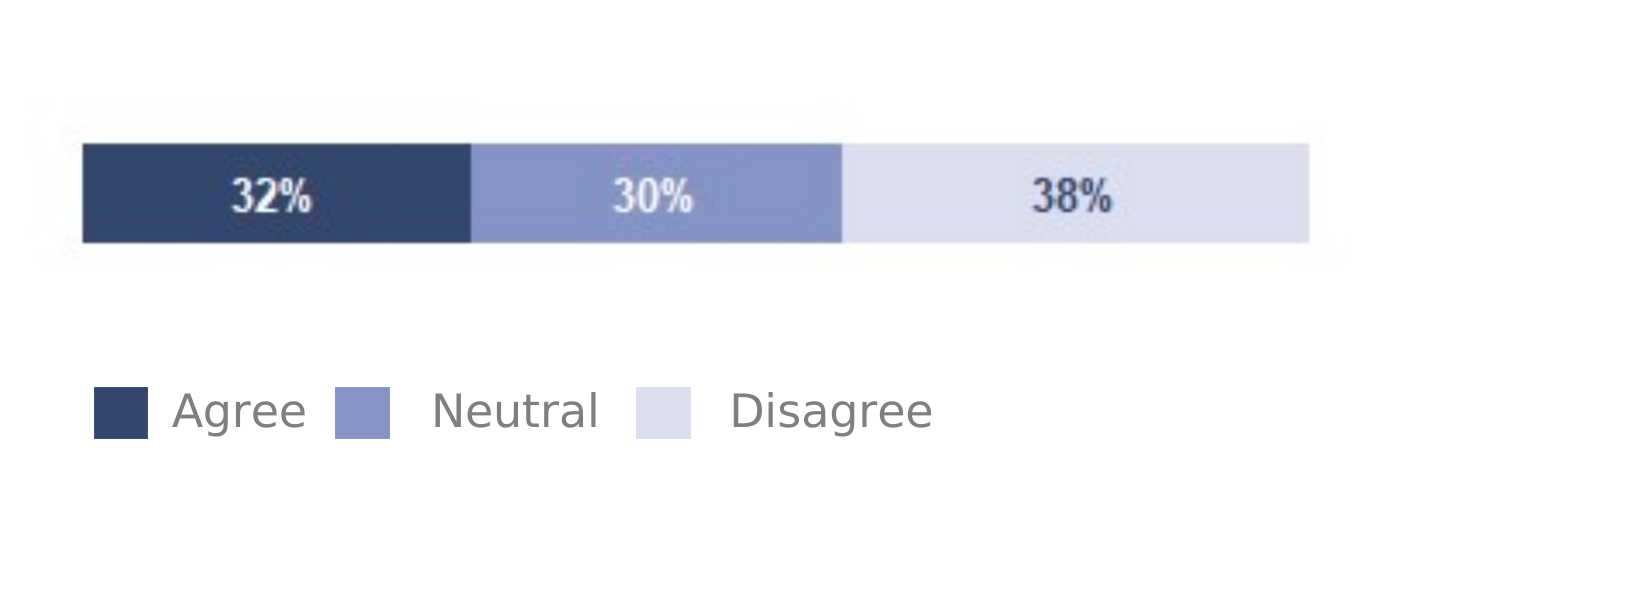
Figure 1.2 is a stacked bar chart that shows 32% of spouses agree they can get the information they need about support offered by the Service whilst 38% disagree. These results are unchanged since this question was introduced in 2022.
A quarter of spouses (25%) agree they can find out about policies aimed at them and their family whilst 42% disagree. These results are unchanged since last year, when this question was introduced.
Spouses are more likely to encourage their partner to stay in the Service than leave
Figure 1.3: How often spouses have encouraged their Serving partner to stay or leave the Service over the past year
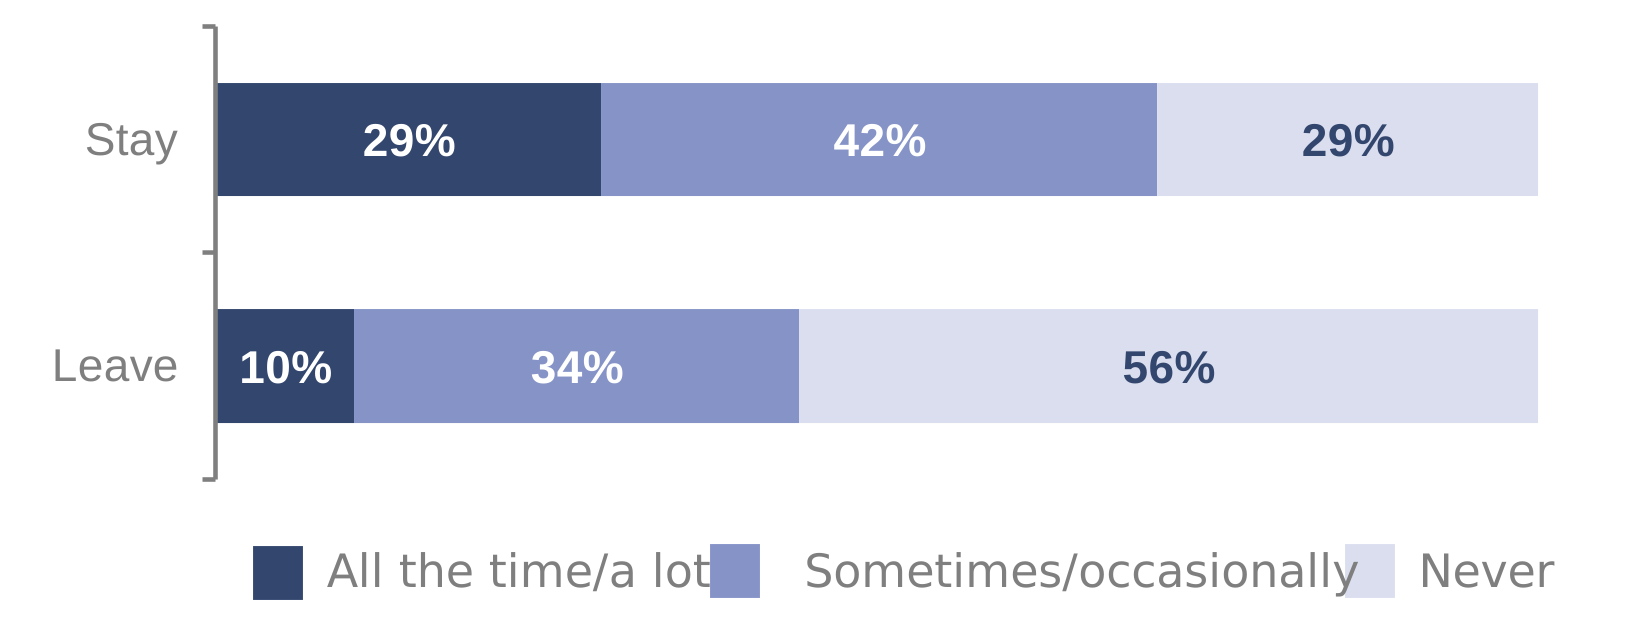
Figure 1.3 contains two stacked bar charts that show nearly three in ten spouses (29%) encouraged their Serving partner to stay in the Service “all the time/a lot” over the past year. This compares to 10% who encouraged their Serving partner to leave “all the time/a lot”.
These results are similar to those reported last year, when this question was introduced.
When asked how they would feel if their partner left the Service, a third (34%) said they would feel happier whilst 14% would be less happy. Three in ten spouses (30%) would feel no different and 22% don’t know how they would feel.
Ability to access dental treatment has improved this year
Figure 1.4: Families able to access dental treatment without difficulties between 2015 and 2026
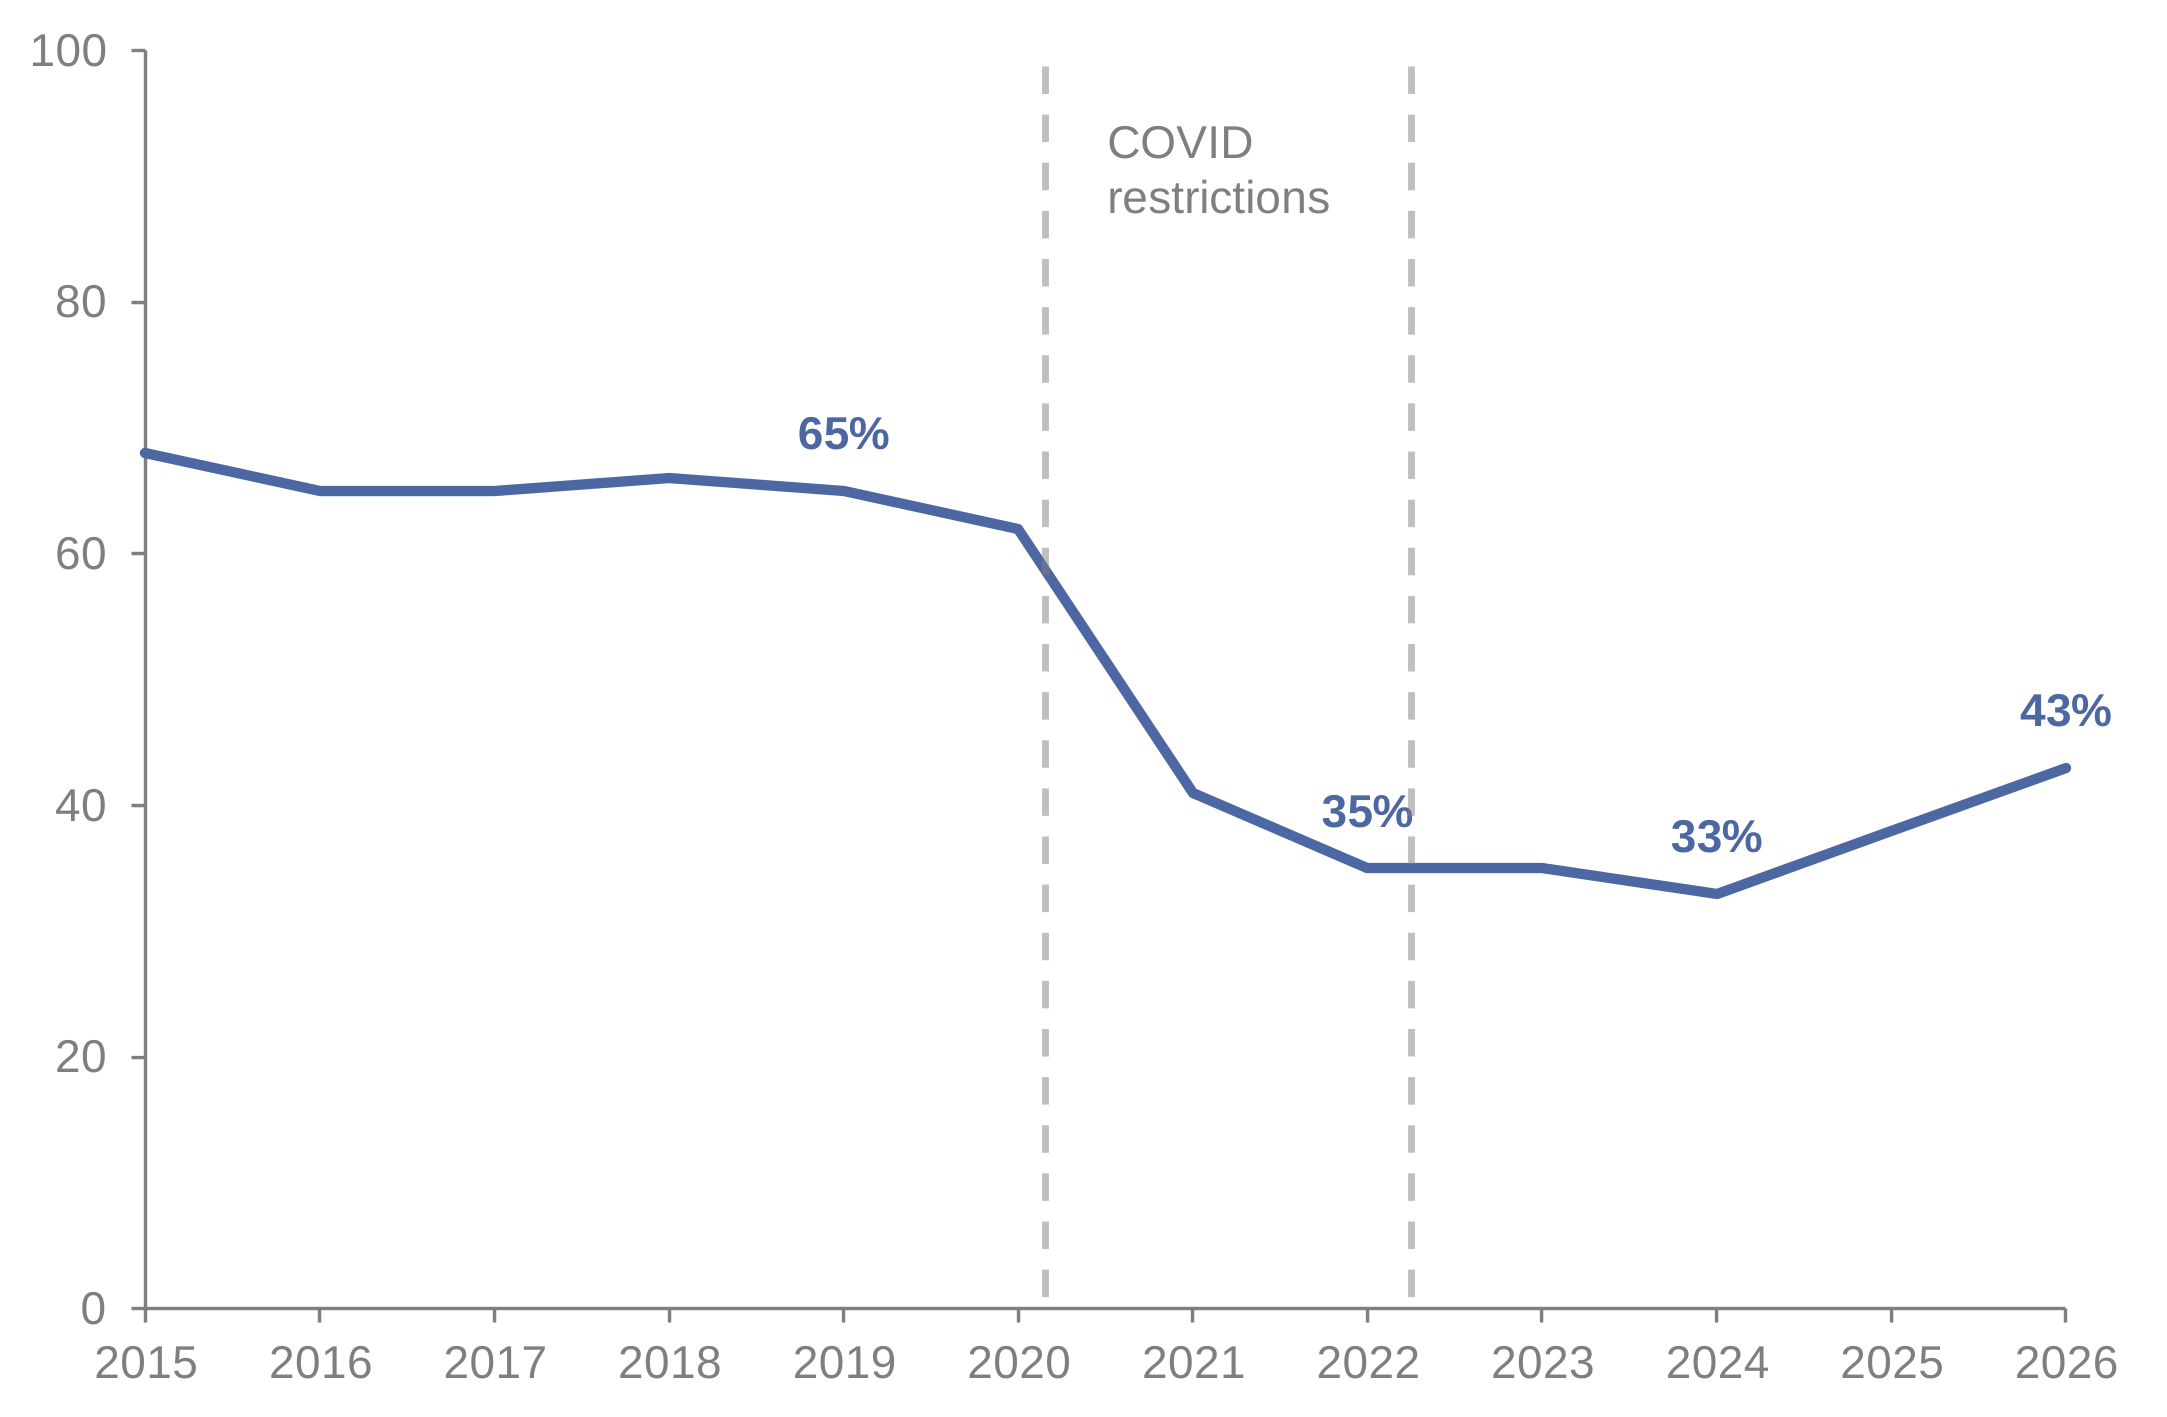
These results are based on families who required access to dental treatment.
Figure 1.4 is a line graph showing the proportion of families able to access dental treatment without difficulty between 2015 and 2026.
Between 2015 and 2020, levels averaged around 65%. During the lockdowns and restrictions of COVID-19, this fell to 35% in 2022.
Levels increased in 2025 and again in 2026, reaching 43%. This is higher than levels reported between 2022 and 2025 but remains below all levels prior to 2021.
Access to GP Services without difficulty has also improved this year, increasing from 66% in 2025 to 71% in 2026. This is above levels reported between 2022 and 2025, but below all levels prior to 2022.
Amongst those living in Service Family Accommodation, fewer families are dissatisfied with the response to requests for maintenance and repair this year
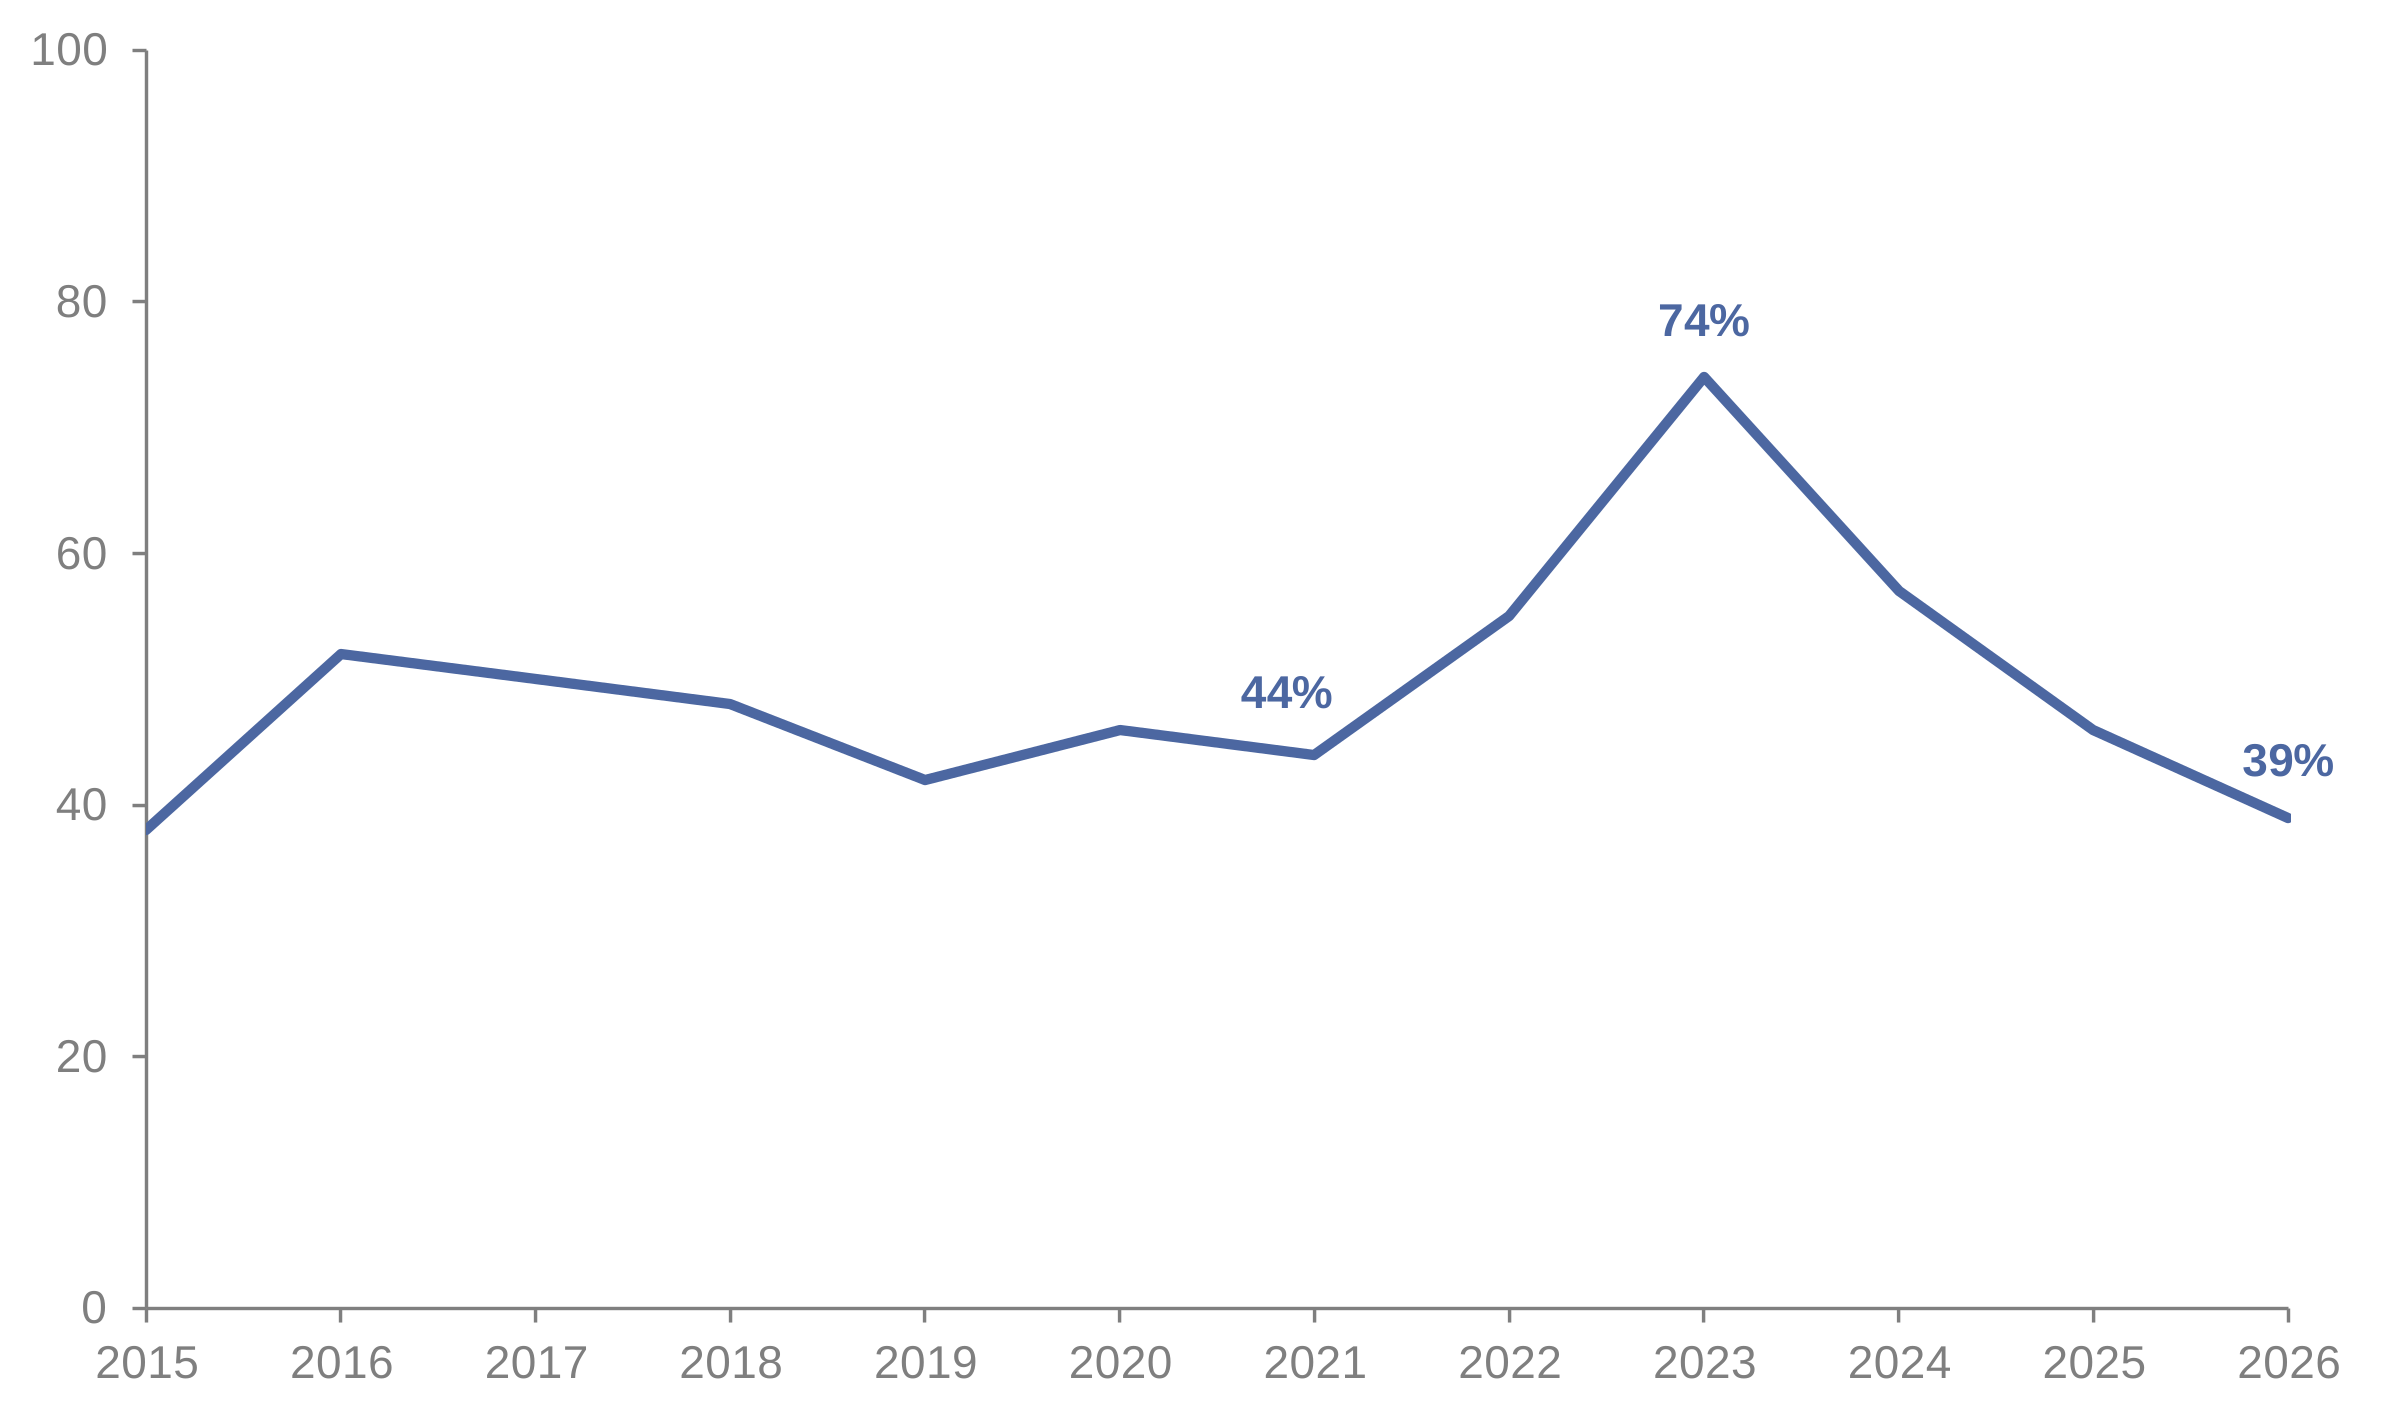
Figure 1.5: Dissatisfaction with the response to requests for maintenance and repair of Service Family Accommodation from 2015 to 2026
These results are based on those living in Service Family Accommodation (SFA) or Substitute Service Family Accommodation (SSFA).
Figure 1.5 is a line graph that shows dissatisfaction increased from 44% in 2021 to 74% in 2023. This has fallen for the third year in a row to 39% in 2026 and is now lower than most levels reported since 2016.
Satisfaction with the response to requests for maintenance or repair work of SFA/SSFA mirrors this trend, falling from 38% in 2021 to 16% in 2023 before increasing in 2024 and 2025. Levels in 2026 are unchanged at 40%, which is comparable to or higher than those reported in previous years, except for 2015 (45%).
Responsible Statistician: Surveys Head of Branch
Email: Analysis-Surveys-Enquiries@mod.gov.uk
Background Quality Report: FamCAS webpage
Would you like to be added to our contact list, so that we can inform you about updates to these statistics and consult you if we are thinking of making changes? You can subscribe to updates by emailing Analysis-Surveys-Enquiries@mod.gov.uk.
Please refer to the FamCAS webpage for all data presented in this publication.
2. Introduction
About these statistics
The Families Continuous Attitude Survey (FamCAS) refers to a set of harmonised Tri-Service questions included within the annual single Service Families Continuous Attitude Surveys.
This report highlights the main findings of FamCAS 2026 and looks at changes over the past few years in areas such as housing, employment, access to healthcare, childcare and children’s education. It also looks at families’ views on Service family life, welfare support and communications.
The commentary within this report includes comparisons between:
- RN/RM, Army, and RAF families
- Officer and Other Rank families
- Families living overseas and those living in England
- Families who moved for Service reasons and those who have not moved.
The FamCAS is one of the main ways that the department gathers information on the attitudes and experiences of Service families.
The 2026 survey
The 2026 FamCAS was distributed to a sample of 27,710 trained Regular Service personnel who were married or in a civil partnership. The Serving person was sent an email invite with a link to the survey that they were asked to pass on to their spouse.
The survey is now completely online only, with no paper surveys. The Army moved to online only in 2024, the RAF in 2023 and the RN/RM in 2020.
The survey was open from 4th February 2026 until 17th April 2026.
Overall, 4,245 valid responses were received, representing a response rate of 15%.
This is a decrease from the 2025 response rate of 17%. This is driven by a decrease in the Army response rate which fell from 23% in 2025 to 18% this year. This mirrors a similar drop in response rates for the RAF between 2024 and 2025.
Despite this decrease in the response rate this year, the substantial number of responses to this survey (over 4,000) allow robust inferences to be made. Measures of precision for all results are provided in the reference tables.
Survey results are weighted to ensure they are representative of the married Service population by Service, Rank, and spouse location.
Figure 2.1: Response rates by Service
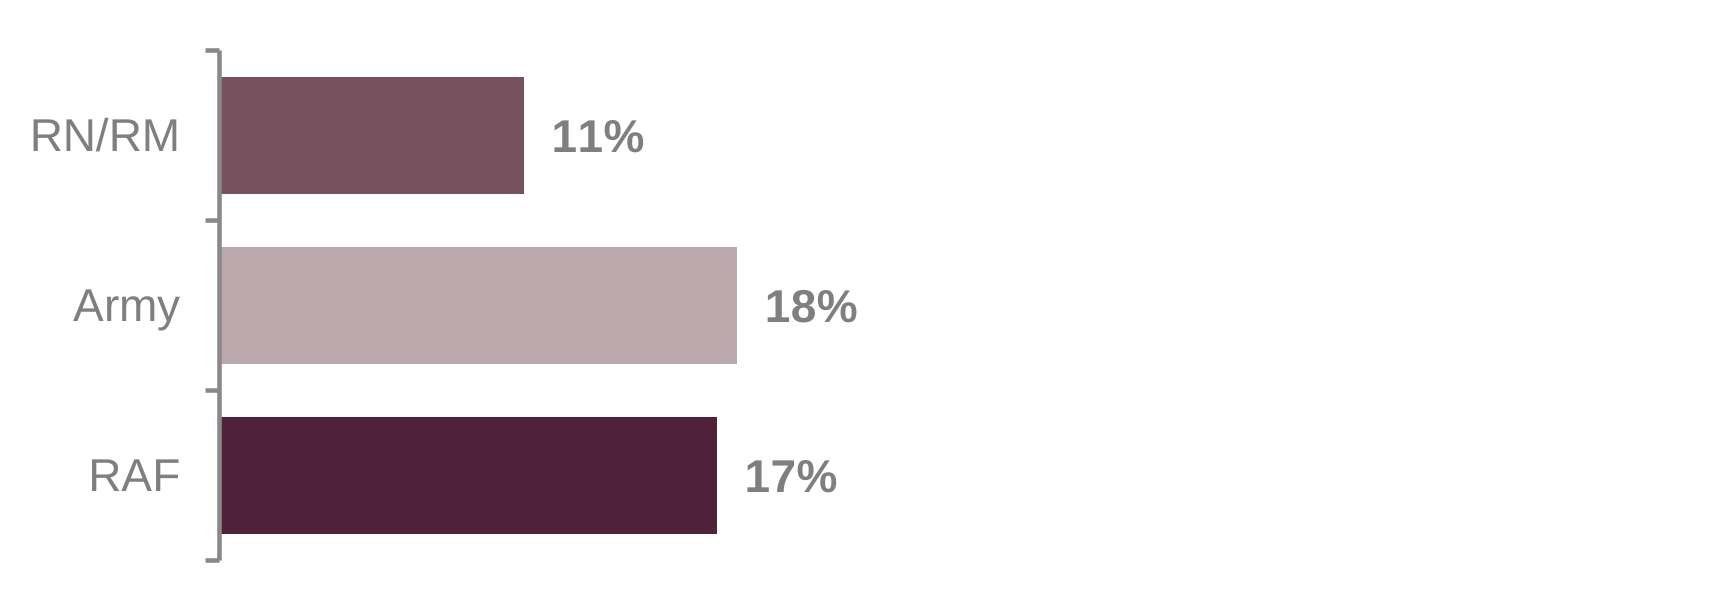
Figure 2.1 is a bar chart showing response rates by Service. Army and RAF receive similar response rates of 18% and 17% respectively, whilst the response rate for RN/RM families is lower (11%).
The Armed Forces Continuous Attitude Survey (AFCAS) also reports lower response rates for RN/RM personnel than Army or RAF. This may suggest more challenges around contact or motivation to complete the survey. Fewer RN/RM Serving personnel live with their partner during the working week compared to Army or RAF personnel which adds a further challenge when trying to contact RN/RM families.
About this report
The following terminology has been used throughout this report:
- Married refers to those who are married or in a civil partnership.
- Spouse refers to spouse or civil partner
- RN/RM refers to Royal Navy/Royal Marines
AFCAS 2026 comparisons:
Many of these comparisons are based on a subset of the Armed Forces Continuous Attitude Survey (AFCAS) results for Service personnel who are married/in a civil partnership. As a result, they will not always match published AFCAS results.
National results for context:
National figures are used to provide context wherever possible. However, these are rarely directly comparable due to demographic differences between the general population and the population of Service spouses.
Only differences that are statistically significant are commented on within this report; statistical tests were carried out at the 99% confidence level.
This is at a fairly stringent level and means that there should be a less than 1% chance that differences observed in FamCAS results are not representative of Service families as a whole.
This reduces the likelihood of wrongly concluding that there has been an actual change based on survey results.
Historical context for the 2026 report
Impact of the Modernised Accommodation Offer (MAO) announcement
Whilst FamCAS 2024 was in field, the Modernised Accommodation Offer was advertised to Service personnel and their families.
However, in response to feedback and concerns raised following these communications, changes to family accommodation entitlements were paused in February 2024 to enable a further review to take place.
This may explain, in part, some of the more negative views reported amongst Officer spouses in 2024. Many of these returned to previous levels in 2025.
Impact of Covid-19
FamCAS 2021 captured experiences during lockdowns and restrictions. Several areas of improvement were reported in 2021 including the effect of Service life on their children and their relationship with their partner.
By 2024, many changes reported had reverted back to pre-Covid levels. This may be somewhat reflective of families re-evaluating following the lifting of restrictions.
This is likely to explain the peaks observed in 2021 when looking at results over the past few years.
3. About you
This section provides background information on Service families including:
- Population of married Service personnel by Service, Rank, and partner location
- Gender, age, and nationality of Service spouses
- Qualifications
- Employment
- Home ownership
- Service families by age of children
- Caring responsibilities
- Mobility of Service families
- Separation
Married Service personnel by Service, Rank, and partner location
The estimates provided below are derived from the Joint Personnel Administration system (JPA) as of 1 February 2026. This information is used to weight the survey results to ensure they are representative of the married Service population by Service, Rank, and spouse location.
As of 1 February 2026, approximately 53,000 Regular trained Service personnel are married or in a civil partnership.
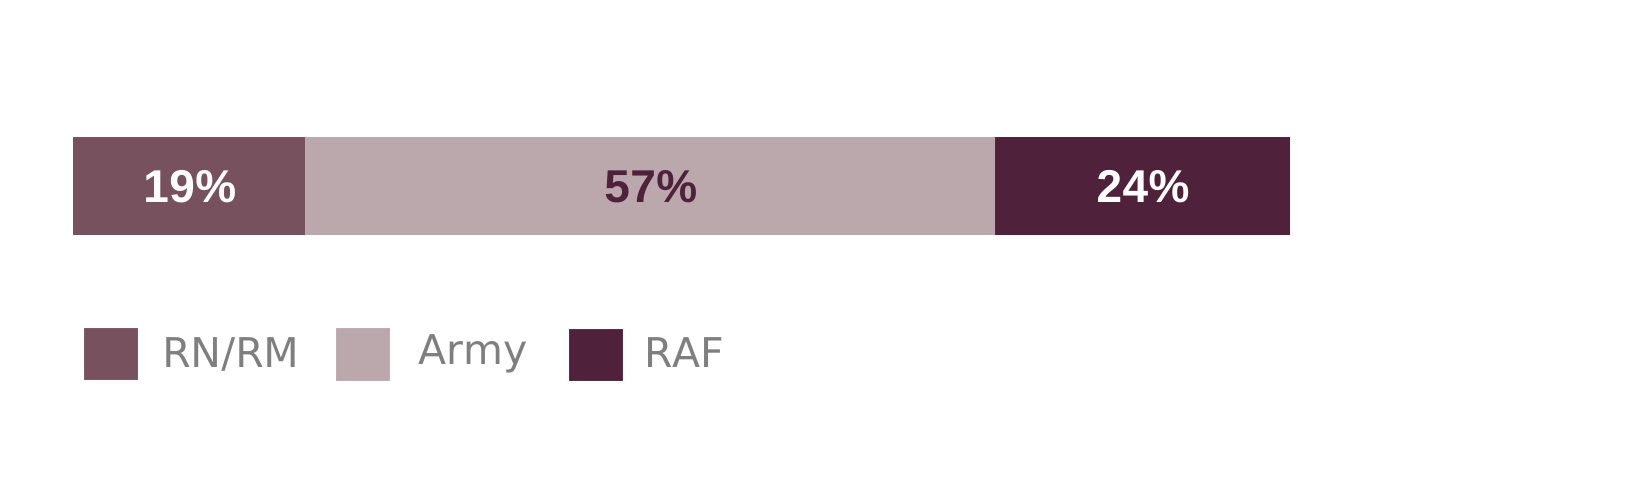
Figure 3.1: Married personnel by Service
Source: Based on data taken from JPA as of 01 Feb 2026.
Figure 3.1 is a stacked bar chart that shows nearly six in ten married Regular trained Service personnel belong to the Army (57%). About a quarter (24%) belong to the RAF and the remaining 19% serve with the Royal Navy. This is broadly in line with the Service distribution of the Full-Time trained strength of the UK Armed Forces.
Seven in ten married Regular trained Service personnel are Other Ranks (70%), with the remaining 30% being Officers.
Please refer to the Quarterly Service Personnel Statistics for further information on the UK Armed Forces population.
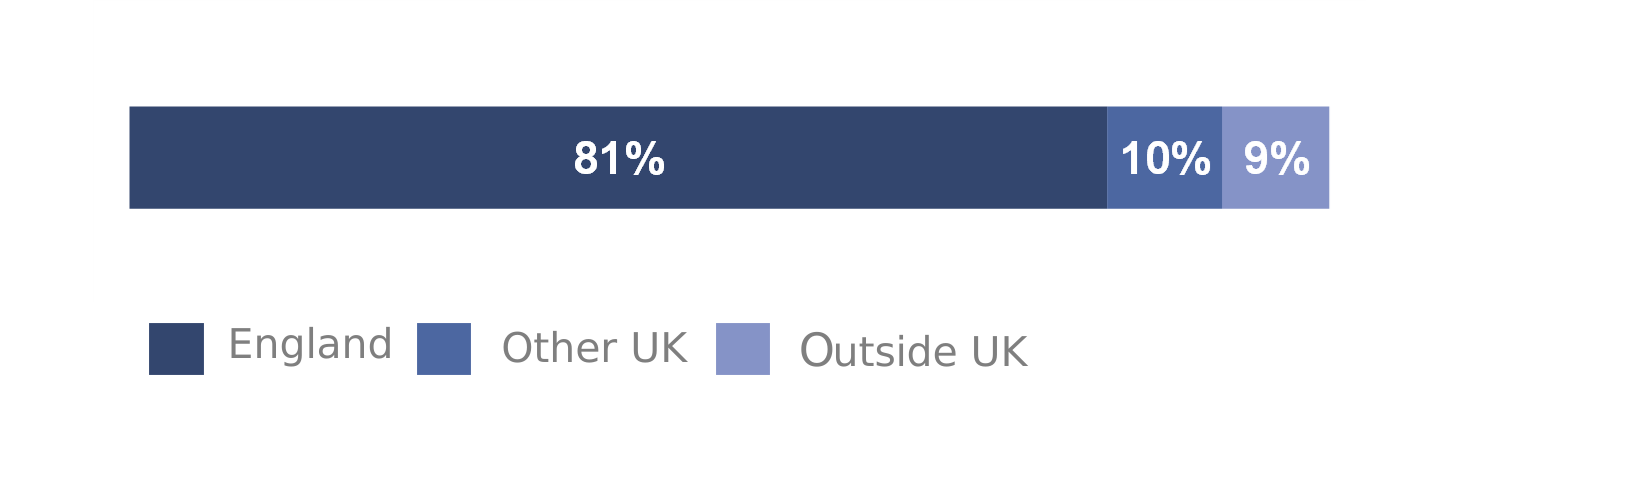
Figure 3.2: Service spouses by where they live
Source: Based on data taken from JPA as of 01 Feb 2026.
Figure 3.2 is a stacked bar chart that shows the proportion of Service spouses by where they live. Most spouses live in England (81%). One in ten live in other UK countries and the remaining 9% live outside the UK.
Data quality note
The estimate of married Service personnel uses a self-reported field so there may be some under-reporting. The 2026 Armed Forces Continuous Attitude Survey (AFCAS) estimated 46% of Service personnel were married/in a civil partnership, applying this to the trained Regular strength equates to just over 58,000 personnel.
Estimates within the rest of this report are from the 2026 Families Continuous Attitude Survey (FamCAS). Comparisons to other data sources are referenced.
Gender and age of Service spouses
Nine in ten Service spouses are women. This reflects the fact that most Service personnel are men.
Figure 3.3: Service spouses by age
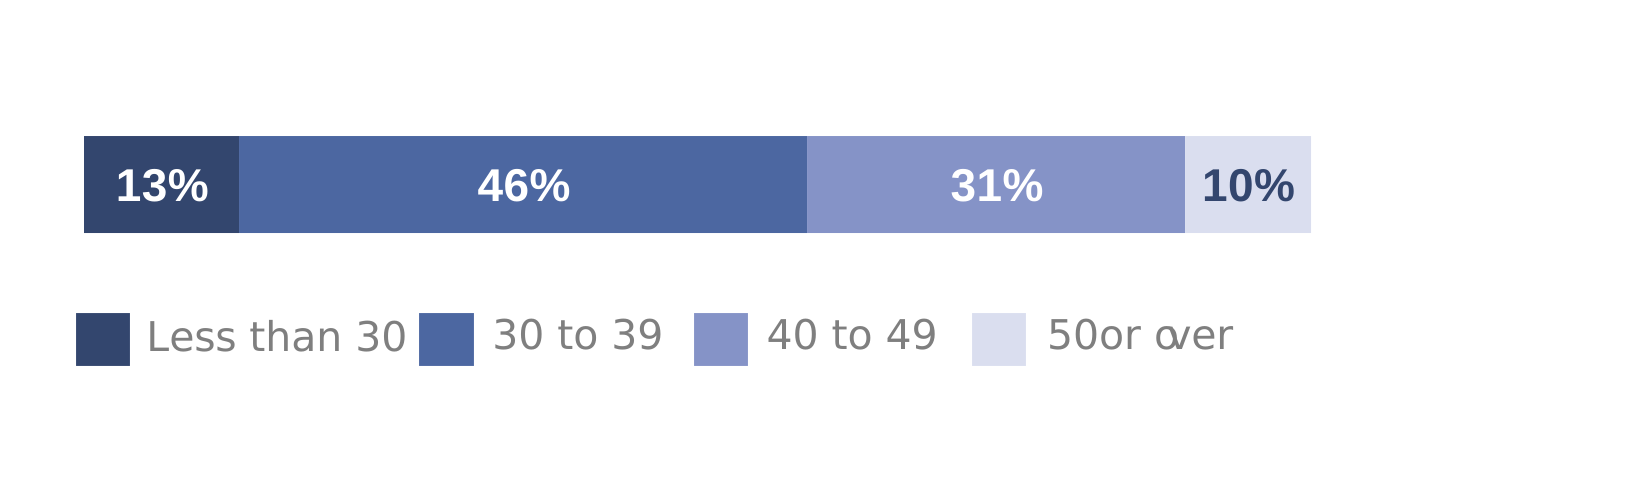
Figure 3.3 is a stacked bar chart that shows the proportion of Service spouses by age group. Nearly three-fifths of Service spouses (59%) are less than 40 years old. Just over three in ten (31%) are aged 40 to 49 whilst one in ten (10%) are aged 50 or over.
National results for context
The 2021 Census estimates 61% of the married population in England are aged over 50. This compares to 10% for Service spouses. This difference reflects the much younger age profile of Service spouses compared to those in the wider married population.
Nationality of Service spouses
Nearly one in seven Service spouses (14%) report a non-UK nationality. A higher proportion of Army Other Rank spouses report a non-UK nationality (26%) than the other Services/Rank groups.
Amongst Regular trained Service personnel, the Army reports a higher proportion of non-UK nationalities.
Please refer to the UK Armed Forces Biannual Diversity Statistics for further information on the age, gender, and nationality of Service personnel.
Qualification levels
More than six in ten Service spouses (63%) have a qualification of Level 4 or above.
This differs by Rank: 82% of Officer spouses are educated to Level 4 or above compared to 54% of Other Rank spouses.
Level 4 or above includes Higher National Certificates, Higher National Diplomas, Bachelors’ Degrees, and post-graduate qualifications.
National results for context
Although not directly comparable, the 2021 Census estimates that 33.8% of those aged 16 or above in England or Wales are educated to Level 4 or above.
Employment
Just over eight in ten Service spouses (81%) are employed. This includes 11% of spouses who are also serving in the Regular Armed Forces. Couples where both partners are members of the Regular Armed Forces are referred to as dual Serving couples.
Employed refers to those in full-time, part-time or self-employment.
AFCAS 2026 comparison
These results are broadly consistent with the AFCAS 2026 findings, 82% of spouses/civil partners are employed, including 9% who are also serving in the Regular Armed Forces.
Homeownership
Six in ten Service families (60%) own a home.
Homeownership differs by Rank and Service, ranging from 43% for Army Other Rank families to 88% for RN/RM Officer families.
AFCAS 2026 comparison
These results are broadly consistent with the AFCAS 2026 findings, 61% of married Service personnel are homeowners.
Service families by age of children
Nearly eight in ten Service families (78%) have children. This includes families whose children are all over the age of 18.
Proportion of families by age of children:
- 70% have a child aged under 18
- 57% have a child aged under 11
- 31% have a child aged under 5
- 20% have a child aged under 2
- 53% have a school-aged child
National results for context
Although not directly comparable, the 2025 UK Labour Force Survey estimates 53% of married couple households have children and 40% have dependent children, considerably fewer than Service families.
Spouses with caring responsibilities
Nearly one in six spouses (16%) look after or give help or support to someone with a long-term physical or mental health condition or illness or problems relating to old age. This question was introduced this year.
National results for context
Although not directly comparable, the 2021 Census estimates 10% of people, aged 18 to 59, living in England or Wales, provide unpaid care to someone.
Mobility
Over a fifth of Service families (21%) moved for Service reasons over the past year.
This has been largely stable since 2018, although it increased in 2020, driven by Army families. This was due to the Army Basing Programme which involved the return of a large number of Service families from Germany to the UK over the summer of 2019.
RN/RM families are less likely to have moved for Service reasons over the past year (12%) than Army (23%) or RAF families (20%).
A higher proportion of Officer families moved for Service reasons (23%) than Other Rank families (19%).
Of those who moved for Service reasons in the past year, nearly half of families (49%) moved within the same UK country. Over one in ten families (13%) moved between UK countries whilst 20% moved to the UK from overseas. The remaining 19% moved overseas.
Over one in seven families (15%) have moved at least three times for Service reasons over the past five years. This differs by Rank: nearly a quarter of Officer families (23%) have moved at least three times for Service reasons over the past five years compared to 12% of Other Rank families.
Nearly four in ten families (38%) have not moved for Service reasons in the past five years. Nearly six in ten RN/RM families have not moved in the past five years (59%) followed by 37% of RAF families. Army families are the least likely to have not moved in the past five years (31%).
Separation
A quarter of Service families (25%) live apart during the working week. A higher proportion of RN/RM families live apart during the working week (39%) compared to Army and RAF families (22% and 21% respectively).
Nearly three in ten families (29%) were separated for three months or more over the past year.
Just over one in six RN/RM spouses (17%) reported separation of six months or more over the past year, this compares to 9% of Army and 6% of RAF spouses.
Figure 3.4: Percentage of families who experienced separation of less than one month per year
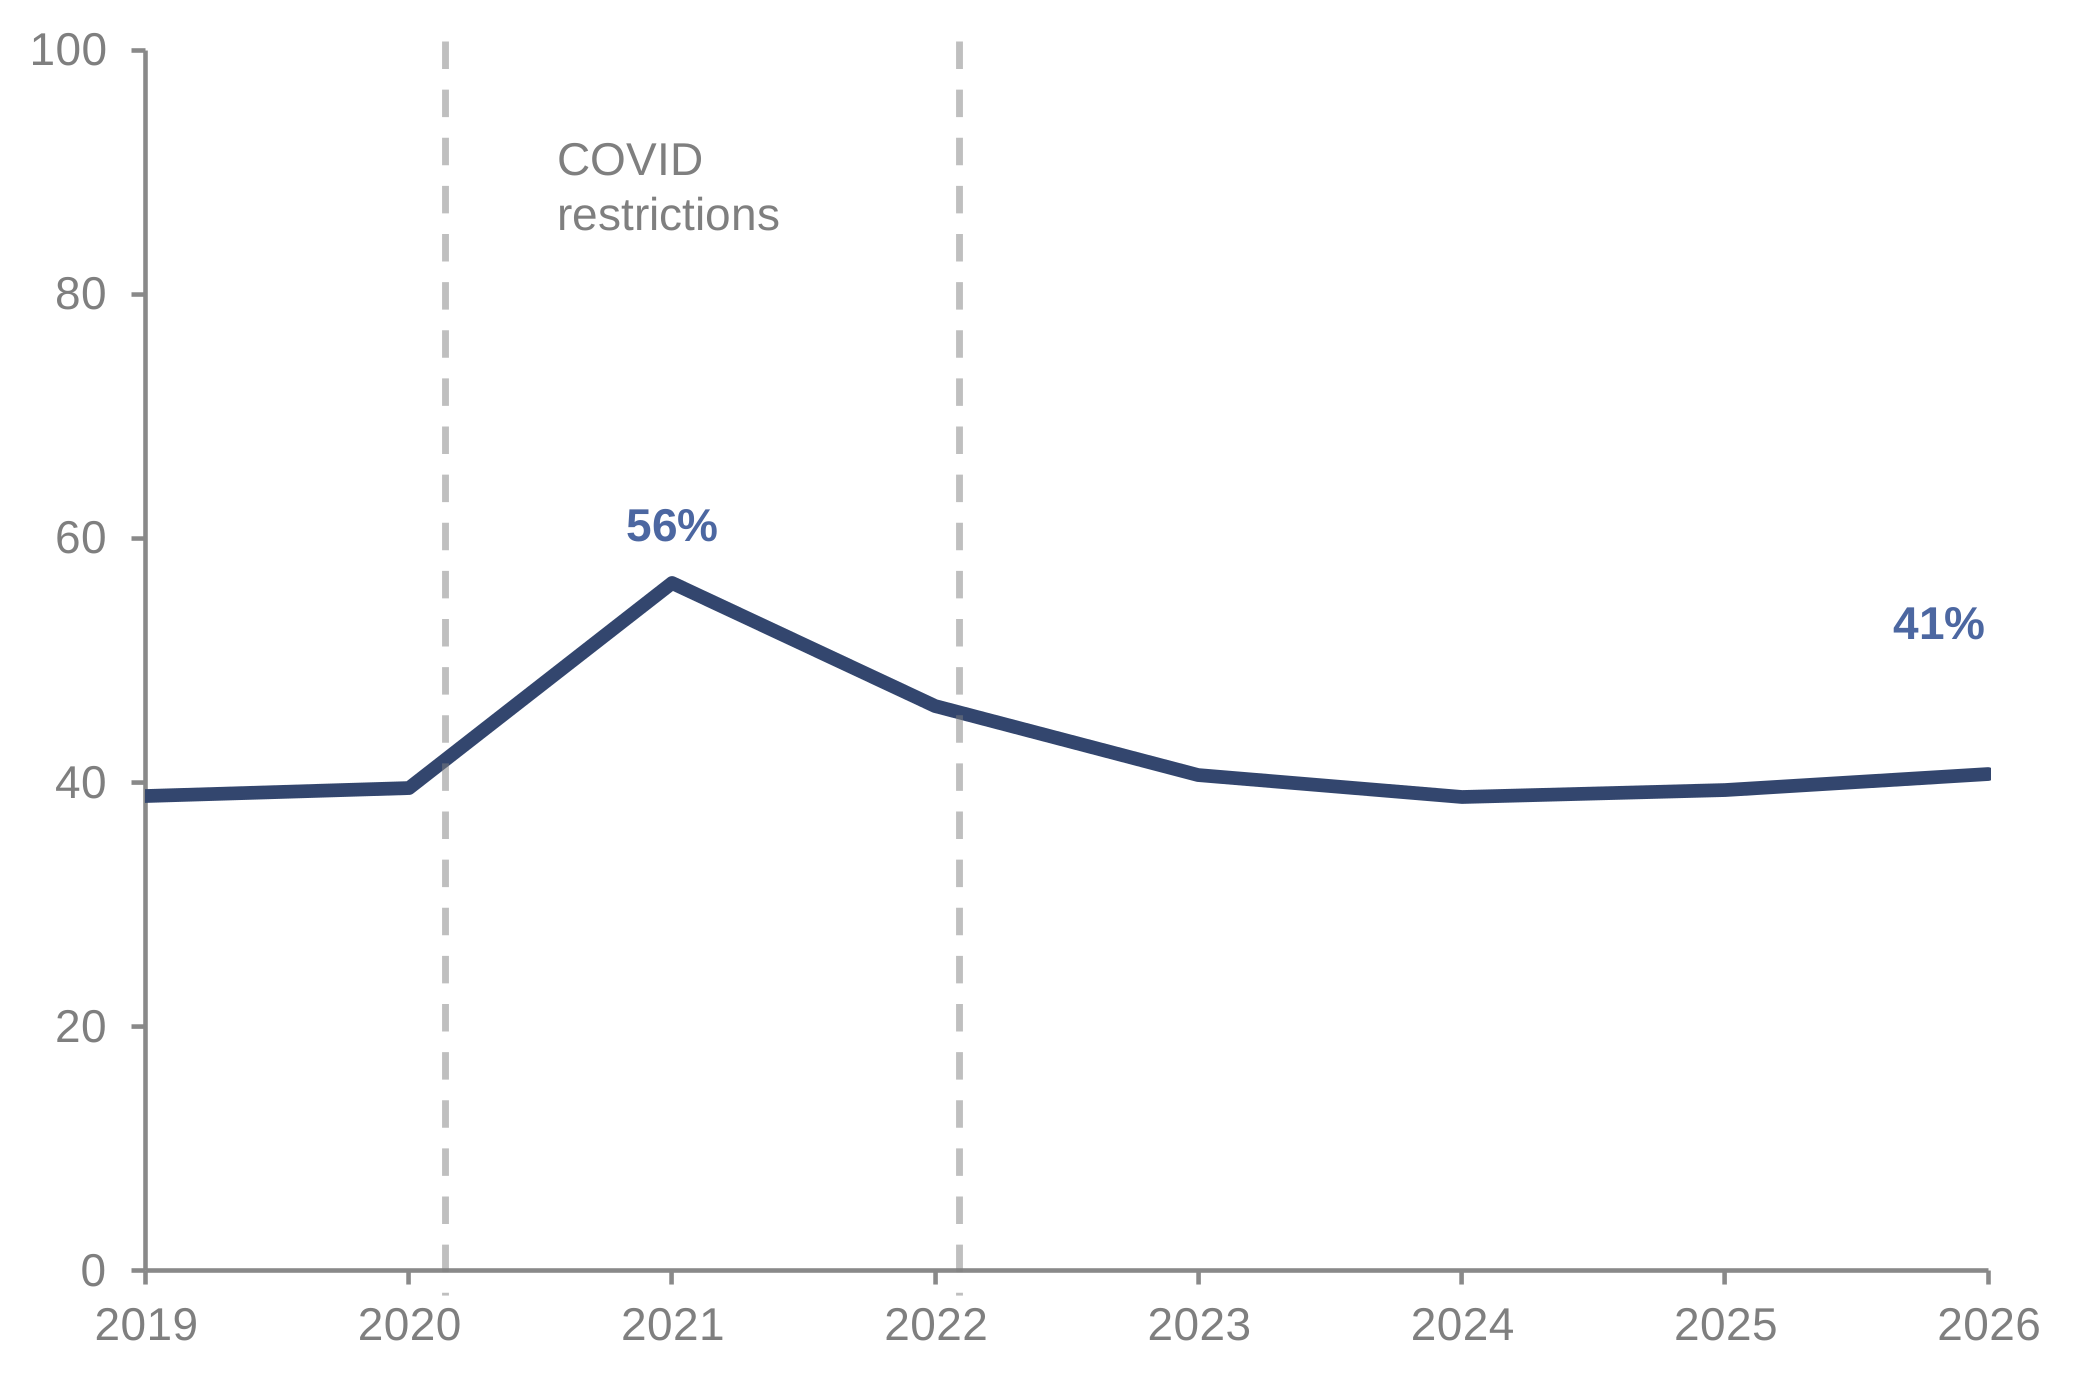
Figure 3.4 is a line graph that shows the proportion of families experiencing separation of less than one month per year from 2019 to 2026.
Historically, this proportion has been stable at around four in ten families (41% in 2026). However, following restrictions imposed during the COVID-19 lockdowns, the proportion of families experiencing separation of less than one month increased to 56%.
This was mirrored by a reduction in the proportion of families experiencing separation of three months or more. In 2021 this fell to 21%, it has since returned to previous levels of about three in ten (29% in 2026).
This reduction in separation may have contributed to some of the more positive views reported by Service families in 2021.
AFCAS 2026 comparison
AFCAS also reported a reduction in separation from families in 2021. The proportion of personnel who reported separation of more than three months per year from their families decreased from 43% in 2019 to 38% in 2021. In 2026 this is 45%, reflecting a return to pre-COVID levels of separation.
4. Attitudes towards Service family life
This section explores views on Service family life including:
- Satisfaction with Service family life
- Feeling valued
- Feelings about their partner staying or leaving the Service
- The Service community
- Positive/negative views about aspects of Service family life
- Knowledge and use of the Armed Forces Covenant
- Feeling advantaged or disadvantaged compared to the general public
- Well-being
Satisfaction with Service family life
Over half of spouses (55%) are satisfied with their quality of life as a Service family whilst 19% are dissatisfied.
Figure 4.1: Spouses satisfied with their quality of life as a Service family between 2022 and 2026
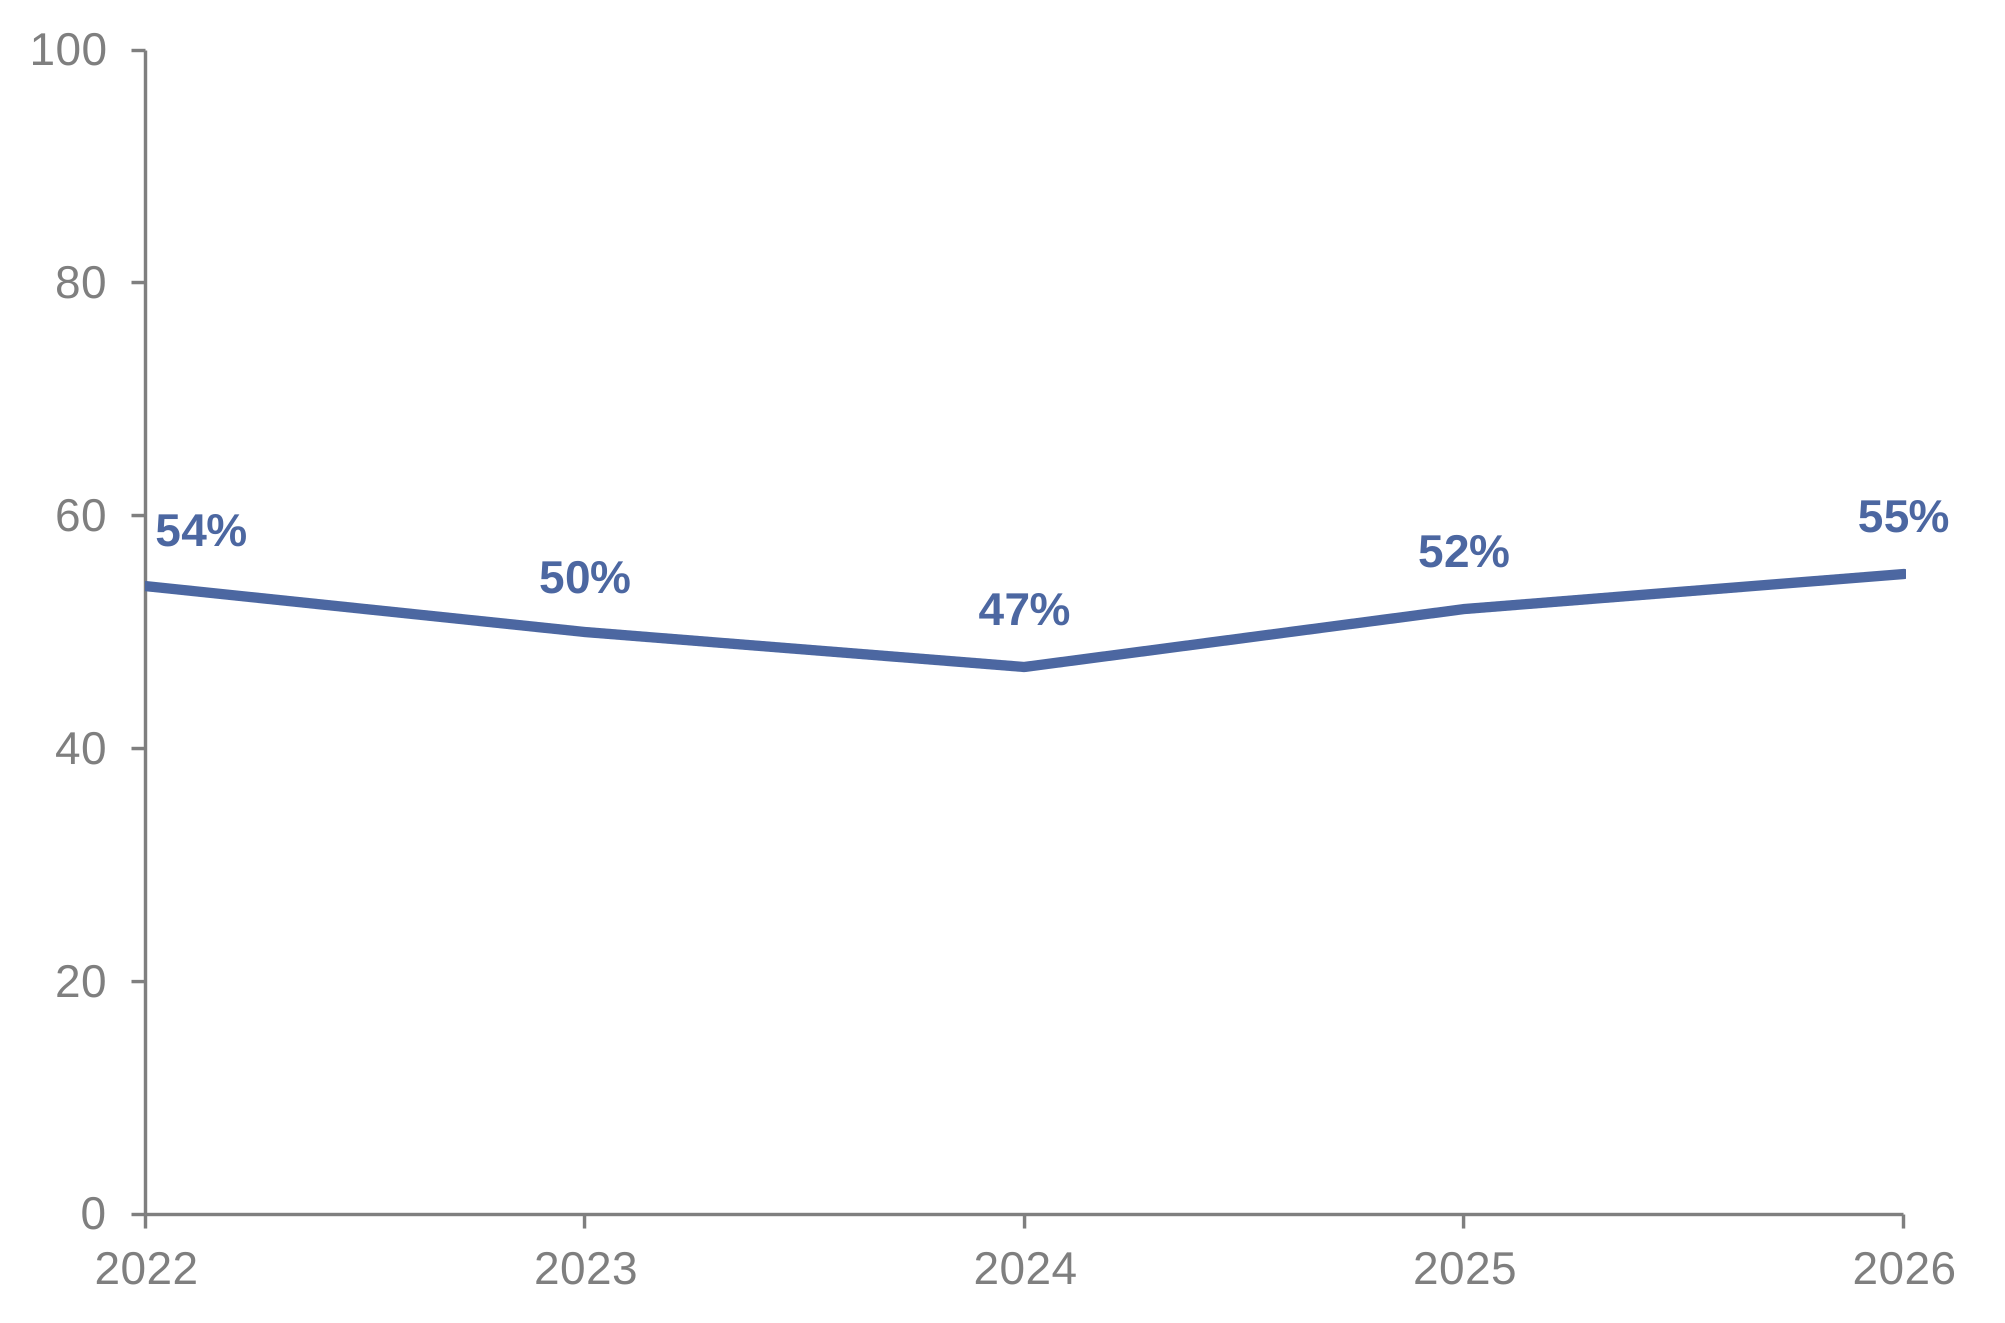
Figure 4.1 is a line graph that shows satisfaction decreased from 54% in 2022, when this question was first asked, to 47% in 2024. Satisfaction increased to 52% in 2025, similar to the 55% reported this year.
Just under one in five spouses (19%) are dissatisfied with their quality of life as a Service family. Although unchanged since last year, this is below levels reported in 2023 and 2024, and comparable to 2022.
RN/RM spouses are less satisfied with their quality of life as a Service family (46%) than Army and RAF spouses (56% and 59% respectively). A quarter of RN/RM spouses (25%) are dissatisfied compared to 17% of Army and 18% of RAF spouses.
Officer spouses are more satisfied with their quality of life as a Service family (59%) than Other Rank spouses (53%).
Spouses living overseas are more satisfied with their quality of life as a Service family (67%) than those living in England (54%).
Feeling valued
Figure 4.2: Spouses agree or disagree they feel valued by the Service
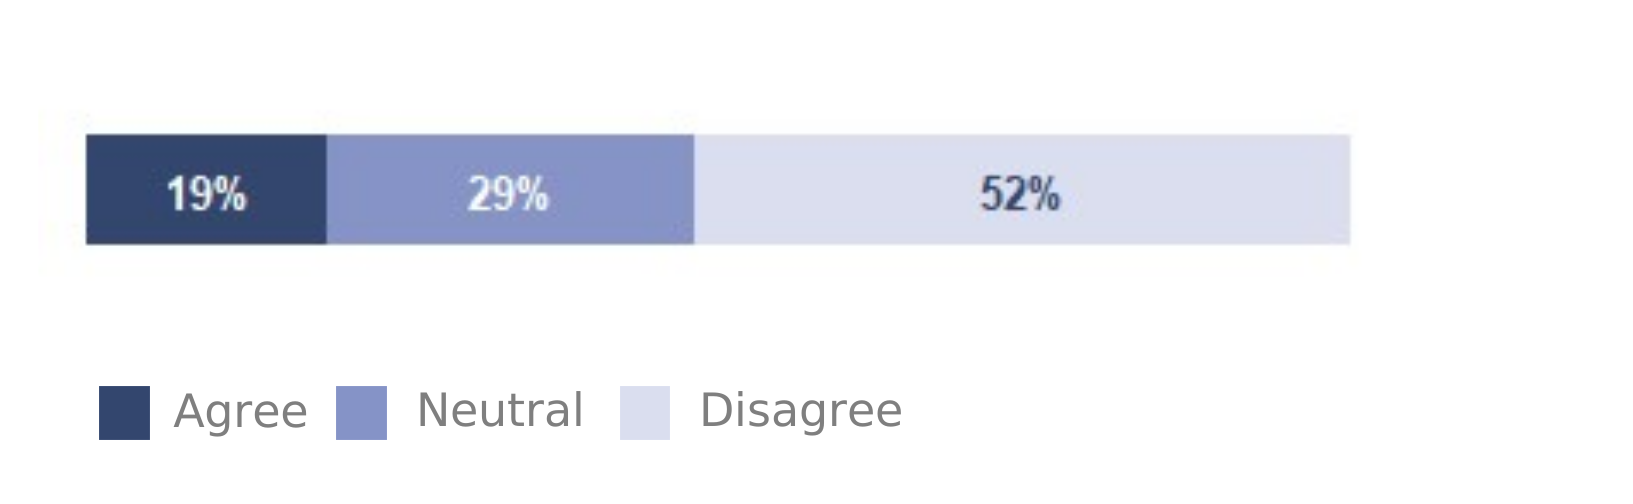
Figure 4.2 is a stacked bar chart that shows over half of spouses (52%) disagree they feel valued by the Service compared to 19% who agree.
The proportion of families feeling valued is unchanged since last year but is above levels reported between 2022 and 2024 and is similar to the peak reported in 2021 (18%).
Many results peaked in 2021, this may have been due, in part to the COVID pandemic lockdowns and restrictions which were in place whilst the 2021 survey was in field.
Army families are more likely to agree they feel valued by the Service (24%) than RN/RM or RAF families (12% and 13% respectively).
Other Rank families are more likely to agree (20%) than Officer families (15%).
Spouses living overseas are more likely to agree they feel valued (30%) than those living in England (18%).
My family benefits from being a Service family
Over a third of spouses (36%) agree their family benefits from being a Service family whilst 32% disagree.
Although unchanged this year, the proportion who agree is above levels reported in 2023 and 2024 (32% and 30% respectively). The proportion who agree is similar to the 2022 result, when this question was first asked.
Nearly four in ten RN/RM spouses disagree their family benefits from being a Service family (39%) compared to 29% of Army and 32% of RAF spouses.
Over half of spouses living overseas agree their family benefits from being a Service family (55%), considerably more than the 36% for spouses living in England.
Feelings about staying or leaving the Service
Figure 4.3: How spouses would feel if their partner left the Service
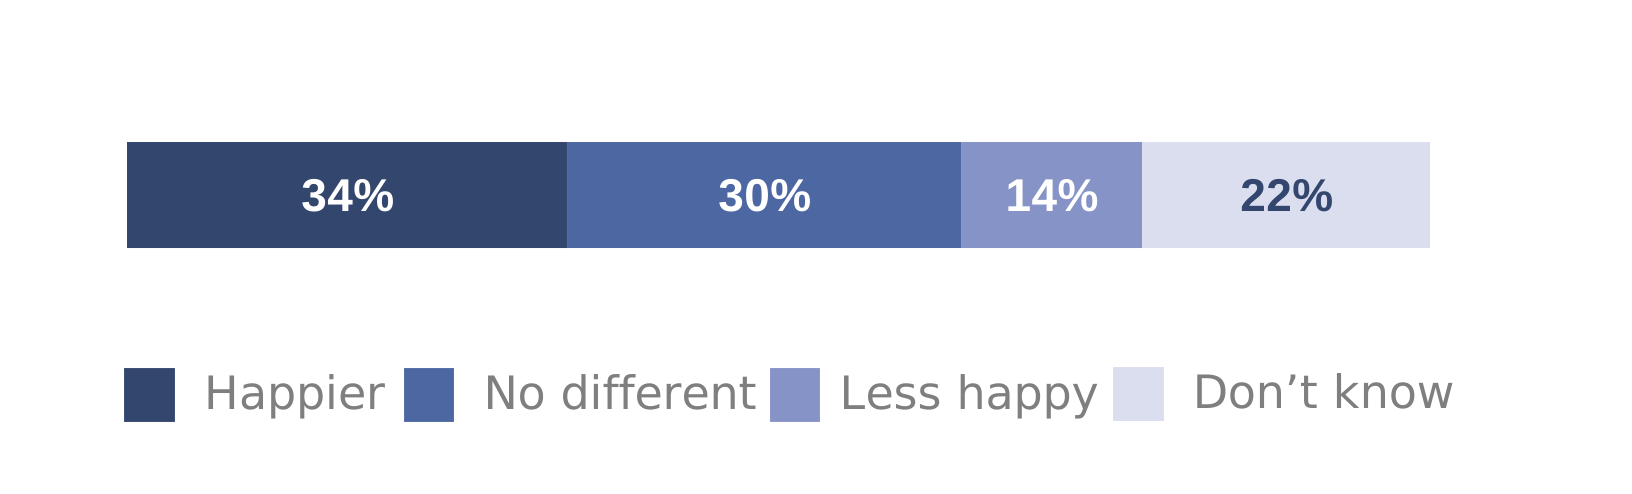
Figure 4.3 is a stacked bar chart that shows just over a third of spouses (34%) would feel happier if their partner left the Service, this compares to 14% who would feel less happy. Three in ten spouses (30%) would feel no different whilst 22% do not know how they would feel.
Although unchanged this year, the proportion of spouses who would feel happier if their partner left is comparable to, or lower than, most previously reported values except for the 29% reported in 2021.
Army spouses are the most positive, with 30% saying they would feel happier if their partner left the Service, followed by RAF families (35%) whilst RN/RM families are the least positive with 41% saying they would be happier if their partner left the Service.
Spouses living overseas are more positive than those living in England. Less than a quarter of spouses living overseas would feel happier if their partner left the Service (23%) compared to 34% of spouses living in England.
Questions asking how often spouses encouraged their partner to stay or leave the Service were introduced in 2025.
Figure 4.4: How often spouses have encouraged their Serving partner to stay or leave the Service in the past year
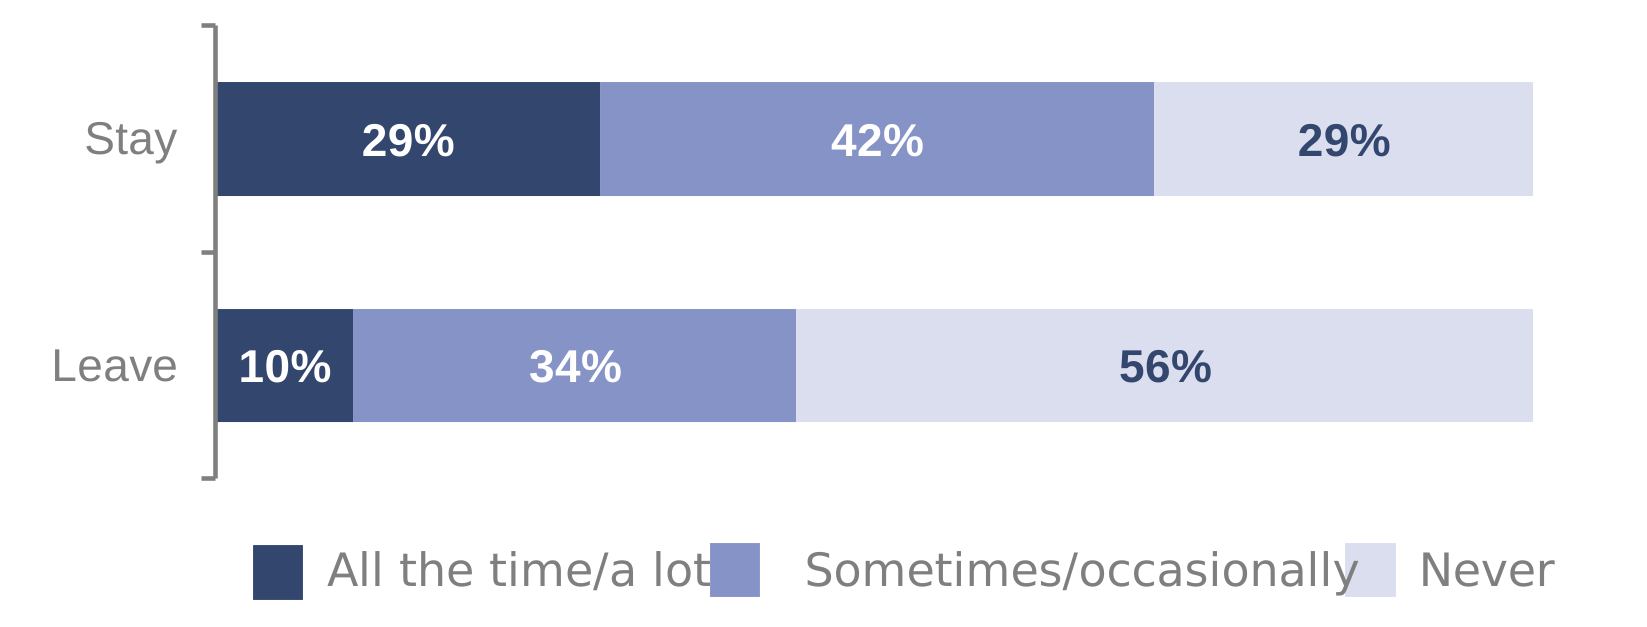
Figure 4.4 contains two stacked bar charts that show spouses are more likely to encourage their partner to stay than leave.
Over half of spouses (56%) have not encouraged their partner to leave over the past year, whilst 29% have not encouraged them to stay. This means, 71% of spouses have, at some point over the past year, encouraged their partner to stay in the Service, whilst 44% have, at some point, encouraged them to leave.
Nearly three in ten spouses (29%) encouraged their partner to stay in the Service “all the time/a lot” over the past year. This compares to 10% of spouses who encouraged their partner to leave “all the time/a lot”. These results are similar to those reported last year.
Officer spouses are more likely than Other Rank spouses to have encouraged their partner to leave the Service, at least once, over the past year (49% vs. 42%).
Nearly half of RN/RM spouses (49%) have encouraged their partner to leave the Service, at least once, over the past year. This compares to 43% of Army and 42% of RAF spouses.
The Service community
Figure 4.5: Spouses agree or disagree they feel part of the wider Service community
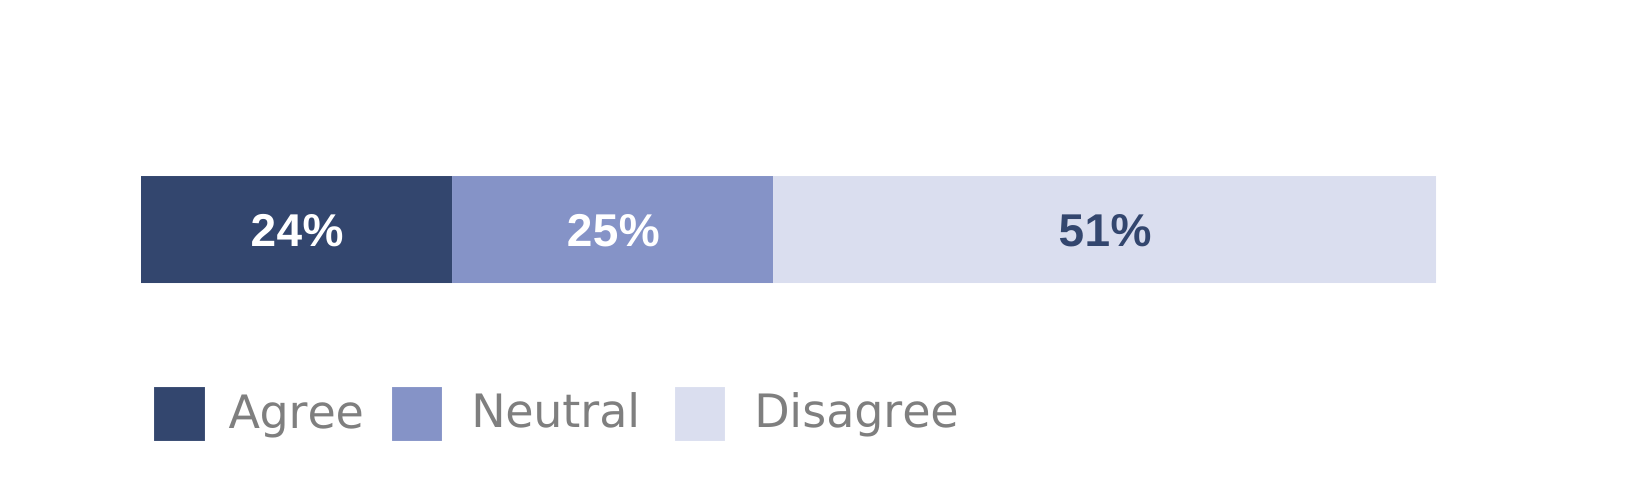
Figure 4.5 is a stacked bar chart that shows about a quarter of spouses feel part of the wider Service community (24%) compared to half (51%) who do not. These results are similar to those reported last year.
Army spouses are more likely to agree they feel part of the wider Service community (30%) than RN/RM or RAF spouses (both 18%).
Army spouses also feel more positive about knowing other military families (45%) compared to RN/RM (37%) and RAF spouses (39%).
Officer spouses are more likely to agree they feel part of the wider Service community (28%) than Other Rank spouses (22%).
Over half of Officer spouses (52%) feel positive about knowing other military families compared to 37% of Other Rank families.
Spouses living overseas are more likely to agree they feel part of the wider Service community (41%) compared to those living in England (23%).
Spouses living overseas also feel more positive about knowing other military families (58%) and community support for their family (36%) compared to those living in England (41% and 21% respectively).
Aspects of Service family life
Figure 4.6: Spouses feeling positive or negative about aspects of Service family life
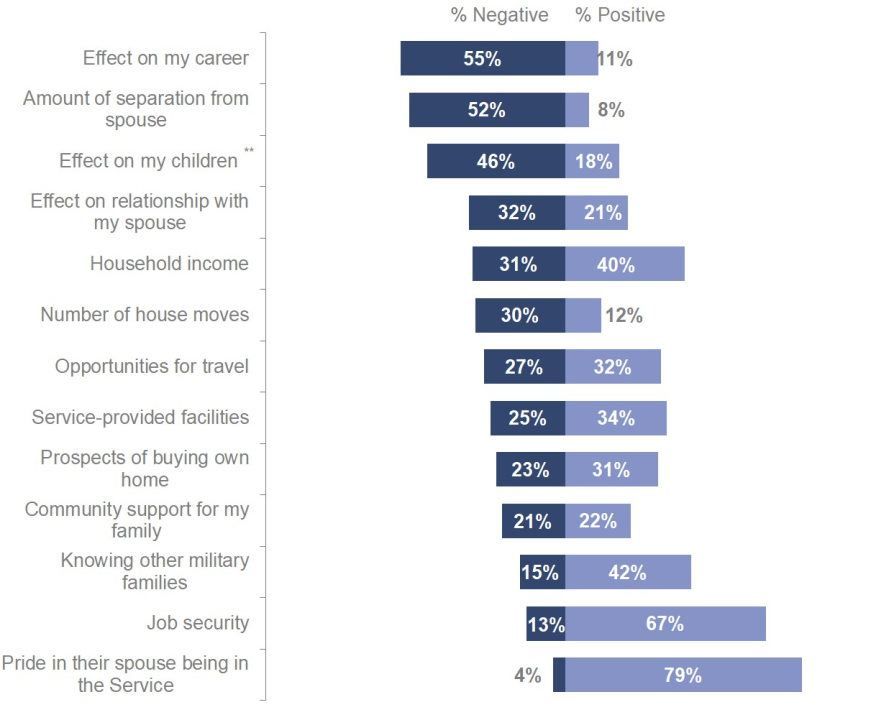
** The result for “effect on my children” is based on those families with children.
Figure 4.6 is a bar chart that shows how negative or positive spouses feel about aspects of Service life. For example, 27% of spouses feel negative about opportunities for travel whilst 32% feel positive about this.
Spouses are most negative about:
- The effect on their career (55%)
- The amount of separation from their spouse (52%)
- The effect on their children (46%)
Spouses are most positive about:
- Pride in their partner being in the Service (79%)
- Job security (67%).
The proportion of spouses feeling positive or negative about each aspect of Service life are unchanged this year.
However, some aspects have improved since 2023 and 2024. For example, the proportion of spouses feeling positive about household income decreased from 41% in 2022 to 35% in 2023. This remained at 35% in 2024 but recovered to 39% in 2025 and remains at a similar level this year (40%).
The proportion of spouses feeling negative about the effect on their relationship with their Serving partner decreased from 36% in 2024 to 32% in 2025 and remains at 32% this year. Although still above the lowest value of 27% reported in 2021, the proportion feeling negative is comparable to, or lower than, all other previous results.
Spouses living overseas feel more positive about several aspects of Service life than those living in England. Compared to those living in England, spouses living overseas are:
- More positive about the effect on their relationship with their Serving spouse (overseas: 39%, England: 20%)
- More positive about the effect on their children (overseas: 32%, England: 17%)
- More positive about Service provided facilities (overseas: 51%, England: 33%)
- More positive about opportunities to travel (overseas: 72%, England: 29%)
- Less negative about separation (overseas: 36%, England: 52%)
As already discussed, spouses living overseas are also more positive about knowing other military families and community support for their family than spouses living in England.
There are several Service differences within these results which are discussed further below. These may reflect the diverse approaches to Service family life.
For example, some spouses will live with their Serving partner in Service Family Accommodation (SFA) and will often accompany them when they are posted. This can lead to frequent house moves and the upheaval this causes. Other spouses will live in their own home off base; this provides more stability for their family but typically leads to more separation.
There are also specific Service differences to consider. For example, Royal Navy families cannot accompany Service personnel at sea. This may explain, in part, why RN/RM spouses are more likely to live separately from their partner and more likely to experience separation of 6 months or more. RN/RM families are also more likely to own a home and less likely to live in SFA.
Please refer to the About You section of the report for further detail.
RN/RM spouses feel more negative about the amount of separation from their Serving partner (61%) than Army (48%) or RAF spouses (51%). This may contribute to RN/RM spouses feeling more negative about the effect of Service life on their family.
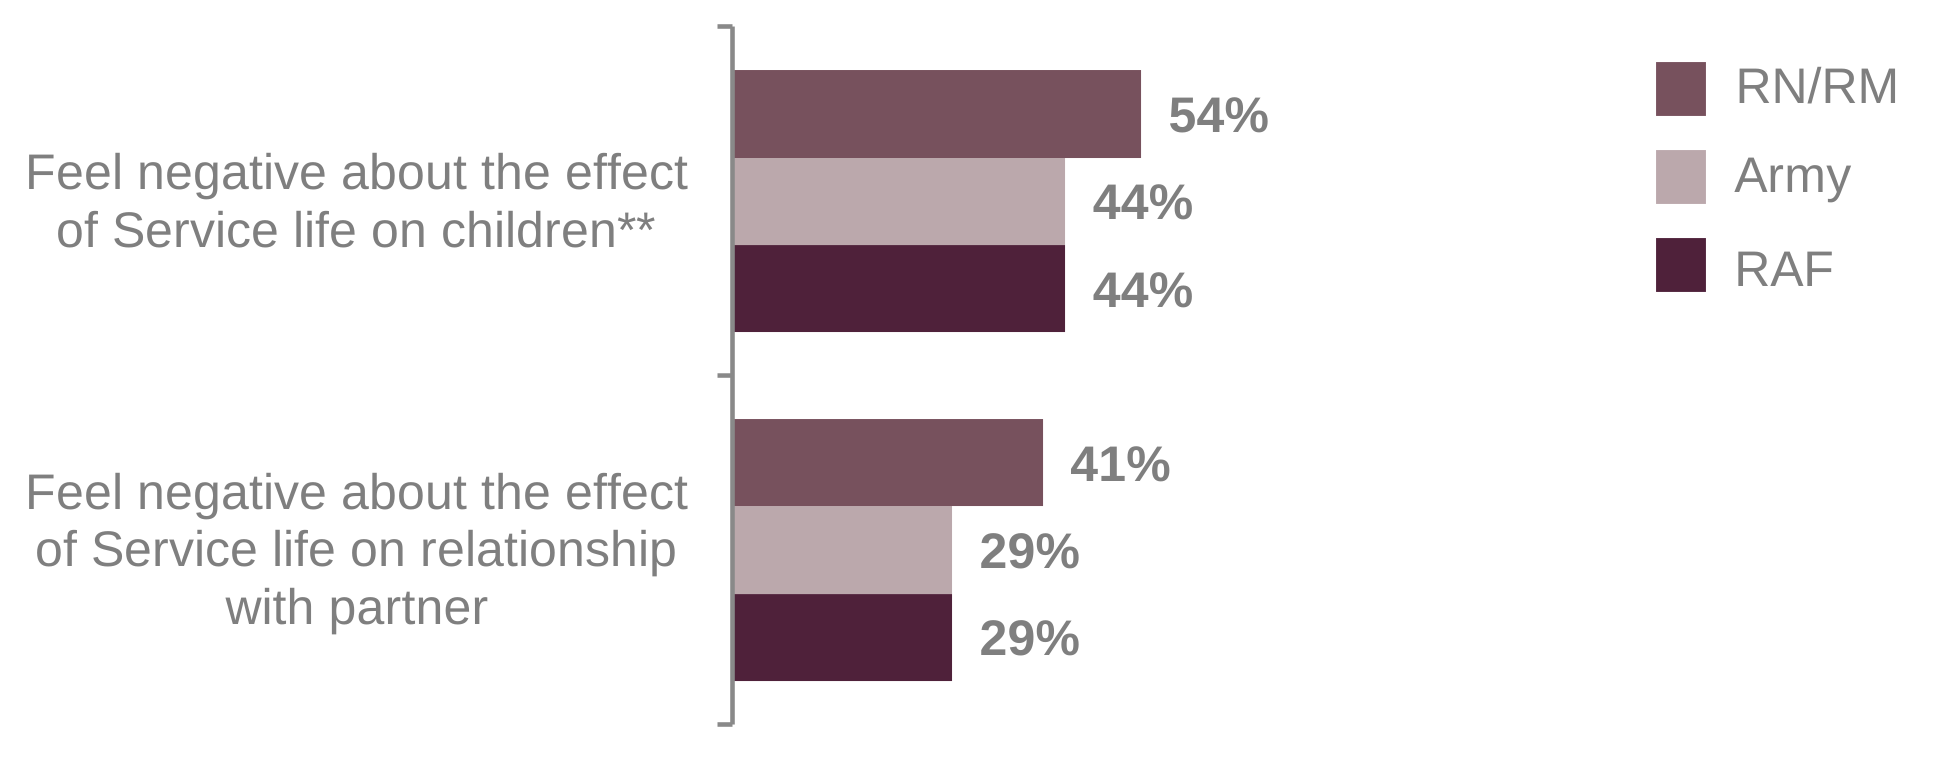
Figure 4.7: Spouses feeling negative about the effect of Service life on their children and their relationship with their partner
** The result for “effect on my children” is based on those families with children.
Figure 4.7 is a bar chart that shows over half of RN/RM spouses (54%) feel negative about the effect of Service life on their children. This compares to 44% for both Army and RAF spouses.
The bar chart also shows over four in ten RN/RM spouses (41%) feel negative about the effect of Service life on their relationship with their Serving partner. This compares to about three in ten (29%) for both Army and RAF spouses.
Army families are the most likely to have moved at least once for Service reasons over the past five years (69%) followed by RAF families (63%) whilst RN/RM families are the least likely (41%). This may explain, in part, why Army spouses feel the most negative about number of house moves (35%) followed by RAF (28%) whilst RN/RM spouses are the least negative (18%).
This may contribute to less stability amongst Army families who are less likely to be employed which may explain, in part, why Army spouses feel more negative about household income (36%) compared to RN/RM (25%) and RAF spouses (28%).
Army families are more likely to live in Service Family Accommodation (SFA) followed by RAF families whilst RN/RM are the least likely. This may contribute to Army spouses feeling more positive about Service provided facilities (40%), followed by RAF (29%) whilst RN/RM spouses are the least positive (24%).
Moving with their partner and living in SFA may also contribute to Army spouses feeling more positive about being part of the Service community, as discussed earlier in this section.
Awareness of the Armed Forces Covenant
Announced by the government in May 2011, the Armed Forces Covenant is a promise by the nation ensuring that those who serve or who have served in the Armed Forces and their families, are treated fairly.
Figure 4.8: Spouses’ awareness of the Armed Forces Covenant
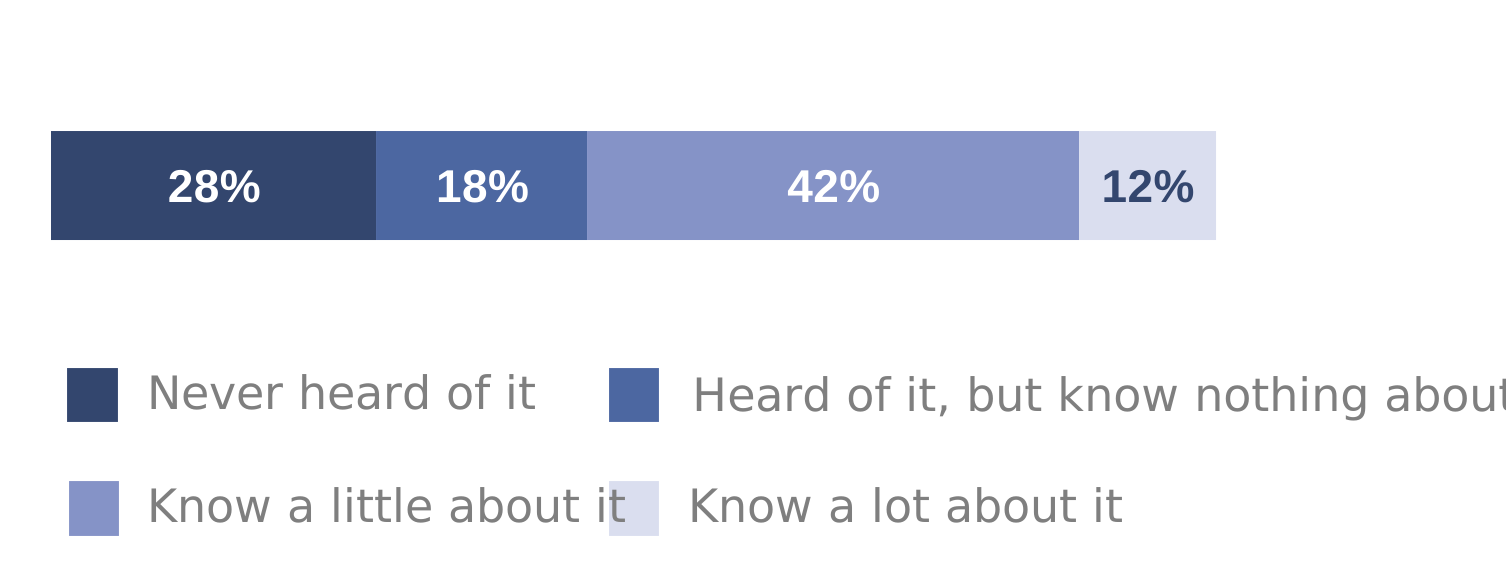
Figure 4.8 is a stacked bar chart that shows nearly three in ten spouses (28%) have never heard of the AF Covenant whilst a further 18% have heard of it but know nothing about it. As such, over half of spouses (54%) know at least a little about the AF Covenant.
Between 2015 and 2018 the proportion of spouses who knew at least a little about the AF Covenant increased from 40% to 49%. Since then, levels of awareness of the AF Covenant have remained relatively stable.
Officer spouses continue to have a greater awareness of the AF Covenant compared to Other Rank spouses. The majority of Officer spouses (87%) have at least heard of the AF Covenant compared to 65% of Other Rank spouses.
A lower proportion of Army spouses have at least heard of the AF Covenant (66%) compared to 79% of RN/RM and 80% of RAF spouses.
For the first time this year, respondents were asked whether they had referenced the Armed Forces Covenant in their daily life to assist them in any way.
Just over one in six spouses (17%) had referenced the AF Covenant to assist them in their life.
The results below are based on those respondents who had referenced the Armed Forces Covenant in some way.
Those who had referenced the AF Covenant were then presented with a tick all that apply question about the circumstances.
- 38% referenced the AF Covenant when applying for schools/local authority requests
- 37% referenced the AF Covenant when moving home/changing utilities/changing memberships/contracts
- 32% referenced the AF Covenant with their employer
- 28% referenced the AF Covenant when accessing healthcare
- 15% referenced the AF Covenant for other reasons
Families feeling advantaged, or disadvantaged compared to the general public
One of the principles of the Armed Forces Covenant is:
Those who serve in the Armed Forces, whether Regular or Reserve, those who have served in the past, and their families, should face no disadvantage compared to other citizens in the provision of public and commercial services.
In this section we look at whether families feel advantaged or disadvantaged in comparison to the public.
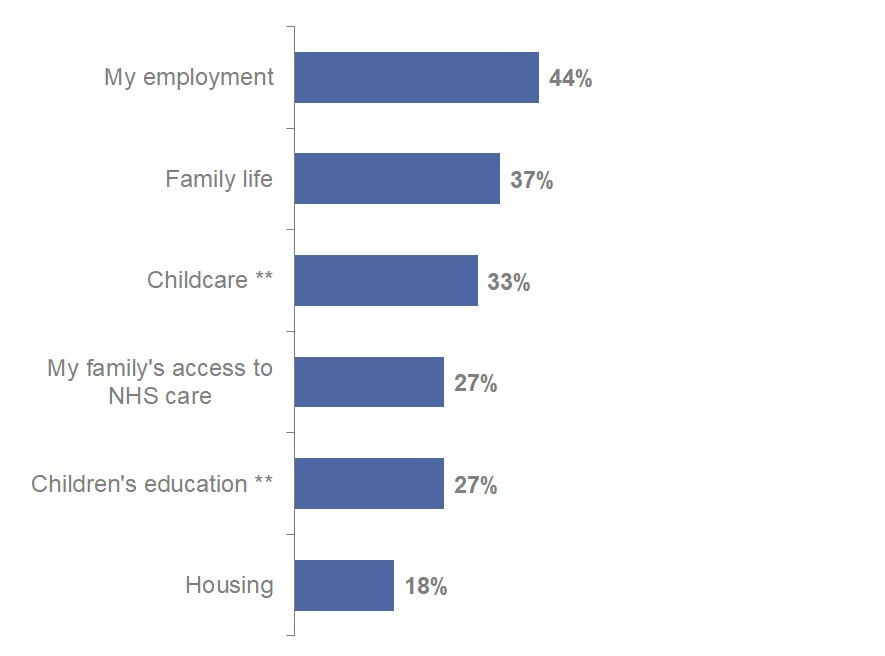
Figure 4.9: Spouses feeling disadvantaged compared to the general public
** The results for “childcare” and “children’s education” are based on those families with children.
Figure 4.9 is a bar chart that shows spouses feel most disadvantaged about their employment (44%).
This is followed by about three in eight spouses (37%) feeling disadvantaged about family life. Although unchanged this year, this has improved from 50% in 2017 and is lower than almost all levels reported prior to 2025.
AFCAS 2026 comparison
A higher proportion of married Service personnel feel disadvantaged about family life (50%) compared to Service spouses (37%).
Spouses feel the least disadvantaged about housing (18%). This is unchanged from last year but has improved on the 23% reported in 2024 and is similar to most results reported prior to 2023.
A third of spouses (33%) feel disadvantaged about childcare. The proportion feeling advantaged about childcare remains at 14% this year but is above all levels reported prior to 2025.
This improvement may reflect the introduction of the MODs Wraparound Childcare (WAC) scheme in September 2022.
RN/RM spouses feel the most disadvantaged about family life (45%), followed by Army (38%) whilst RAF spouses are the least likely to feel disadvantaged (31%).
Officer spouses feel less advantaged and more disadvantaged about family life than Other Rank families. One in ten Officer spouses (10%) feel advantaged about family life whilst 43% feel disadvantaged. These compare to 16% of Other Rank spouses feeling advantaged and 35% feeling disadvantaged.
Spouses living overseas feel more advantaged (24%) and less disadvantaged (24%) about family life than those living in England; 13% advantaged and 38% disadvantaged.
Voting registration
Overall, eight in ten Service spouses (80%) are registered to vote.
This is unchanged since 2024 but is lower than all levels reported between 2017 and 2023.
Army spouses are less likely to be registered to vote (73%) than RN/RM (91%) or RAF spouses (87%).
Officer spouses are more likely to be registered to vote (89%) than Other Rank spouses (76%).
Just 35% of spouses living overseas are registered to vote, considerably less than the 84% of spouses living in England.
Well-being measures
The Office for National Statistics (ONS) collects data on well-being for the general population in the Opinions and Lifestyle Survey.
Figure 4.10: Measures of well-being for Service spouses
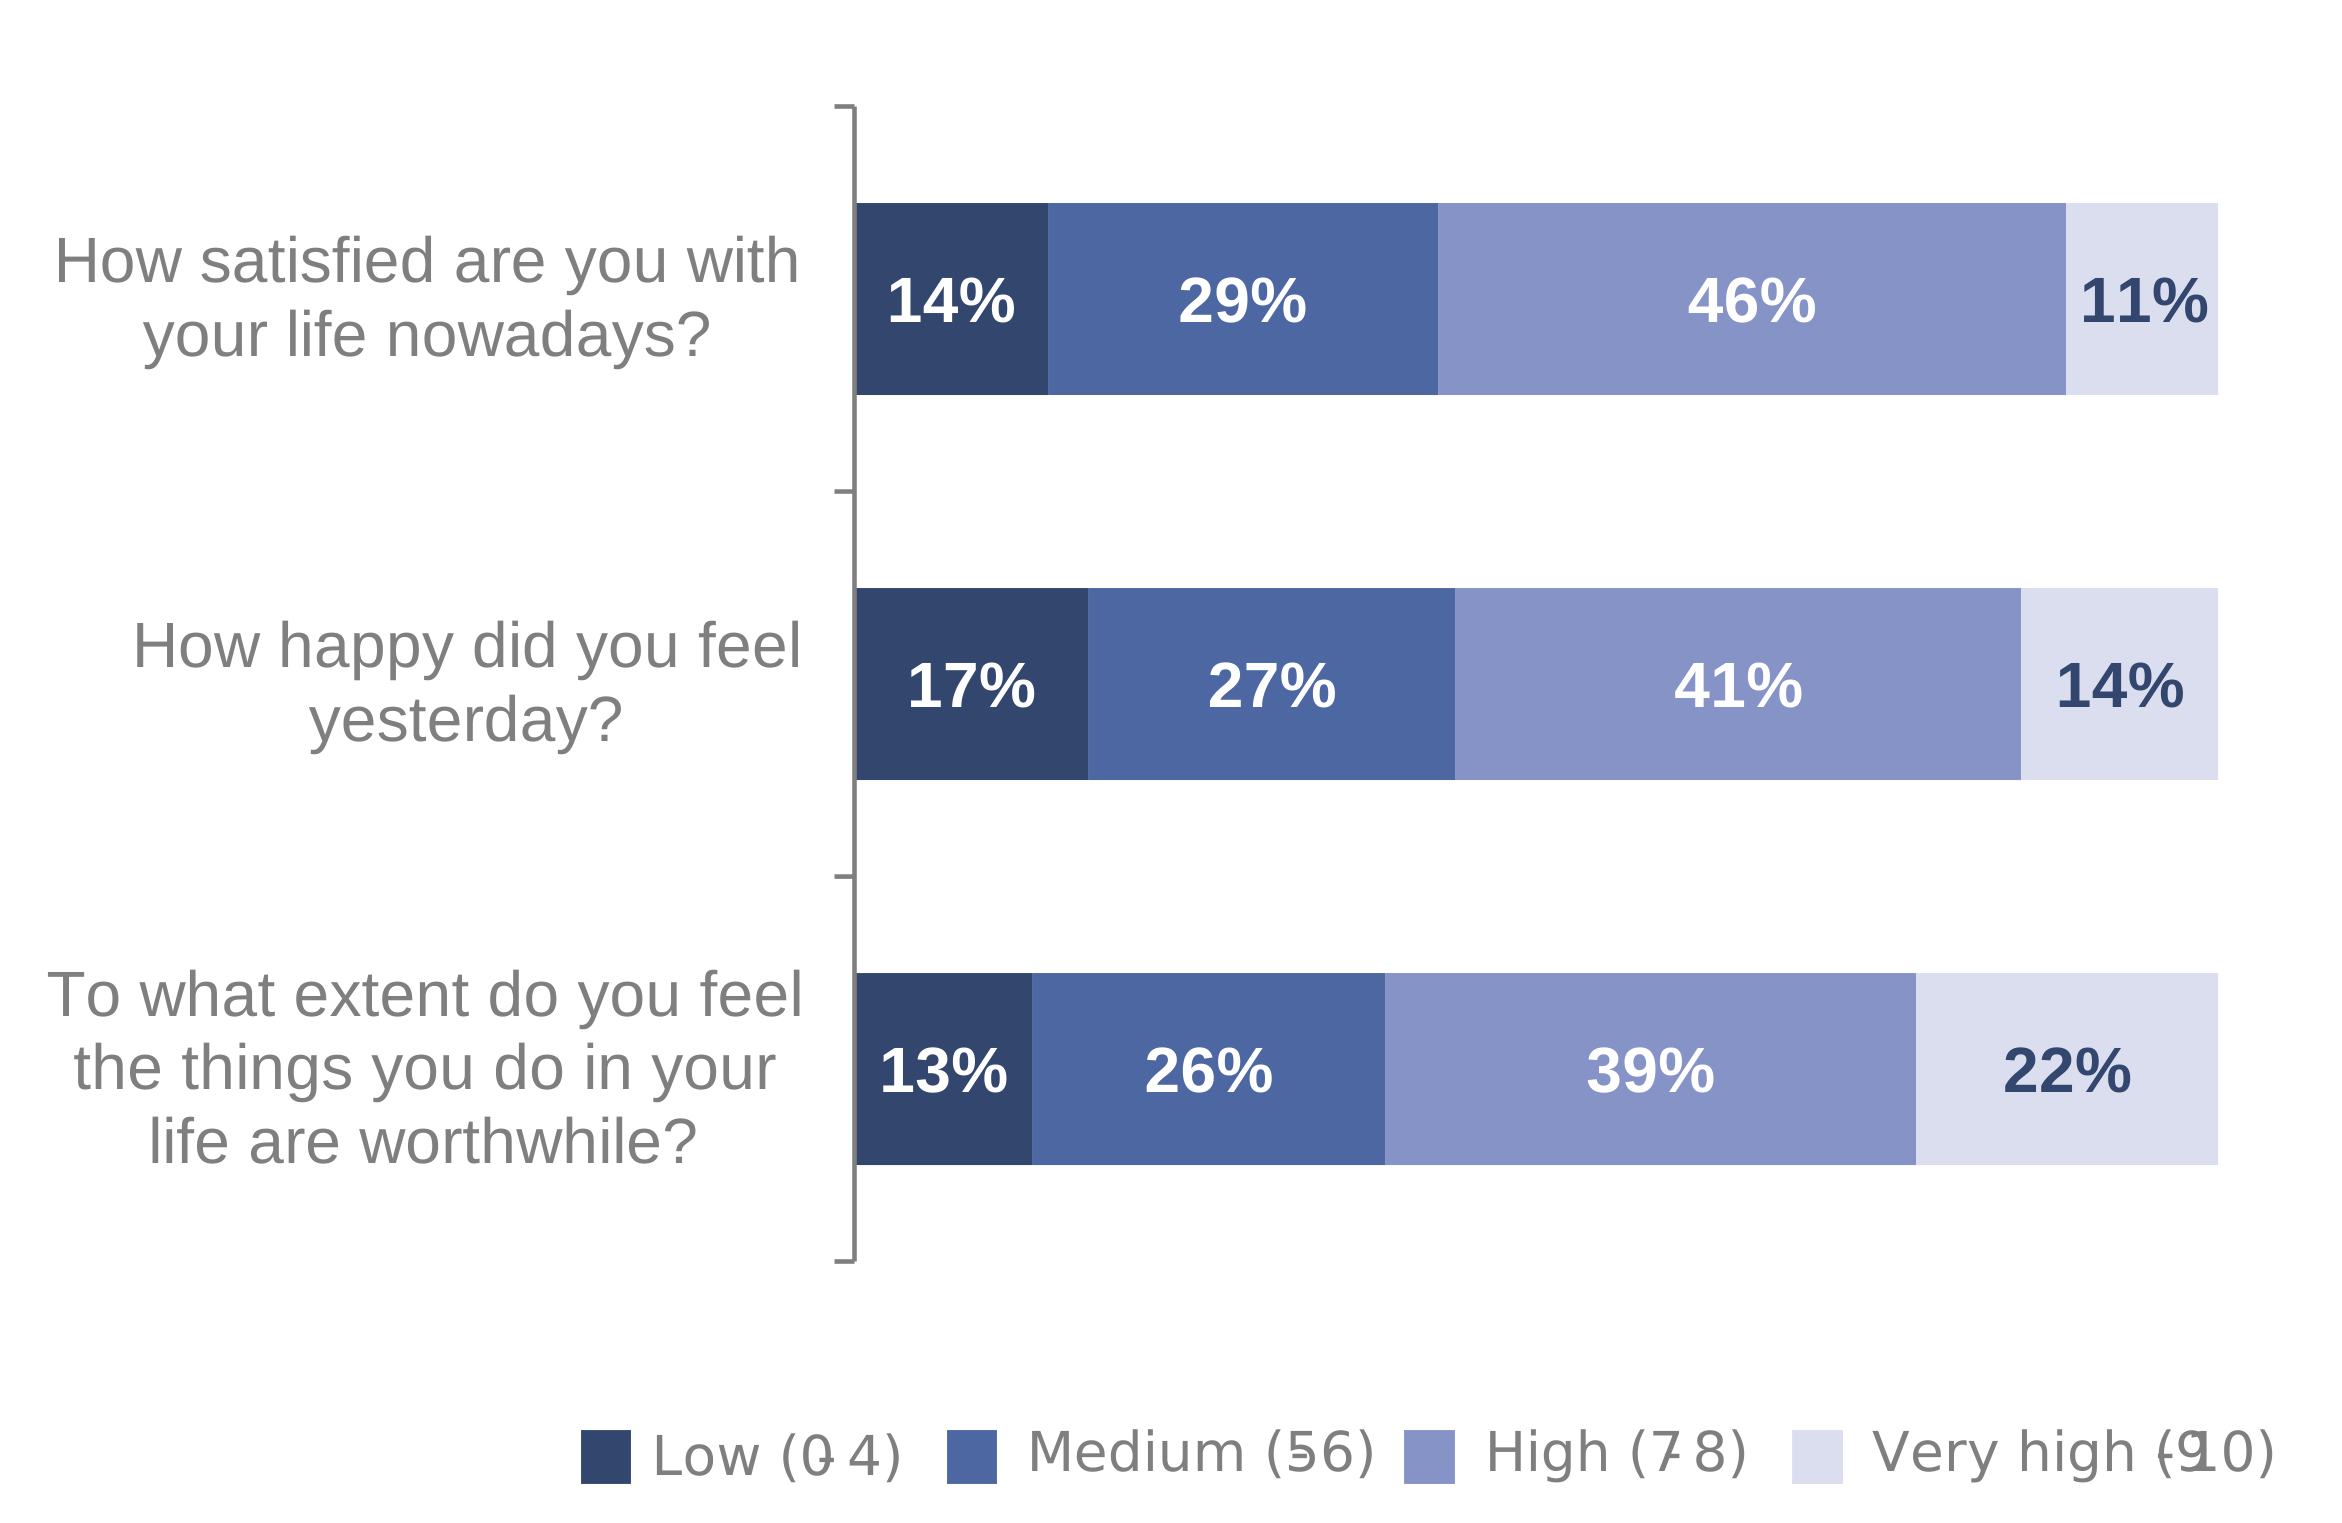
Figure 4.10 contains three stacked bar charts that show how spouses rank their well-being on three of the four well-being measures.
Nearly six in ten spouses (57%) rate their satisfaction with their life nowadays as at least high, compared to 14% who rate this as low.
Similar results are reported for how happy spouses felt yesterday (56% at least high and 17% low) and the extent they feel things they do in their life are worthwhile (61% at least high and 13% low).
Over a third of spouses (35%) rate their anxiety as high (6-10) whilst 22% rate this as very low (0-1).
National results for context
The results from the May 2026 ONS Opinions and Lifestyle Survey may provide some context. Please note, these results are not directly comparable to those of Service spouses due to differences in demographics. For example, national figures include a larger proportion of over 60s, who generally score their well-being higher than younger people.
The proportion of females in Great Britain scoring aspects of their well-being as ‘low’ (a score of 0-4) ranges between 7% and 13%. These are lower than corresponding results for female Service spouses (13-17%).
Spouses who are homeowners, or are married to an Officer, are more positive across the four well-being measures. Those who are employed or who live in their own home are more positive across three of the four well-being measures.
However, there are overlaps between these groups, for example Officer spouses are more likely to be homeowners and so the differences observed may be due to other reasons.
AFCAS 2026 comparison
Just under a quarter of married Service personnel (24%) rate their anxiety as high (a score of 6-10) compared to 35% of Service spouses. There is little difference between the other well-being measures.
Loneliness
Nearly two in ten spouses (19%) never or hardly ever feel lonely, whilst 17% of spouses feel lonely often/always. The remaining 64% feel lonely occasionally/some of the time.
The proportion feeling lonely often/always is lower than the 21% reported in 2024 but is in line with all other reported results since 2019 when this question was first asked.
Other Rank spouses are more likely to feel lonely often/always (19%) than Officer spouses (13%).
RN/RM spouses are more likely to feel lonely often/always (22%) than Army (17%) or RAF spouses (15%).
National results for context
The results from the May 2026 ONS Opinions and Lifestyle Survey provide some context to these results. For females in Great Britain, 7% feel lonely often or always. Although not directly comparable, this is considerably different from the FamCAS figure for female Service spouses living in England (18%).
5. Childcare and children’s education
This section focuses on families with children, it covers topics about childcare and children’s schooling including:
- Early years childcare
- Childcare for school-aged children
- Use of MOD’s Wraparound Childcare scheme (WAC)
- Use of formal and informal childcare
- Use of government childcare initiatives
- Families by school type
- Changing schools
- Difficulties with children’s education
Service families by age of children
Overall, more than three-quarters of Service families have children (78%). This has been consistent since the question was first harmonised in 2012.
The proportions of Service families by children’s age:
- 20% have at least one child under two years old
- 15% have at least one child aged 3-4 years
- 31% have at least one child under five years old
- 38% have at least one child aged 5-11 years
- 28% have at least one child aged 12-17 years
- 16% have at least one child aged over 18 years
Early years childcare
Of those families with at least one child under five, seven in ten (70%) required early years (0-4 years) childcare. The majority of these families (89%) have been able to access early years childcare.
National results for context
Although not directly comparable to Service families, the Childcare and Early Years Survey of Parents in England reports, of those families who only have children aged 0-4, 72% use formal childcare.
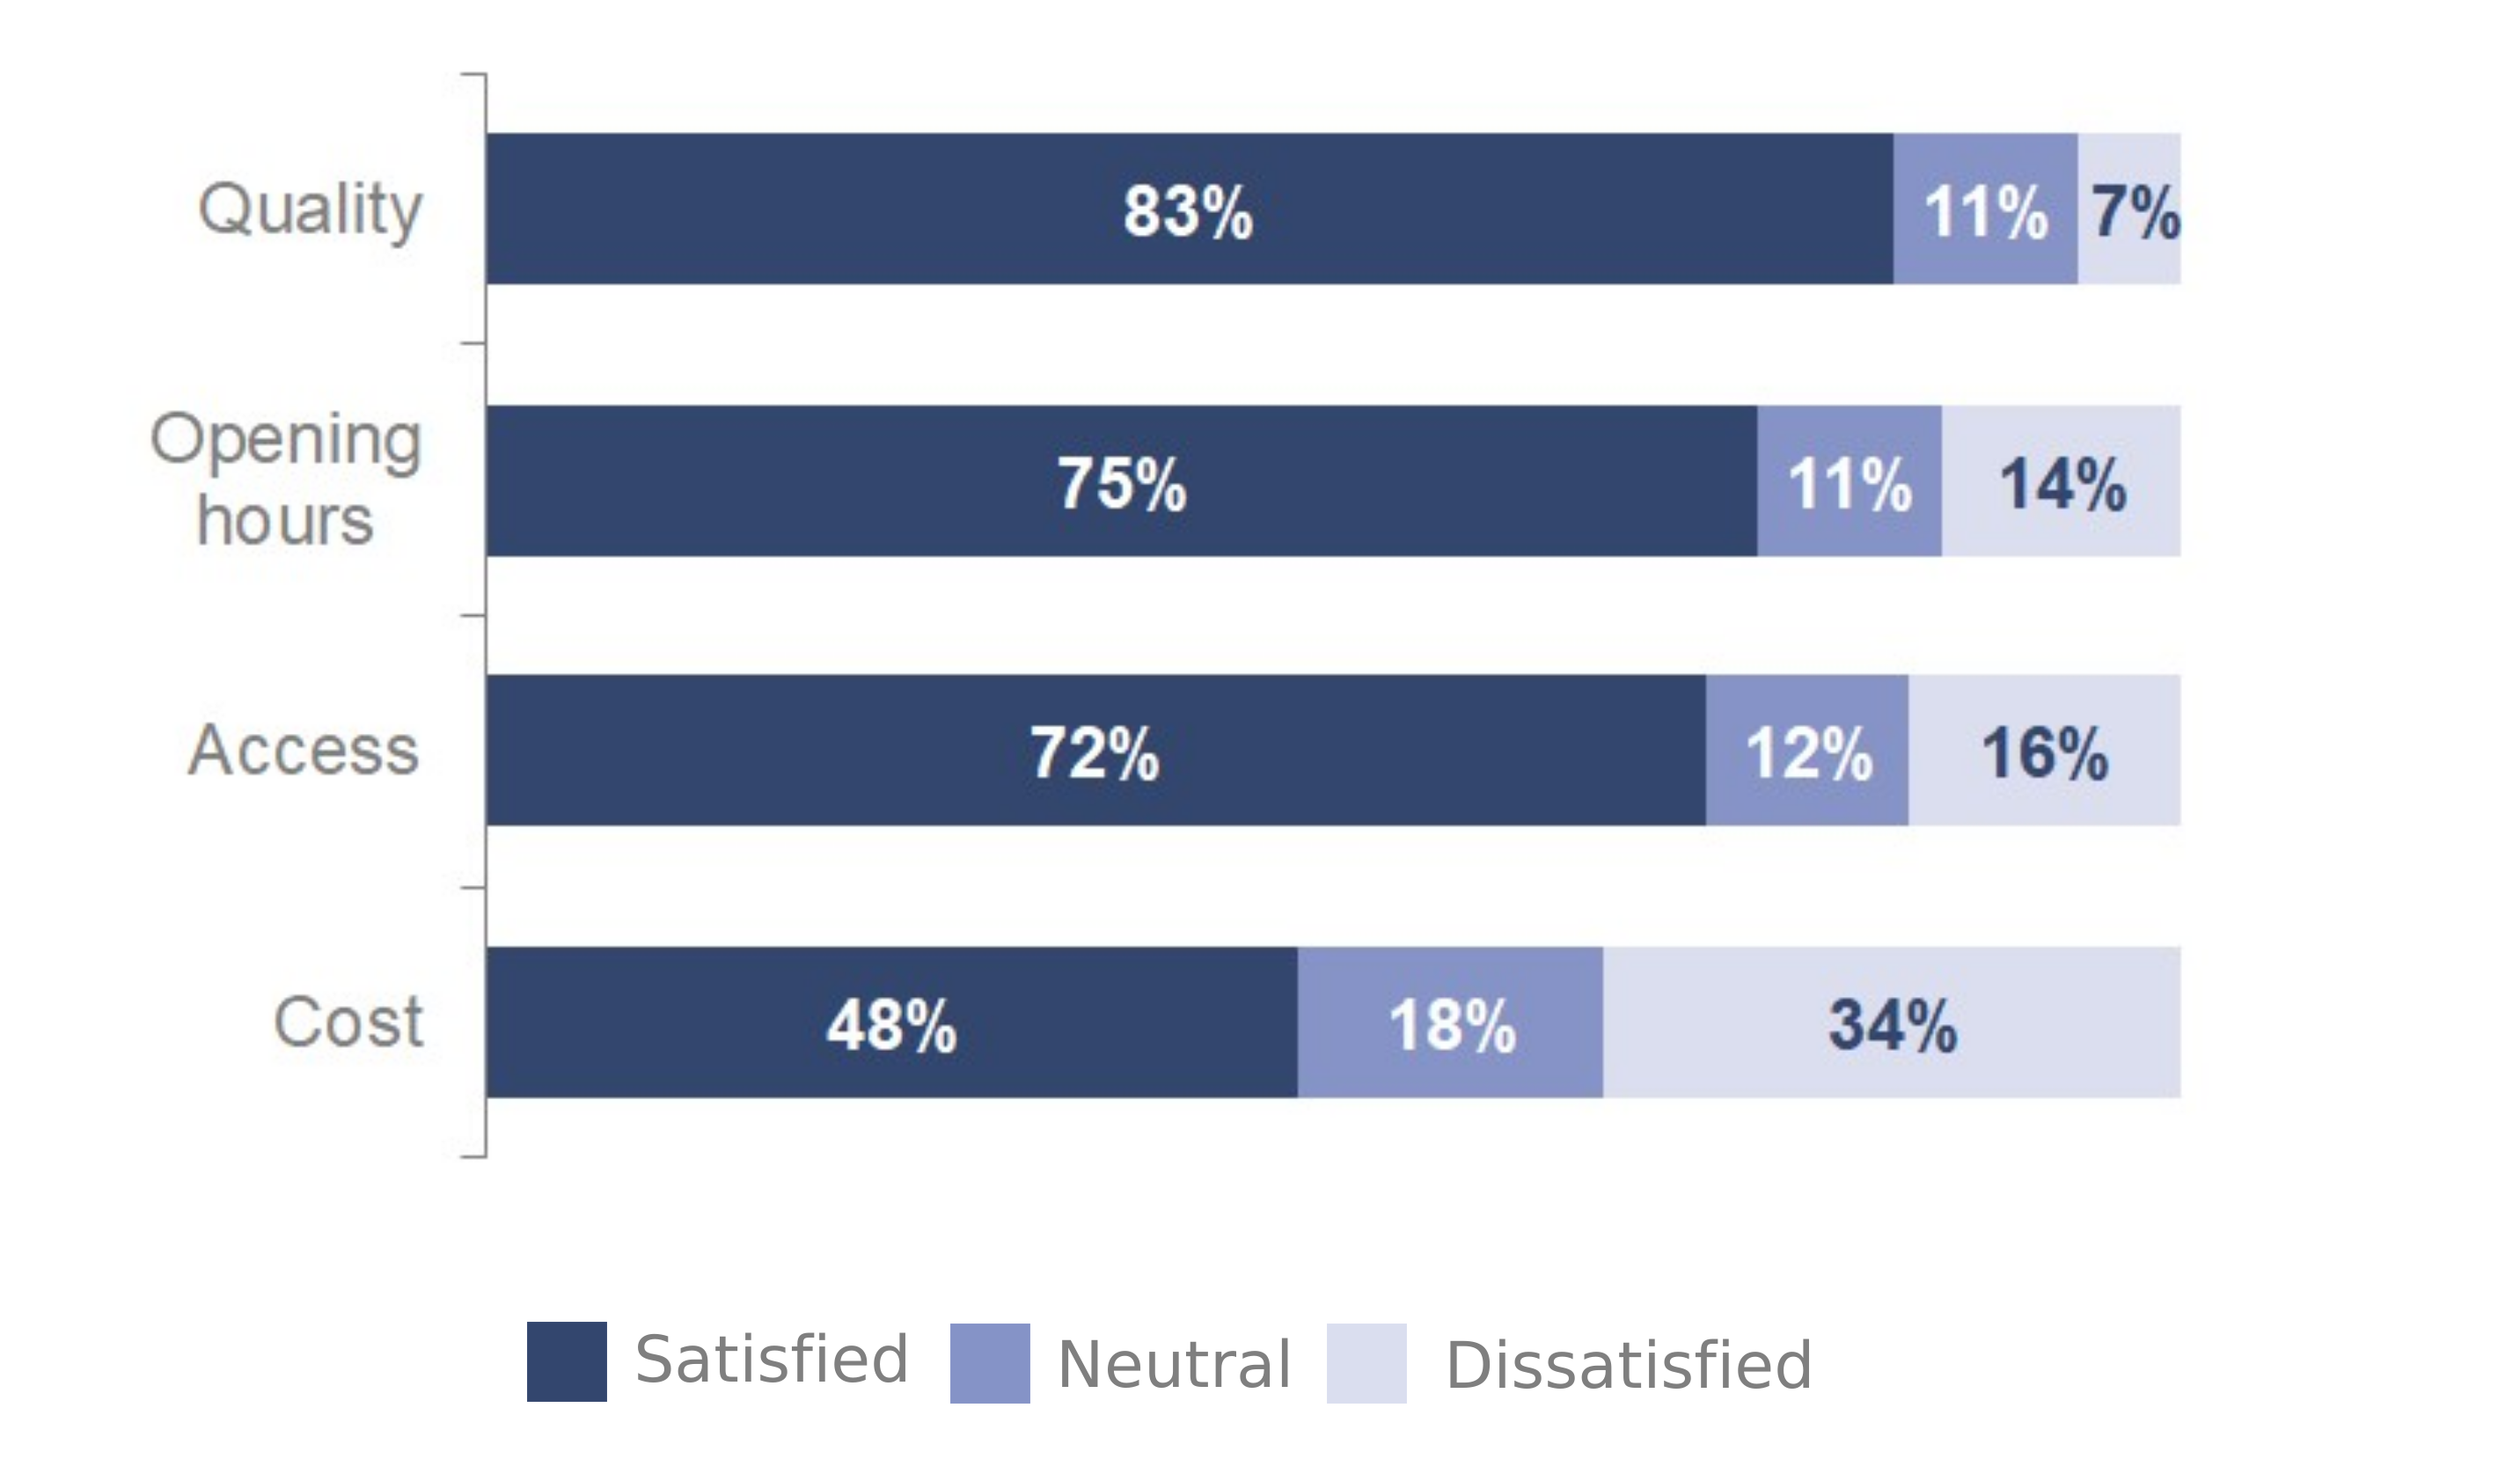
Figure 5.1: Satisfaction with aspects of early years childcare
These results are based on those families who required early years childcare.
Figure 5.1 is four stacked bar charts that show families who required early years childcare are more satisfied with the quality (83%), opening hours (75%) and access (72%) of their local early years childcare facility, than the cost (48%).
Of those families who required early years childcare, just over a third (34%) are dissatisfied with the cost.
National results for context
Although not directly comparable to Service families, the Childcare and Early Years Survey of Parents in England from 2024 also reports much more positive views around the quality than the affordability of childcare.
Of those families who required early years childcare, 15% changed childcare setting in the past 12 months due to Service reasons. A further 12% changed for other reasons.
Childcare for school-aged children
Over half of all Service families (53%) have at least one child of school age.
Of those families with school-aged children, over half (53%) required formal childcare such as breakfast/after school clubs in the last 12 months. This figure is in line with the previous three years, and above most years prior to 2023.
This means 47% of families with school-aged children did not need formal childcare. The top two reasons for this were:
- My children are old enough that I do not need childcare (33%)
- I work flexibly so I can manage without childcare (30%)
Just 3% of families selected “suitable formal childcare is not readily available where I live” and 5% selected “formal childcare is too costly where I live”.
Around six in ten RN/RN and RAF families (60% and 58%, respectively) needed formal childcare for school age children, compared to just under half of Army families (49%).
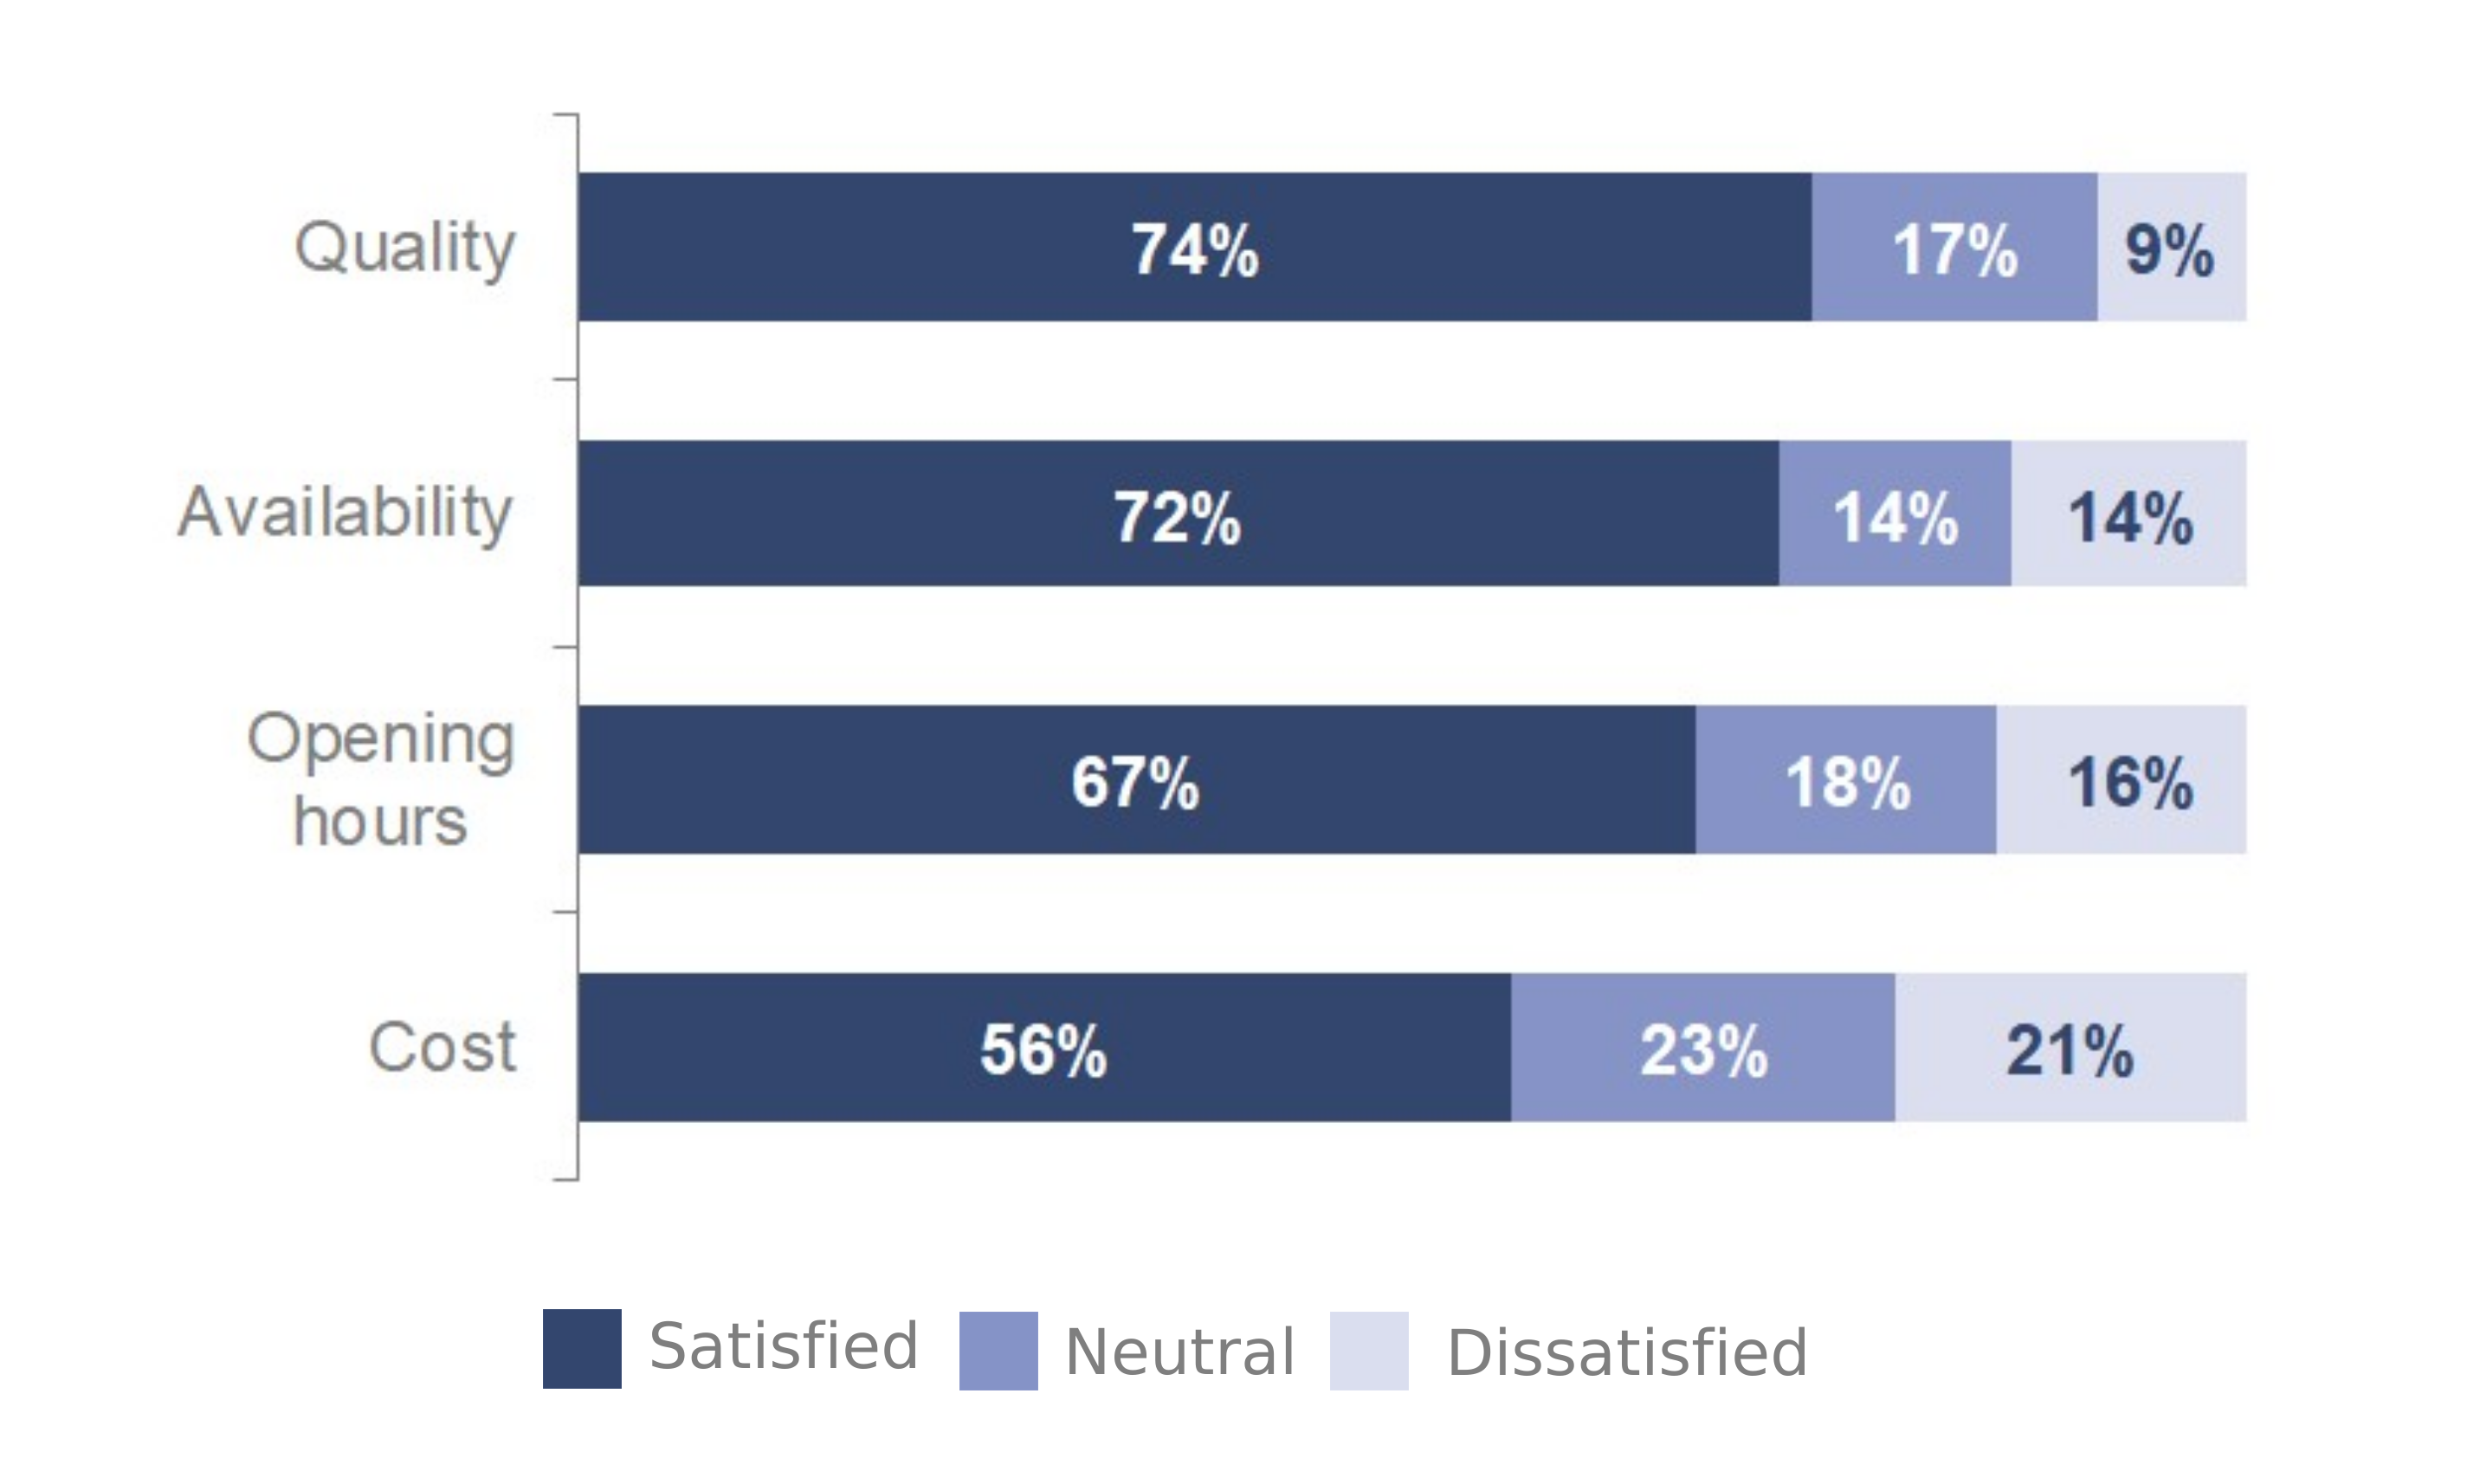
Figure 5.2: Satisfaction with aspects of local childcare for school-aged children
These results are based on those families who required childcare for school-aged children.
Figure 5.2 is four stacked bar charts that show, of those who needed childcare for school-aged children, 74% are satisfied with the quality and 72% with the availability of that childcare.
Over two-thirds (67%) are satisfied with the opening hours, whilst fewer are satisfied with the cost (56%).
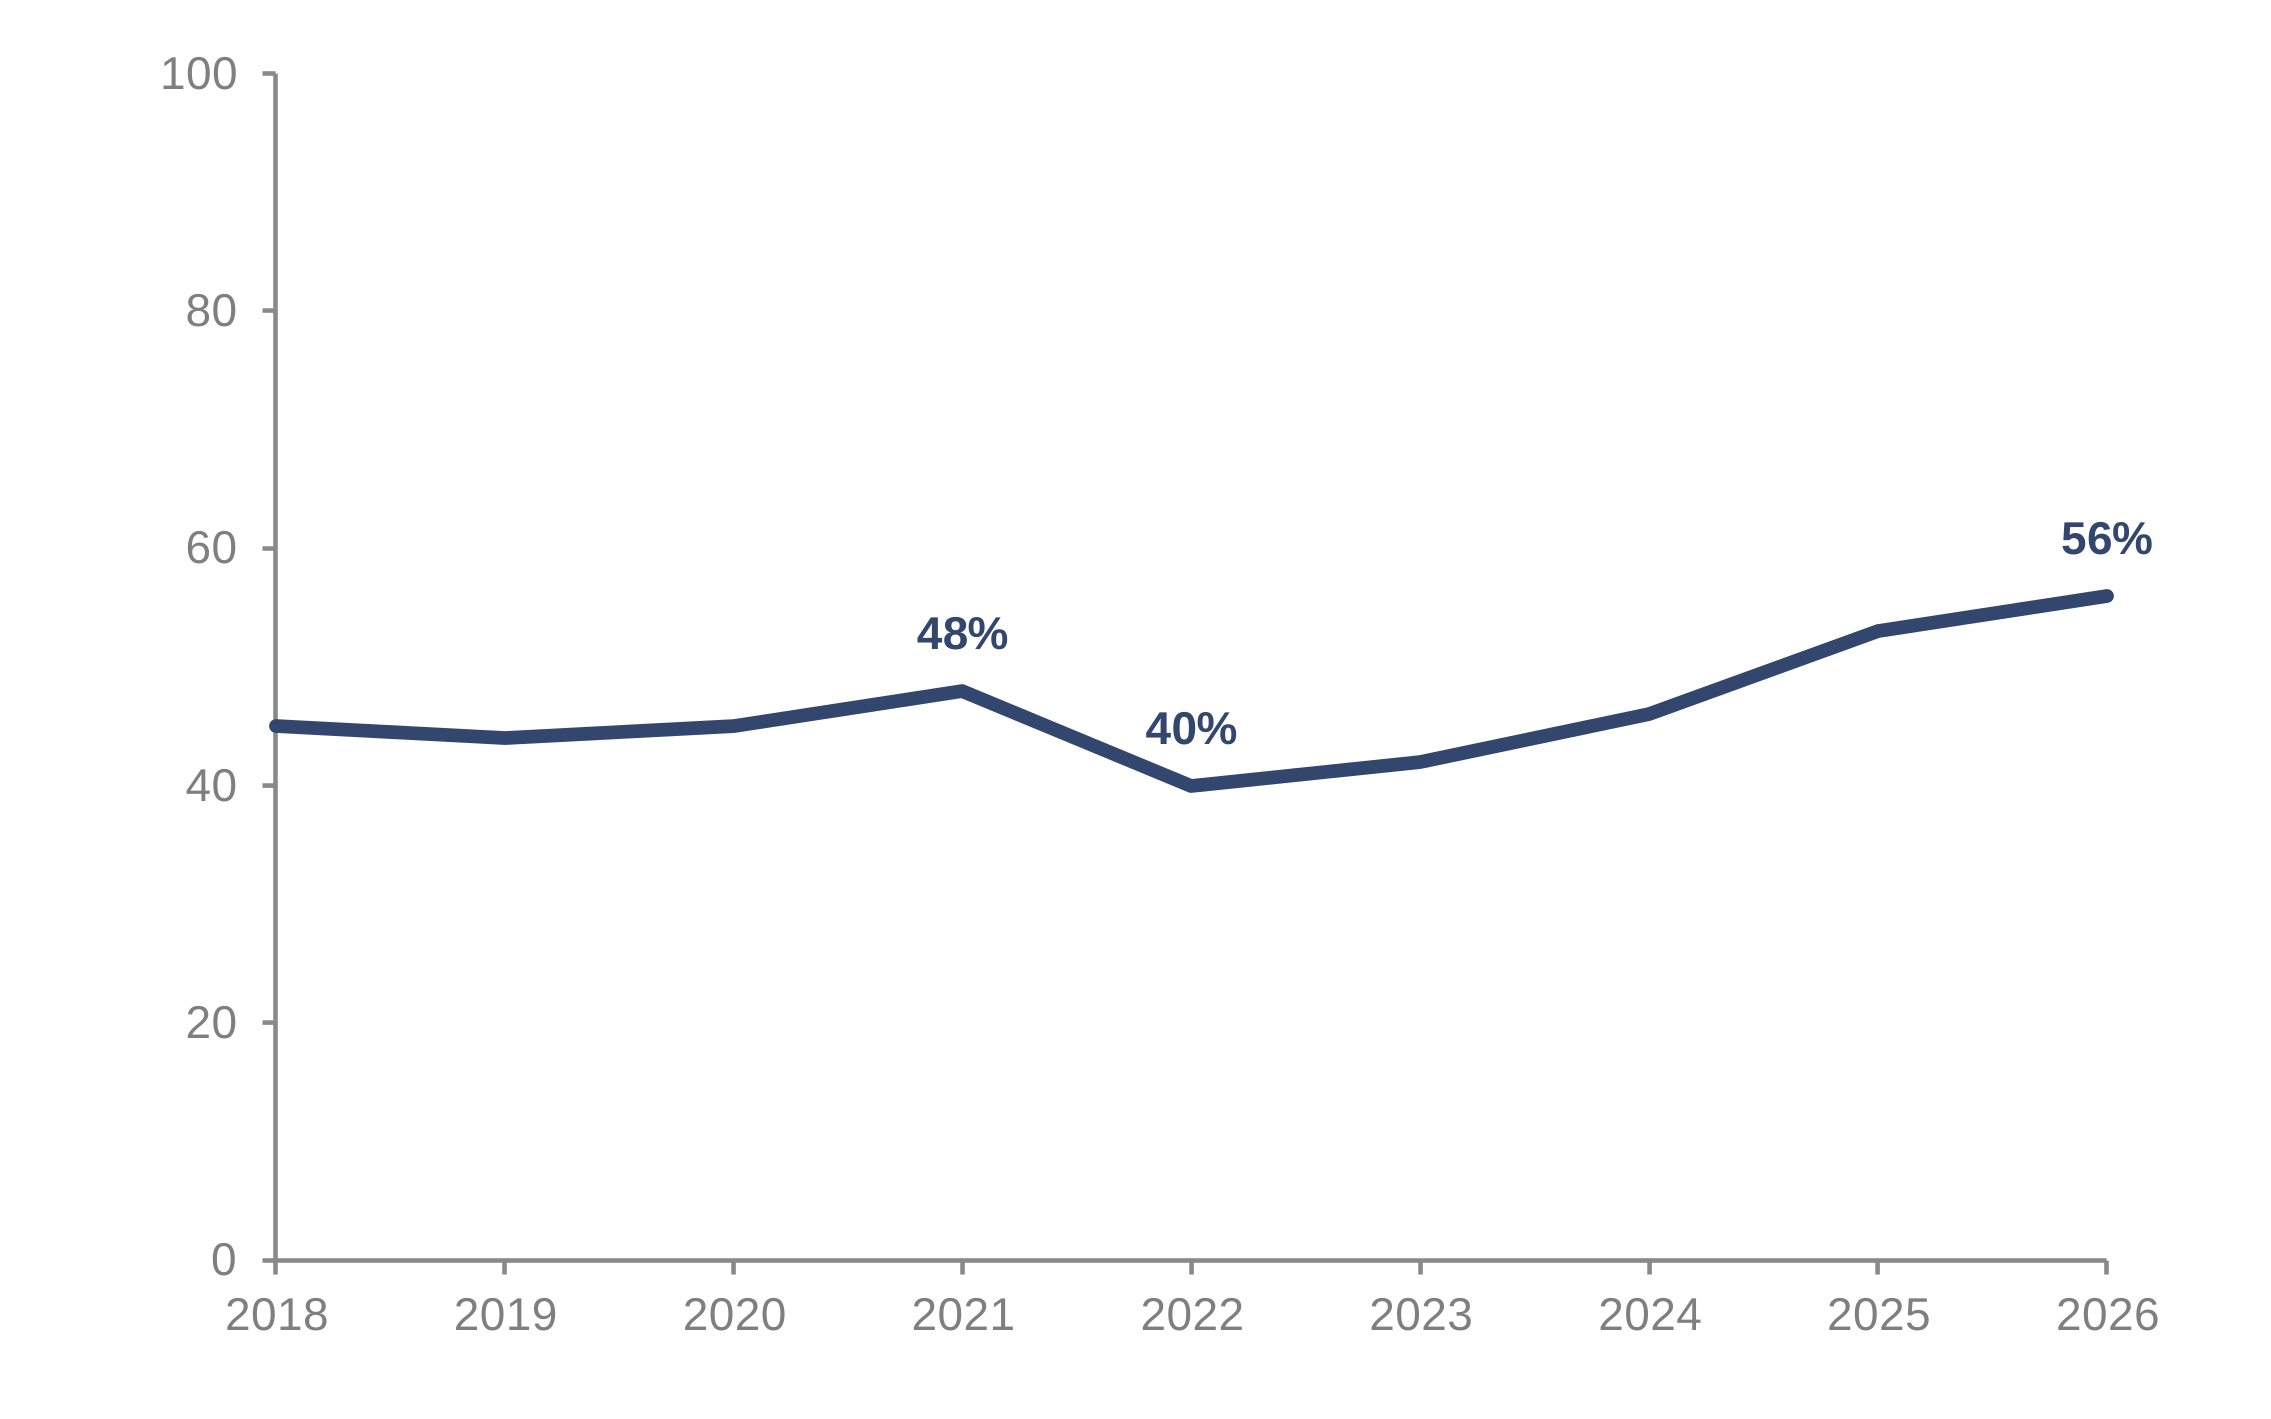
Figure 5.3: Satisfaction with cost of local childcare for school-aged children between 2018 and 2026
These results are based on those families who required childcare for school-aged children.
Figure 5.3 is a line graph showing the proportion of families satisfied with the cost of childcare for school-aged children between 2018 and 2026. Satisfaction with cost fell from 48% in 2021, to 40% in 2022. This decrease may have been due, in part, to cost of living pressures.
Satisfaction with cost has recovered since then, now 56%. This level is consistent with last year, but above all other reported levels since the question was first asked in 2017.
This improvement, may be due, in part, to the introduction of the MOD’s Wraparound Childcare (WAC) scheme.
The Wraparound Childcare (WAC) scheme helps working families with the cost of wraparound childcare for children aged between 4-11 years old.
Use of MOD’s Wraparound Childcare (WAC) scheme
Of those families with school-aged children who needed formal childcare, 46% use WAC. This is consistent with last year when the question was introduced.
Families living in England are more likely to use WAC (50%) than families living in other locations such as Scotland (26%), Wales (21%), or those living overseas (18%).
In January 2025, the WAC scheme was expanded to overseas locations in the European Economic Area & Switzerland, and locations where Defence Children Services Schools are used for before and after school childcare. In January 2026, the final planned phase of the WAC scheme known as the Primary School Aged Childcare Overseas (PSACO) allowance, launched in overseas locations where it is not possible for WAC eligibility criteria to be met or because Tax-Free Childcare accounts are not available.
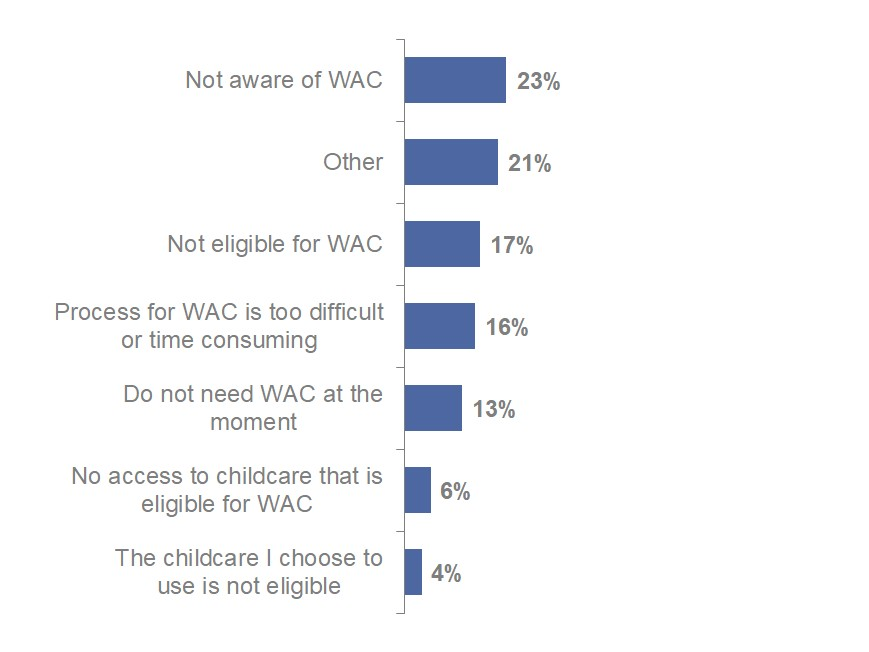
Figure 5.4: Main reason for not using WAC
These results are based on those families who needed formal childcare for school-aged children but do not use WAC.
Figure 5.4 is a bar chart showing the main reasons families do not use WAC. The bar chart shows the top reason is families not being aware of WAC (23%). This is followed by other (21%) and not being eligible for WAC (17%).
About one in six families (16%) felt the process for WAC was too difficult or time consuming, whilst 13% said they did not need WAC at the moment.
Formal and informal childcare
Free informal childcare may include grandparents, extended family, friends etc.
Of those families with children, over one in ten use free informal childcare at least weekly (12%). A further 14% use free informal childcare less often than weekly.
More than four in ten families with children are unable to access free informal childcare (44%), whilst three in ten (30%) do not need to access it.
RN/RM families with children are more likely to make use of free informal childcare at least weekly (17%) compared to Army and RAF families (11% and 12%, respectively).
Figure 5.5: Requirement for formal and informal childcare in the last 12 months
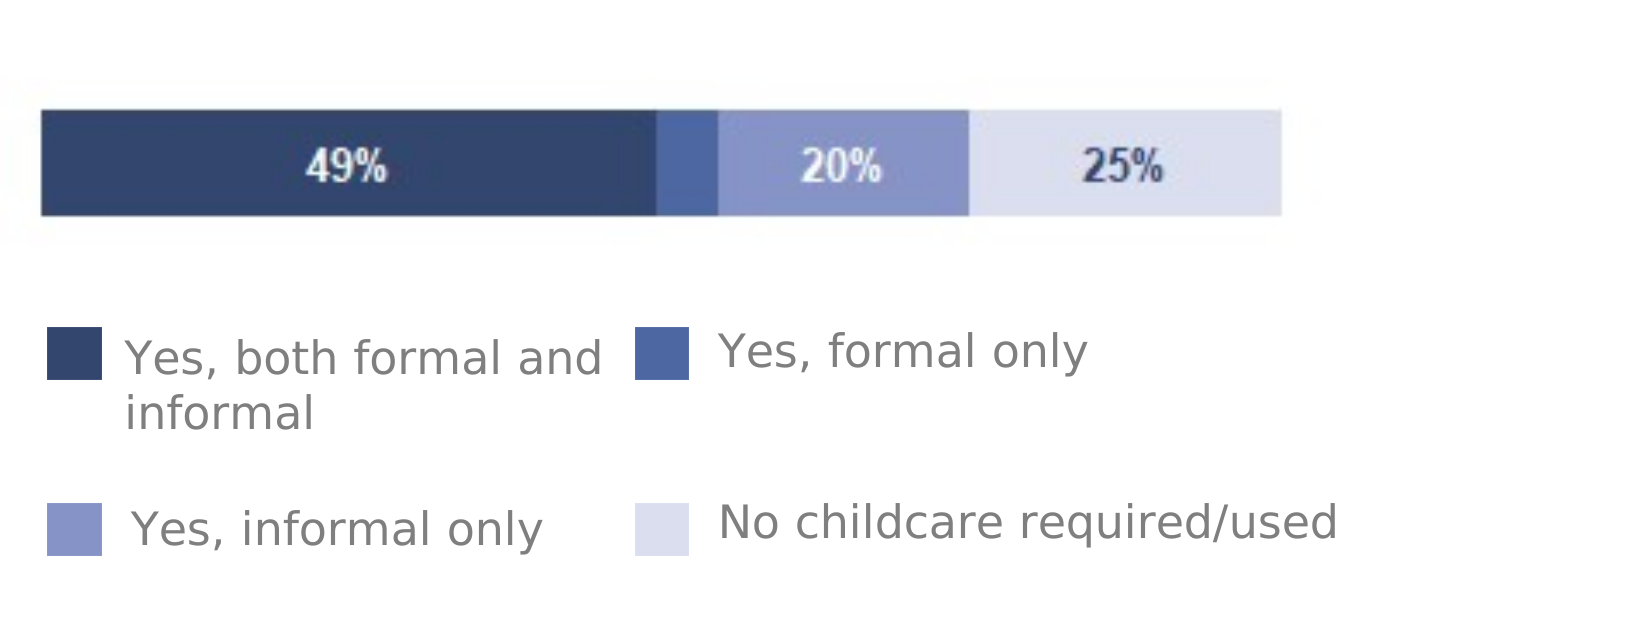
These results are based on those families with children.
Figure 5.5 is a stacked bar chart showing over half of families with children required formal childcare in the last 12 months (54%). A fifth (20%) used informal childcare only, whilst a quarter did not require any form of childcare (25%).
Use of government childcare initiatives
Figure 5.6: Use of government childcare initiatives
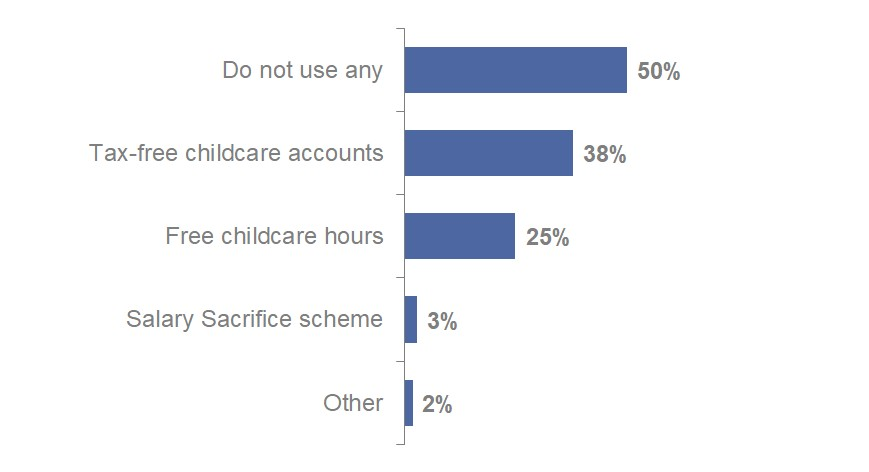
These results are based on those families who require childcare. These results are from a tick all that apply question. As such, percentages will not sum to 100%.
Figure 5.6 is a bar chart showing, of those families who require childcare, half (50%) do not use any government initiatives around childcare. This has decreased from 58% in 2022, showing more Service families have been using government childcare initiatives in recent years.
Amongst those families who require childcare, those using tax-free childcare accounts has increased from 22% in 2022 to 38% in 2026. This may be due, in part, to the launch of the MOD’s WAC Scheme in September 2022. Families need an active tax-free childcare account to use WAC.
A quarter of families who require childcare, use free childcare hours (25%). This is unchanged since last year but above the results reported between 2021 and 2024 (16-17%). This may be due, in part, to changes to eligibility for free childcare hours between April 2024 and September 2025.
Families by school type
Over half of all Service families (53%) have at least one child of school age.
Figure 5.7: Families by the type of school their children attend
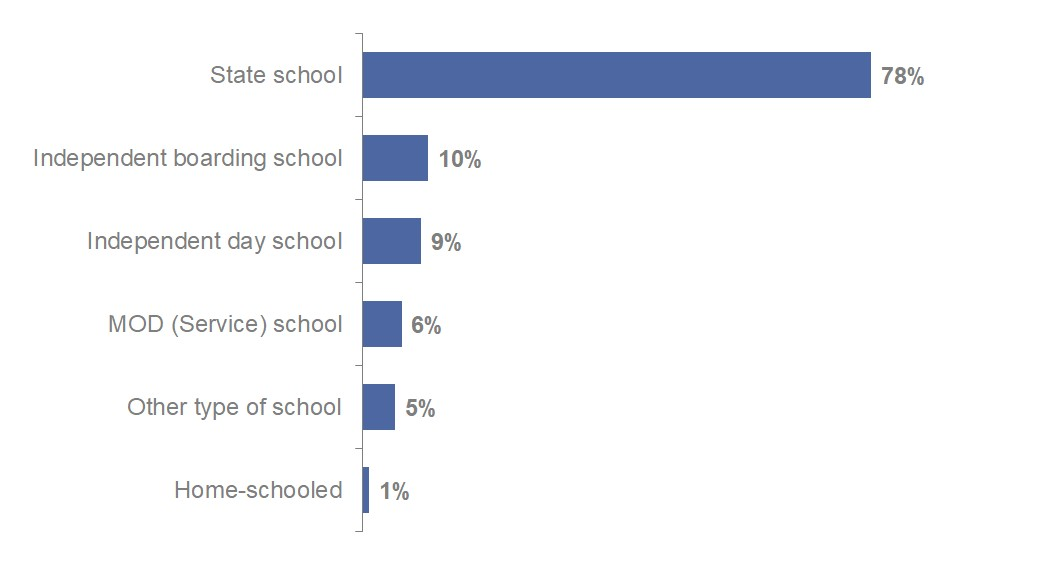
These results are based on those families with school-aged children. These results are from a tick all that apply question. As such, percentages will not sum to 100%.
Figure 5.7 is a bar chart that shows, of those families with school-aged children, 78% have a child at a state school. One in ten (10%) have a child at an independent boarding school whilst 9% have a child at an independent day school.
There are some Service and Rank group differences here. For example, Officer families are less likely to have a child at a state school (67%) than Other Rank families (84%).
Army families are also less likely to have a child at a state school (75%) than RN/RM (86%) or RAF families (82%).
Officer families are more likely to have a child at an independent boarding school (21%) than Other Rank families (5%). Army families are also more likely to have a child at boarding school (13%) than RN/RM (4%) or RAF families (6%).
Families in receipt of Continuity of Education Allowance (CEA)
Continuity of Education Allowance (CEA) assists Service personnel with boarding school fees to achieve the continuity of education for their children that would otherwise not be possible if their children accompanied them on frequent assignments both at home and overseas.
Overall, 12% of families with school-aged children are in receipt of CEA.
Of those with school-aged children, 22% of Officer families claim CEA, this compares to 8% for Other Rank families.
There are Service differences as well. Of those with school-aged children, 15% of Army families receive CEA compared to 7% of RN/RM families and 8% of RAF families.
Families with a child who changed school
Figure 5.8: Families by whether they had a child change school in the past year
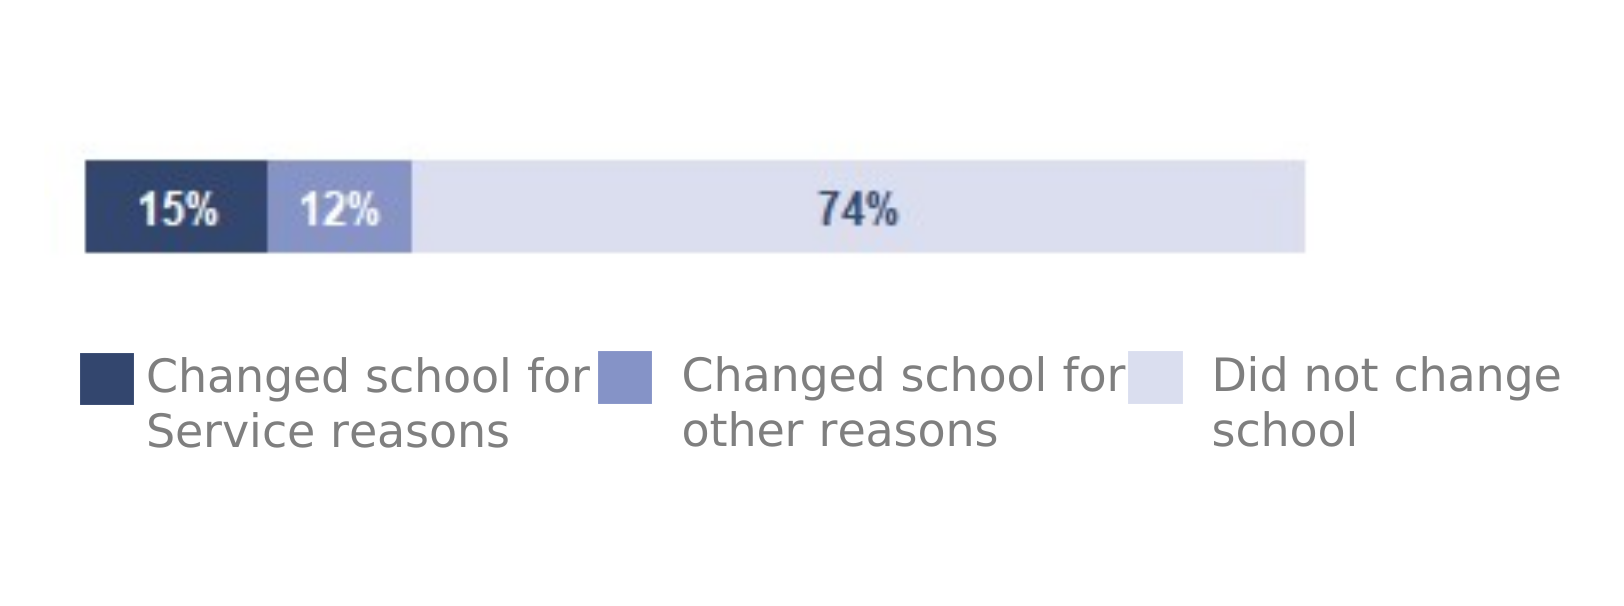
These results are based on those families with school-aged children.
Figure 5.8 is a stacked bar chart that shows, of those families with school-aged children, 15% had a child change school for Service reasons over the past year, whilst 12% had a child change school for other reasons.
Nearly three-quarters of families with school-aged children did not have a child change school over the past year (74%). These results are unchanged since 2021.
Families with a child who changed school for Service reasons were less able to apply within the timeframe for a normal point of entry (60%) than families with a child who changed school for other reasons (82%).
Normal point of entry refers to the normal intake year for a school such as Reception or Year 7.
Families by school allocation
Of those families with a child who changed school over the past year (for any reason), 76% applied for a place at a state school.
Figure 5.9: Families by child’s school allocation
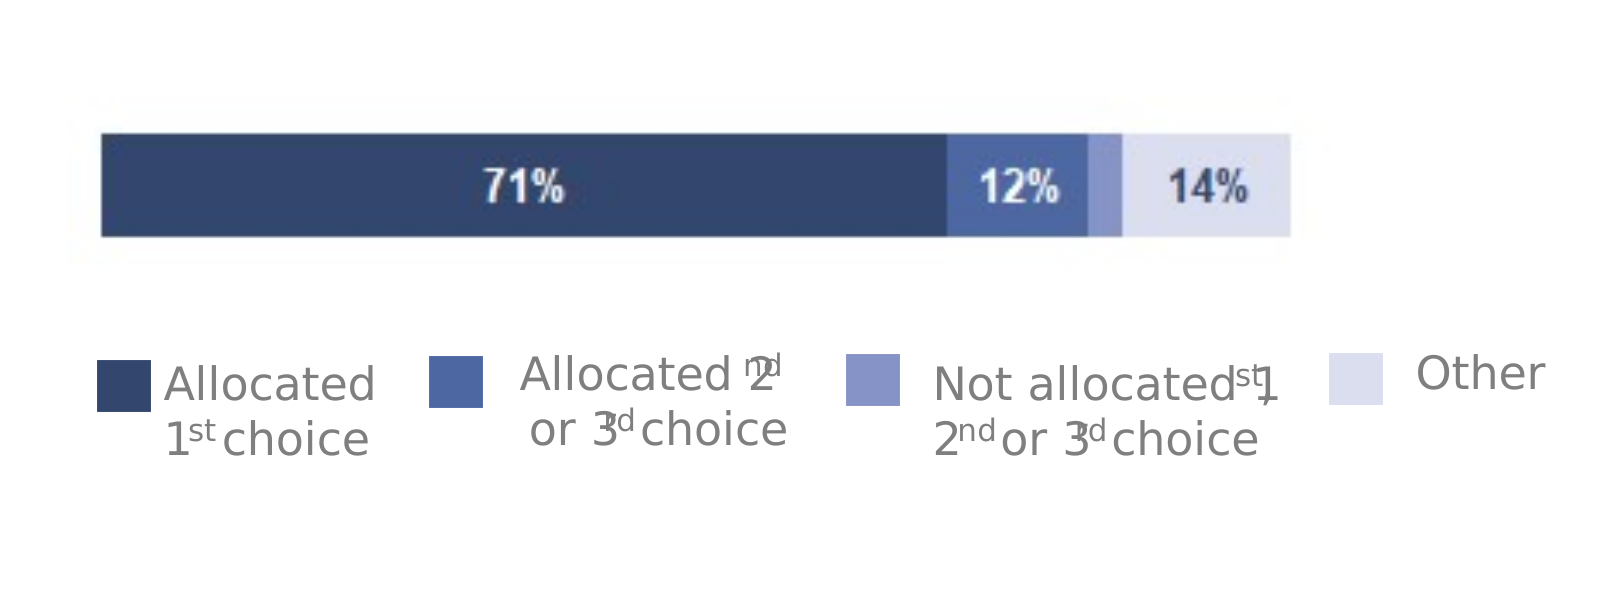
These results are based on those families with a child who changed school and applied for a place at a state school.
Figure 5.9 is a stacked bar chart that shows, of those families who applied for a place at a state school, 71% received their first choice, whilst 12% were allocated their second or third choice.
National results for context
Although not directly comparable to Service families, national figures on school applications offer some context: 83.5% of secondary school place applicants received an offer of their first choice of school. For primary school applicants this was 92.6%.
Just over three-quarters of families who applied for a place at a state school were happy with their allocation (76%). Conversely, just under a quarter were not happy with their allocation.
Families experiencing difficulties with their children’s education
Of those families with school-aged children, over one in five (22%) experienced difficulties with their children’s education in the past year.
The most common difficulty was obtaining support for Special Educational Needs (SEN), with 8% of families with school-aged children experiencing this difficulty. This is above all levels prior to 2022.
The second most common difficulty was getting a place at their school of choice, selected by 7% of families with school-aged children.
6. Communications
This section focuses on survey feedback and the communication between the Service and spouses. This includes:
- Views on the length of the survey
- How spouses heard about the survey
- Current methods of communication from the Service
- Ability to find out about support and policies
- How families find out about support and policies
- Access to their local base
Views on the length of this survey
Of those who completed the survey, 85% did so within 30 minutes. Three in ten spouses (30%) felt the survey was too long, whilst seven in ten (70%) felt it was about right.
These results are based on those who completed the survey. Nearly a quarter of respondents (24%) stopped completing the survey before they reached this question. These respondents may have different views on the length of the survey.
How spouses heard about this survey
These findings are from a tick all that apply question. As such, the results will not sum to 100%.
Eight in ten spouses (80%) said they heard about the survey via an email forwarded to them by their Serving partner. Over two in ten (22%) said their partner told them about the survey.
Very few spouses ticked any other methods of hearing about the survey. For example, 1% of spouses said they heard about the survey via the Service Families Federations.
These results are only for those who completed the survey. Most respondents heard about the survey via their Serving partner. This may have influenced responses in the rest of this section, particularly those relating to current communications and methods used to find out about support offered by the Service.
Current methods of communication from the Service
Figure 6.1: Spouses by how the Service currently communicates with them
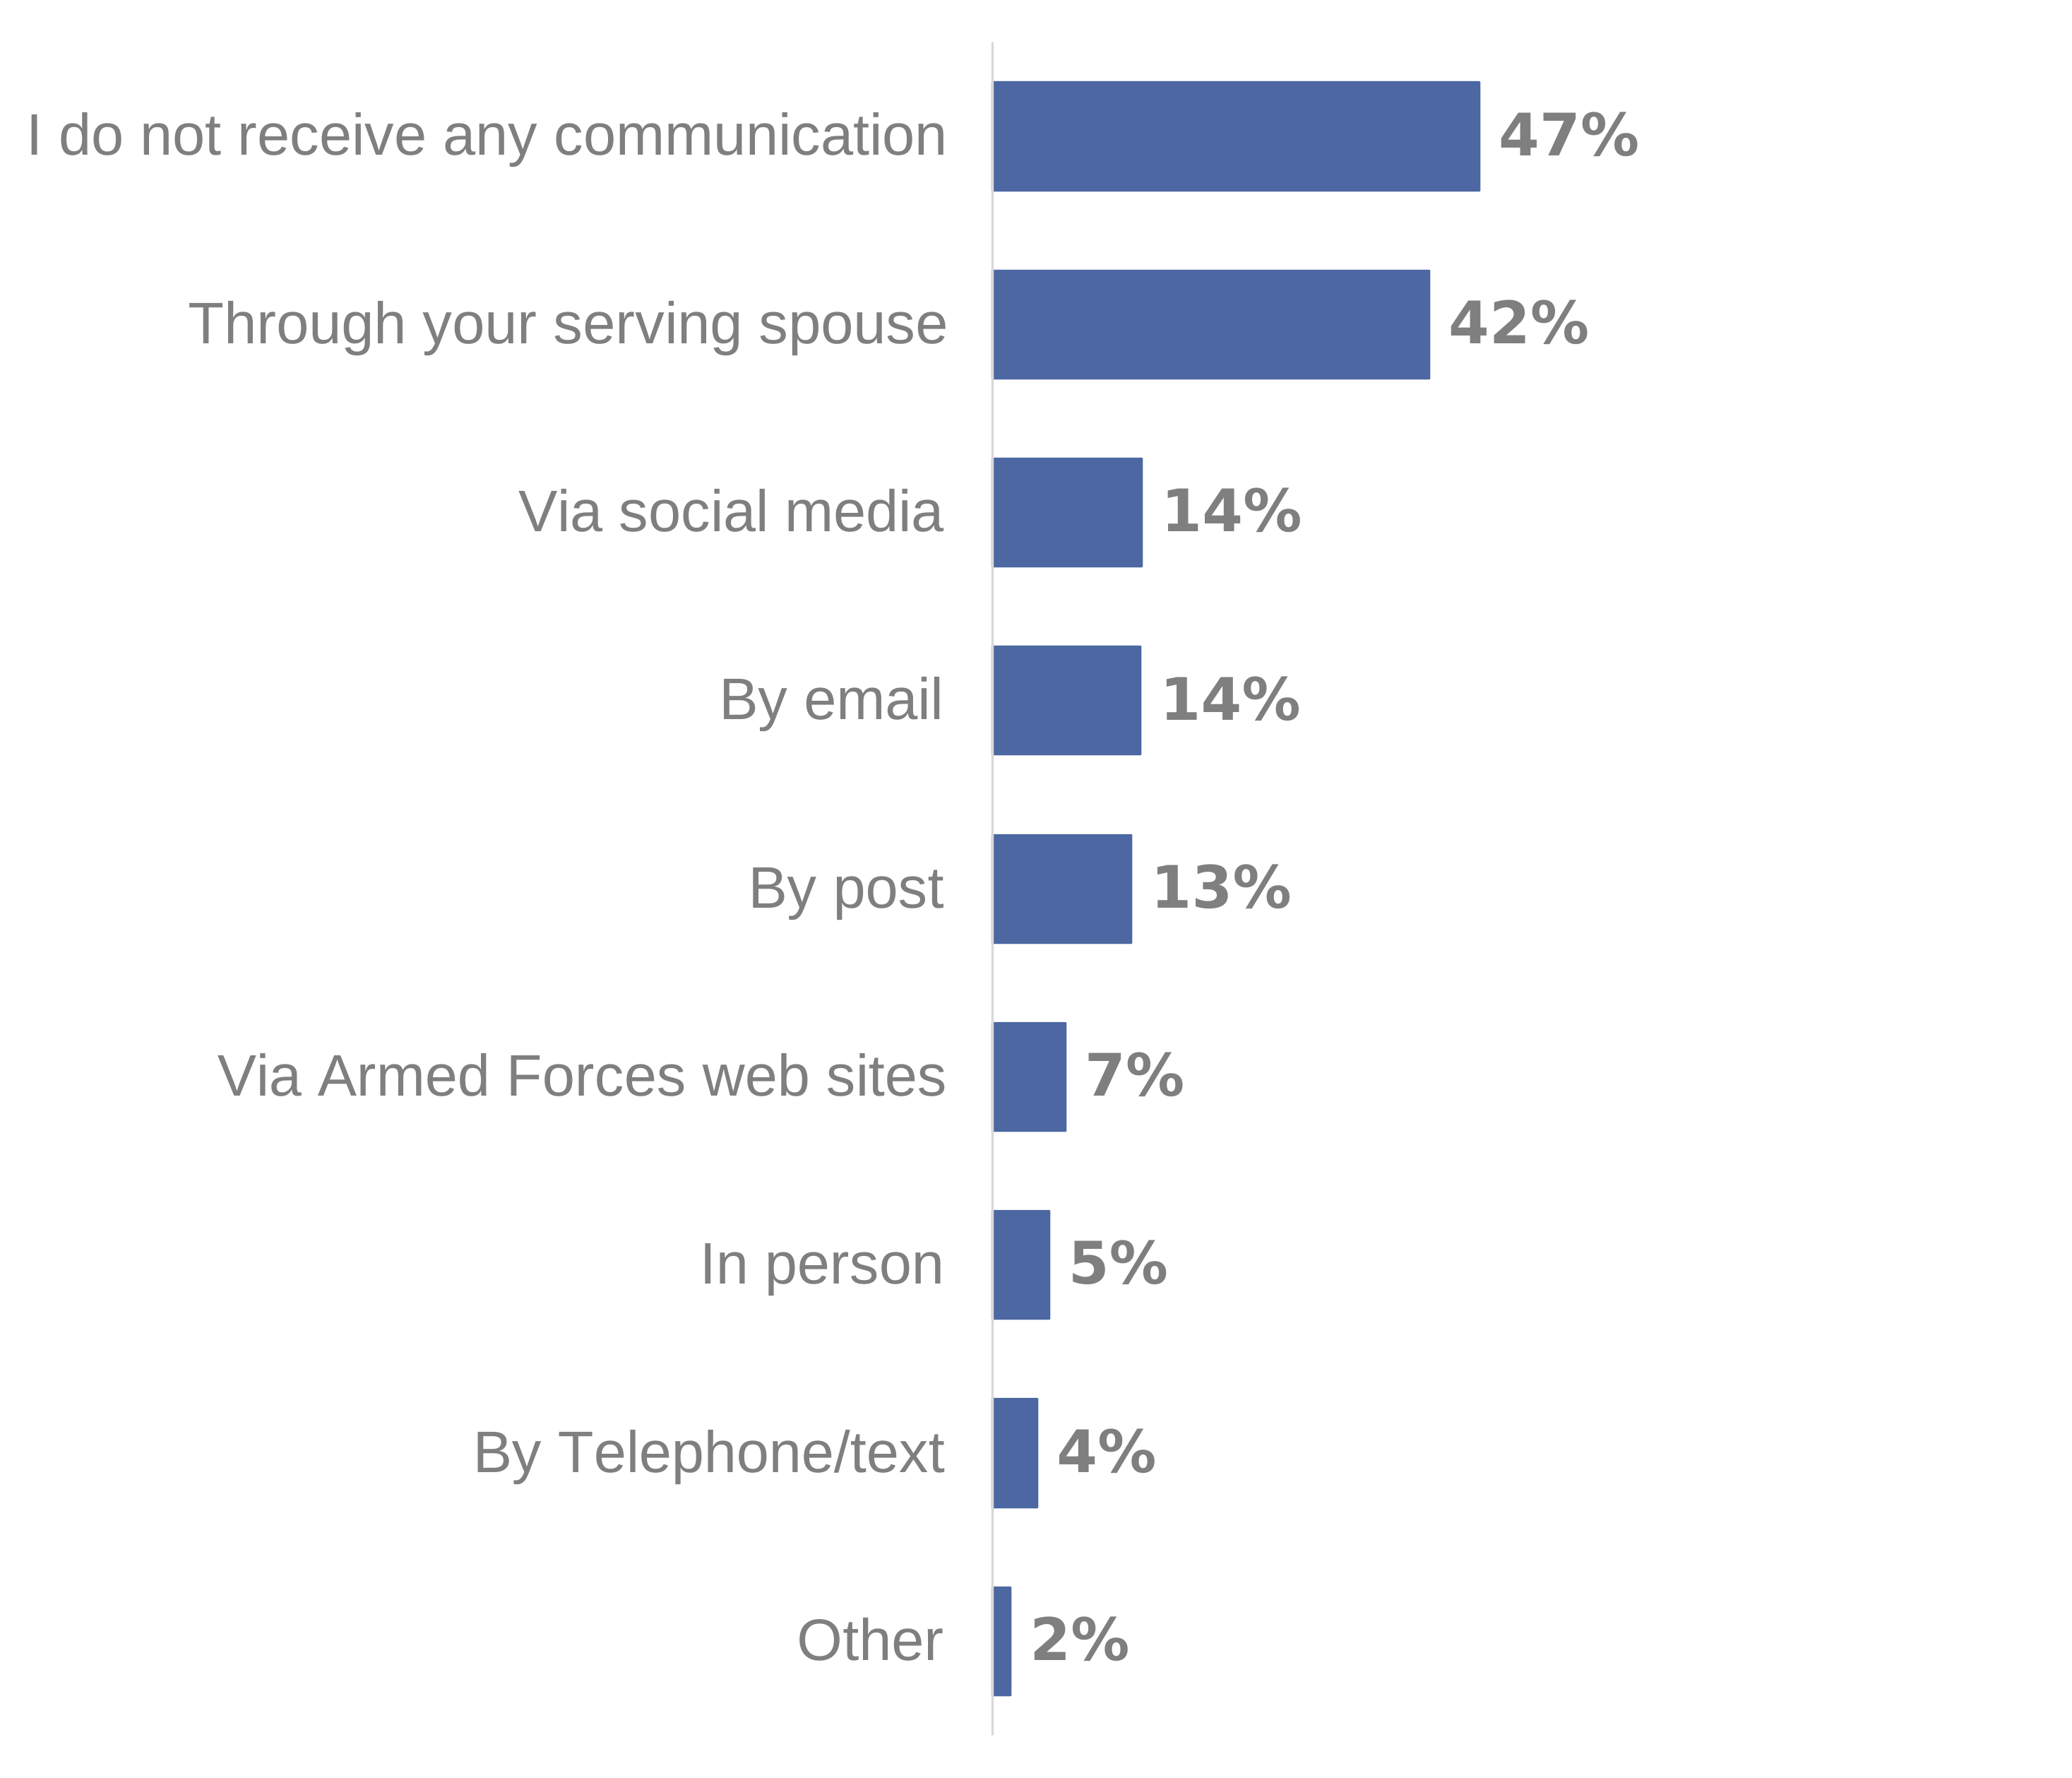
These results are from a tick all that apply question. As such, percentages will not sum to 100%.
Figure 6.1 is a bar chart that shows nearly half of spouses (47%) do not currently receive any communication from the Service. This is higher for RN/RM spouses (55%) than Army (44%) or RAF spouses (46%).
Just over a third of spouses living overseas (35%) do not currently receive any communication from the Service, this compares to almost half of spouses living in England (48%).
Over four in ten spouses (42%) said they heard from the Service through their Serving spouse, this is followed by social media (14%), email (14%) and post (13%).
Less than one in ten ticked the other methods of communication. For example, 7% hear from the Service via Armed Forces web sites.
Most respondents heard about the survey via their Serving partner. This may have influenced these results.
Ability to find out about support and policies
Figure 6.2: Spouses agree or disagree they can find out about policies aimed at them
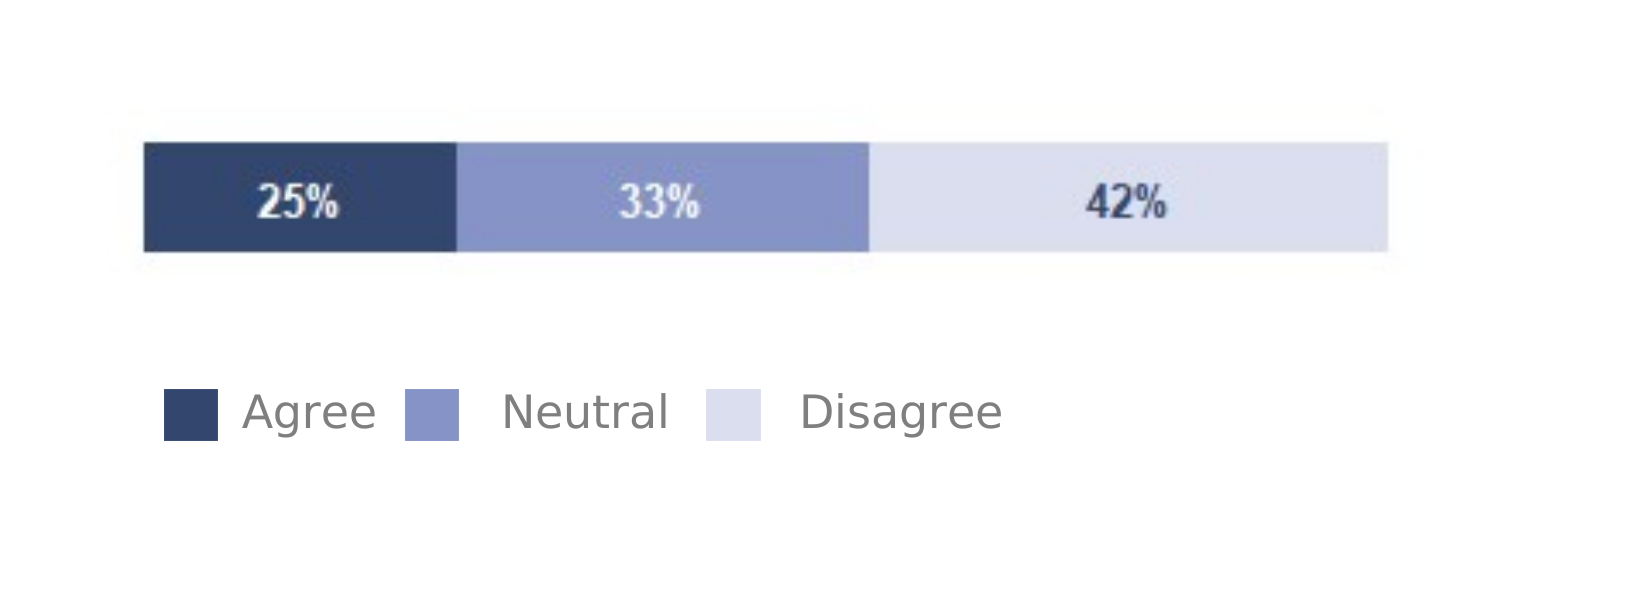
Figure 6.2 is a stacked bar chart that shows over two in five spouses (42%) disagree that they can find out about policies aimed at them and their family. A quarter of spouses (25%) agree. These results are consistent with last year, when this question was introduced.
Over half of RN/RM spouses disagree (51%) followed by RAF (44%) and then Army spouses (37%).
Figure 6.3: Spouses agree or disagree they can get the information they need about support offered to them by the Service
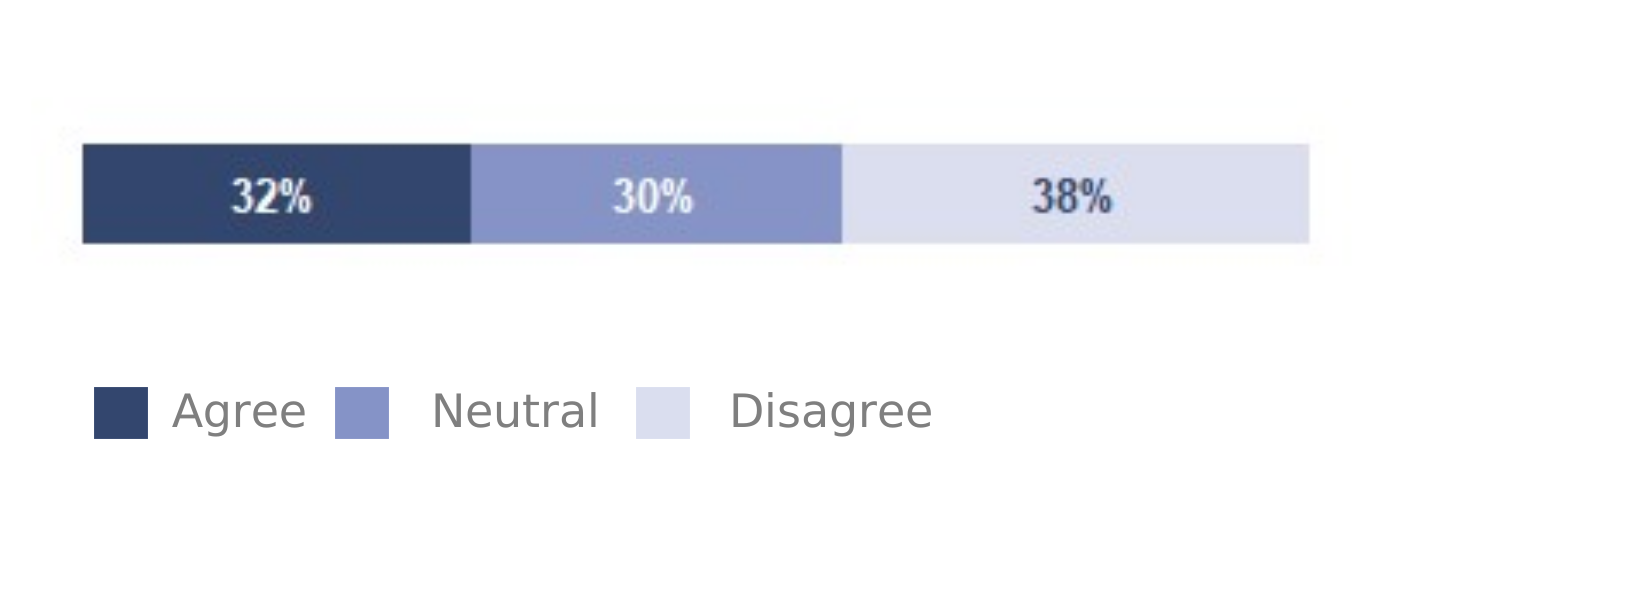
Figure 6.3 is a stacked bar chart that shows nearly four in ten spouses (38%) disagree that they can get the information they need about support offered to them by the Service. Nearly a third of spouses (32%) agree. These results are unchanged since 2022, when this question was introduced.
RAF spouses are more likely to agree (38%) than RN/RM (31%) or Army spouses (29%).
Officer spouses are more likely to agree (35%) than Other Rank spouses (30%).
Fewer spouses living overseas disagree (27%) than those living in England (39%).
How families find out about support and policies
The following question was added to the survey in 2025. This was a tick all that apply question so totals will not sum to 100%. Most respondents heard about the survey via their Serving partner. This may have influenced these results.
Figure 6.4: How spouses find out about support for them as a Service family
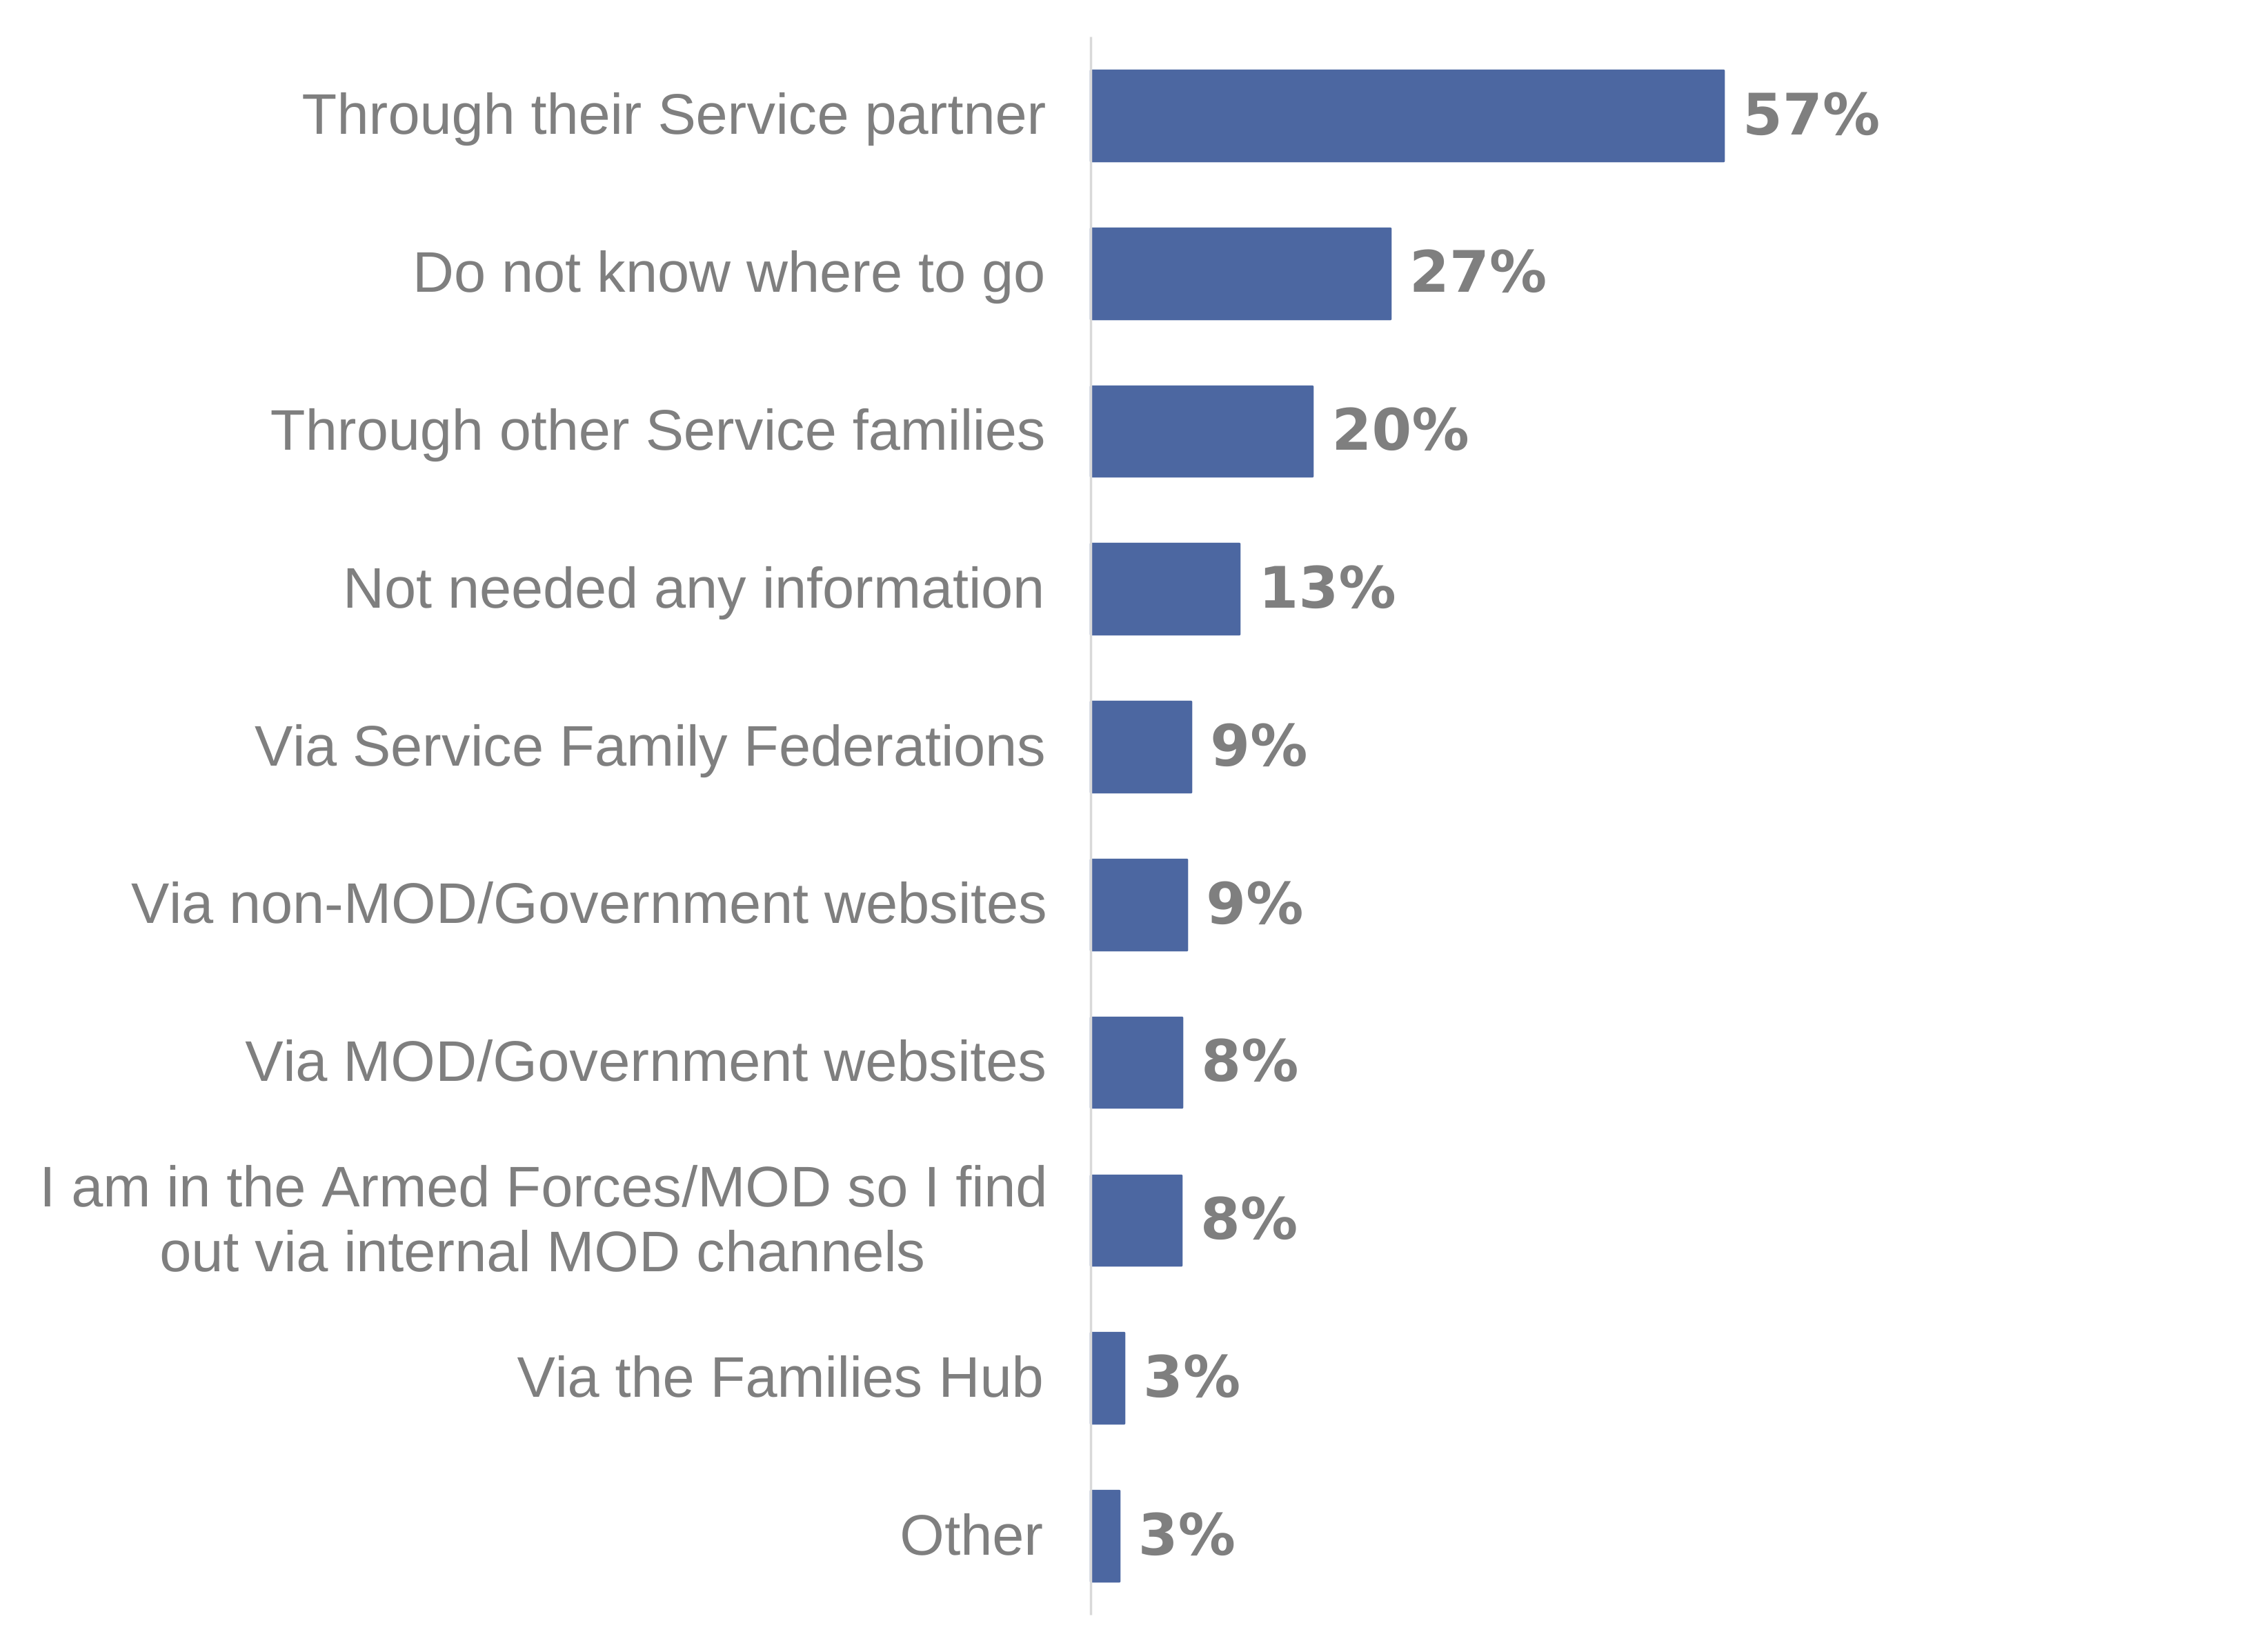
Figure 6.4 is a bar chart that shows nearly six in ten spouses (57%) find out about support through their Serving partner.
Over a quarter of spouses (27%) do not know where to go to find out about support and 13% have not needed to find out about support.
Two in ten spouses (20%) find out about support through other Service families.
Less than one in ten families use other means to find out about support. For example, 9% of spouses use single Service Families Federations and 8% use other MOD/Government web sites.
Amongst RAF spouses, 15% use the RAF Hive to find out about support, whilst 13% of Army spouses use their Army Unit Welfare team.
Access to their local base
Nearly eight in ten spouses (79%) said they would use the facilities on their local base if they were easily able to access them.
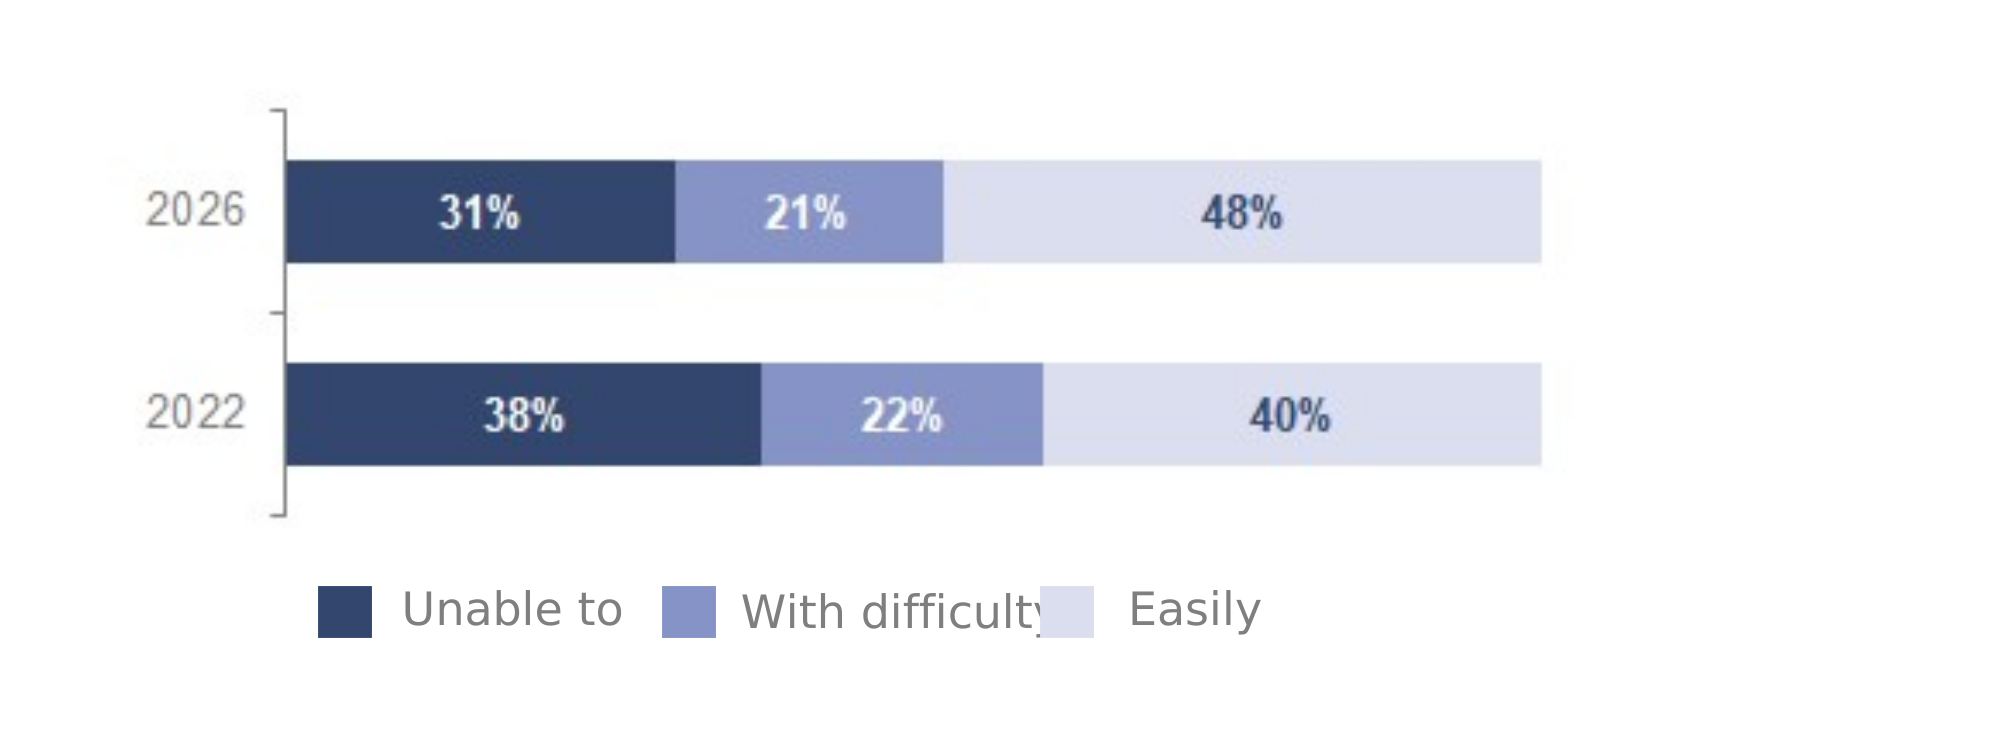
Figure 6.5: Spouses’ ability to access their local base this year compared to 2022
These results are based on those spouses who required access to their local base.
Figure 6.5 is two stacked bar charts comparing spouses’ ability to access their local base in 2026 against 2022. It shows that access has improved since 2022, when this question was first asked.
In 2026, nearly half of spouses (48%) can access their local base easily compared to 40% reported in 2022.
Correspondingly, there has been a reduction in the proportion unable to access facilities, falling from 38% in 2022 to 31% this year.
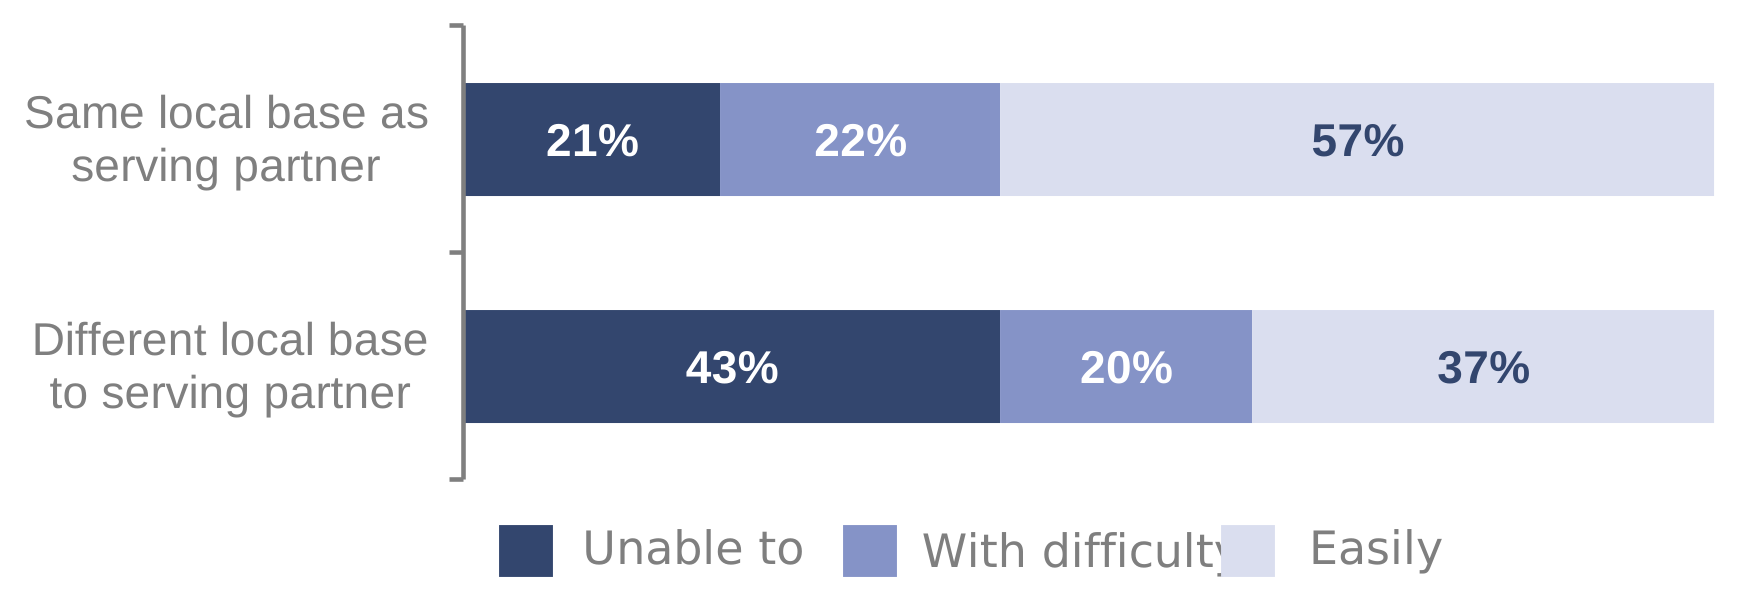
Figure 6.6: Spouses ability to access their local base by whether they share the same local base as their Serving partner
These results are based on those spouses who required access to their local base.
Figure 6.6 is two stacked bar charts comparing spouses’ ability to access their local base between those with the same local base as their Serving partner and those with a different local base. It shows that those who share the same local base as their Serving partner are more able to access facilities.
Nearly six in ten spouses who share the same local base as their Serving partner are able to access it easily (57%), compared to 37% of those with a different local base. Over four in ten spouses with a different local base are unable to access it (43%) compared to just over two in ten (21%) of those with the same local base.
Amongst those who share the same local base as their Serving partner, over a third of RN/RM spouses (36%) are unable to access their local base compared to 18% of Army and 17% of RAF spouses.
7. Deployment
This section focuses on spouses’ views on operational deployments and Service-provided support available to them. This section includes:
-
Views on frequency and length of operational tours
-
Knowledge of support
-
Use of support
-
Satisfaction with support
Views on frequency and length of operational tours
Figure 7.1: Views on the frequency of operational tours
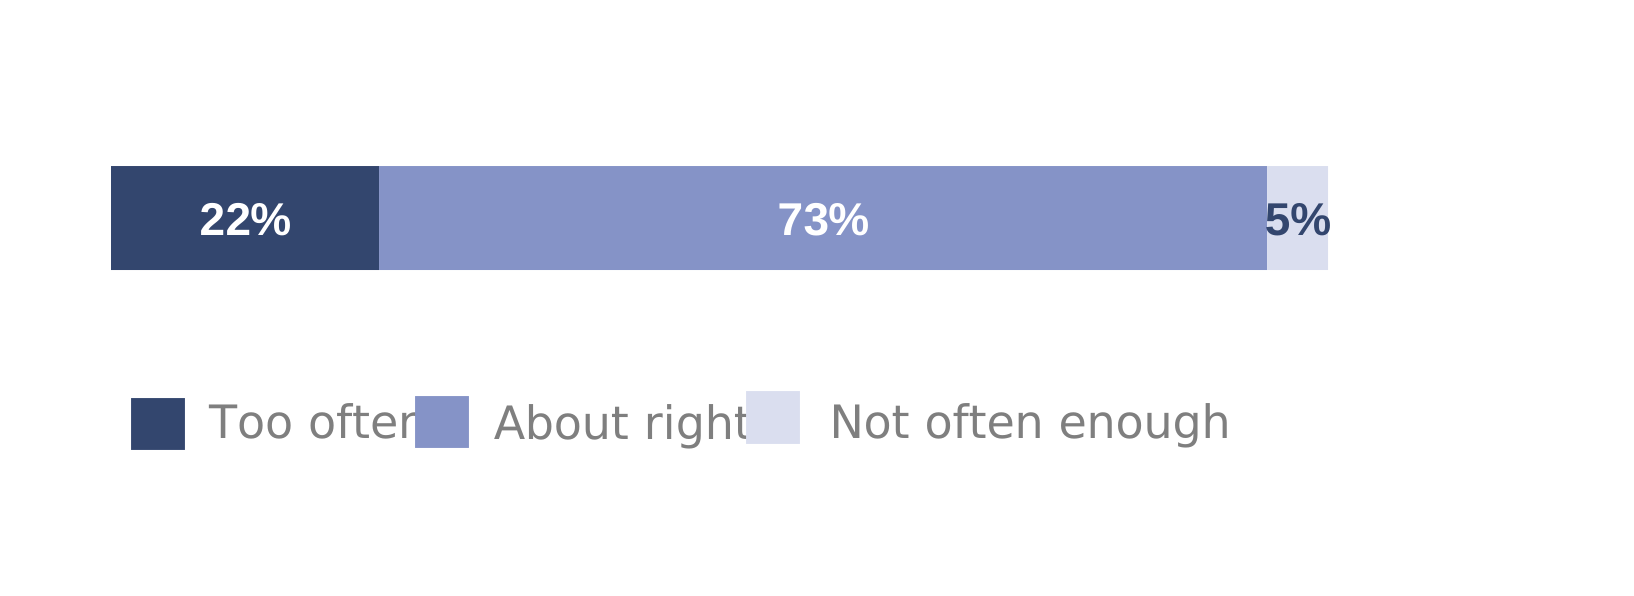
Figure 7.1 is a stacked bar chart that shows over seven in ten spouses (73%) feel the frequency of operational tours is about right. Over two in ten (22%) feel they are too often.
Officer spouses are more likely to feel the frequency of operational tours is about right (83%) than Other Rank spouses (68%).
Figure 7.2: Views on the length of operational tours
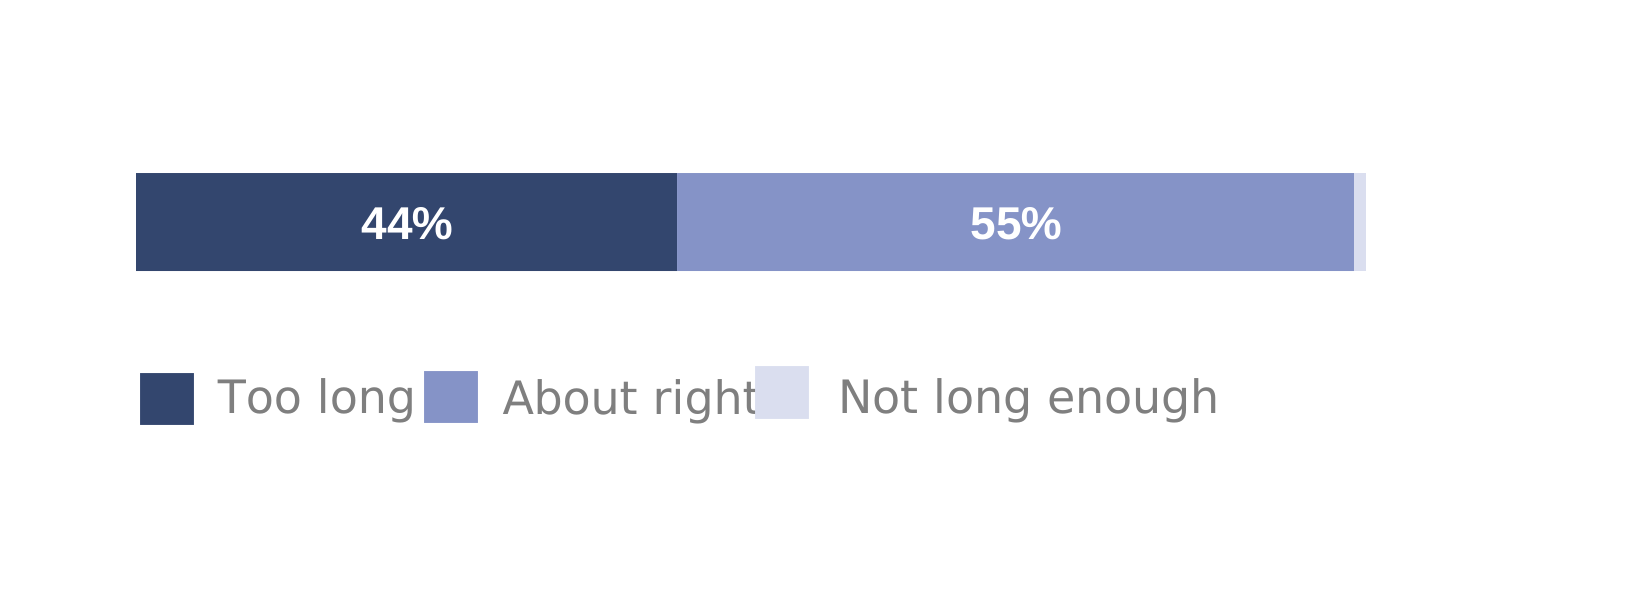
These results are based on those spouses whose partner has been on an operational deployment within the past two years.
Figure 7.2 is a stacked bar chart that shows 55% of spouses feel the length of operational tours is about right, whilst 44% feel they are too long.
AFCAS 2026 comparison
In comparison to their spouses, 15% of married Service personnel feel they deploy “too often” while 25% feel their deployments are “not often enough”.
Fewer married Service personnel feel the length of their tours are “too long” (14%) compared to their partners.
Knowledge of support
Over a third of spouses (37%) do not know where to go for Service-provided support while their partner is on an operational tour. Although unchanged since 2022, this is higher than all levels reported prior to 2020.
Over half of spouses (56%) know where to go for Service-provided support.
Figure 7.3: Spouses who do NOT know where to go for Service-provided support while their partner is on an operational tour by Service
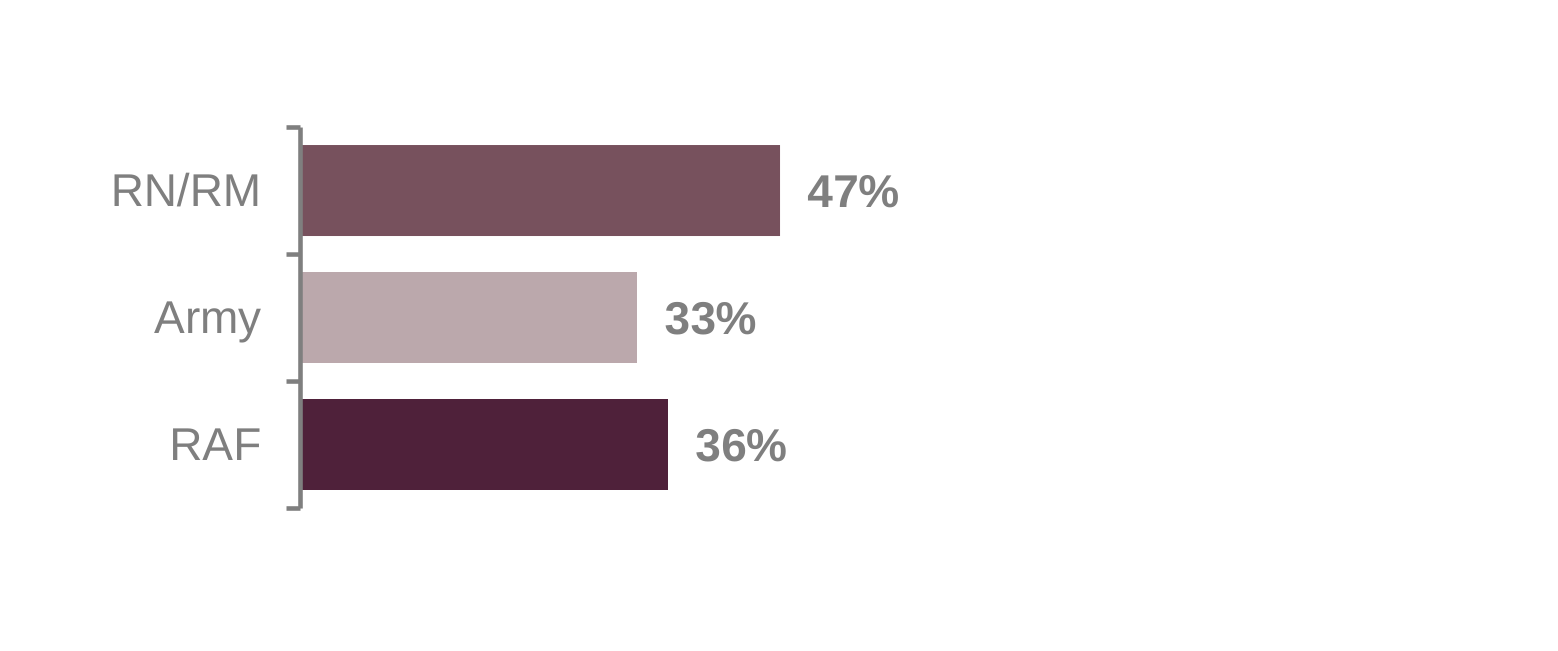
Figure 7.3 is a bar chart that shows 47% of RN/RM spouses do not know where to go for Service-provided support while their partner is on an operational tour. This differs to the 33% and 36% reported for Army and RAF spouses.
Use of Service-provided support before, during and after operational deployment
The results in this section are based on those spouses whose partner has been on an operational deployment within the past two years.
During their partners’ last operational tour:
- 50% used Welfare support
- 54% used direct contact and support from their partners’ Chain of Command
- 56% used facilities and events to meet with other spouses and families
- 87% used lines of communication with their partner
RAF spouses are less likely to use support after their partners’ operational tour.
Figure 7.4: Use of support from the Chain of Command after their partners’ Operational tour by Service
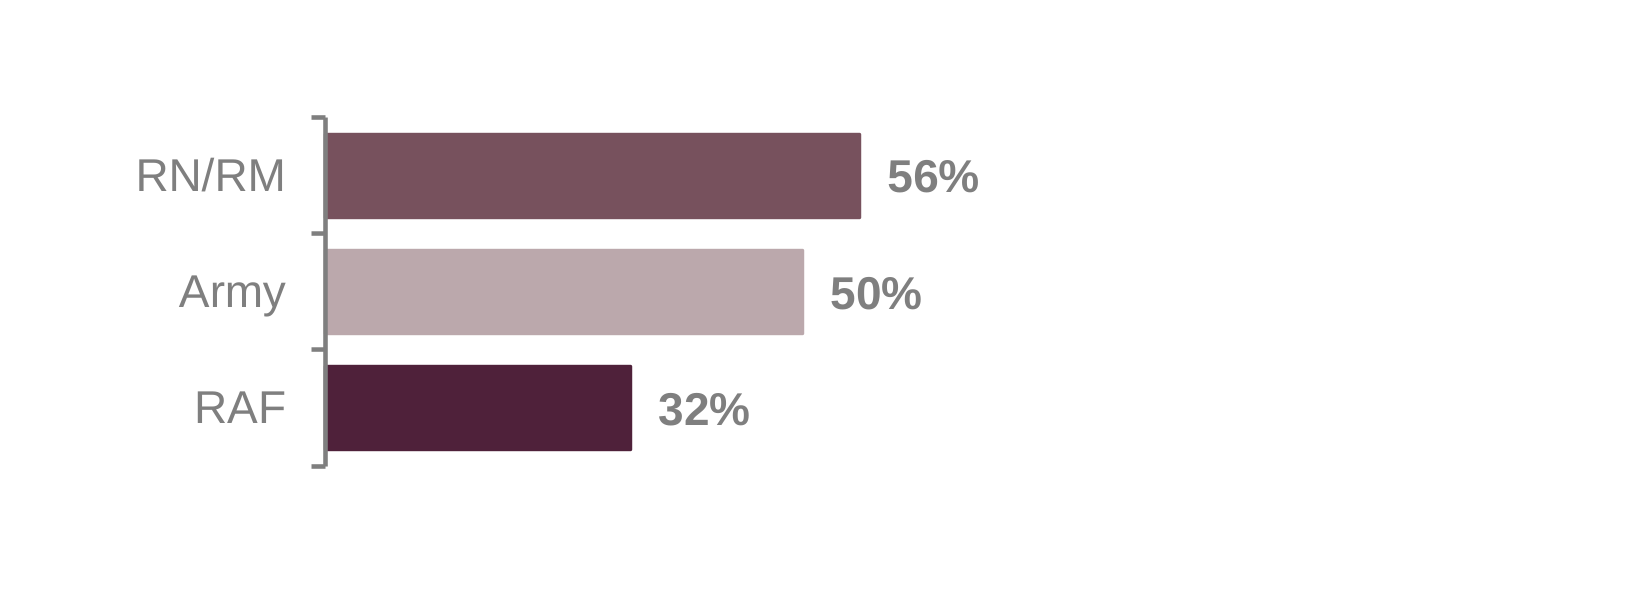
These results are based on those spouses whose partner has been on an operational deployment within the past two years.
Figure 7.4 is a bar chart that shows 32% of RAF spouses used direct contact and support from the Chain of Command after their partners’ operational tour. This is lower than levels of use by RN/RM (56%) and Army spouses (50%).
Compared to the other Services, RAF spouses are also less likely to use welfare support, and facilities and events to meet other spouses and families after their partners’ operational tour.
RAF spouses are also less likely than RN/RM or Army spouses to use:
- Welfare support before their partners’ operational tour
- Support from the Chain of Command during their partners’ operational tour
- Facilities and events to meet other spouses and families before their partners’ operational tour
Satisfaction with Service-provided support before, during and after operational deployment
Spouses report higher levels of dissatisfaction than satisfaction with support from the Chain of Command, and facilities and events to meet other spouses and families.
Figure 7.5: Spouses satisfied or dissatisfied with the support they used during their partners’ operational deployment
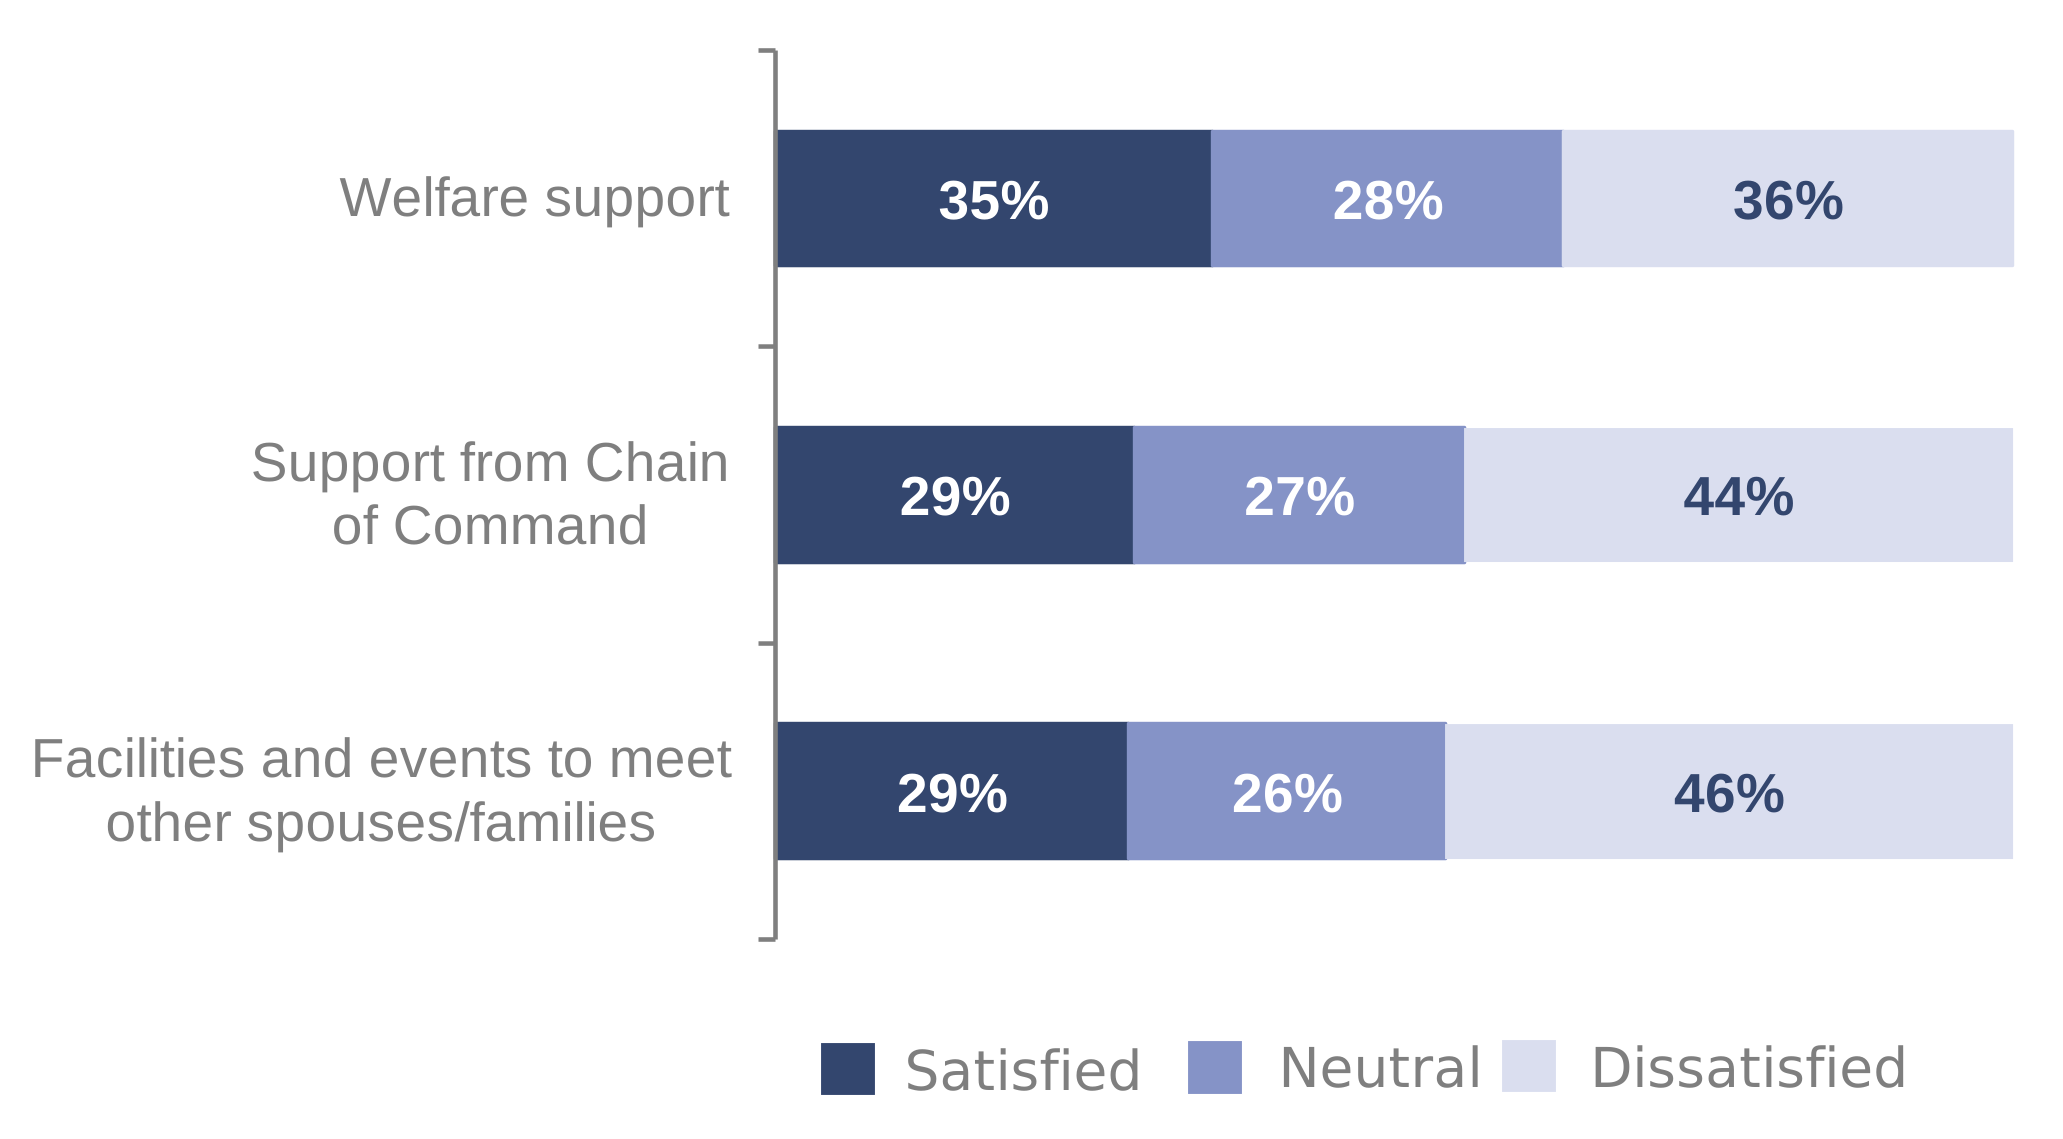
These results are based on those spouses whose partner has been on an operational deployment within the past two years and who made use of the relevant support service.
Figure 7.5 contains three stacked bar charts that show the proportion of spouses satisfied, neutral or dissatisfied with each type of support they used during their partners’ operational deployment.
Less than three in ten spouses are satisfied with support from the Chain of Command (29%) whilst over four in ten (44%) are dissatisfied. Similar results are reported for facilities and events to meet other spouses and families (29% satisfied and 46% dissatisfied).
Over a third (35%) are satisfied with welfare support with a similar proportion (36%) feeling dissatisfied.
Spouses report higher levels of satisfaction with lines of communication with their partner during their last operational deployment (61%).
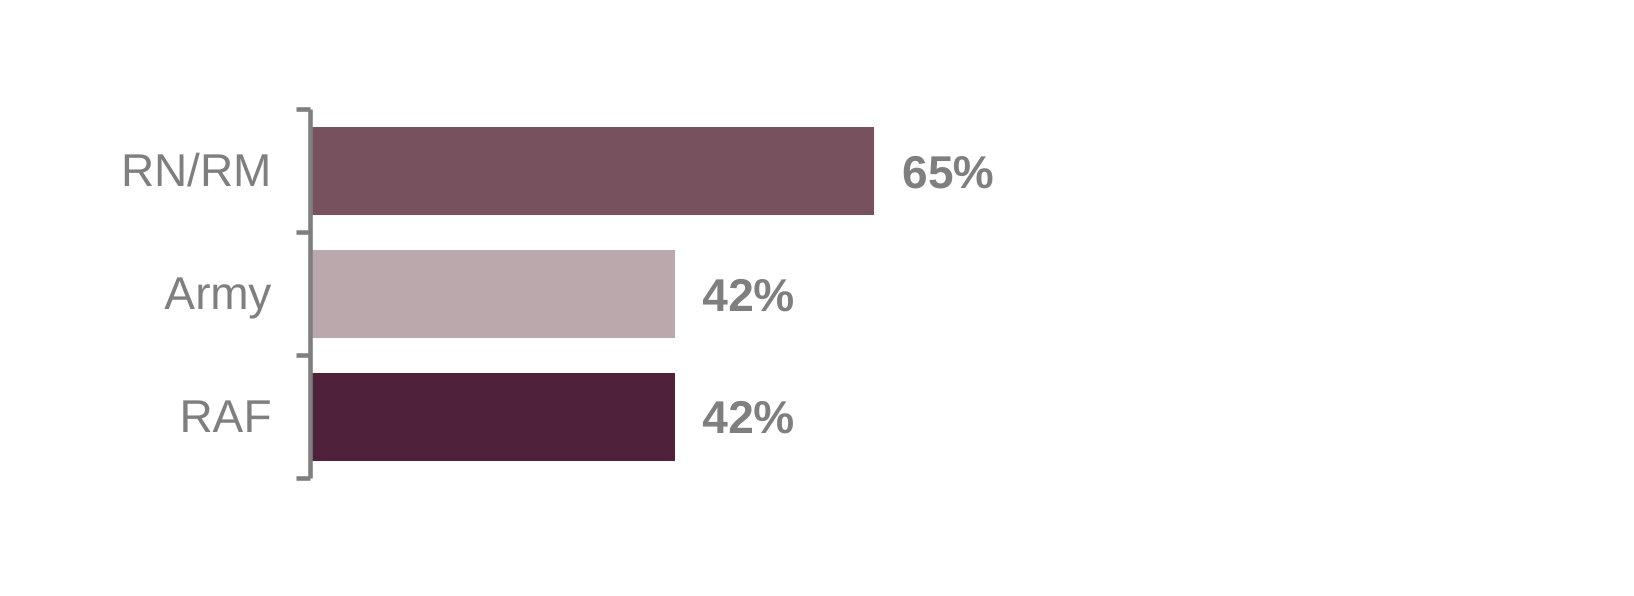
Figure 7.6: Dissatisfaction with facilities and events to meet with other spouses and families before their partners’ operational deployment by Service
These results are based on those spouses whose partner has been on an operational deployment within the past two years and who used facilities and events to meet with spouses and families before their partners’ operational deployment.
Figure 7.6 is a bar chart that shows 65% of RN/RM spouses are dissatisfied with the facilities and events to meet other spouses and families before their partners’ last operational deployment. This compares to 42% for both Army and RAF spouses.
RN/RM spouses are more dissatisfied with all types of support before, during and after their partners’ last operational deployment.
8. Employment
This section provides information on:
- Employment rates
- Job satisfaction and underemployment
- Seeking employment
- Access to Further Education
- Employment amongst those who accompanied overseas
The term “employed” refers to those in full-time, part-time and self-employment.
Spousal employment rates
In 2026, just over four in five Service spouses are employed (81%). This is above the UK employment rate.
National results for context
In 2026 the UK employment rate for 16- to 64-year-olds is 75%.
Figure 8.1: Service spousal employment rates compared to UK employment rates between 2014 and 2026
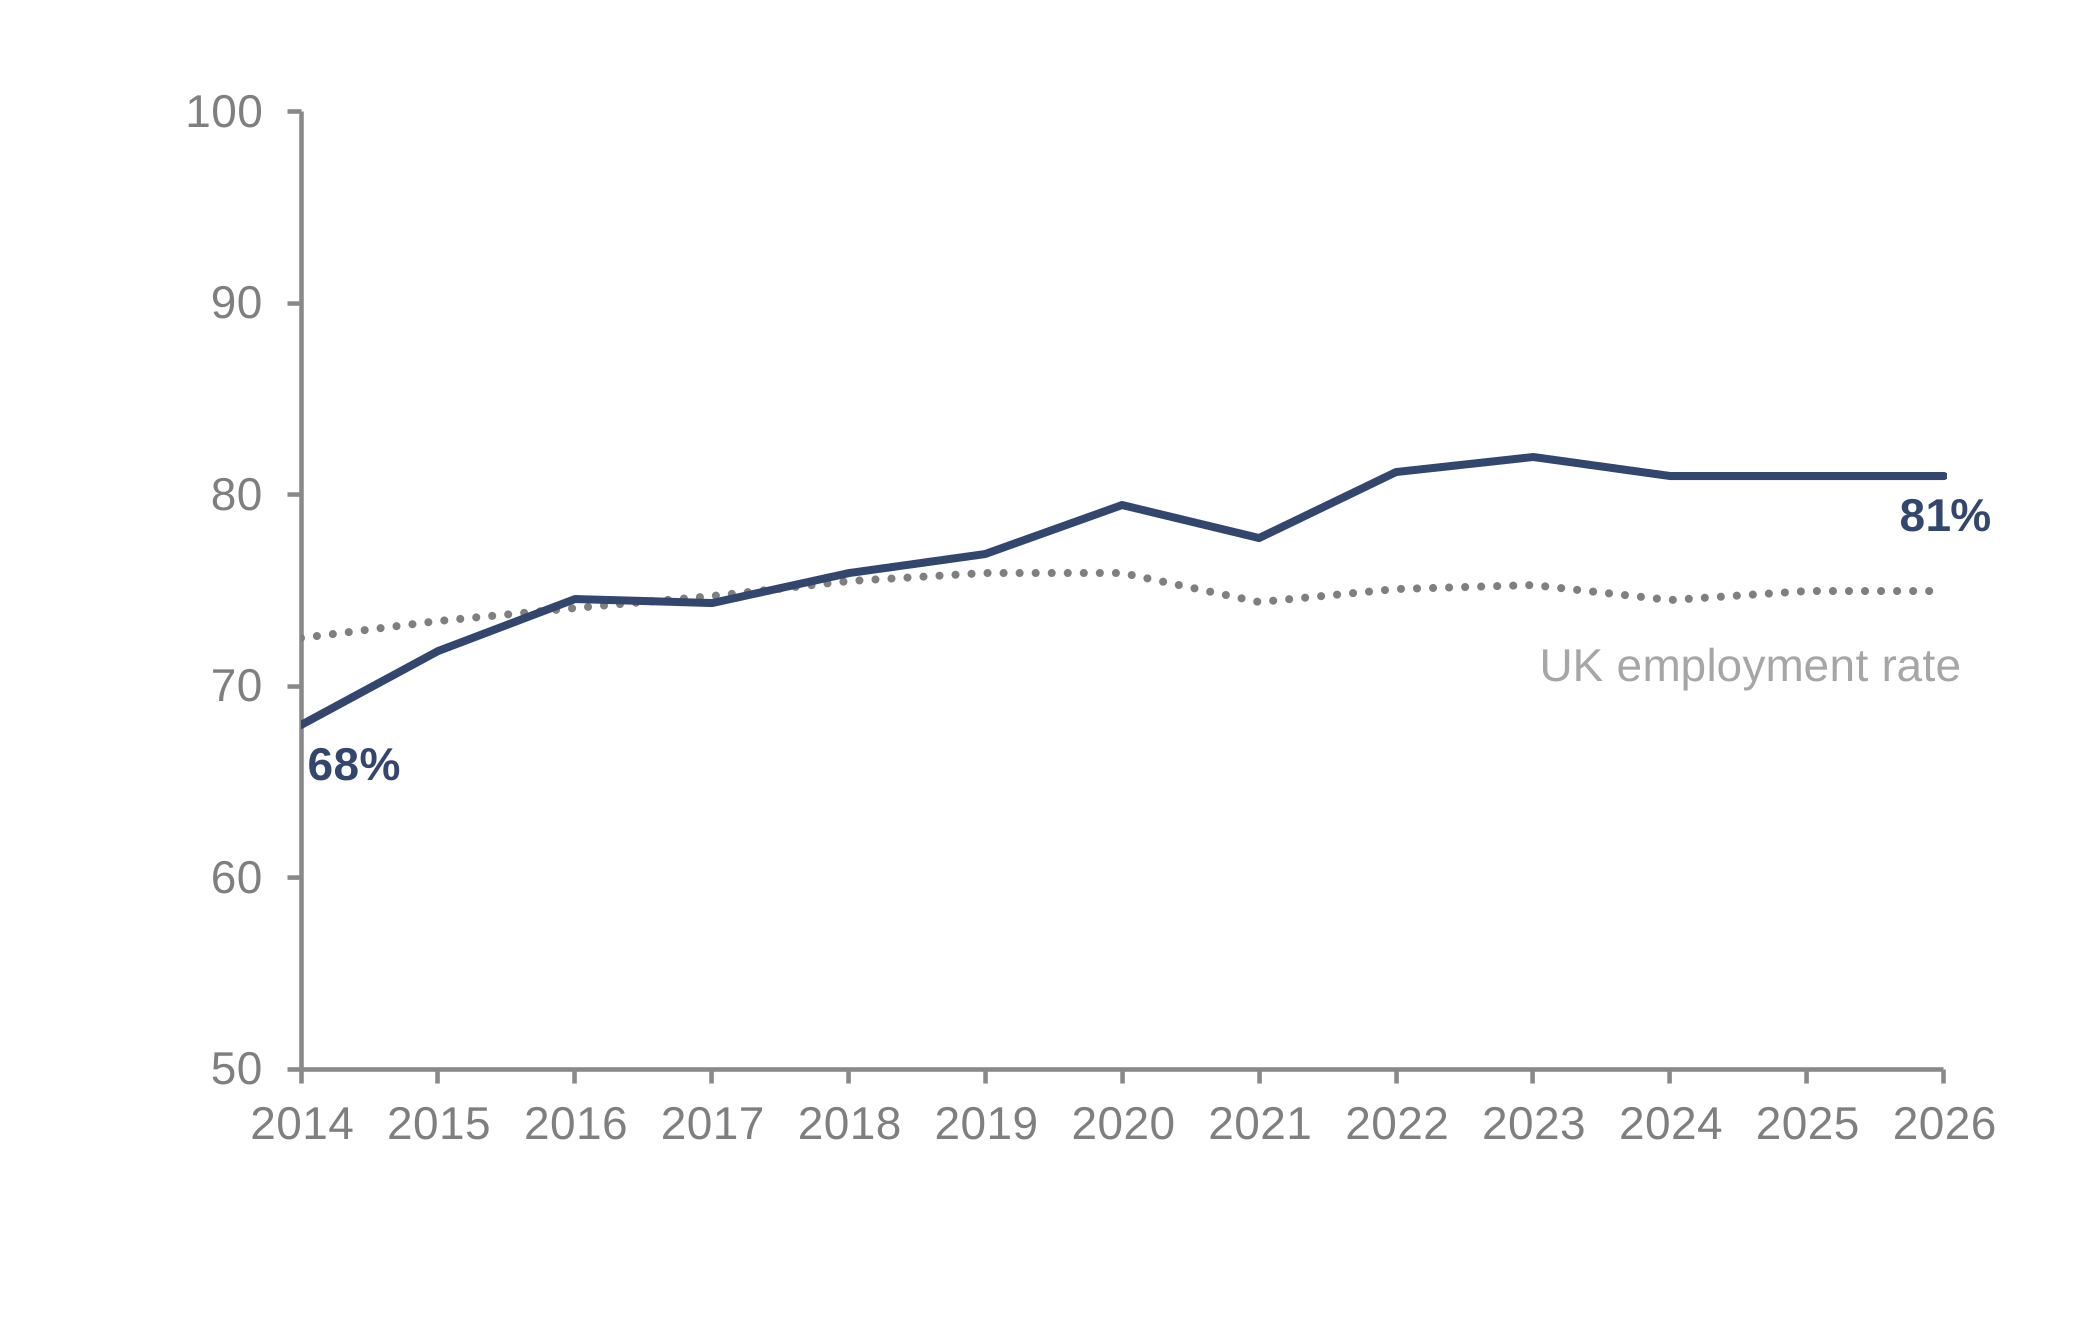
Figure 8.1 is a line graph comparing the employment rates of Service spouses and the UK national employment rates between 2014 and 2026.
The Service spousal employment rate has increased from 68% in 2014 to 81% in 2026, although it is unchanged since 2022.
Compared to spousal employment, the UK employment rate has been more stable over the period 2014 to 2025, ranging from 73% in 2014 to 75% in 2026.
Compared to 2023, the proportion of spouses in full-time employment has increased whilst those in part-time employment has decreased. In 2026, of all Service spouses:
- 57% are in full-time employment, increased from 51% in 2023
- 20% are in part-time employment, decreased from 25% in 2023
- 6% are self-employed, unchanged since 2018.
Differences in employment rates
Less than half (47%) of spouses living overseas are employed, this is much lower than the rates for those living in UK countries, which range from 79% to 89%.
Army spouses are less likely to be employed driven by differences amongst Other Rank spouses, 77% of Army Other Rank spouses are employed compared to 84% of RN/RM and 86% of RAF Other Rank spouses.
Service spousal employment rates differ by gender, with women being less likely to be in employment (80%) than men (95%).
Even after excluding any dual Serving spouses, this difference by gender remains.
National results for context
In 2026 the UK male employment rate was 78% compared to 72% for females.
Differences in types of employment
Of those spouses in employment, the type of employment differs by gender, with women being more likely to work part-time and less likely to work full-time than men.
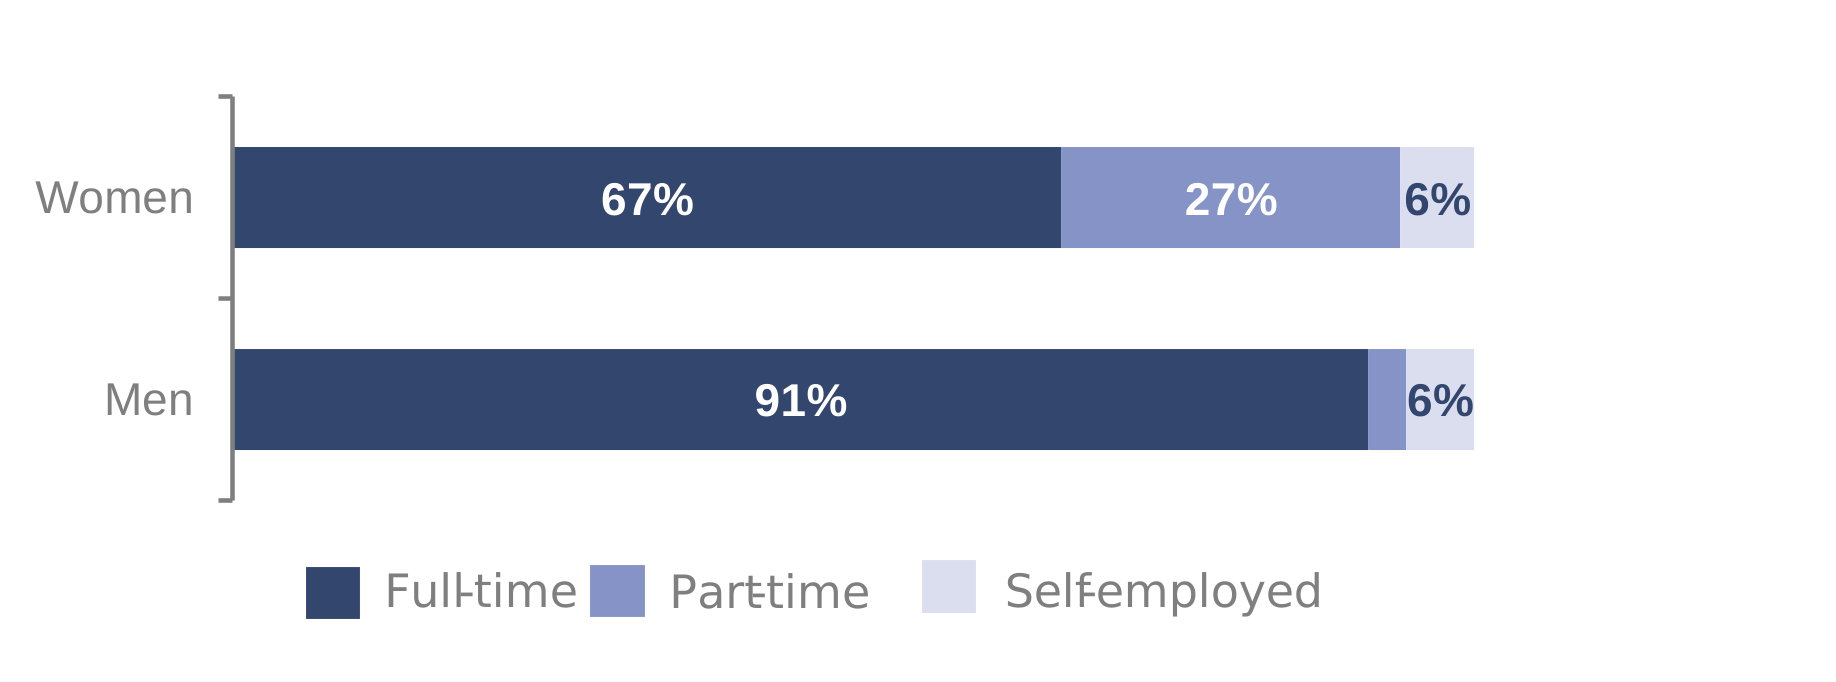
Figure 8.2: Type of employment by gender
These results are based on those spouses in employment.
Figure 8.2 shows two stacked bar charts comparing the proportions of spousal employment types by gender. The charts show that, of those in employment, 91% of men work full-time compared to 67% of women.
Over a quarter of women work part-time (27%) compared to 3% of men.
Even after excluding any dual Serving spouses, women are still less likely to work full-time and more likely to work part-time than men.
National results for context
Data from the ONS Labour Force Survey (LFS) also show a gender difference in the type of employment. Of those aged 16-64 in employment, approximately three in ten females work part-time. This compares to around one in ten for males.
Job satisfaction and underemployment
Of those who are employed, three quarters are satisfied that their job matches their skills and experience.
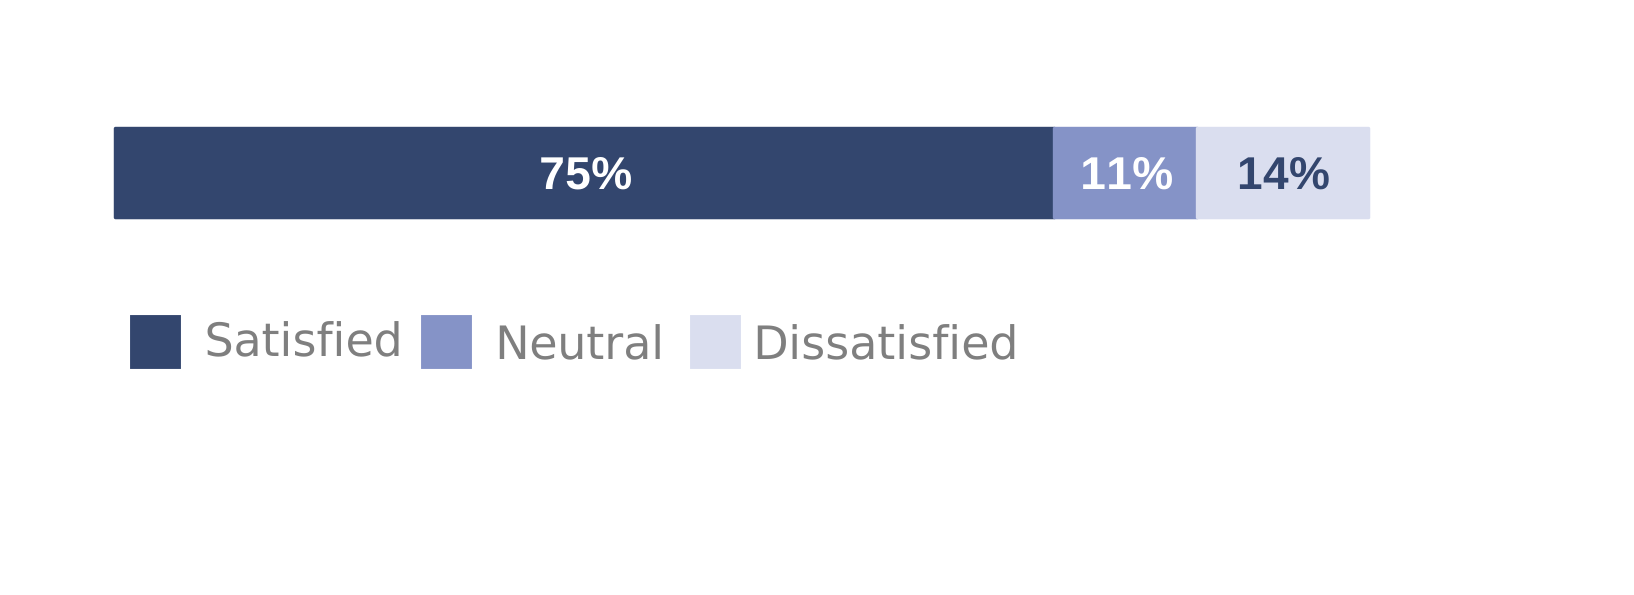
Figure 8.3: Spouses satisfied or dissatisfied with the match between their job and their skills and experience
These results are based on those spouses in employment.
Figure 8.3 is a stacked bar chart that shows, of those in employment, 75% of spouses are satisfied that their job matches their skills and experience whilst 14% are dissatisfied.
Spouses in employment report similar levels of satisfaction with their job overall, and the match between their qualifications and their job.
National results for context
Although not directly comparable, the 2024 Skills and Employment Survey (SES) provides some context on skills and qualification mismatch in the wider population.
The SES reports 9% of workers feel they do not have the opportunity to use their knowledge and skills in their job. Although still based on a subjective measure, differences in question wording and data collection limit direct comparison.
The SES also reports that 35% of workers are overqualified for their role. This is based on an objective comparison between respondents’ qualifications and job requirements, a different concept to the self-reported satisfaction with the match used in FamCAS.
Officer spouses are more satisfied with the match between their qualifications and their job (77%) than Other Rank spouses (71%). A similar difference is reported for the match between their job and their skills and experience.
Spouses in part-time employment feel less satisfied with the match between their qualifications and their job than those in full-time employment.
Figure 8.4: Spouses satisfied or dissatisfied with the match between their qualifications and their job by employment type
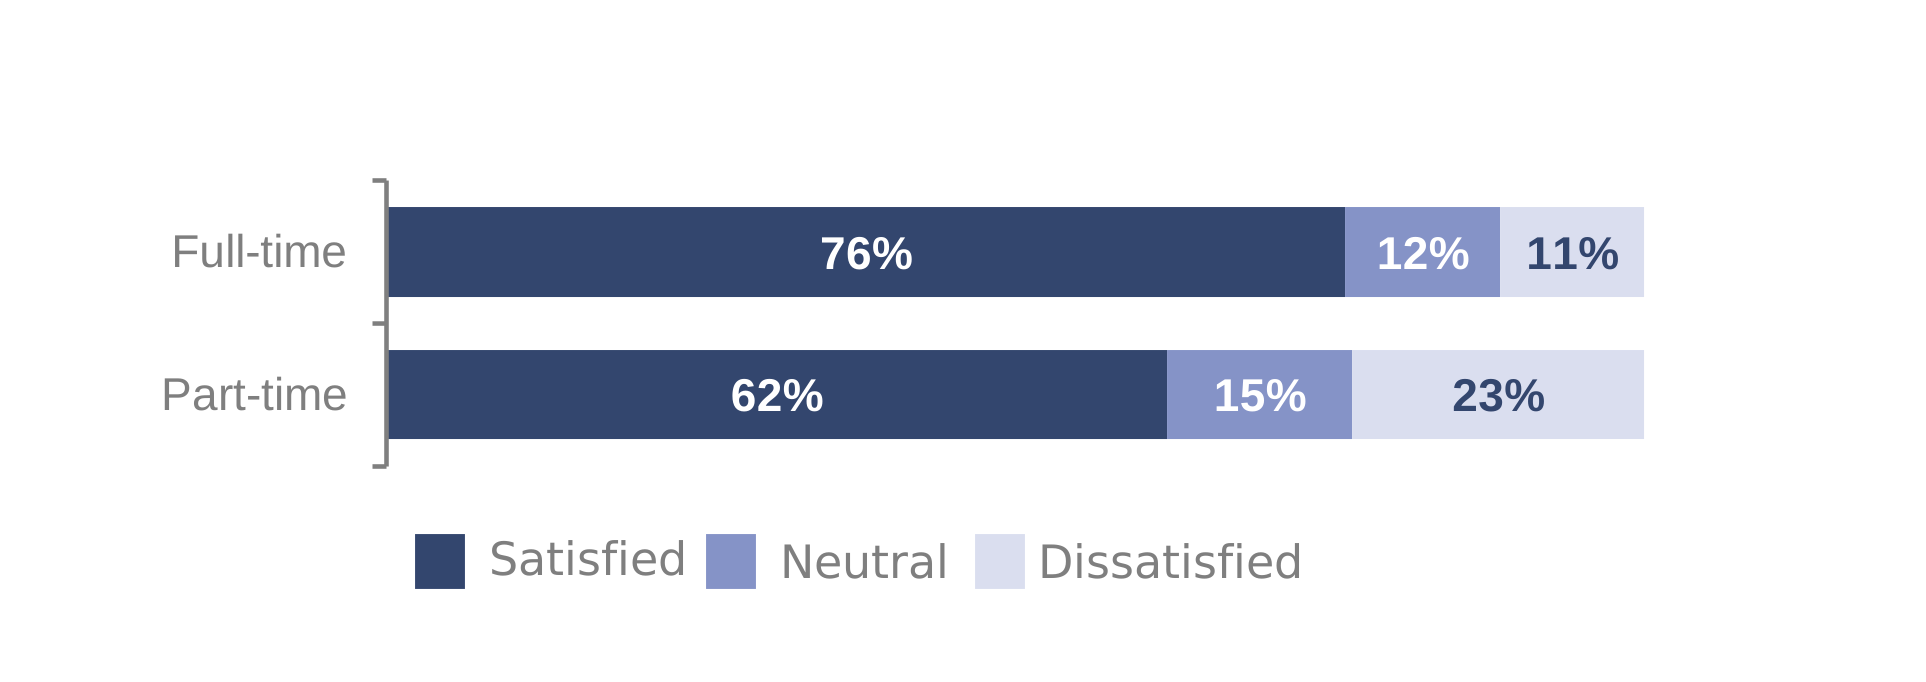
Figure 8.4 shows two stacked bar charts comparing the proportion of spouses satisfied that their qualifications match their job by employment type. The charts show that those in part-time employment are less satisfied (62%) than those in full-time employment (76%).
Those in part-time employment are also more dissatisfied with the match between their qualifications and their job (23%) than those in full-time employment (11%).
There is a similar pattern for the match between job and skills and experience. Overall, those in part-time employment are less satisfied with the match between their job and their skills or qualifications.
Underemployment
There is no universally agreed definition of underemployment. The ONS Labour Force Survey (LFS) uses a definition based on wanting to work more hours, whilst other social surveys and research look at the mismatch between jobs and qualifications, skills, and experience.
FamCAS definition of underemployment:
- Those dissatisfied with the match between their qualifications and their job
and/or
- Those dissatisfied with the match between their job and their skills or experience
Service spouses who feel satisfied or neutral with both are defined as “not underemployed”.
Based on the definition above, 17% of those in employment feel underemployed.
This differs by location, amongst those in employment, a higher proportion of spouses living in Scotland or Non-UK feel underemployed (28% and 31% respectively) compared to spouses living in England (15%).
Those in part-time employment are more likely to feel underemployed (27%) compared to those in full-time employment (14%).
Seeking employment
Over the past year, over a third of spouses (36%) have looked for a job.
Other Rank spouses are more likely to have looked for a job over the past year (37%) than Officer spouses (32%).
Difficulties finding suitable employment
Of those spouses who looked for a job over the past year, 73% experienced difficulties finding suitable employment. Although unchanged since last year, this is above all levels reported between 2017 and 2024 (ranging from 59% to 68%).
Amongst those who looked for a job over the past year, Army Other Rank spouses were more likely to experience difficulties finding suitable employment (80%) compared to RN/RM or RAF Other Rank spouses (63% and 70% respectively).
Of those spouses who looked for a job over the past year, 88% of those living overseas experienced difficulties finding employment compared to 71% of those living in England.
Overall, of all spouses, just over a quarter (26%) looked for a job and experienced difficulties finding suitable employment over the past year.
Of those spouses who experienced difficulties finding suitable employment over the past year, the top difficulties are:
- The location where I live (43%)
- Having a spouse who is often away (41%)
- Partner unable to assist with care responsibilities (39%)
- Extended family live too far away to assist with childcare (35%)
Location is less of an issue for RN/RM spouses, cited by 27% of those who experienced difficulties finding employment, compared to 47% of Army and 41% of RAF spouses.
Amongst those who experienced difficulties finding employment, 31% of RAF spouses cited the difficulty of “having a spouse who is often away”, compared to 48% of RN/RM and 43% of Army spouses.
The proportion of spouses selecting “access to affordable and quality childcare” decreased from 39% in 2023 and 30% in 2024 to 23% this year. This is now lower than all results prior to 2024.
This may reflect the uptake of the MOD’s Wraparound Childcare scheme (WAC).
Access to Further Education
Three in ten families (30%) wanted to access Further or Higher Education. Of these, 27% were unable to access Further or Higher Education, whilst 22% did so but with difficulties. Over half (52%) were able to access Further or Higher Education without difficulty.
Of those who wanted to access Further or Higher Education, Officer families were more able to access courses without difficulties (63%) than Other Rank families (48%).
Accompanying overseas
Over one in ten spouses (11%) accompanied their Serving partner on an overseas assignment over the past year. This is largely unchanged since 2015, except for a decrease to 9% in 2021 most likely due, in part, to COVID-19 restrictions.
RN/RM spouses are less likely to accompany overseas (6%) than Army or RAF spouses (both 12%).
Of the 9% of spouses living overseas, the majority (85%) are accompanying their Service partner.
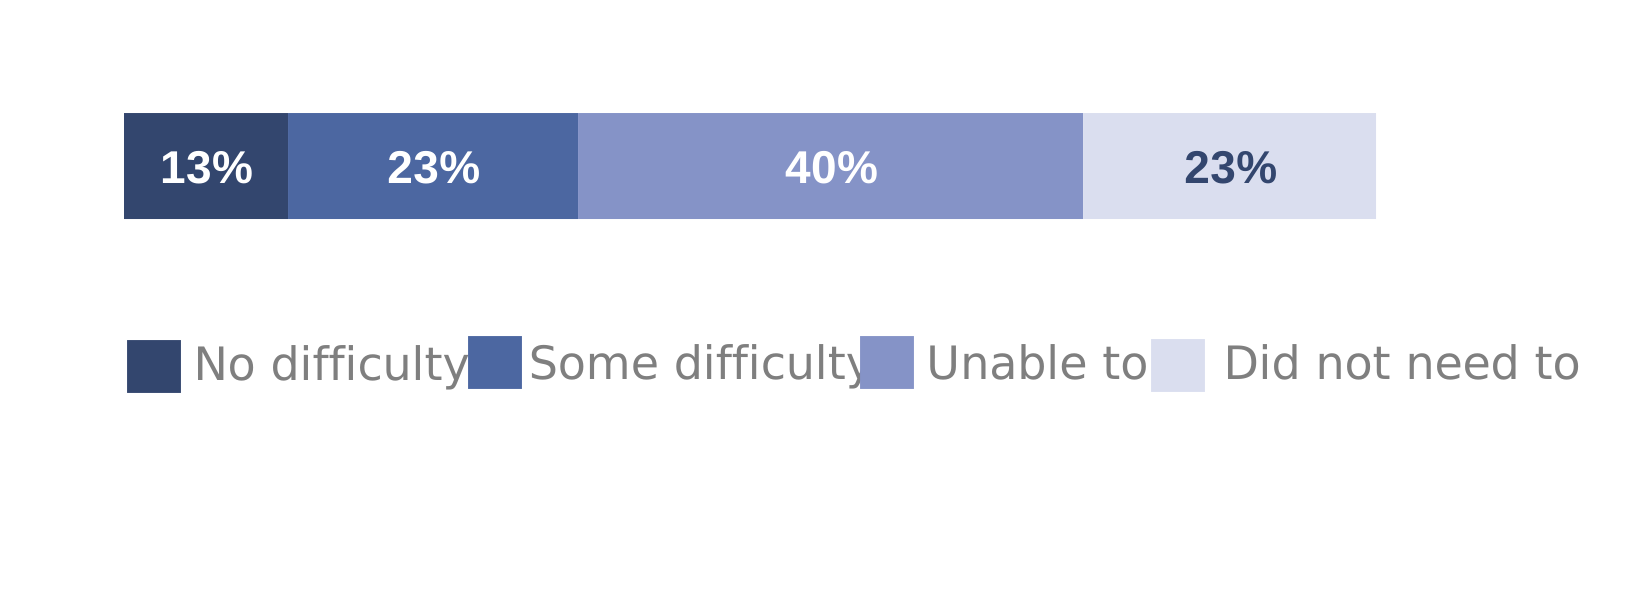
Figure 8.5: Ability of those who accompanied overseas to find paid employment
These results are based on those spouses who accompanied their Serving partner overseas in the past year.
Figure 8.5 is a stacked bar chart showing, of those spouses who accompanied overseas, 40% were unable to find paid employment overseas. Just under a quarter (23%) found employment with some difficulty and 13% did so without any difficulty. The remaining 23% did not need to find employment.
These results are unchanged since 2020. However, the proportion of spouses unable to find paid employment overseas is above all levels reported prior to 2020.
Over a fifth of spouses who accompanied overseas were unable to access Service provided information before moving overseas (21%). A third (33%) could access information with difficulty, whilst the same proportion (33%) did so without any difficulty.
9. Healthcare
This section examines access to healthcare for Service families, including:
- Healthcare needs
- Ability to access healthcare
- Continuing treatment after moving home
The FamCAS aims to measure healthcare provision for family members not in the Armed Forces. This means, dual Serving families without children are not included in this section.
Healthcare needs
Figure 9.1: Families requiring access to healthcare over the past year by type
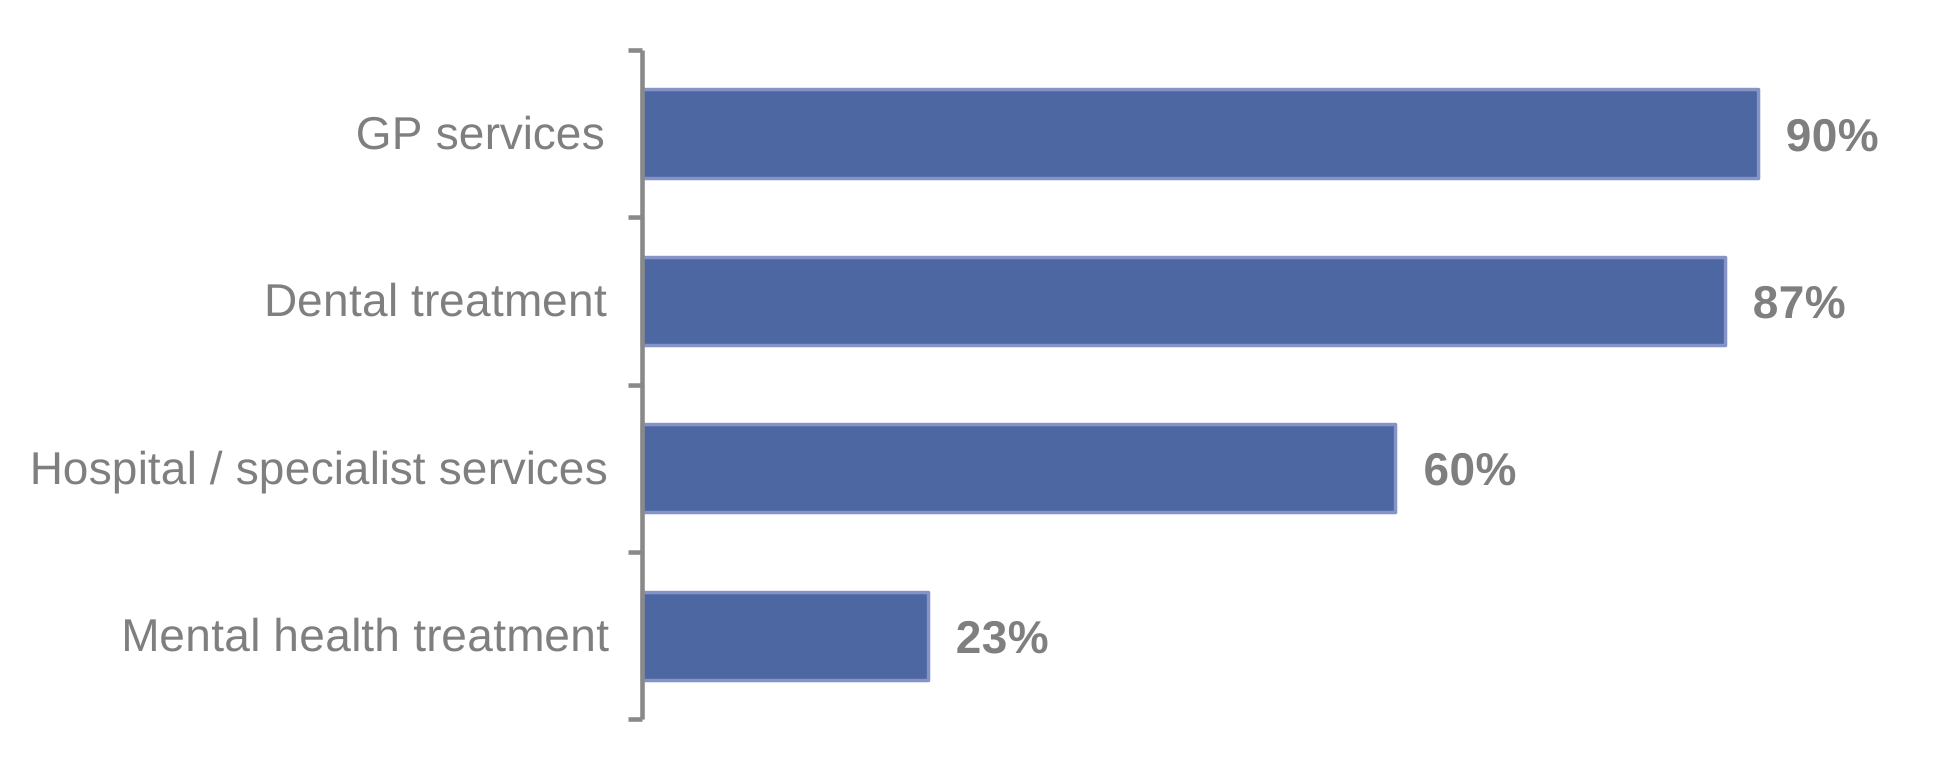
Figure 9.1 is a bar chart that shows most Service families required GP Services and dental treatment over the past year (90% and 87% respectively). Six in ten families (60%) needed hospital/specialist services whilst 23% required mental health treatment.
GP services include nurses and midwives whilst hospital/specialist services include orthodontists.
Figure 9.2: Families requiring access to mental health treatment from 2015 to 2026
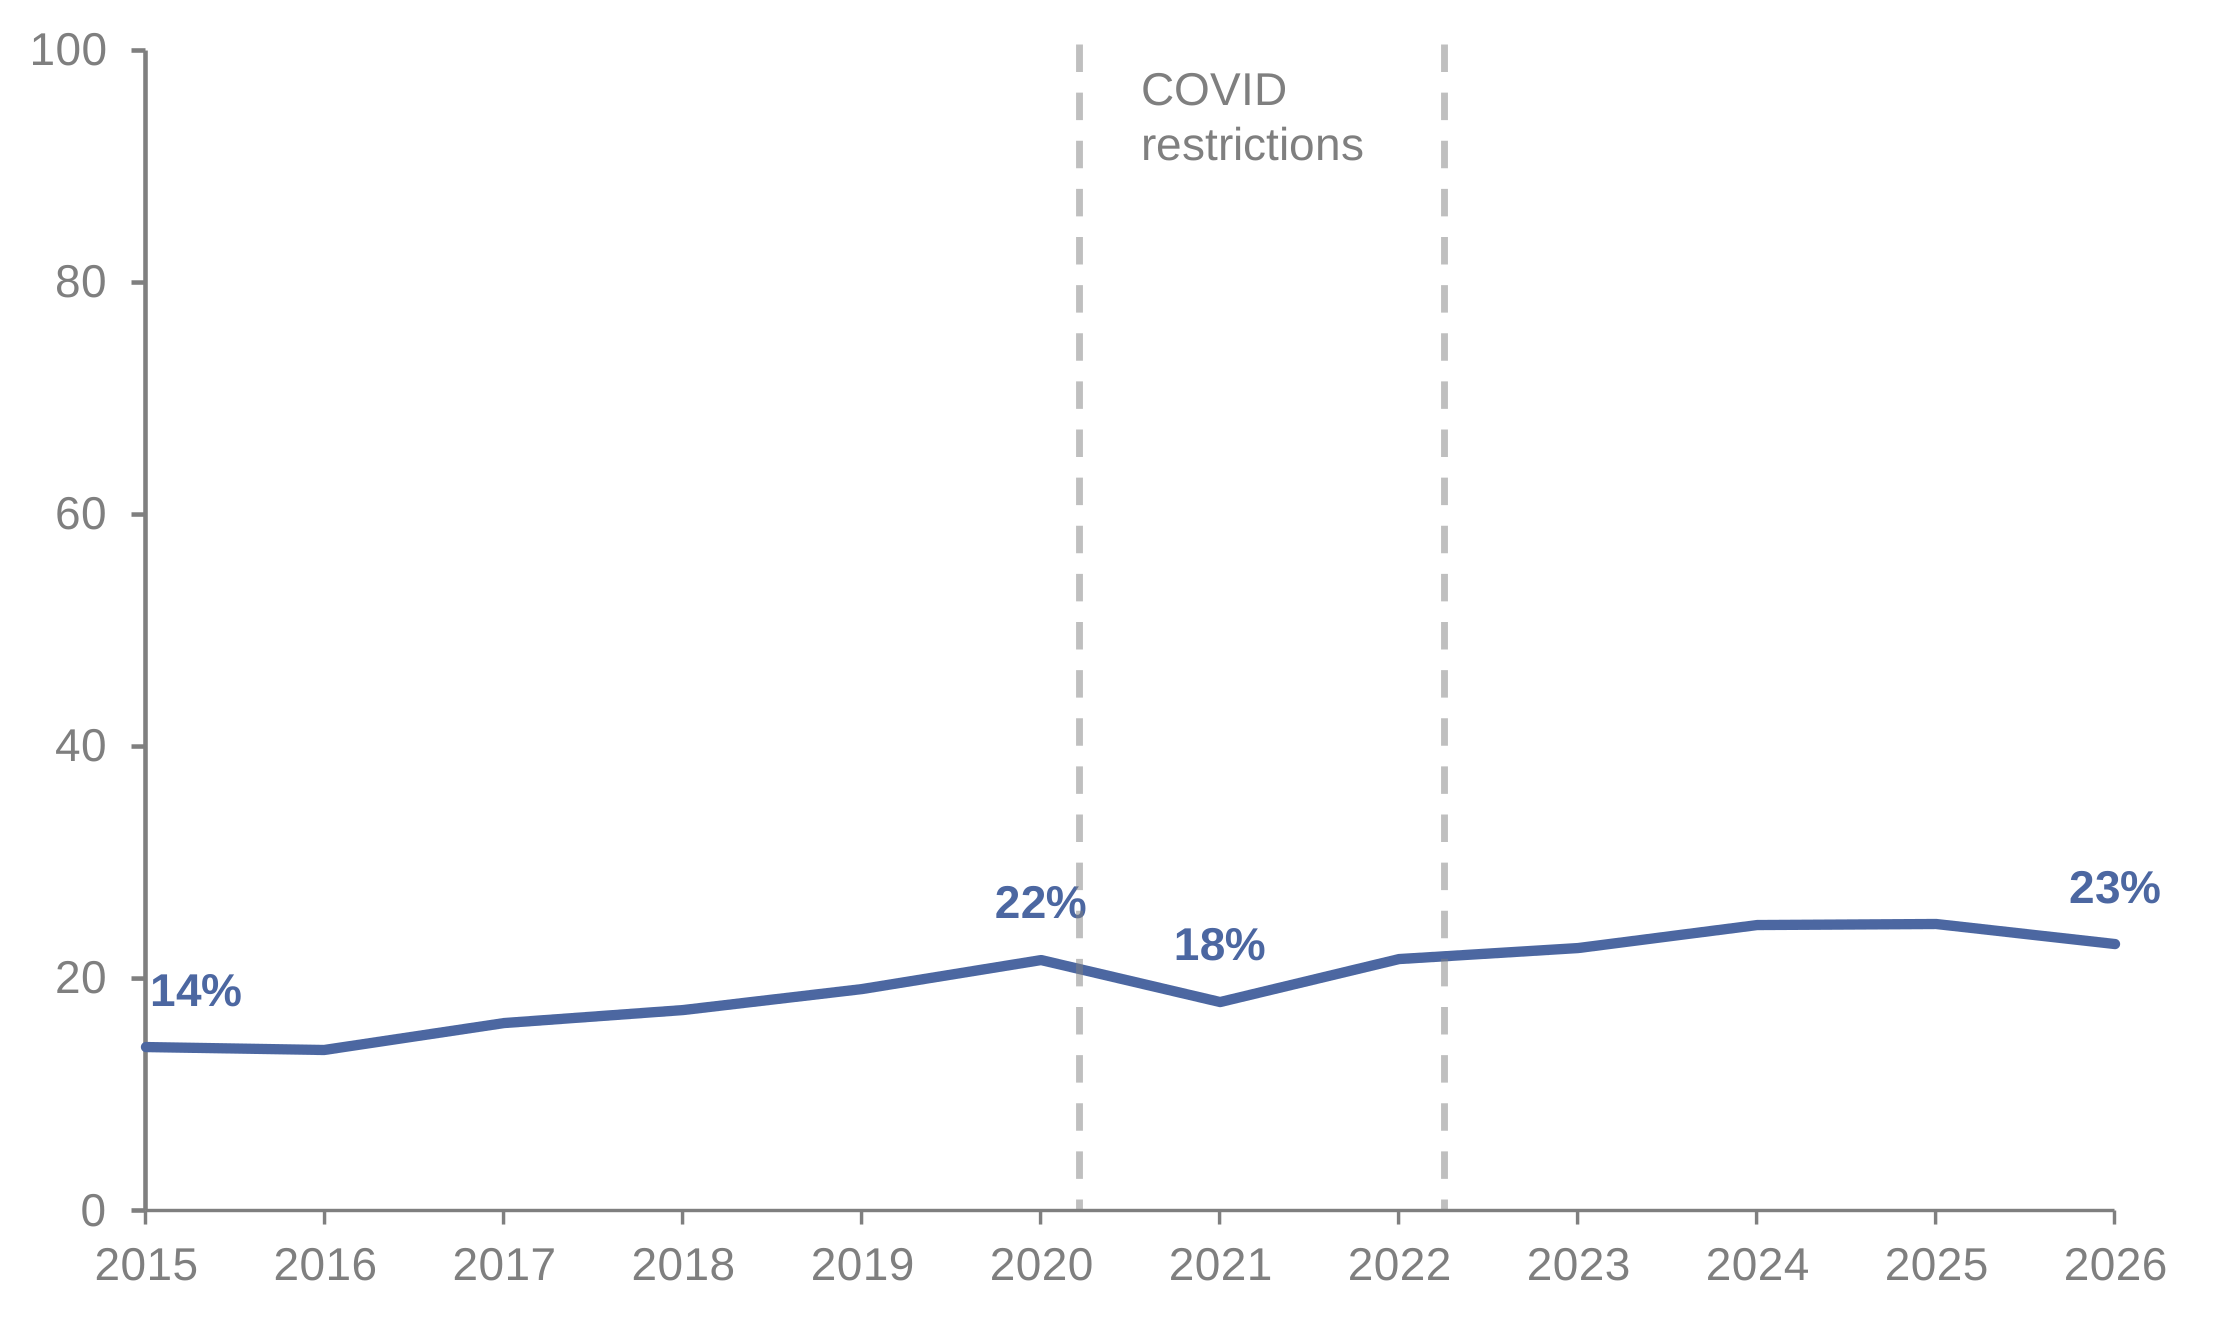
Figure 9.2 is a line graph that shows the proportion of families requiring mental health treatment increased from 14% in 2015 to 22% in 2020. Requirement for mental health treatment remains at a similar level (23%) in 2026.
National results for context
A report on the “Mental health pressures in England” by the British Medical Association refers to an increase in rates of probable mental health disorder between 2017 and 2023 amongst children and young people. The report also refers to an increase in the number of people in contact with mental health services between 2016 and 2025 amongst both adults and children/young people.
The need for mental health treatment decreased from 22% in 2020 to 18% in 2021, before returning to current levels. The requirement for all types of healthcare decreased between 2020 and 2021, likely due to the COVID-19 restrictions.
Families’ ability to access healthcare
Figure 9.3: Families’ ability to access healthcare by type
These results are based on those families who required access to each type of healthcare.
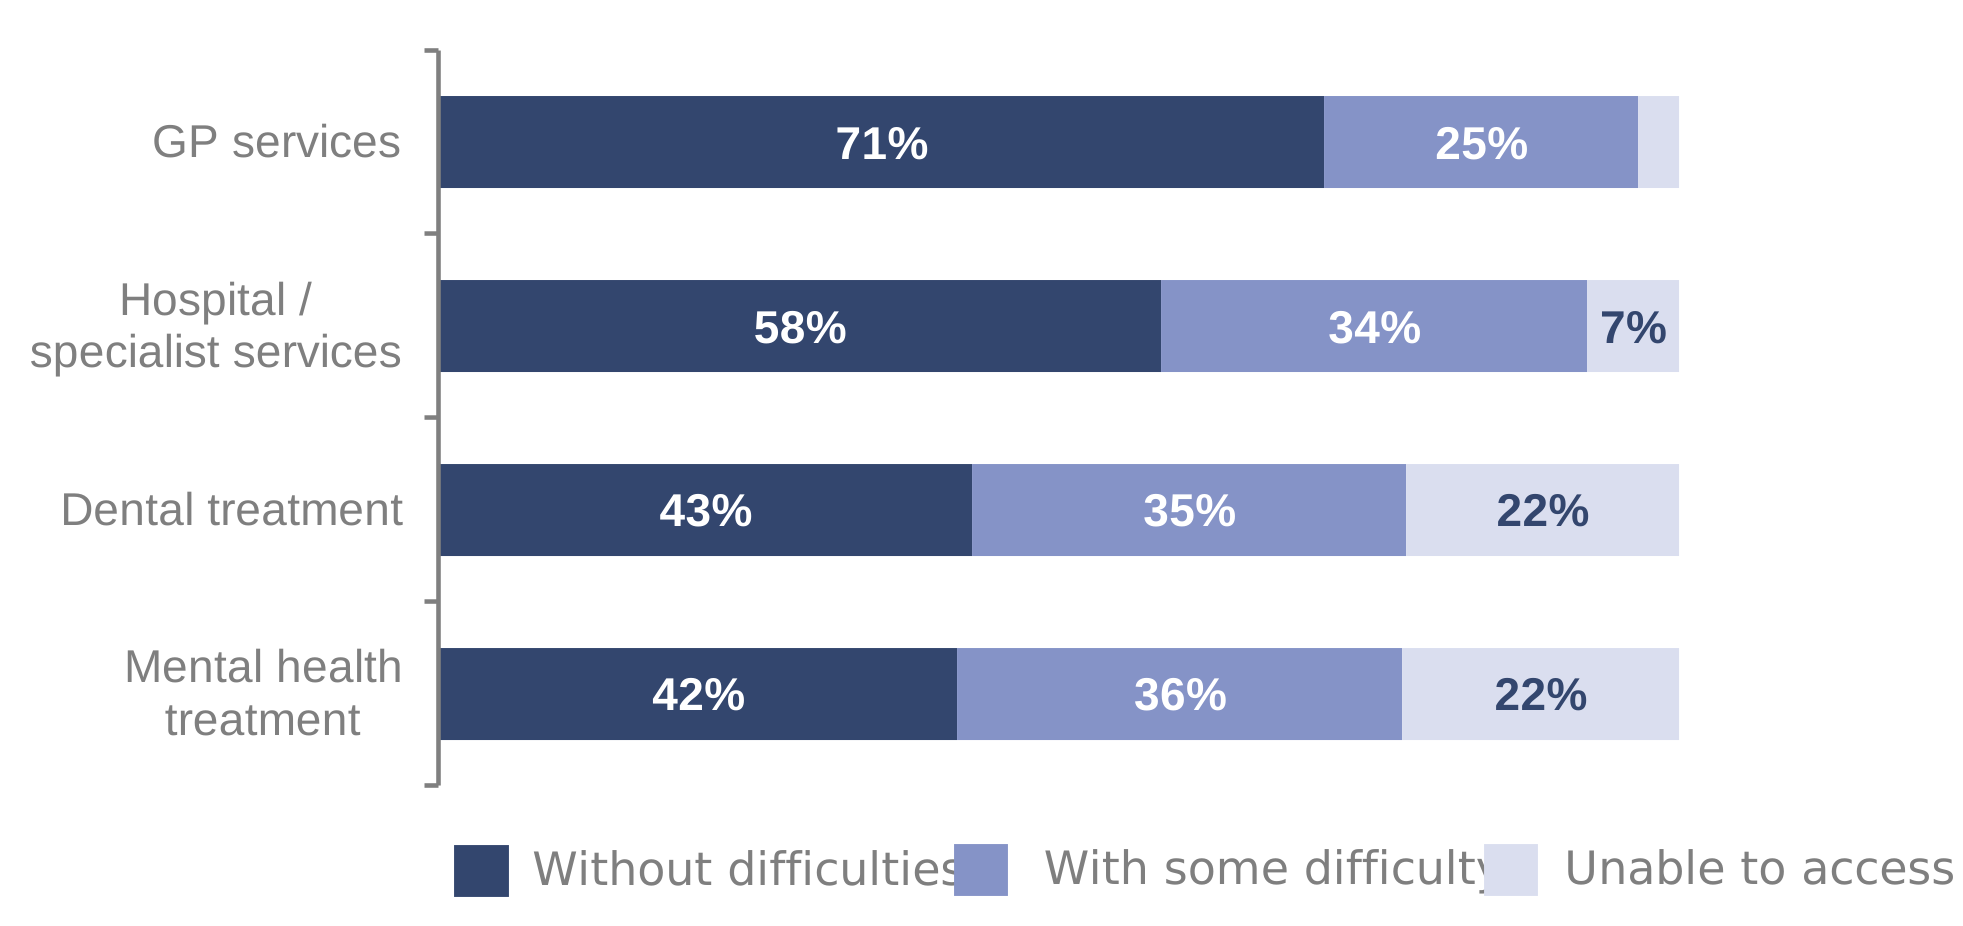
Figure 9.3 contains four stacked bar charts showing families’ ability to access each type of healthcare service. These charts show families are more able to access GP Services without difficulties than other types of healthcare.
Just over seven in ten families were able to access GP services without difficulties (71%) compared to nearly six in ten who were able to access hospital services without difficulties (58%). Families were less able to access dental treatment (43%) and mental health treatment (42%) without difficulties than GP or hospital services.
Over a fifth of families (22%) are unable to access mental health treatment and the same proportion are unable to access dental treatment. These compare to 3% for GP and 7% for hospital services.
Families’ ability to access all types of healthcare services without difficulty decreased between 2020 and 2023, despite some improvements, access has not recovered.
Figure 9.4: Families able to access healthcare without difficulties, by type, between 2015 and 2026
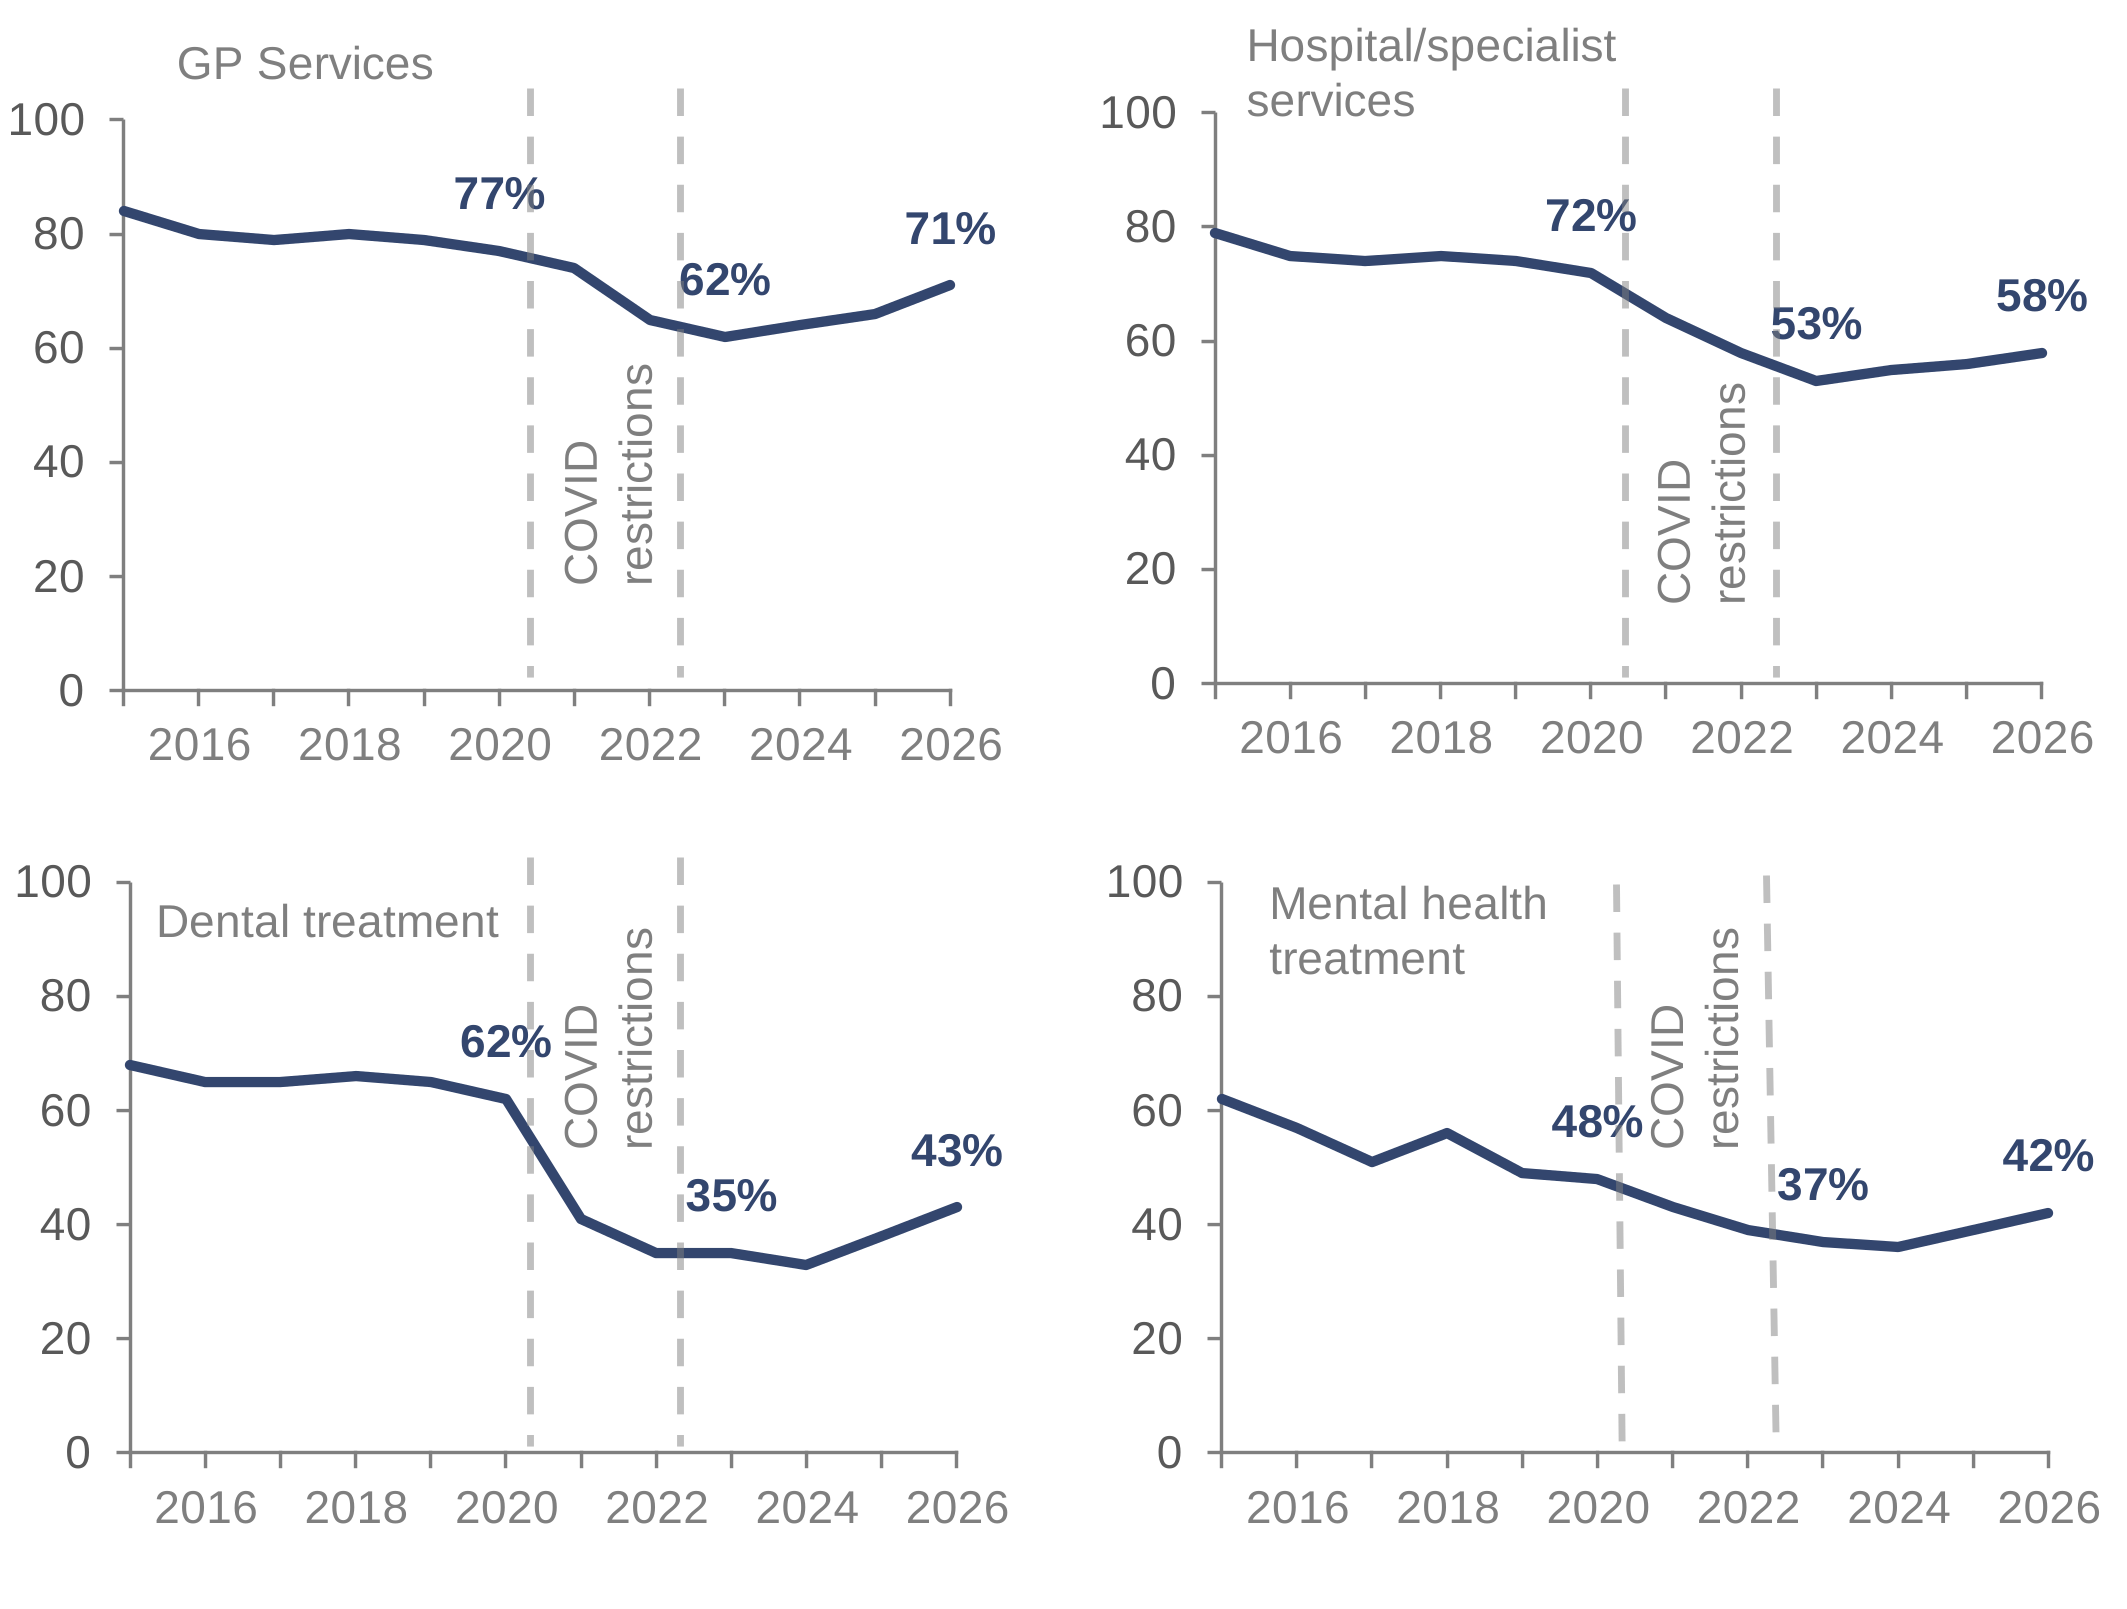
These results are based on those families who required access to each type of healthcare.
Figure 9.4 contains four line graphs showing the proportion of families able to access each healthcare type without difficulty between 2015 and 2026. Each graph shows a decrease in ability to access the healthcare service without difficulty between 2020 and 2023.
This is particularly evident for dental treatment. Between 2015 and 2020, levels of access without difficulty averaged around 65%, this decreased to 35% by 2023. In 2026, 43% of families can access dental treatment without difficulty, above reported results between 2022 and 2025, but remaining below all levels prior to 2021.
The proportion of families able to access GP services without difficulty has also improved this year, increasing from 66% in 2025 to 71% in 2026. This is now above levels reported between 2022 and 2025. However, this remains below all levels reported prior to 2022.
National results for context
Although not directly comparable, the 2025 GP Patient Survey reports some improvements compared to 2024. For example, when asked about their overall experience of the last time they contacted their GP surgery, 70% said they had a “good” experience, an improvement on the 67% reported in 2024.
The 2023 GP Patient Survey reported a decrease in the proportion of patients rating their overall experience of making a GP appointment as “good”. This fell from 68.6% in 2018 to 54.4% in 2023.
The 2025 Dental section of the GP Patient Survey reports, of those who had tried to make a dental appointment in the past two years, 78% were successful, an improvement on the 76% reported in 2024.
The 2023 Dental Statistics report stated, of those who tried to make a dental appointment in the past two years, 77% were successful, lower than pre-pandemic rates (94% in 2020).
Continuing treatment after moving home
Service families are a mobile population with 26% moving home over the past year. This section looks at the impact this has on continuing healthcare treatment.
Over the past year a small proportion of Service families moved whilst undergoing healthcare treatment:
- 3% moved whilst undergoing mental health treatment
- 7% moved whilst undergoing dental treatment
- 7% moved whilst undergoing treatment with hospital/specialist services
- 10% moved whilst undergoing treatment with a GP
Although small proportions of families move whilst undergoing healthcare treatments, of those who do, many experience difficulties or are unable to continue treatment.
Figure 9.5: Families by ability to continue healthcare treatment after moving home
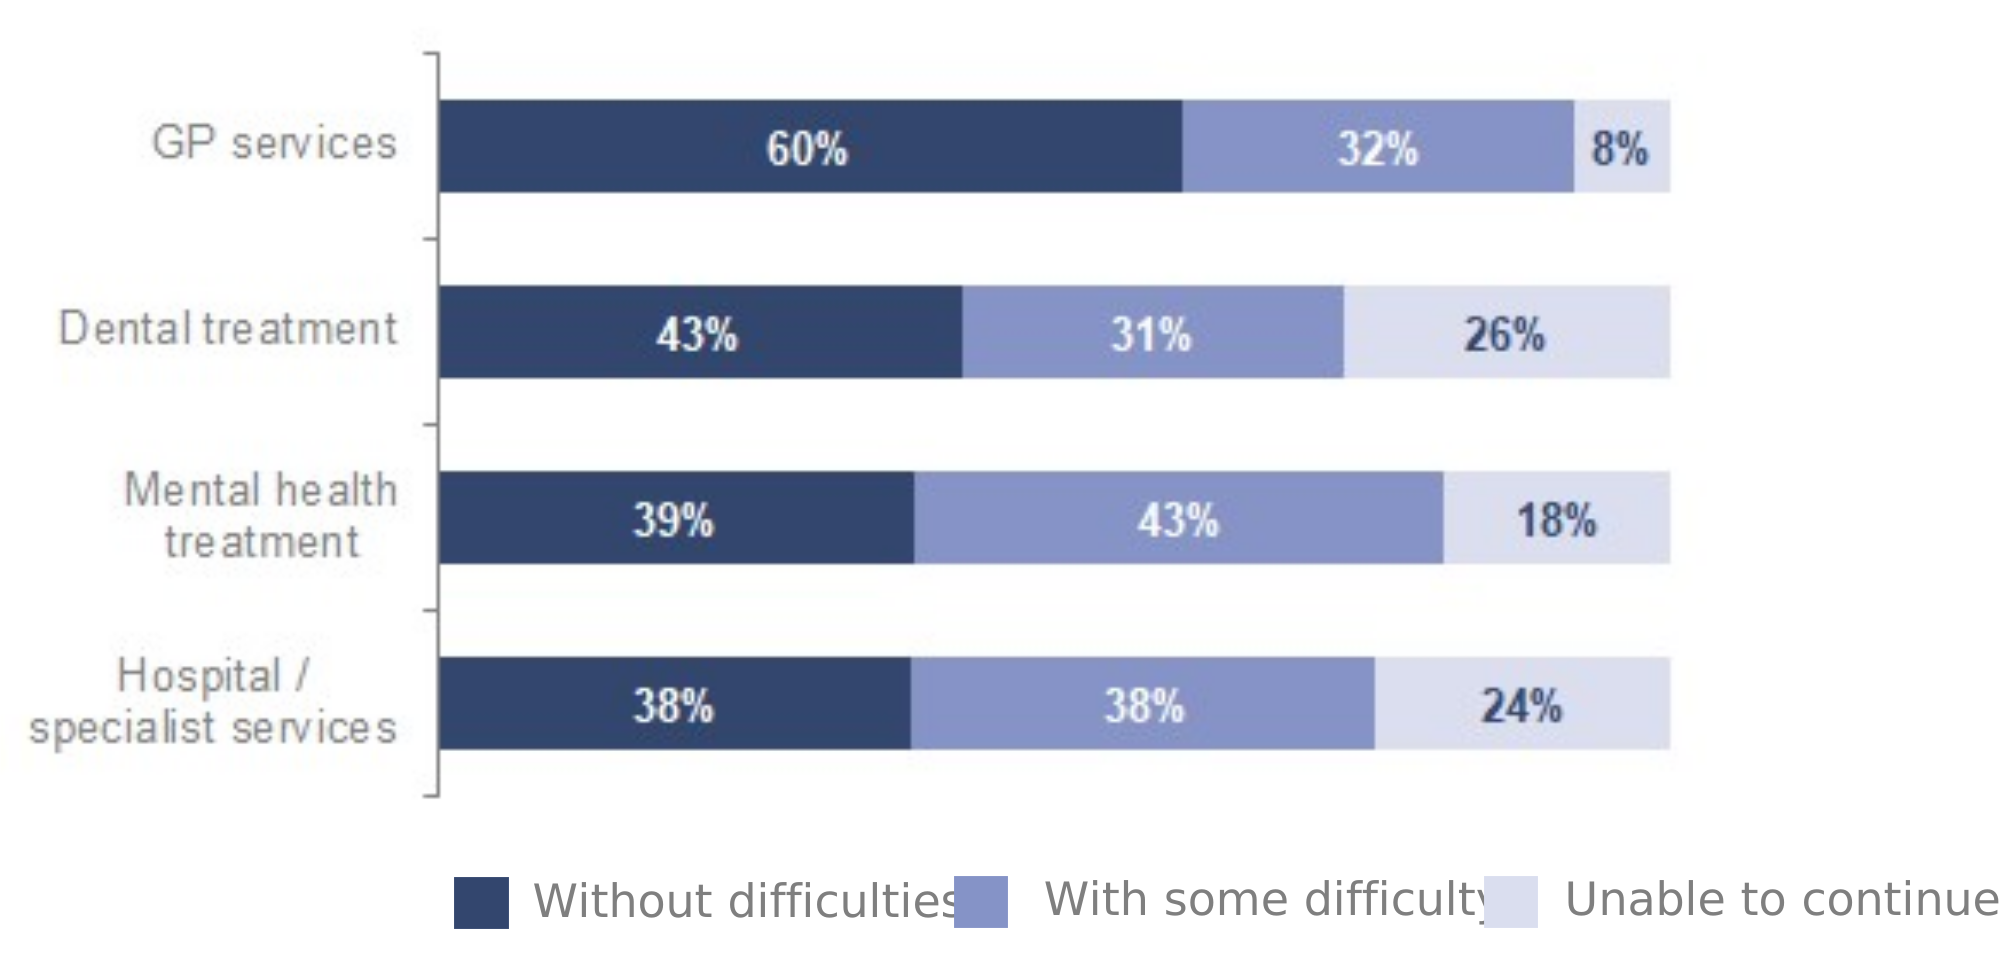
These results are based on those families who moved home whilst undergoing healthcare treatment.
Figure 9.5 contains four stacked bar charts showing families’ ability to continue healthcare treatment after moving home for each type of healthcare service. Families were more able to continue use of GP services compared to the other types of healthcare services.
Six in ten families who moved whilst undergoing treatment with their GP were able to continue treatment without difficulty (60%). This is an improvement on the 46% reported in 2025 and is now similar to results between 2016 and 2022. Less than one in ten families (8%) were unable to continue GP treatment.
Families were less able to continue other types of treatment after moving. Of those who moved whilst undergoing mental health treatment, 39% were able to continue treatment without difficulty. Similar proportions of families report being able to continue dental treatment (43%) and hospital services (38%) without difficulties.
Of those families who moved whilst undergoing treatment, just over a quarter were unable to continue their dental treatment (26%) and a similar proportion were unable to continue treatment with hospital services (24%). Just under one in five families who moved whilst undergoing mental health treatment were unable to continue their treatment (18%).
The ability to continue dental treatment amongst families who moved has improved this year.
Figure 9.6: Families able to continue dental treatment without difficulties
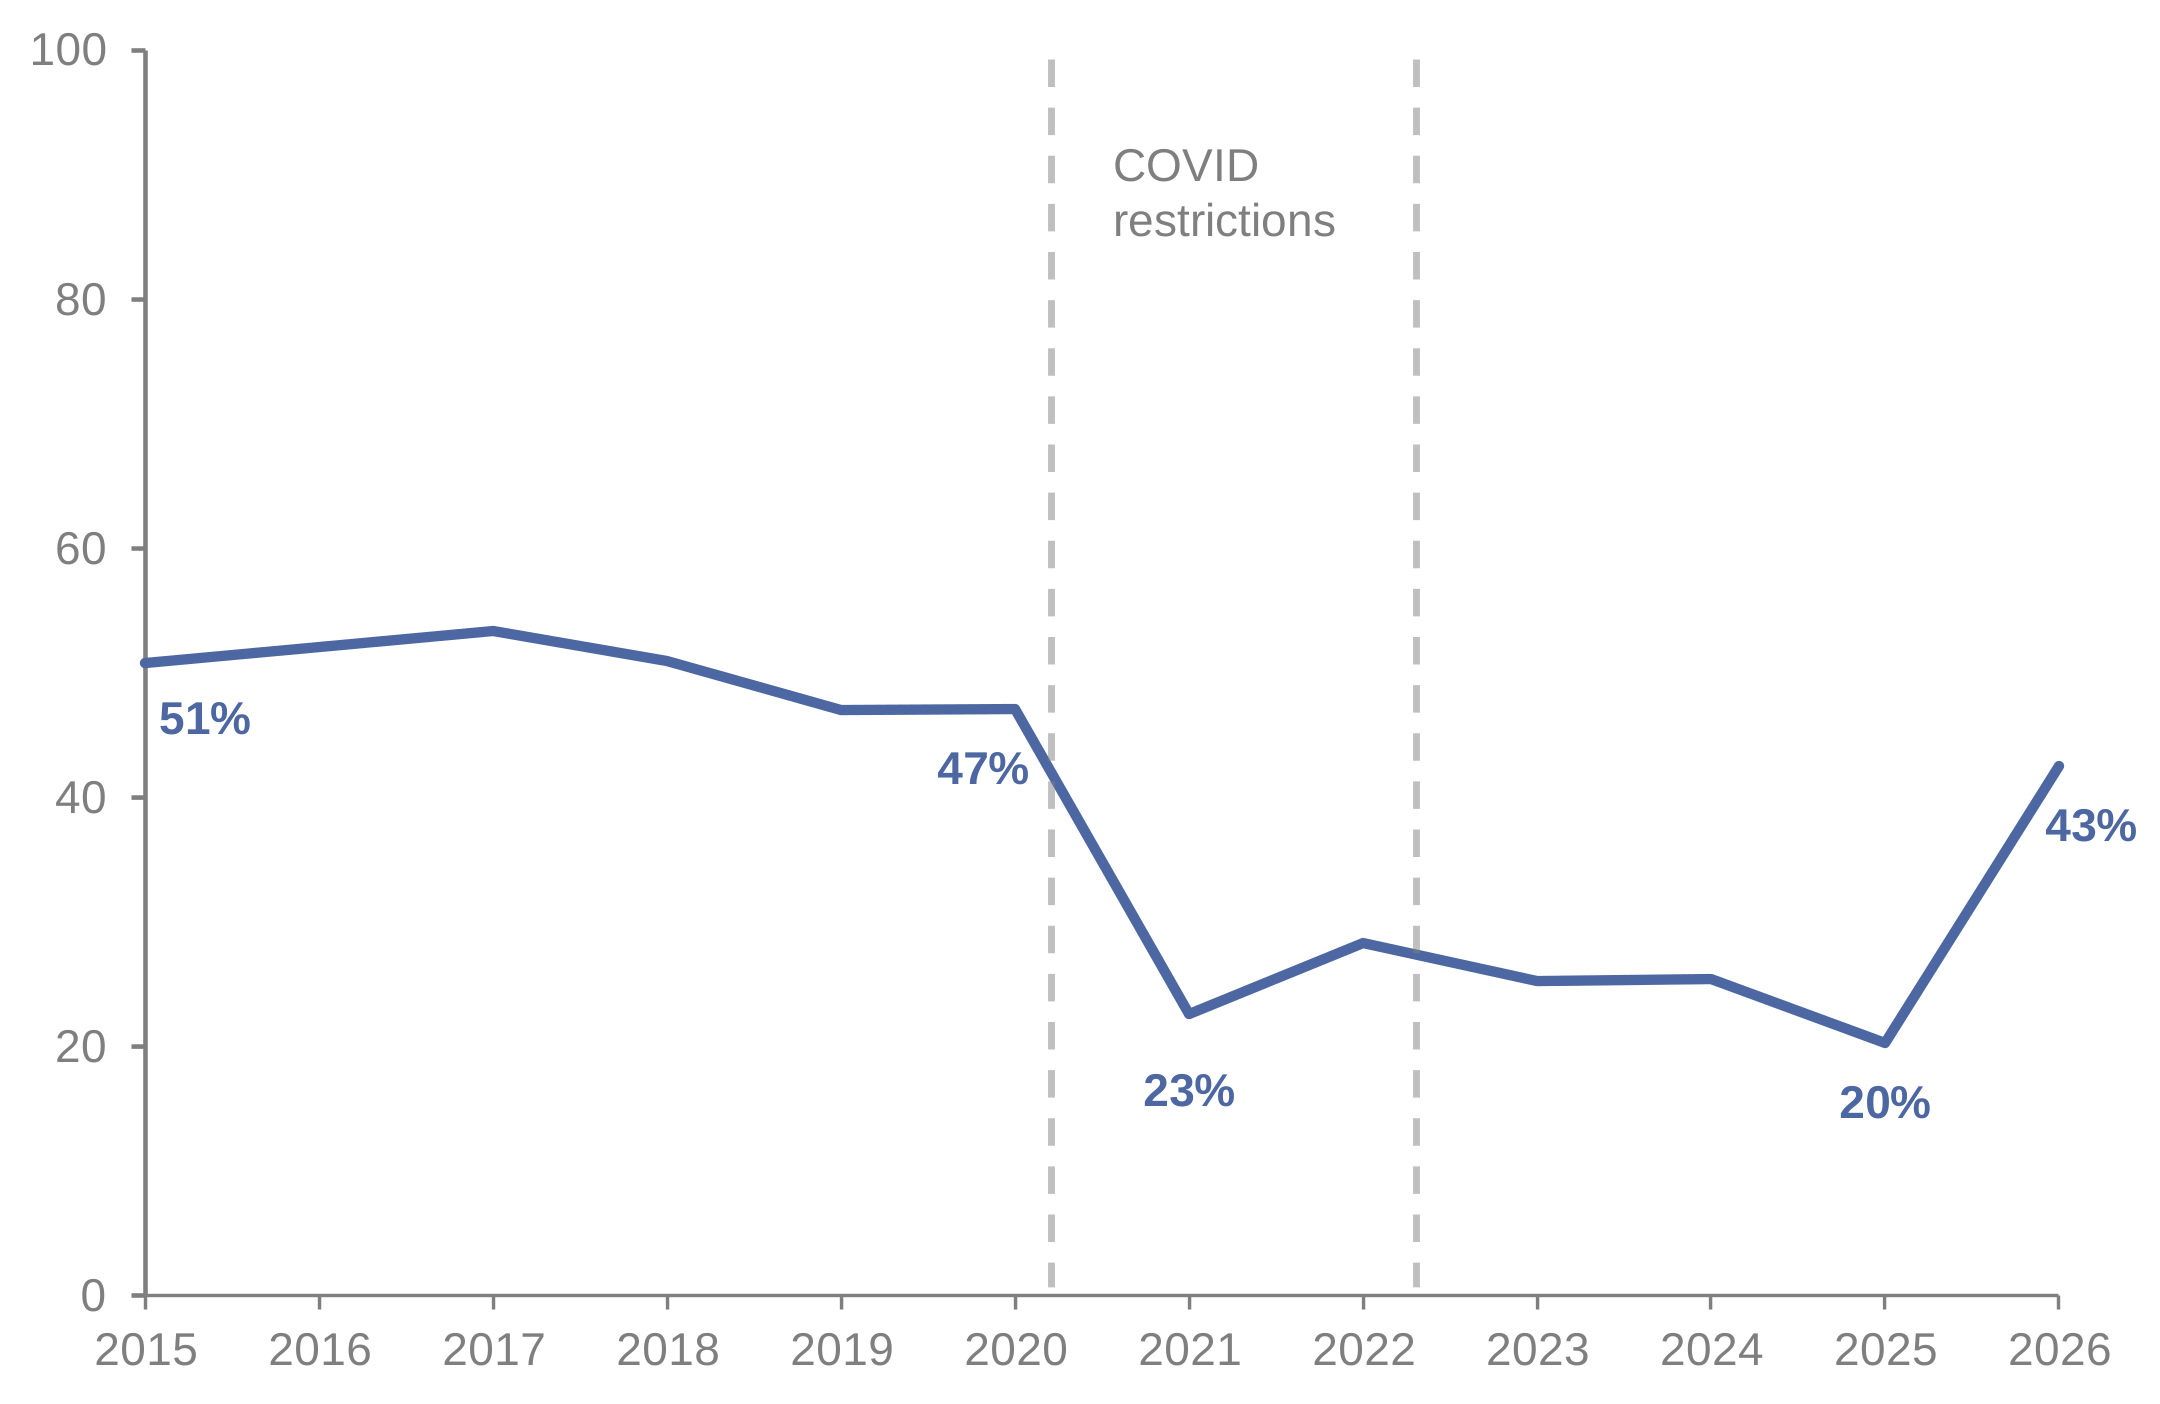
These results are based on those families who moved home whilst undergoing dental treatment.
Figure 9.6 is a line graph that shows, of those families who moved whilst undergoing dental treatment, the proportion able to continue treatment without difficulties between 2015 and 2026. This proportion decreased from 47% in 2020 to 23% in 2021, likely due to the impact of COVID-19 restrictions.
The proportion of families able to continue dental treatment, after moving, improved from 20% in 2025 to 43% in 2026, now similar to all results prior to 2021.
Accordingly, the proportion of families unable to continue dental treatment has also improved. This decreased from 46% in 2025 to 26% this year, also now similar to all levels reported prior to 2021.
10. Housing
This section provides information on:
- Home ownership
- Reasons for not owning a home
- Families living in their own home
- Families living in Service Family Accommodation (SFA)
- Accommodation preferences
- Satisfaction with Service Family Accommodation (SFA) and Substitute Service Family Accommodation (SSFA).
Home ownership
Three-fifths (60%) of Service families own a home, unchanged since 2014.
National results for context
Although not directly comparable, the latest English Housing Survey reported that 65% of households in England were owner occupied in 2024-2025.
Home ownership differs by Service and Rank group.
Figure 10.1: Home ownership by Service and Rank group
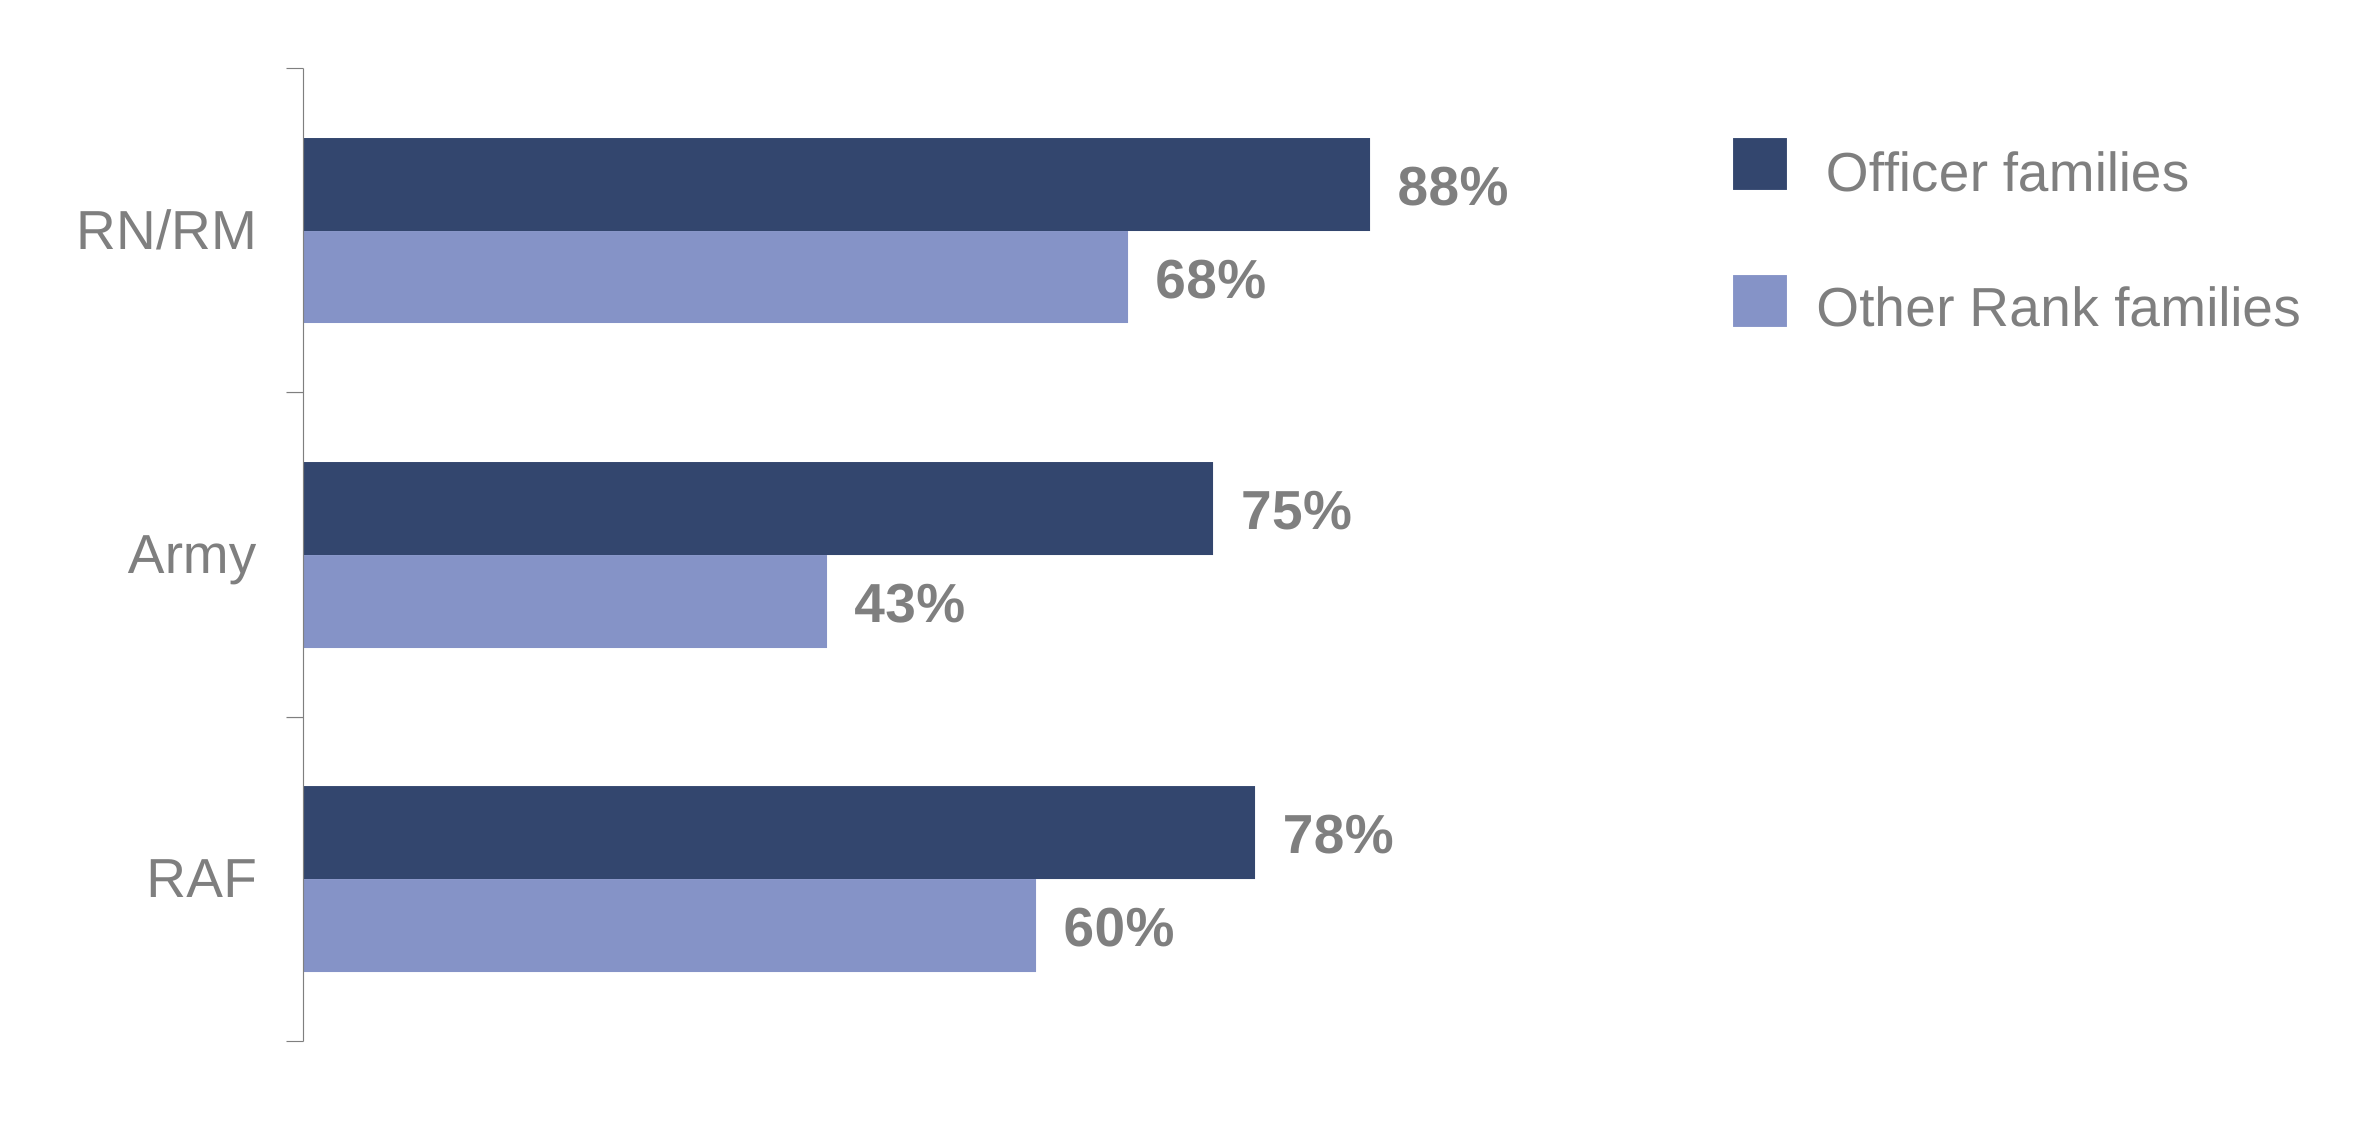
Figure 10.1 is a bar chart that shows Officer families are more likely to own a home than Other Rank families within each Service. For example, within the RAF, 78% of Officer families own a home compared to 60% of Other Rank families.
Amongst Officer families, RN/RM Officer families are more likely to own a home (88%) than Army (75%) or RAF Officer families (78%)
Amongst Other Rank families, RN/RM Other Rank families are the most likely to own a home (68%), followed by RAF Other Rank families (60%). Army Other Rank families are the least likely to own a home (43%).
Reasons for not owning a home
The results in this section are based on those families who do not own a home. This is a tick all that apply question so results will not sum to 100%.
The top four reasons for not owning a home are:
- 51% Cannot afford to buy a suitable home
- 43% Living in Service accommodation is better suited to their family
- 29% Want to be able to move with their spouse when they are posted
- 22% Do not want to buy a home where they are currently located
The proportion selecting affordability decreased from 61% in 2024 to 51% in 2025, where it remains this year. This is similar to results between 2020 and 2022 but is lower than all levels reported prior to 2020.
Reasons for non-homeownership differ by Rank group, affordability is the top reason for Other Rank families (53%) whilst it is in third place for Officer families (37%).
Families living in their own home
Over a third of families (36%) live in their own home, unchanged since 2017.
Figure 10.2: Families living in their own home by Service
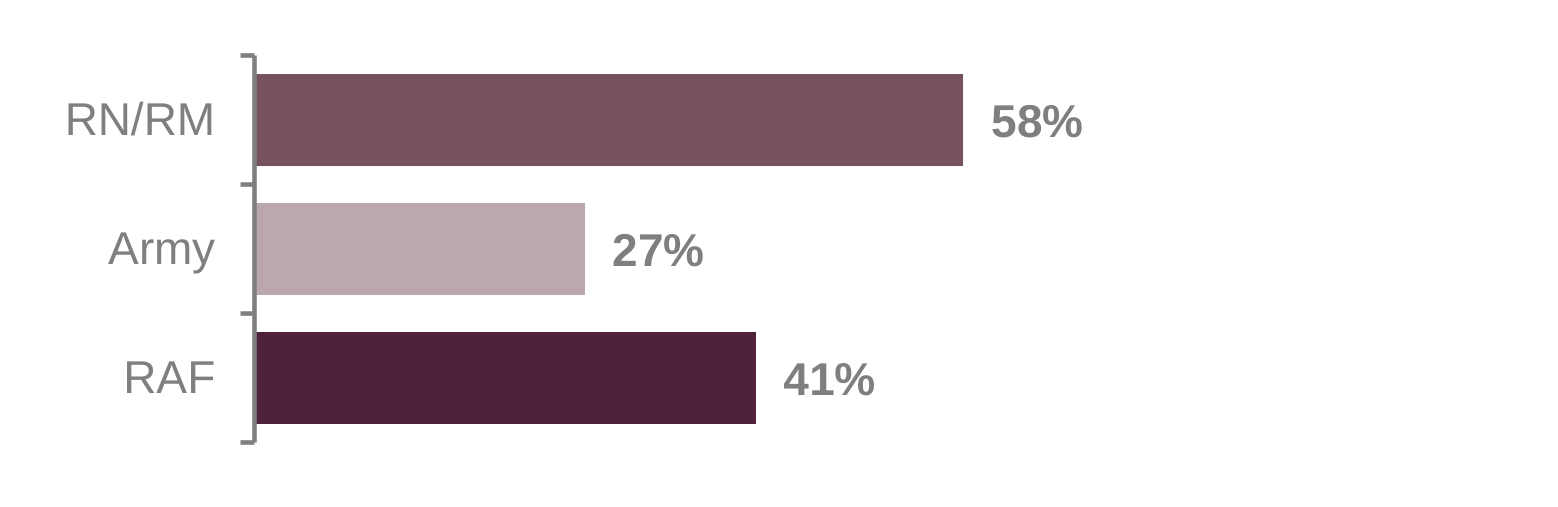
Figure 10.2 is a bar chart that shows families living in their own home differs by Service.
RN/RM families are the most likely to live in their own home (58%) followed by RAF families (41%) whilst Army families are the least likely to live in their own home (27%).
Officer families are more likely to live in their own home (44%) than Other Rank families (33%). This is driven by differences amongst Army families; there is little difference in the proportion of Officer or Other Rank families living in their own home for RN/RM or RAF families.
Very few families living outside the UK live in their own home (4%). Most overseas families are accompanying their Serving partner (85%), so are not living overseas permanently.
Families living in Service Family Accommodation (SFA)
Nearly six in ten families (57%) live in SFA, unchanged since 2014. Again, this differs by Service and Rank group.
Figure 10.3: Families living in SFA by Service
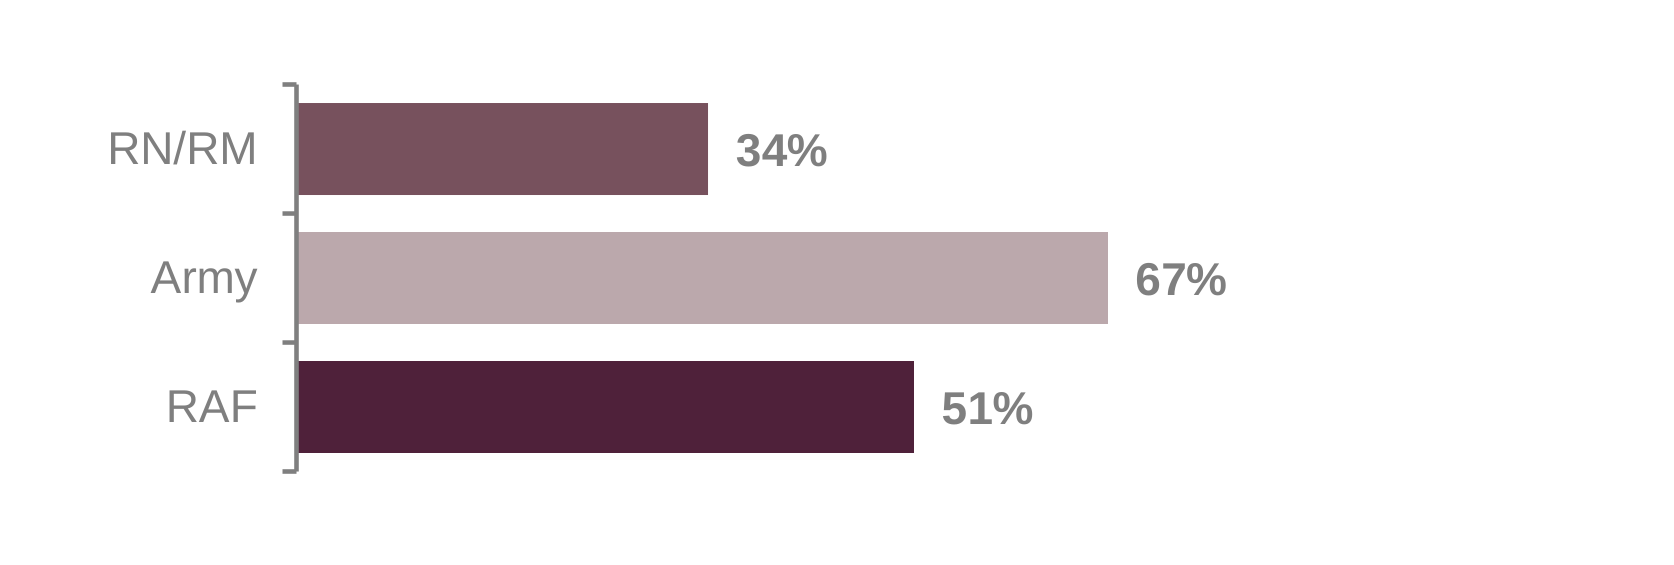
Figure 10.3 is a bar chart that shows families living in SFA differs by Service.
Army families are the most likely to live in SFA (67%) followed by RAF families (51%) whilst RN/RM families are the least likely to live in SFA (34%).
Other Rank families are more likely to live in SFA (62%) than Officer families (47%). This is largely driven by differences amongst Army families.
Overall, fewer families live in other types of accommodation (7%), this includes 1% living in privately rented accommodation.
Families accommodation preference
Families are also asked what type of accommodation they would prefer to live in. This section presents these results and explores how families’ preferences align with the accommodation they are living in.
Four in ten families (40%) would prefer to live in SFA, unchanged since 2024 but above levels reported between 2015 and 2023 (which range from 34% to 37%).
More families, nearly six in ten (56%), would prefer to live in their own home. Although unchanged since 2024 this is lower than levels reported between 2016 and 2023 (which range from 60% to 62%).
Accommodation preferences differ by Service, Rank group, and location.
Figure 10.4: Accommodation preference by Service
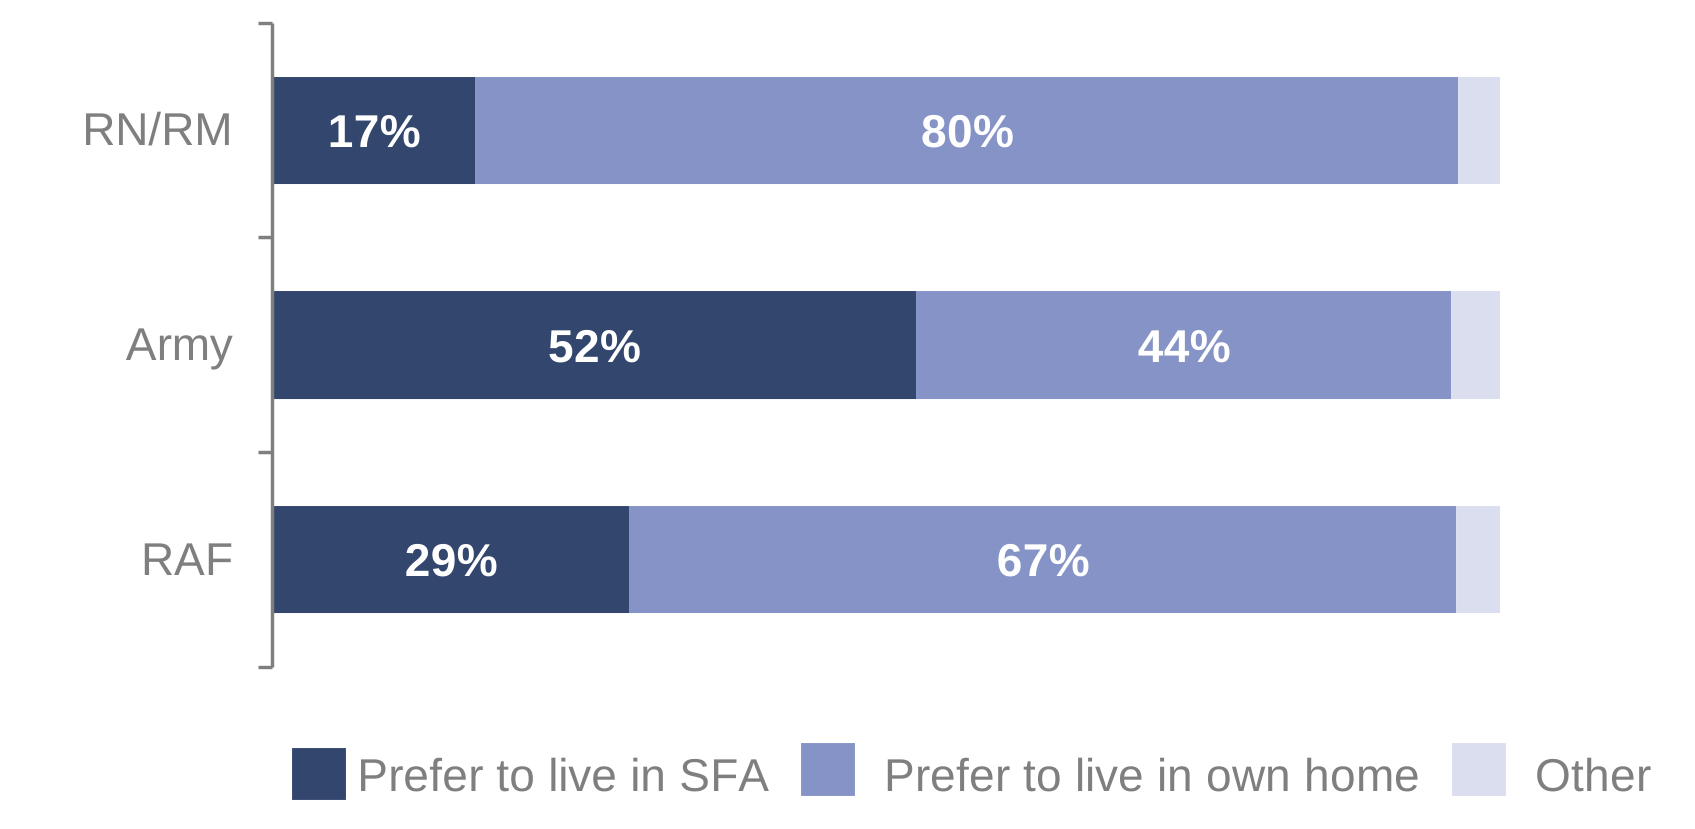
Figure 10.4 contains three stacked bar charts that show a higher proportion of RN/RM families would prefer to live in their own home (80%) followed by RAF families (67%). Army families are the least likely to express a preference for living in their own home (44%).
Just over half of Army families would prefer to live in SFA (52%), followed by RAF families (29%), whilst RN/RM families are the least likely to express a preference for SFA (17%).
Other Rank families express more of a preference for SFA (43%) than Officer families (33%) whilst a higher proportion of Officer families would prefer to live in their own home (63%) than Other Rank families (53%).
Six in ten families living overseas would prefer to live in SFA (60%) compared to 40% of families living in England.
Figure 10.5: Families’ current accommodation versus their preference
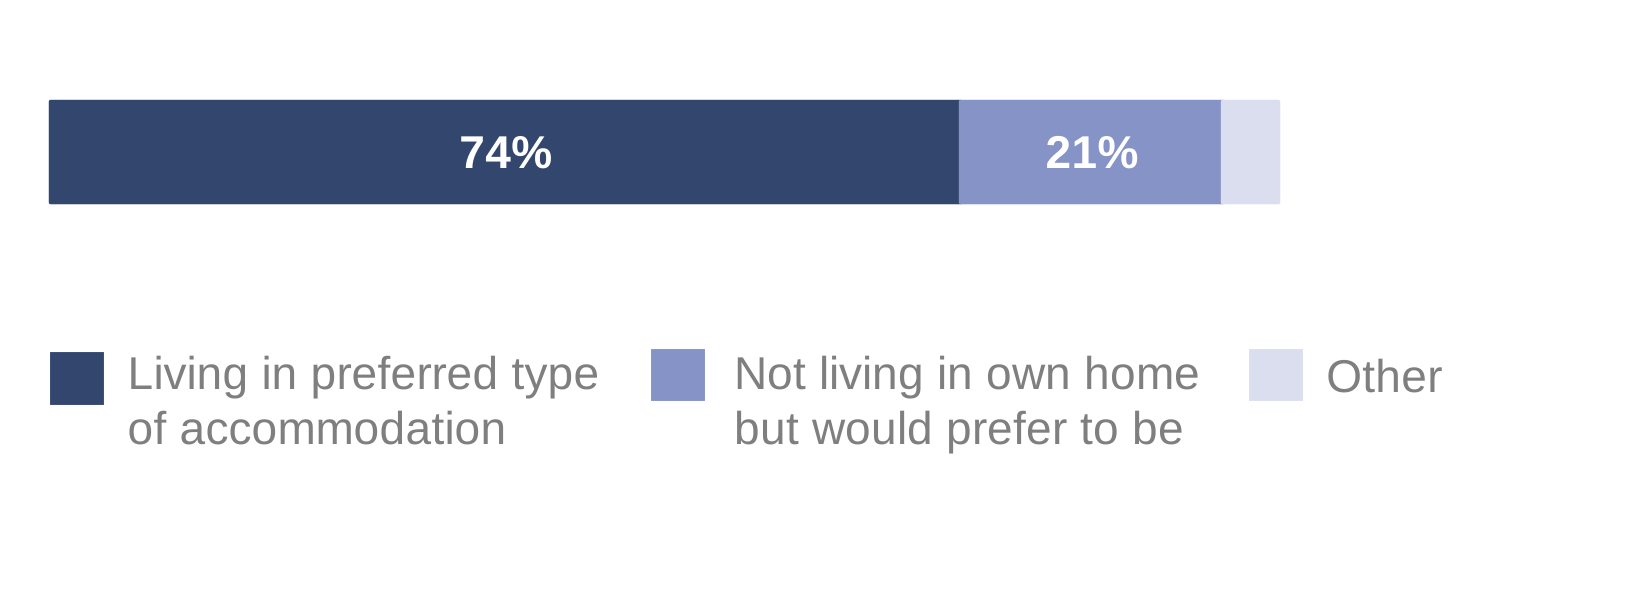
Figure 10.5 is a stacked bar chart that shows most Service families are living in their preferred type of accommodation (74%) whilst just over one in five families (21%) are not currently living in their own home but would prefer to be.
The proportion of families living in their preferred type of accommodation increased from 71% in 2025 to 74% this year.
This is mirrored by a reduction in the proportion of families not currently living in their own home, but who would prefer to be, which decreased from 24% in 2025 to 21% in 2026 and is now lower than all previously reported levels.
A lower proportion of RAF families are living in their preferred type of accommodation (68%) compared to RN/RM and Army families (73% and 77% respectively).
Satisfaction with Service Family Accommodation
The results in this section are based on those families who live in SFA or Substitute SFA (SSFA). These families are asked how satisfied or dissatisfied they are with various aspects of their Service accommodation.
Over half of families (53%) are satisfied with the overall standard of their accommodation whilst 31% are dissatisfied.
Figure 10.6: Families satisfied with the overall standard of their Service accommodation between 2015 and 2026
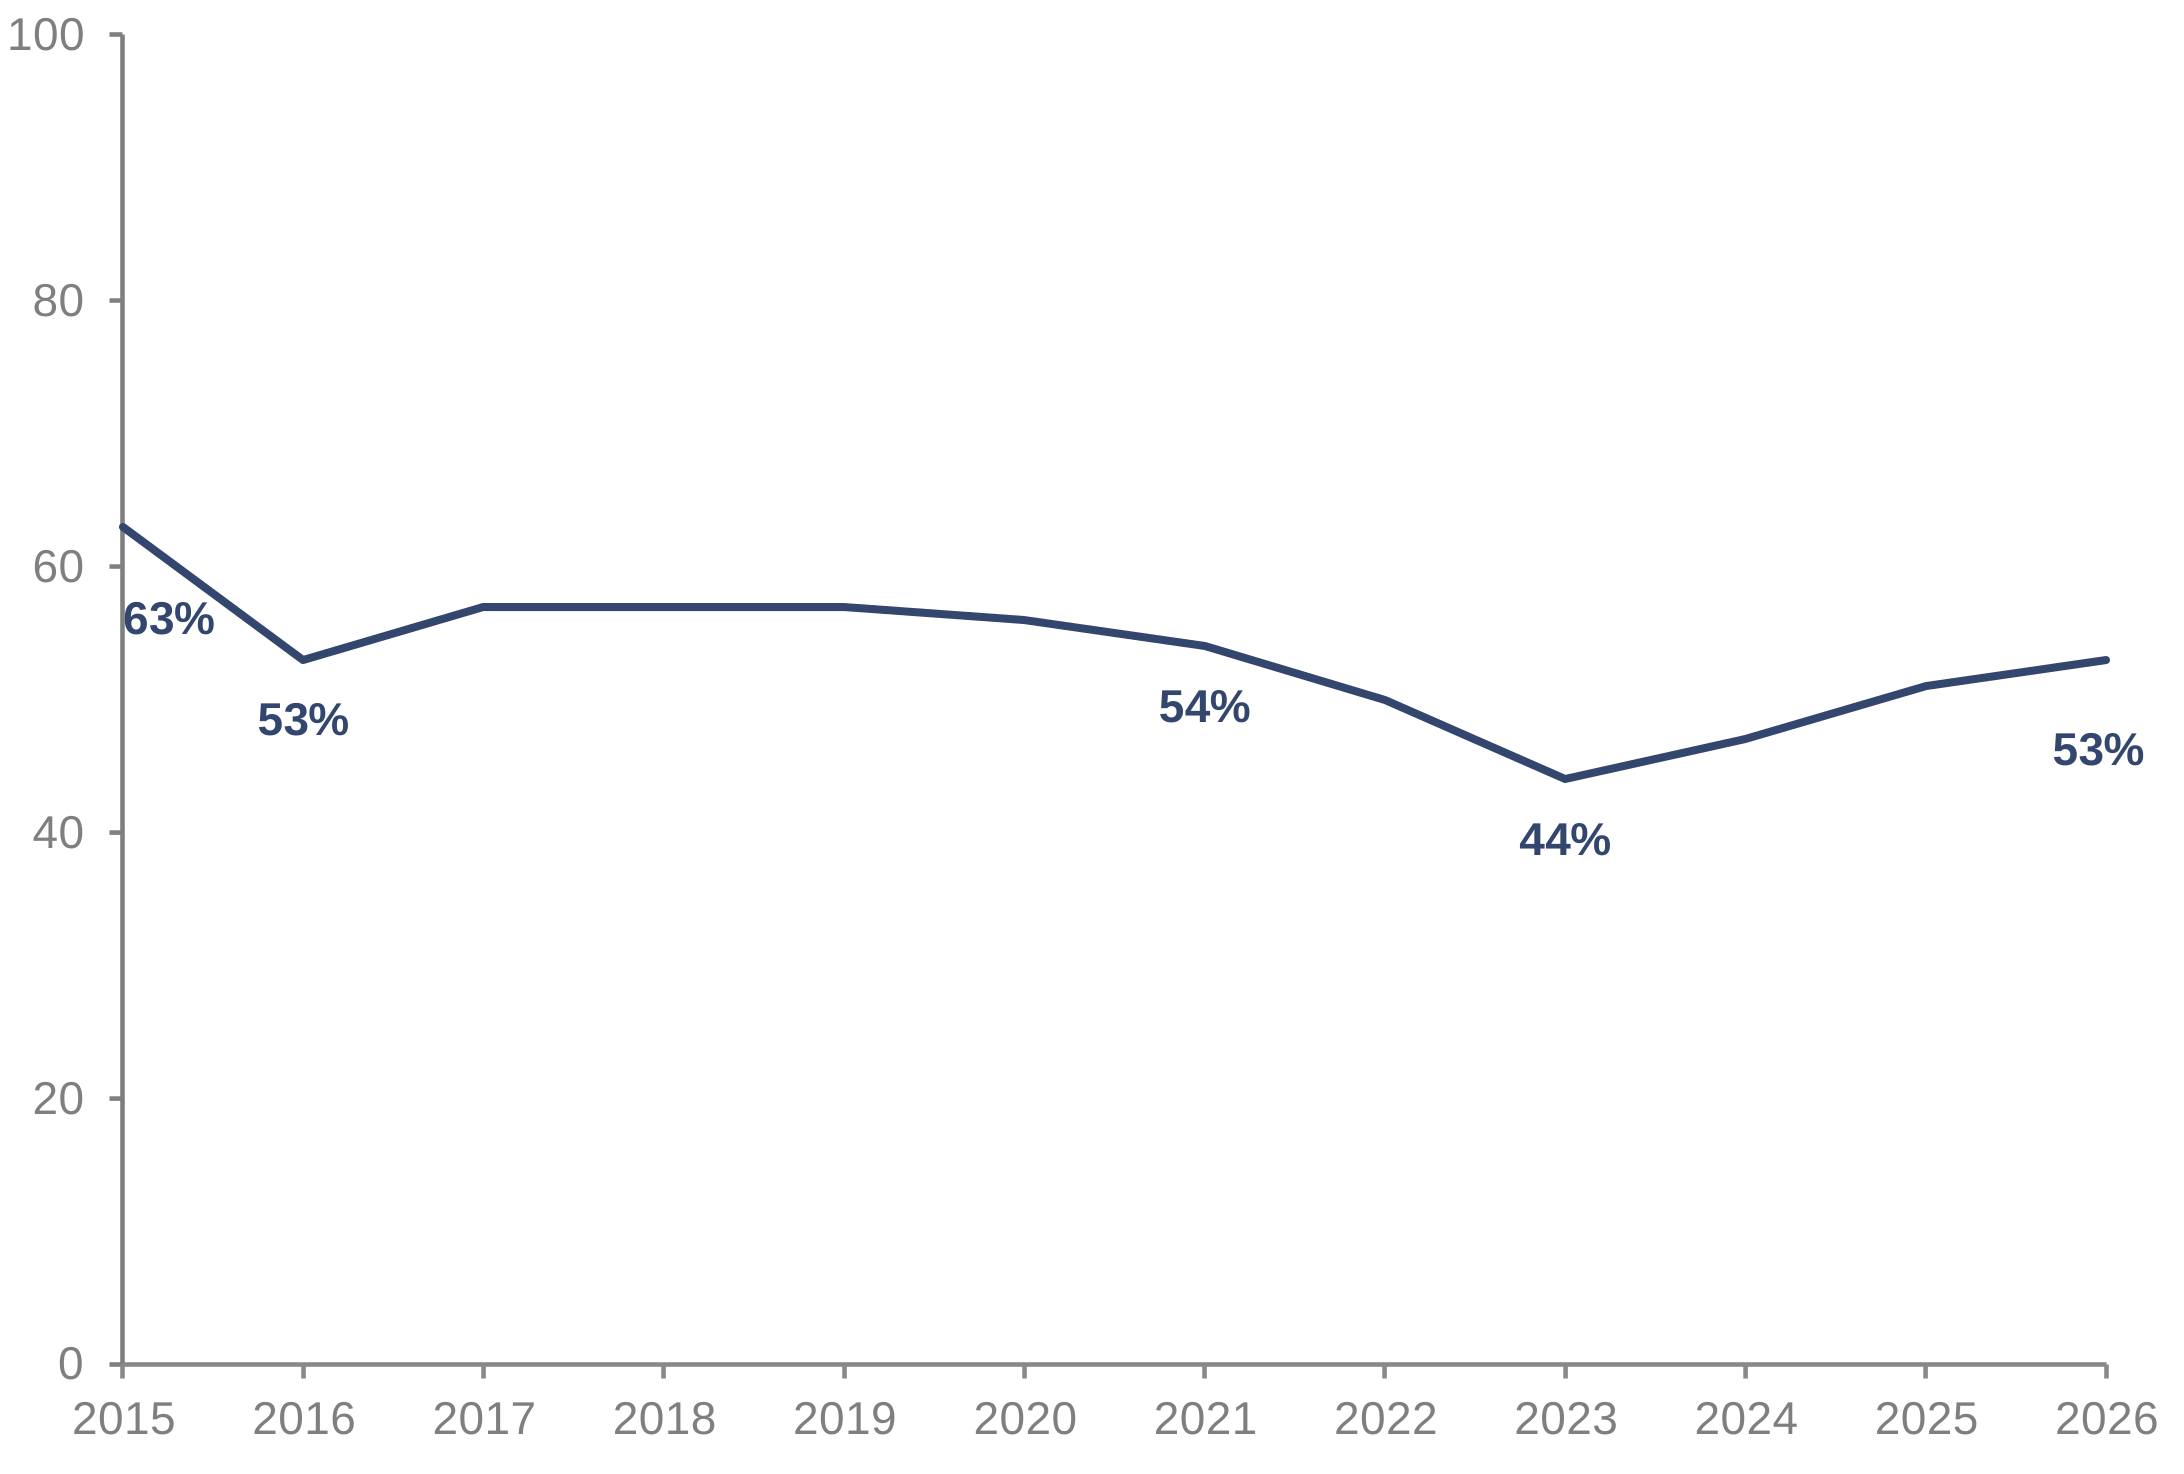
These results are based on those living in SFA or SSFA.
Figure 10.6 is a line graph showing that satisfaction with the overall standard of SFA/SSFA decreased from 54% in 2021 to 44% in 2023. Satisfaction increased to 51% in 2025 and remains at a similar level this year (53%). This is in line with, or above, all previously reported levels except for the peak of 63% reported in 2015.
Satisfaction with most aspects of Service accommodation fell markedly in 2016 due, in part, to underperformance by the National Housing Prime contractor and changes to the SFA charging method in April 2016.
The Future Defence Infrastructure Services contract launched in April 2022 using industry partners Pinnacle Group, VIVO and Amey. This change in contracts may have had some impact on results in recent years. The performance of industry partners is closely monitored by the Defence Infrastructure Organisation as all suppliers continue to focus on how they can improve performance, service delivery, and levels of customer satisfaction for Service families.
Families report higher levels of satisfaction with:
- The value for money of their SFA/SSFA (65%)
- The security of their SFA/SSFA (64%)
- That their accommodation meets their needs (62%).
Families are less satisfied with:
- The ability to choose the location of their SFA/SSFA (41%)
- The response to requests for maintenance or repair of their SFA/SSFA (40%)
- The quality of maintenance or repair work (33%)
Figure 10.7: Satisfaction with response to requests for maintenance or repair work of their Service accommodation between 2015 and 2026
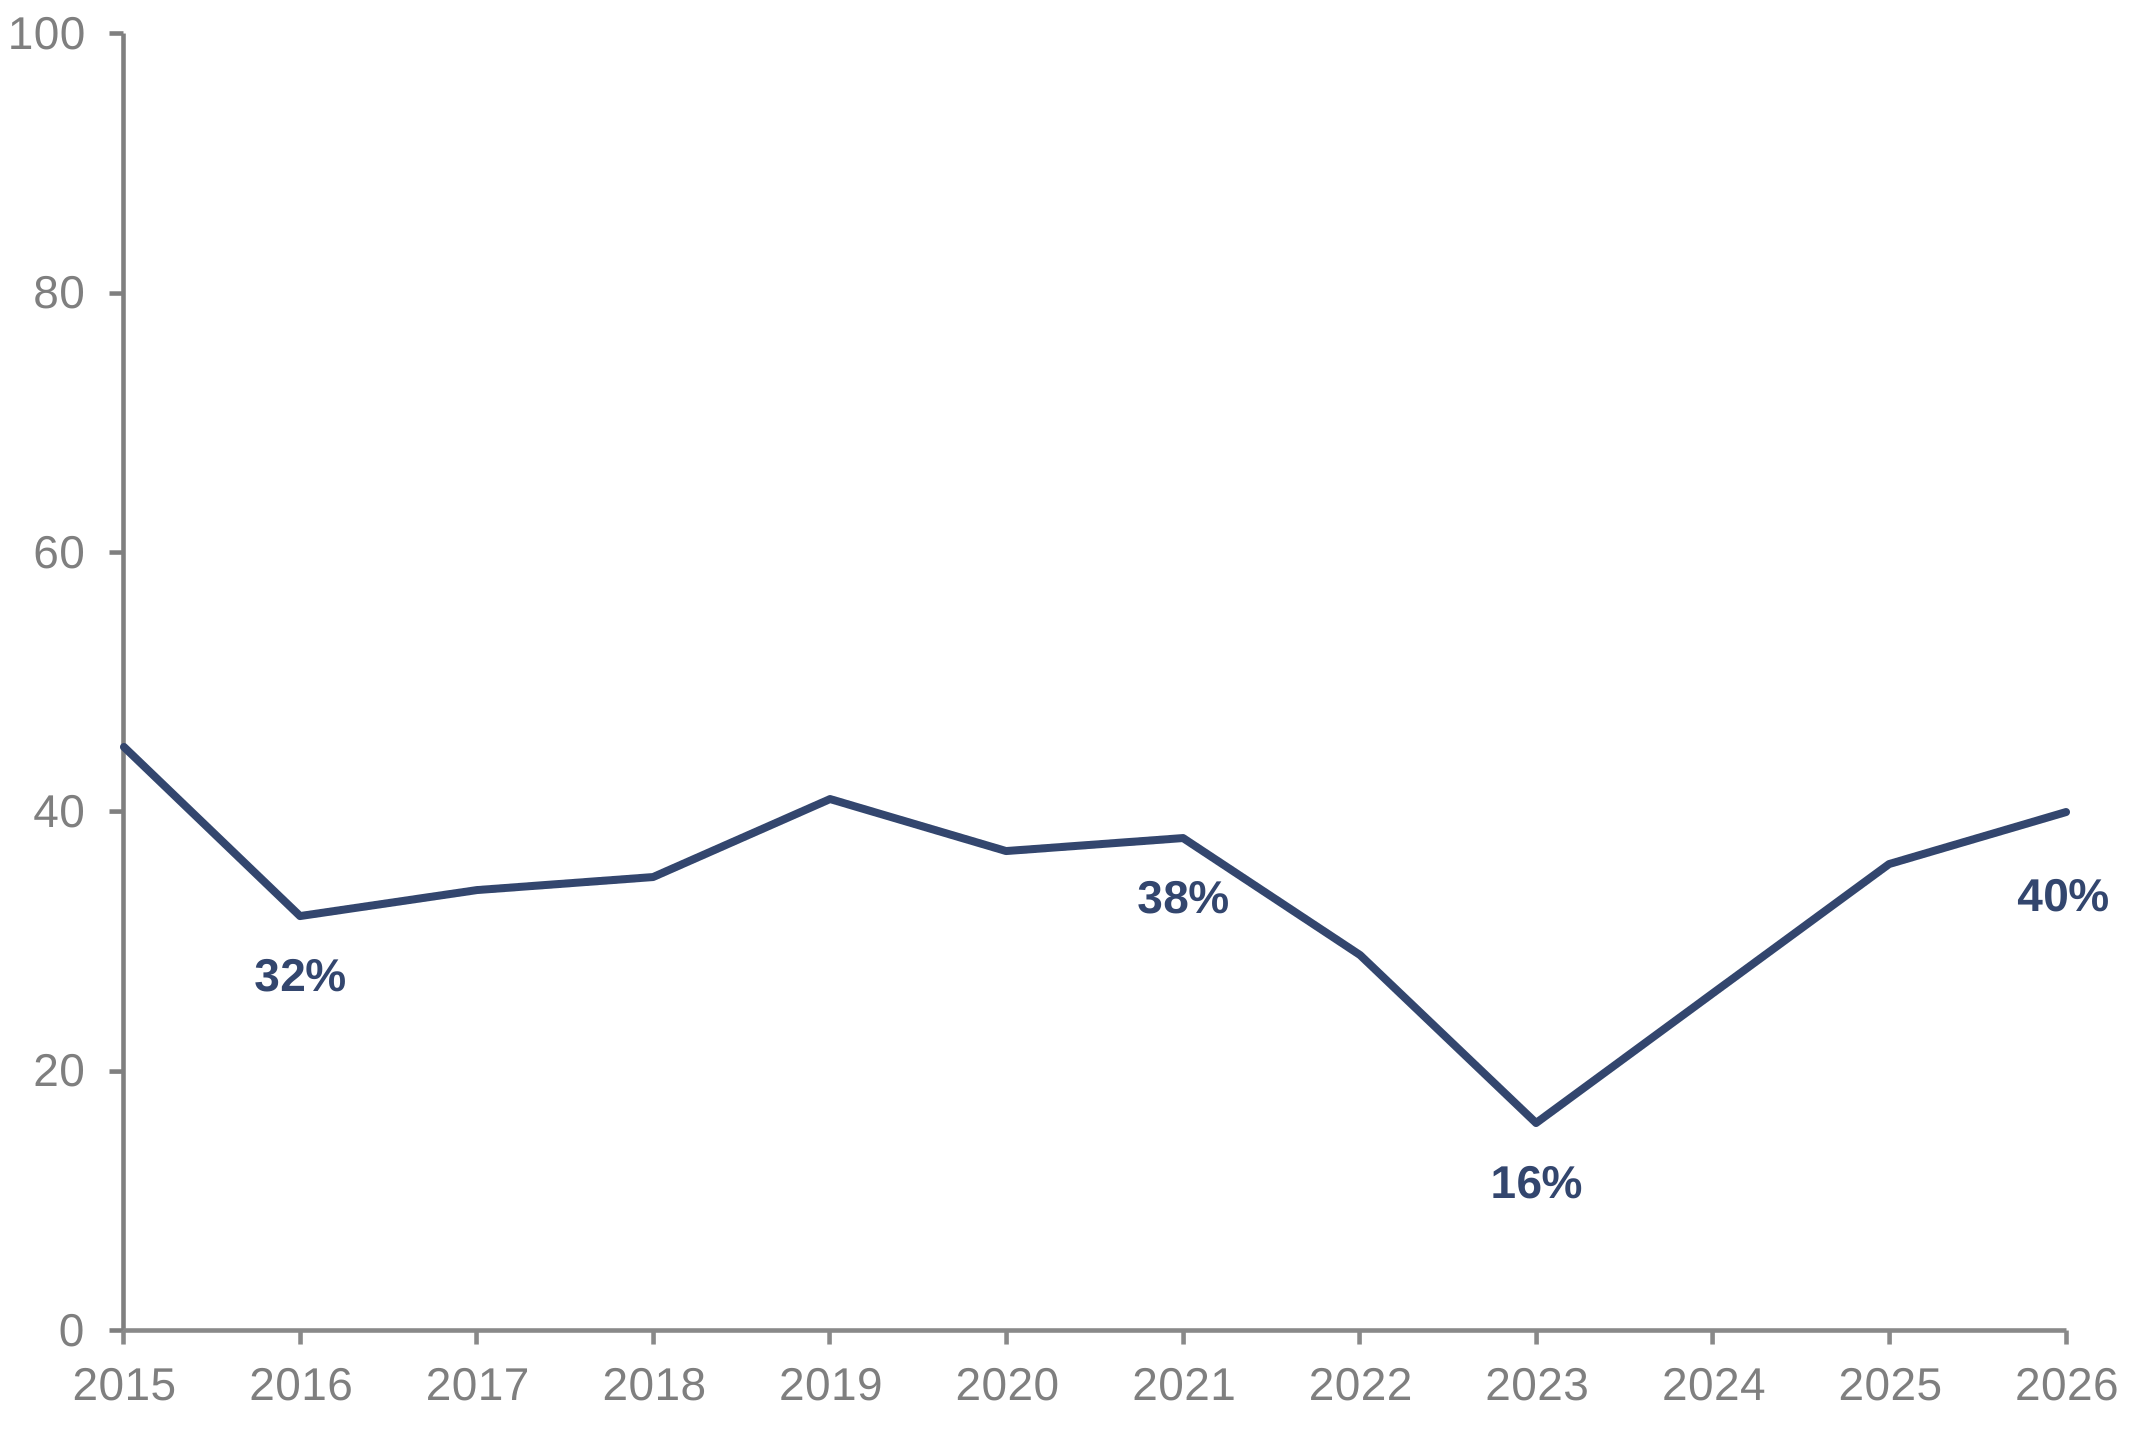
These results are based on those living in SFA or SSFA.
Figure 10.7 contains a line graph showing how satisfaction with response to requests for maintenance or repair work of SFA/SSFA has changed between 2015 and 2026.
Satisfaction decreased from 38% in 2021 to 16% in 2023. Satisfaction increased over the next two years to 36% in 2025 and remains at a similar level this year (40%). This is now similar to, or above, all previous levels, except for the peak reported in 2015 (45%).
Dissatisfaction with the response to requests for maintenance or repair work of SFA/SSFA peaked at 74% in 2023. This has decreased for three years in a row to 39% this year. Dissatisfaction is now lower than almost all levels reported since 2016 and is back in line with 2015.
Satisfaction with the quality of maintenance or repair work follows a similar trend. Satisfaction decreased from 31% in 2021 to 21% in 2023, then increased to 33% in 2025 where it remains this year. Satisfaction is now similar to, or above, all previous levels except for the peak of 42% reported in 2015.
Over four in ten families (46%) are dissatisfied with the quality of maintenance or repair work. This is unchanged since last year and, although lower than levels reported between 2022 and 2024, it remains above the 37% reported in 2015.
Families living overseas are more satisfied with these aspects of their SFA/SSFA than those living in England. For example, 58% of overseas families are satisfied with the response to requests for maintenance or repair work compared to 38% of families living in England.
11. Welfare support
This section explores families’ views around the welfare support available to Service families. This includes:
- General satisfaction with support
- Awareness of support
- Use of support within the past three years
- Satisfaction with support used
Satisfaction with welfare support from the Service
Figure 11.1: Satisfaction with the welfare support provided to me and my family by the Service
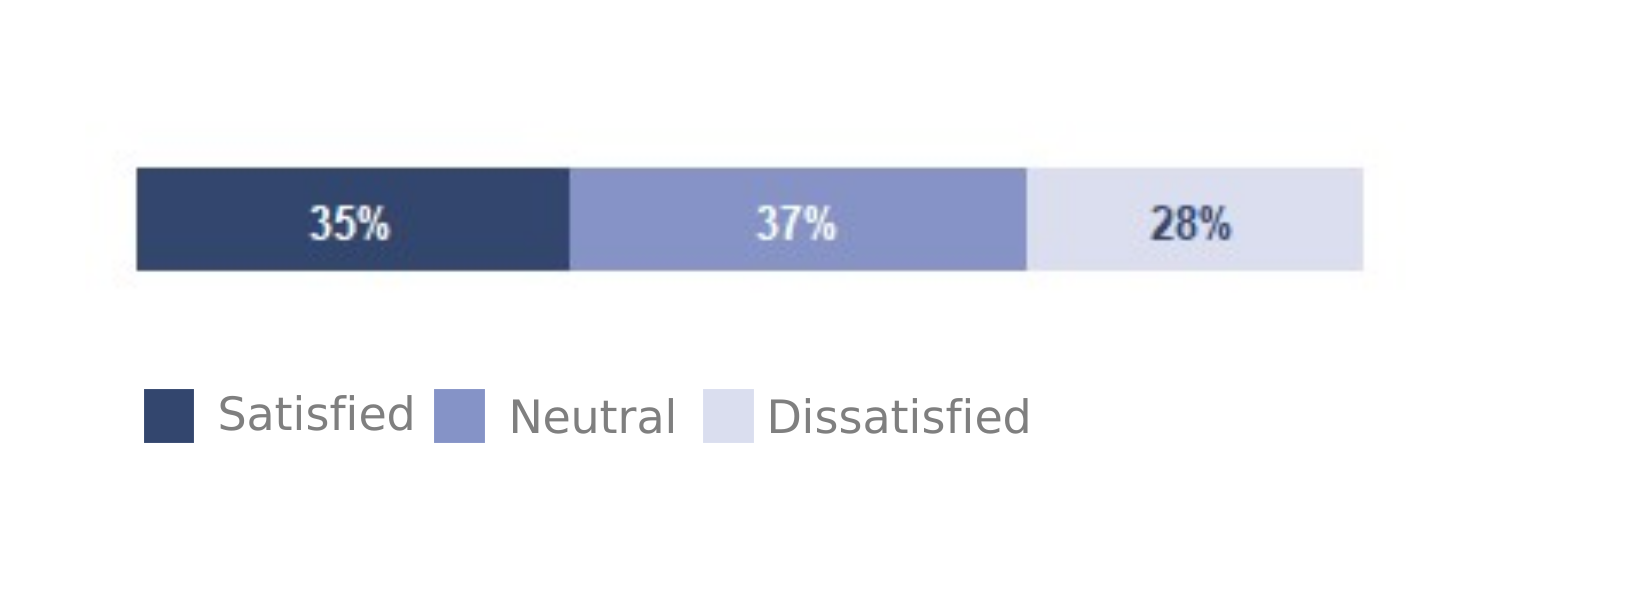
Figure 11.1 is a stacked bar chart that shows just over a third of spouses (35%) are satisfied with the welfare support provided to them by the Service. A similar proportion (37%) feel neutral whilst 28% are dissatisfied. These figures are unchanged from last year when this question was introduced.
The substantial proportion feeling neutral may reflect the low level of use of support by Service families as discussed later.
RN/RM spouses are the least satisfied (27%), followed by RAF (33%), whilst Army spouses are the most satisfied (39%).
Other Rank spouses are more satisfied (37%) than Officer spouses (30%).
Spouses living overseas are more satisfied with the welfare support provided to them and their families (49%) than spouses living in England (34%).
Satisfaction with support when their Serving partner is absent
Figure 11.2: Satisfaction with support from the Service when their Serving partner is absent
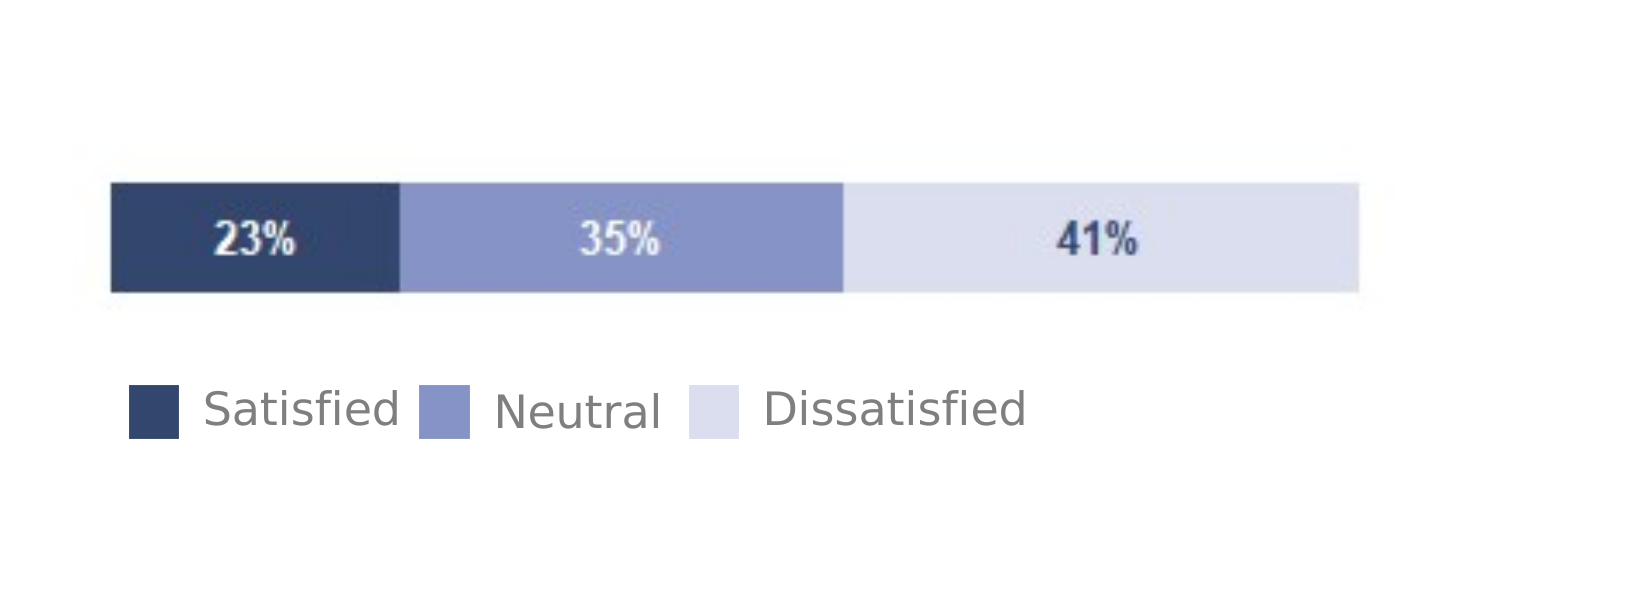
Figure 11.2 is a stacked bar chart that shows spouses are less satisfied with the support they get when their Serving partner is absent. Less than a quarter (23%) are satisfied whilst four in ten (41%) are dissatisfied.
RN/RM spouses are the most likely to feel dissatisfied (52%) followed by RAF spouses (45%) whilst Army spouses are the least dissatisfied (36%).
Other Rank spouses are more satisfied (25%) than Officer spouses (19%).
Spouses living overseas are more satisfied with the support they get from the Service when their partner is absent (34%) than spouses living in England (22%).
AFCAS 2026 comparison
AFCAS results for married Service personnel are more positive than those reported above. Over four in nine (45%) are satisfied with the welfare support provided by the Service for their family and a third (33%) are satisfied with the support their spouse gets from the Service when they are absent.
Awareness of support available to families
This section looks at the proportion of spouses who have heard of support available to them.
These questions were harmonised across the Services in 2025. However, there are Service specific types of support that are only asked of the relevant Service. These are not included within the bar charts as Tri-Service figures are not available.
Examples of single Service results are provided within the text and tables of single Service results are provided with the reference tables (Annex B) published alongside this report on the FamCAS webpage.
Figure 11.3: Spouses who have heard of each type of support
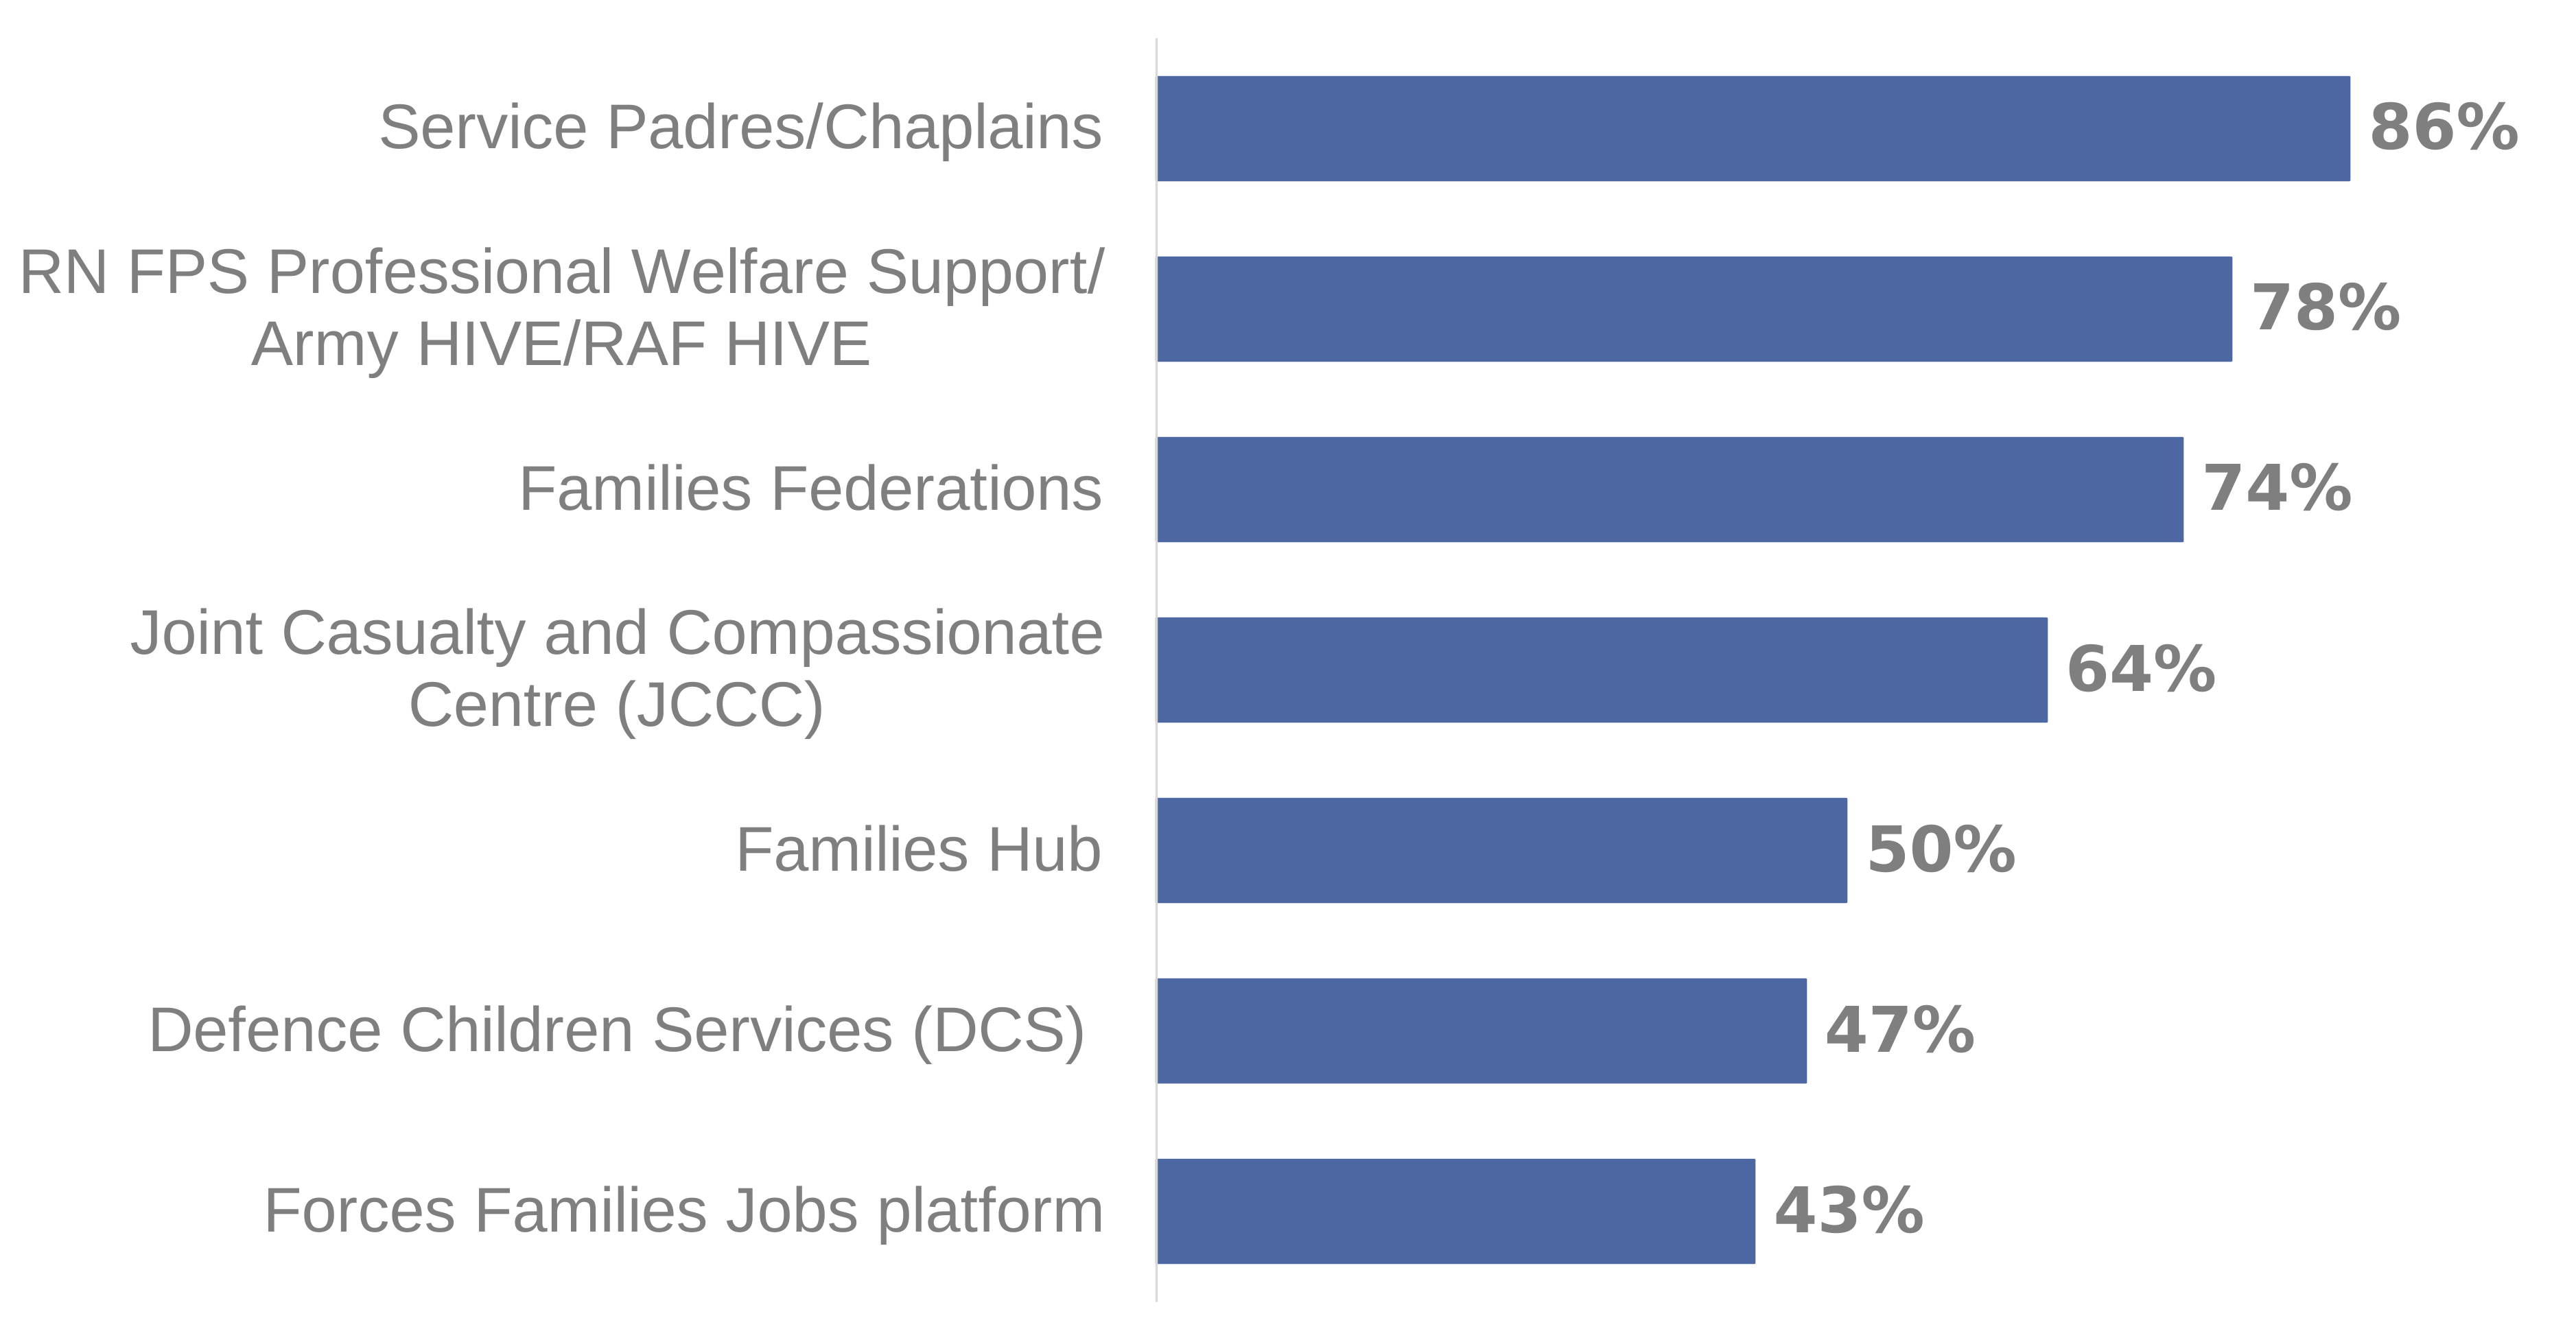
The Defence Children Services (DCS) includes the Education Advice Team (EAT) and the Overseas Education and Supportability Team (OEST).
Figure 11.3 is a bar chart that shows good levels of awareness for many types of support. Most spouses (86%) have heard of Service Padres/Chaplains.
Over three-quarters of spouses (78%) have heard of the Royal Navy Family & People Support (RN FPS) Professional Welfare Support /Army HIVE /RAF HIVE whilst a similar proportion (74%) are aware of the Navy /Army /RAF Families Federations.
Almost two-thirds (64%) are aware of the Joint Casualty and Compassionate Centre (JCCC).
In 2025 the MOD launched the Families Hub – a one-stop shop for relevant information and signposting that is accessible to all. Half of spouses (50%) have heard of the Families Hub.
Less than half of spouses are aware of Defence Children Services (47%) or the Forces Families Jobs platform (43%). However, these are more specific services for advice on children’s education and for family members seeking employment.
Figure 11.4: Spouses who have heard of RN FPS Professional Welfare Support/Army HIVE/RAF HIVE by Service
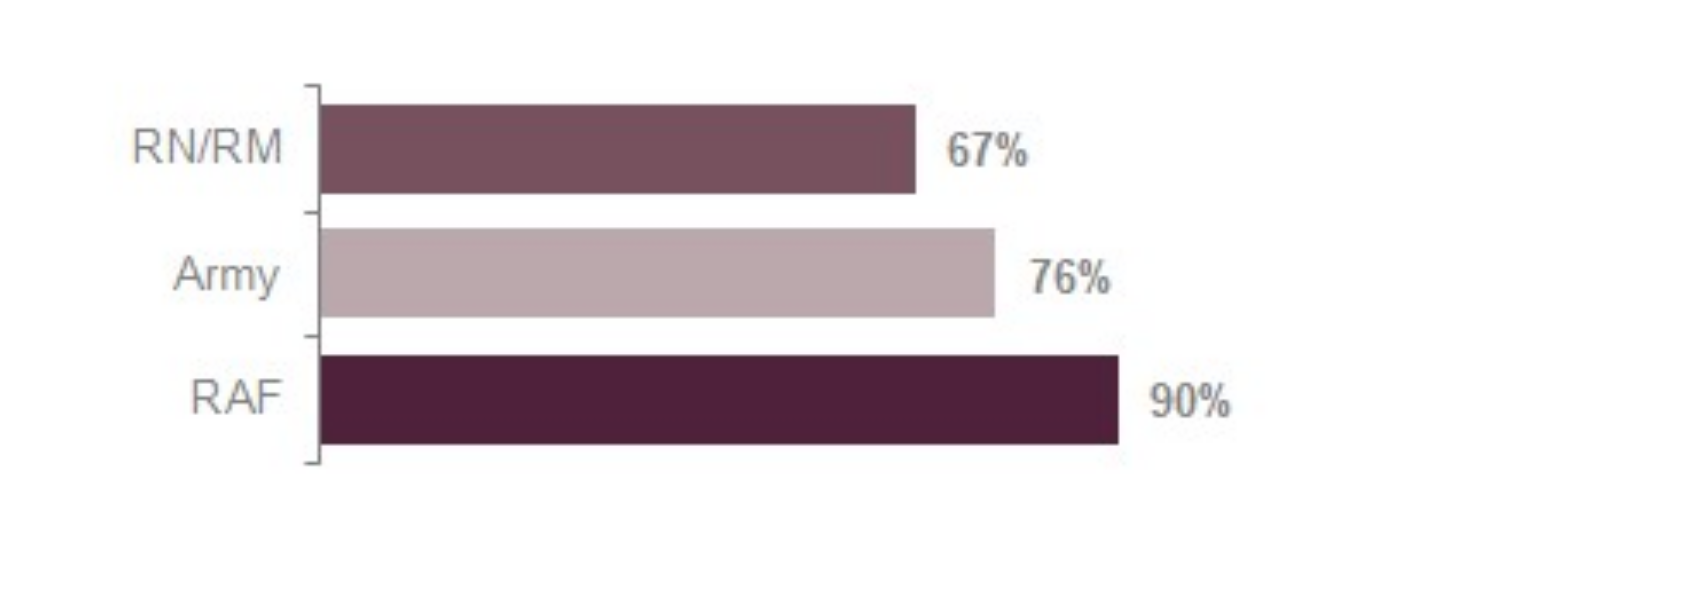
Figure 11.4 is a bar chart showing most RAF spouses have heard of the RAF HIVE (90%) and just over three-quarters of Army spouses (76%) have heard of the Army HIVE. RN/RM spouses are the least likely to have heard of this type of support (67%).
RN/RM spouses are less likely to have heard of five of the seven types of support listed in figure 11.3 compared to other Service spouses.
Awareness of Service specific support is also high, although again, a little lower for RN/RM spouses. For example:
- 66% of RN/RM spouses are aware of the Royal Navy Forum (RN Forum)
- 86% of Army spouses are aware of the Army Welfare Service
- 84% of RAF spouses are aware of RAF Personal Support & Social Work Service (SSAFA)
Use of support within the past three years
Use of support within the past three years is low in comparison to awareness.
Figure 11.5: Use of support within the past three years
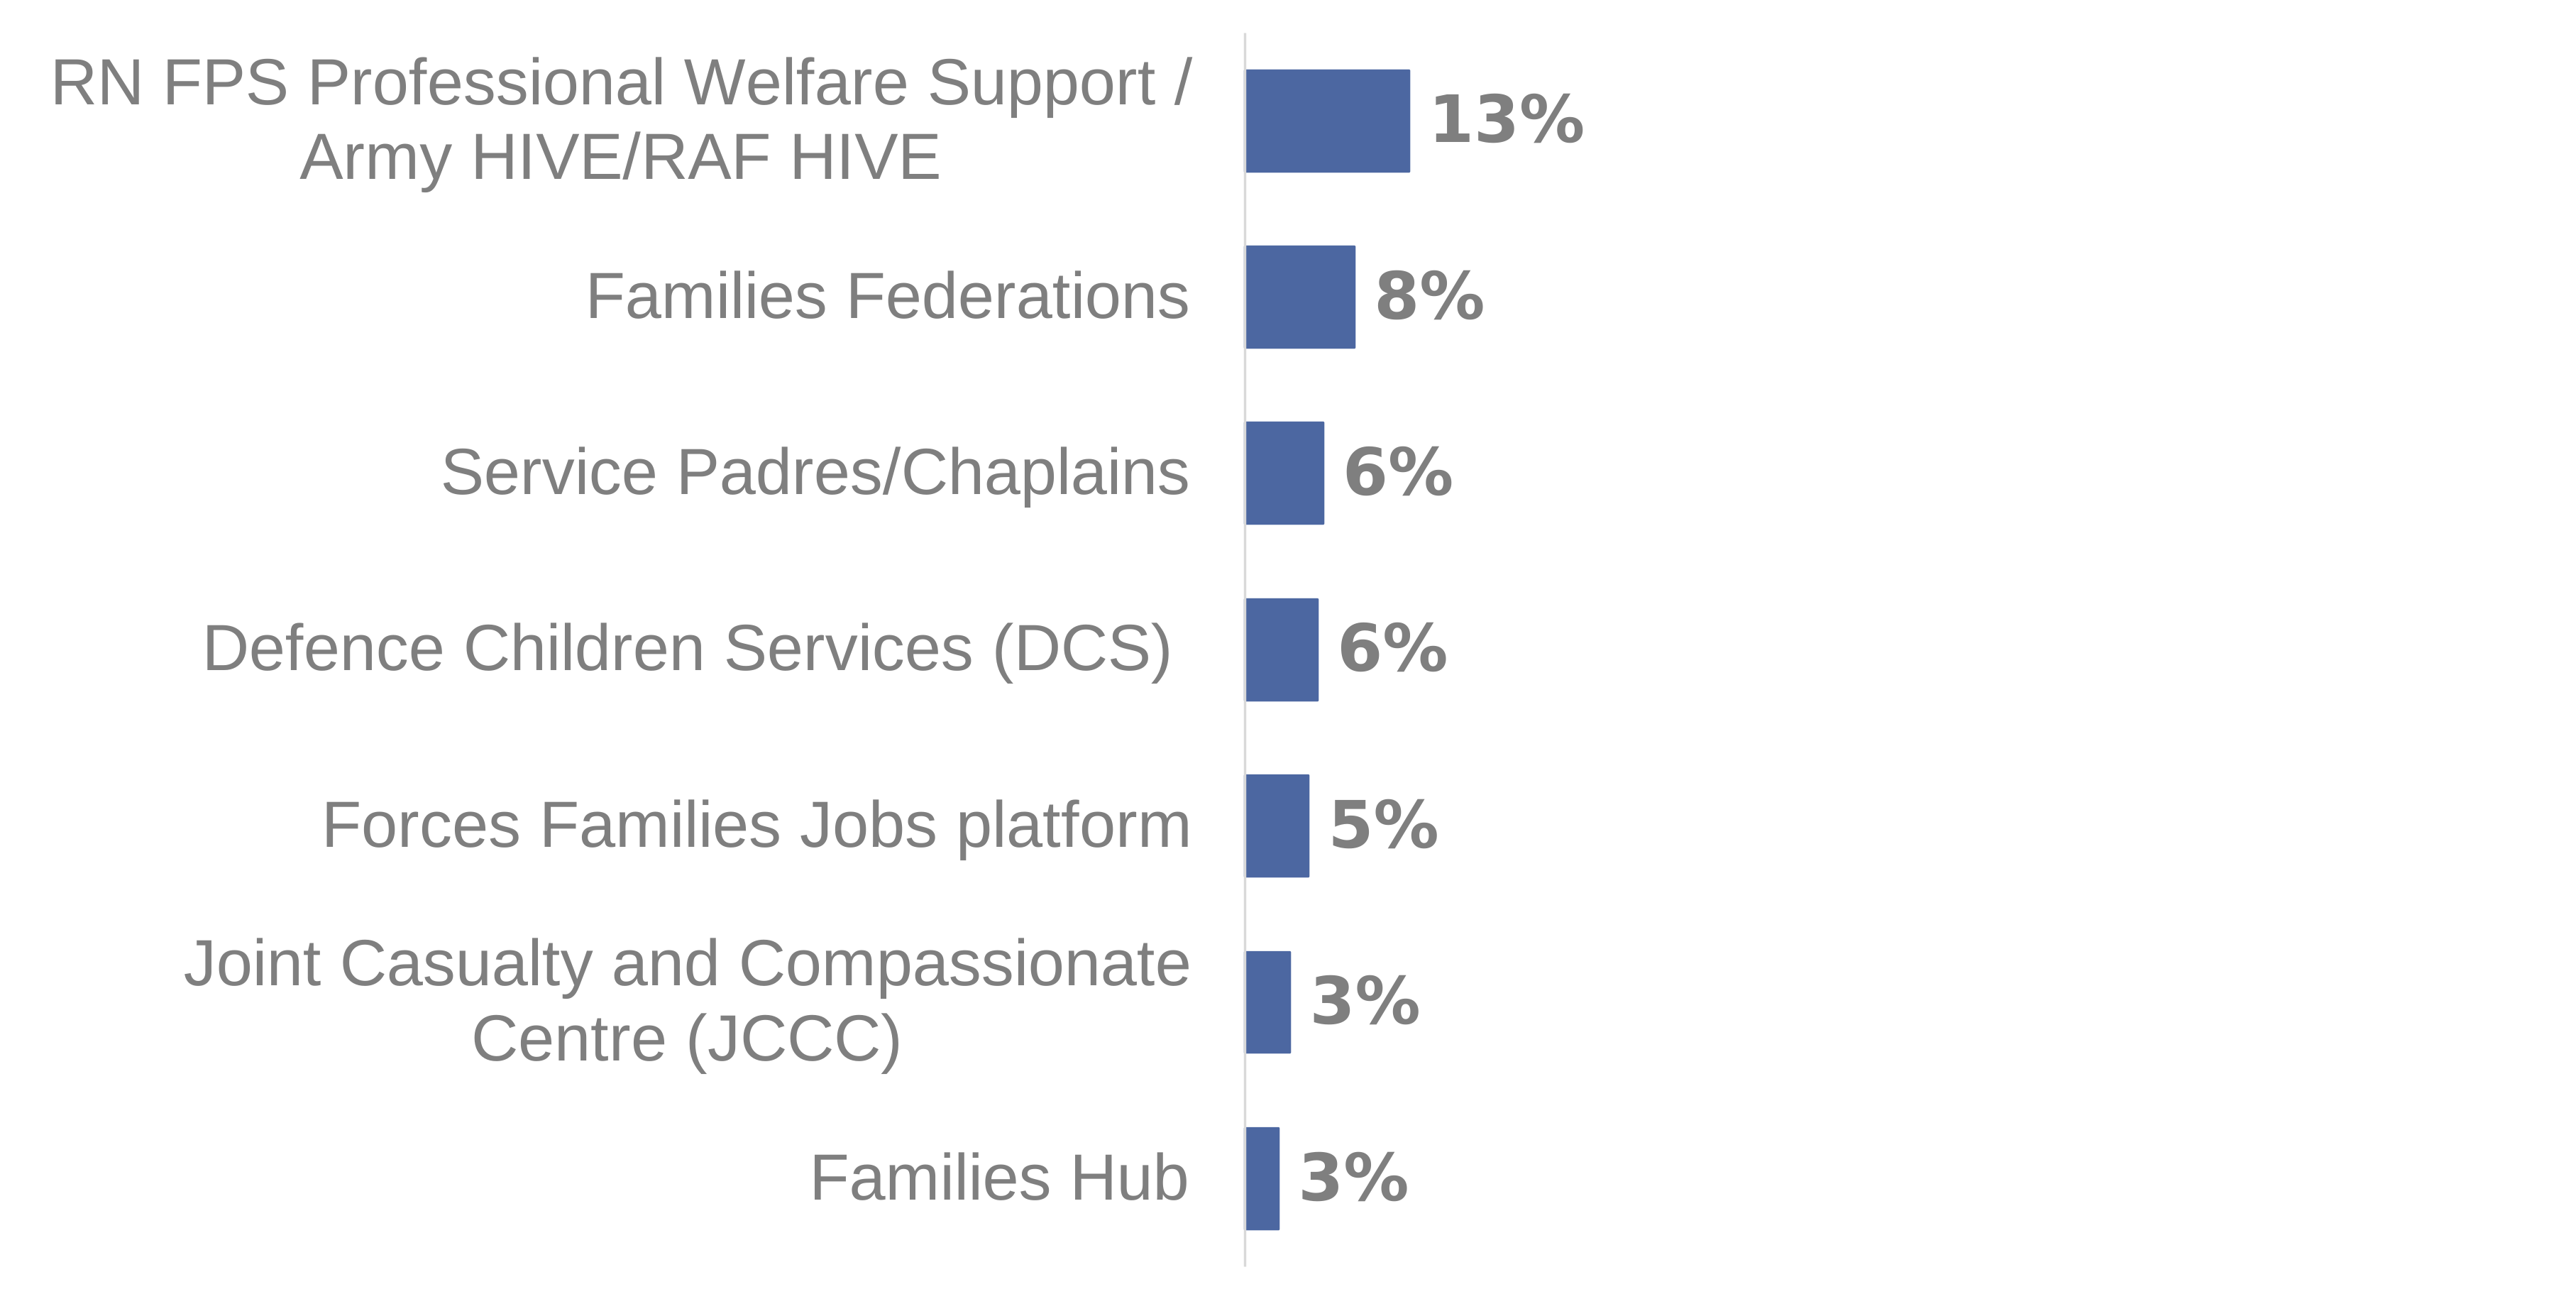
Figure 11.5 is a bar chart showing 13% of spouses used the RN FPS Professional Welfare Support/Army HIVE/RAF HIVE within the past three years whilst 8% of spouses used the single Service Families Federations.
Use of other types of support range from 3% who used the Families Hub to 6% who used Service Padres/Chaplains.
This low use of support may reflect the respondent’s personal interpretation of “use.” For example, they may not consider a visit to a web site as “use,” or their Serving partner may have accessed the support instead. Other support, such as the JCCC, are for exceptional circumstances and so low use is to be expected.
Over the past three years, spouses living overseas made more use of five of the seven types of support listed above compared to those living in England. For example, 23% of overseas spouses used support from DCS, compared to 4% of those living in England. This may reflect more need for advice prior to accompanying their partner overseas; DCS includes the Overseas Education and Supportability Team (OEST).
Use of single Service support is also considerably lower than awareness. For example, within the past three years:
- 19% of RN/RM spouses used the RN Forum
- 10% of Army spouses used the Army Welfare Service
- 13% of RAF spouses used the RAF Personal Support & Social Work Service (SSAFA)
Satisfaction with Service support
Only those respondents who have used the relevant support service within the past three years are asked about their satisfaction with the support. Hence, this section is based on fewer respondents, ranging from 3% (97 respondents) for the Families Hub to 13% (544 respondents) for the RN FPS Professional Welfare Support/Army HIVE/RAF HIVE.
Figure 11.6: Satisfaction with support used
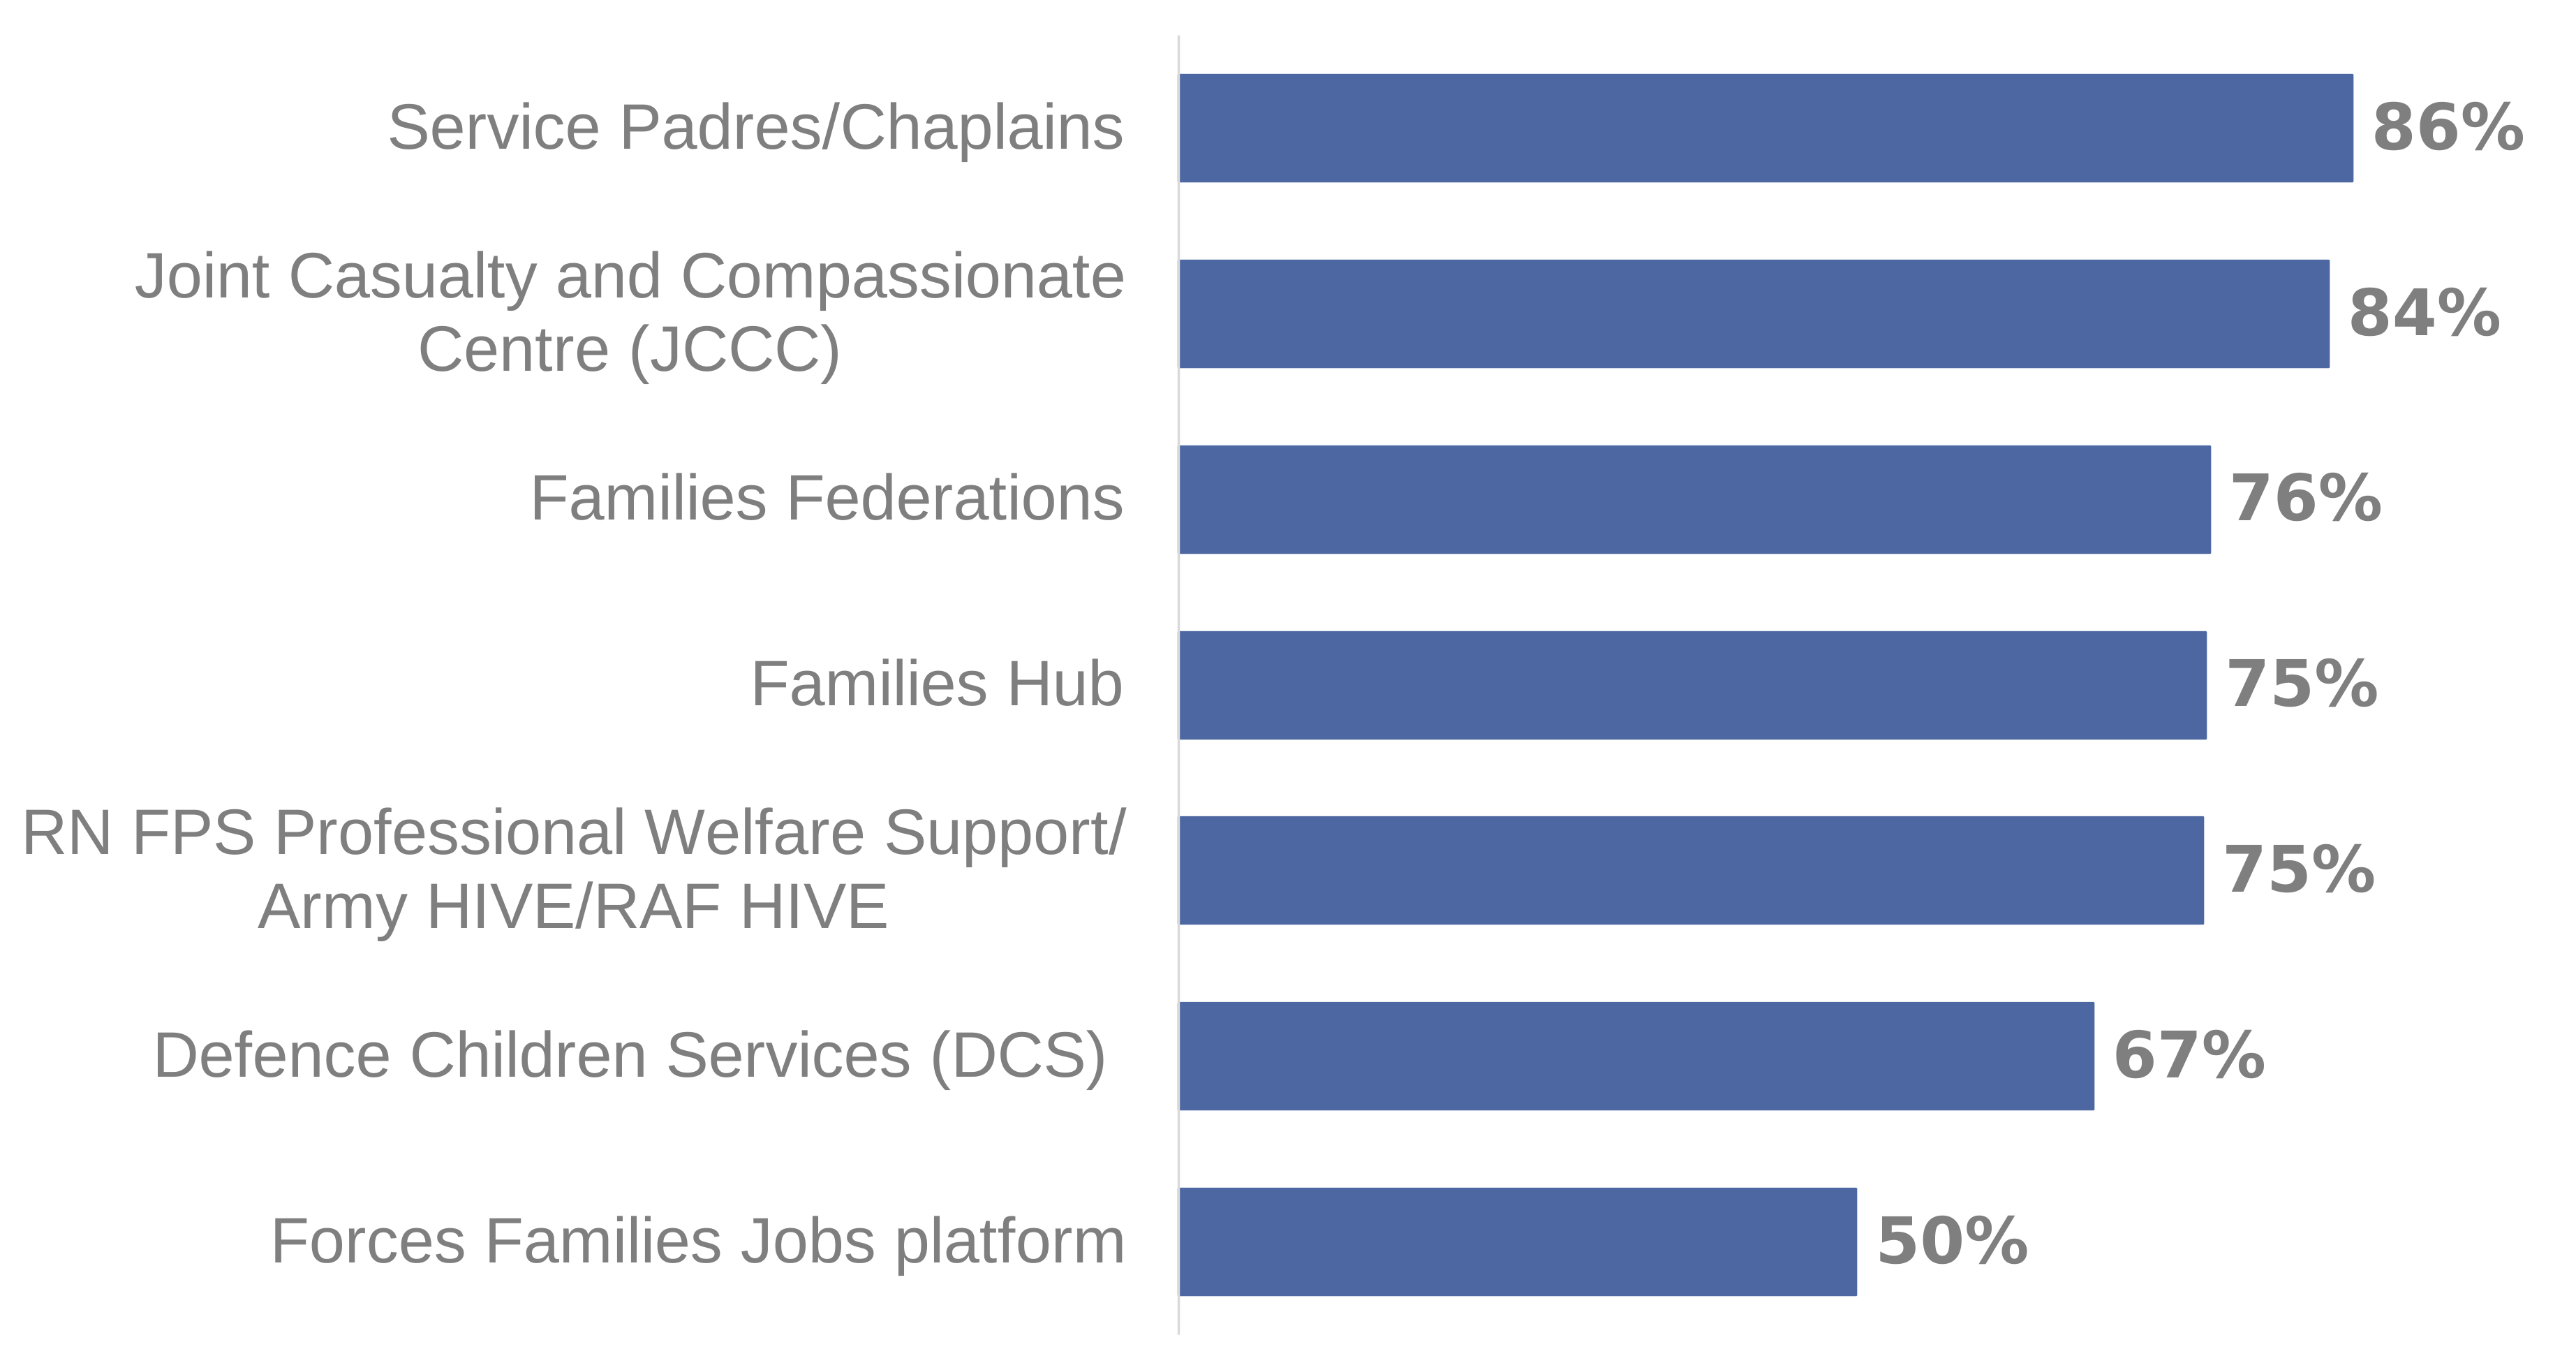
These results are based on those who have used the relevant support service within the past three years.
Figure 11.6 is a bar chart that shows high levels of satisfaction (of at least 80%) amongst those who used Service Padres/Chaplains or the JCCC.
Amongst those who used the RN FPS Professional Welfare Support/Army HIVE/RAF HIVE, three-quarters (75%) are satisfied. Similar levels of satisfaction are reported for the Families Hub and the single Service Families Federations.
Levels of dissatisfaction amongst spouses who used these support services range from 7% for the Families Hub to 22% for the Forces Families Jobs Platform.
Due to the smaller number of respondents, there is less evidence of differences by Service, Rank, or location.
Levels of satisfaction amongst RM/RM spouses who used RN/RM only support ranges from 55% satisfied with the RN Forum (23% dissatisfied) to 93% satisfied with Royal Navy Pastoral Workers (Aggie’s).
Amongst Army spouses who used the Army Welfare Service within the past three years, over three in ten (73%) are satisfied and 11% are dissatisfied.
Levels of satisfaction amongst RAF spouses who used RAF only support ranges from 60% for Station Family Housing Officers (19% dissatisfied) to 87% for Airplay (RAF Benevolent Fund youth support and childcare service).
12. Mobility
This section looks at the impact of moving location on the families of Service personnel.
It revisits some of the questions from the previous sections and compares the responses of those who moved for Service reasons (21%) against those who have not moved (74%) over the last 12 months.
Families who moved for Service reasons
Over the last year, just over one in five Service families have moved for Service reasons (21%), however this varies by Service.
Figure 12.1: Families who moved for Service reasons by Service
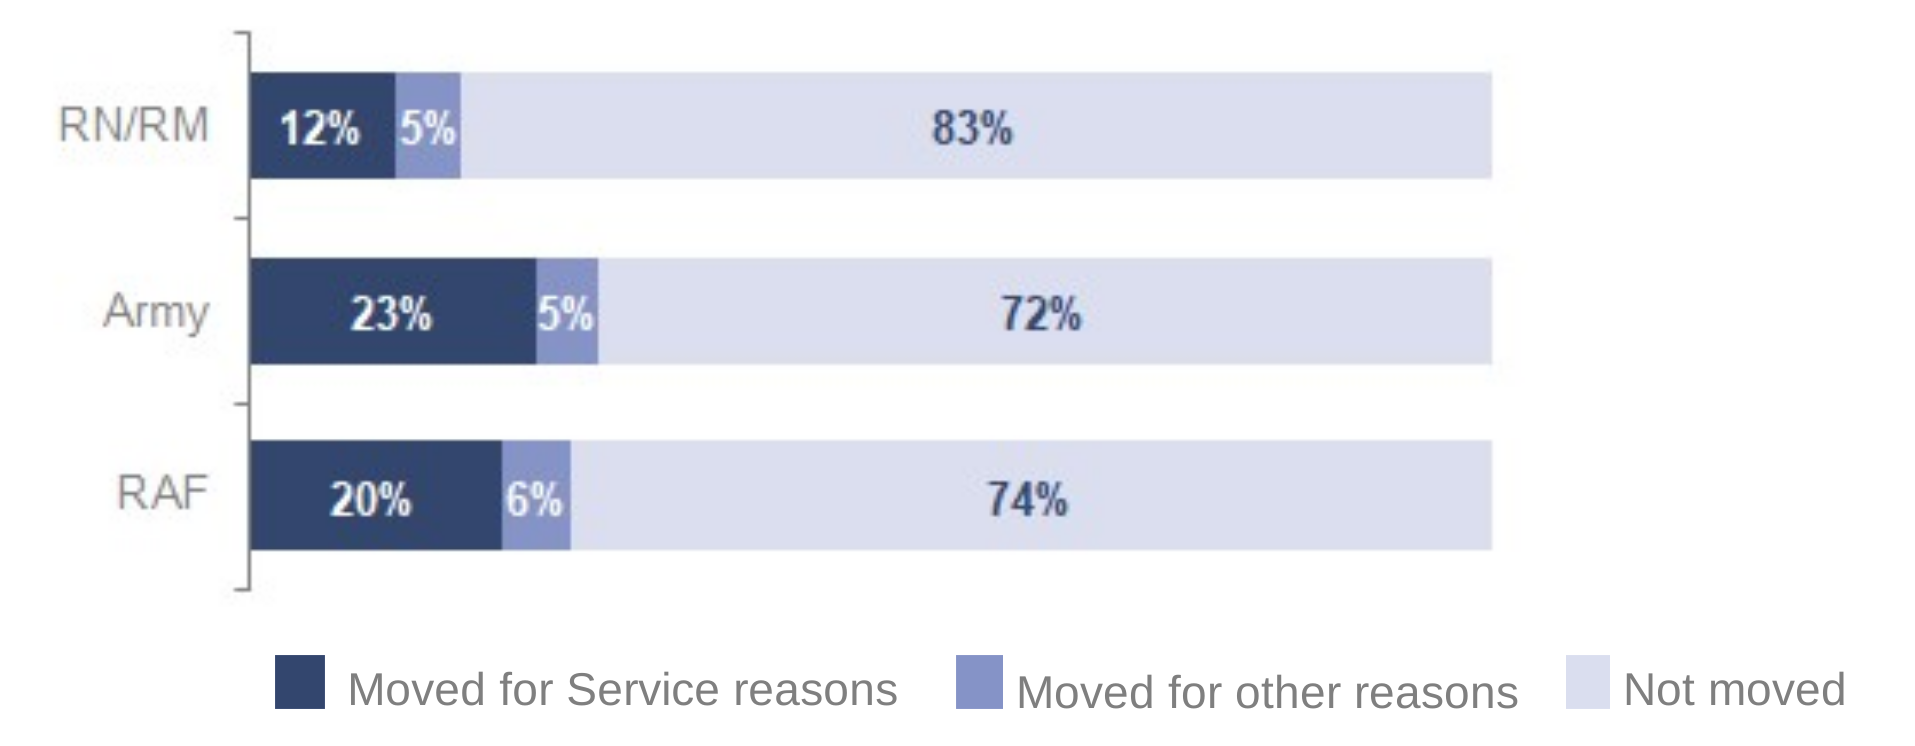
Figure 12.1 shows three stacked bar charts comparing the proportion of families who moved for Service reasons, moved for other reasons and who did not move, by Service.
RN/RM families are less likely to move for Service reasons (12%) than Army (23%) or RAF families (20%).
Levels of mobility have been relatively consistent since 2018. There was an increase in 2020, driven by Army families, due to large numbers of families moving from Germany to the UK as part of the Army Basing Programme.
In this section, “moved” refers to those who have moved for Service reasons.
Separation
Spouses who moved are more likely to be living with their Serving partner (88%) than spouses who did not move (72%). This is to be expected as families who move for Service reasons will typically be accompanying their Serving partner.
Those who moved are less likely to have experienced separation from their partner of more than six months over the past year (7%) than those who did not move (11%).
This may explain, in part, why those who moved feel less negative about separation from their spouse (46%) than those who did not move (53%).
Housing
Families who moved are less likely to own a home (48%) than those who did not move (62%). This may explain why those who moved feel more negative about the prospects of owning a home (30%) than those who did not move (21%).
The majority of families who moved live in Service Family Accommodation (SFA) during the working week.
Figure 12.2: Type of accommodation families live in
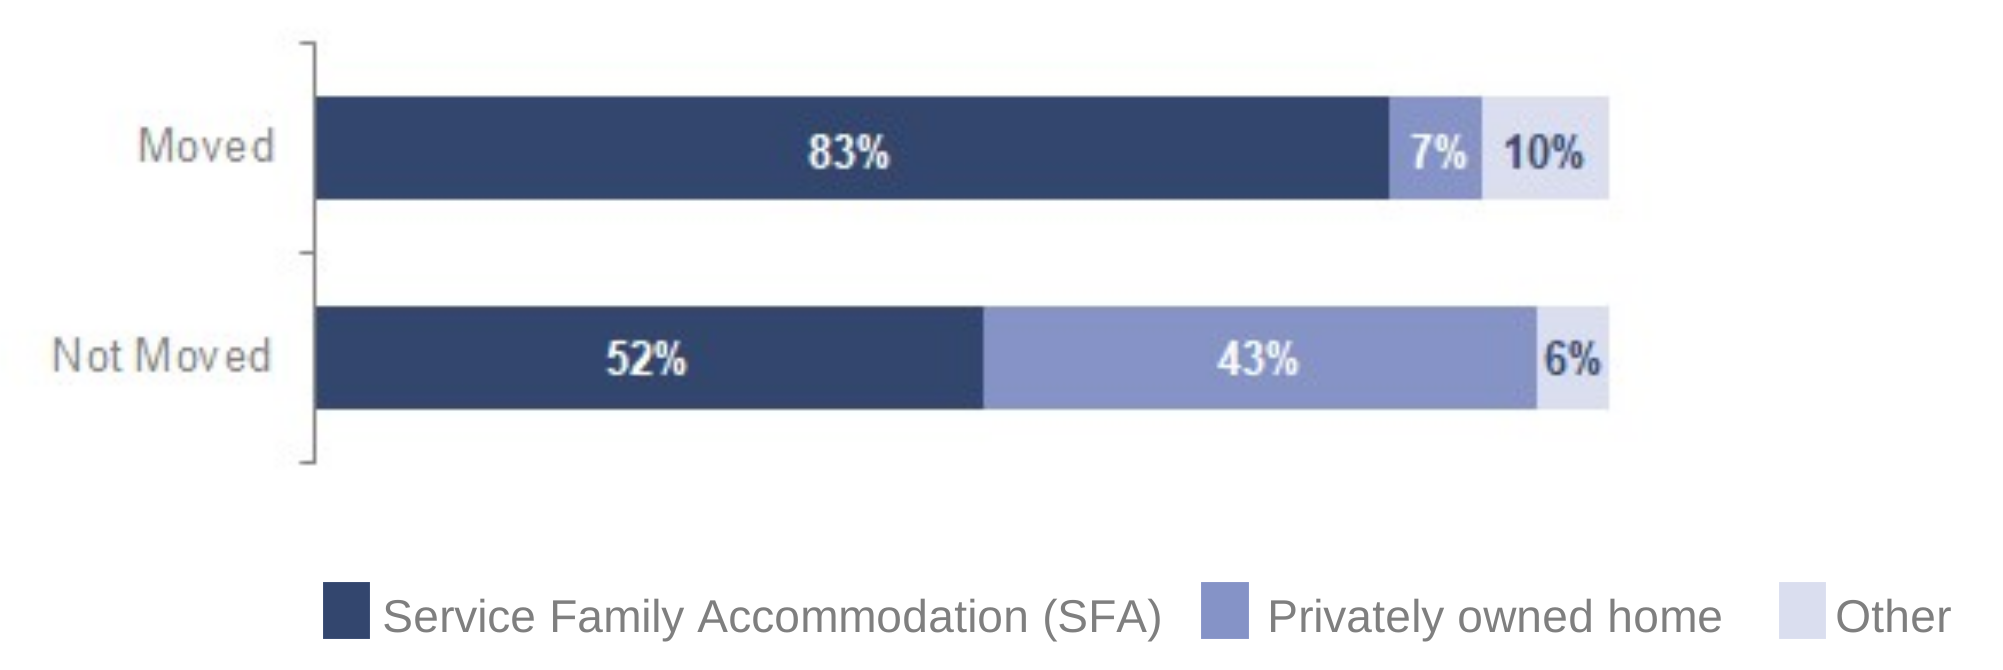
Figure 12.2 contains two stacked bar charts that show a lower proportion of families who moved live in their own home (7%) compared to those who did not move (43%).
A higher proportion of families who moved live in SFA (83%) compared to those who did not move (52%).
This may explain, in part, why those who moved feel more positive about Service provided facilities (44%) than those who did not move (31%).
Service provided facilities includes Service Family Accommodation (SFA).
When asked where they would prefer to live, families who moved express more of a preference for living in SFA (58%) compared to those who did not move (36%).
Correspondingly, those who did not move express more of a preference for living in their own home (60%) compared to those who moved (38%).
However, fewer families who moved are living in their preferred type of accommodation (65%) compared to families who did not move (76%).
Just over three in ten families who moved (31%) are not living in their own home but would prefer to be, compared to 19% of families who did not move.
Employment
Those who moved for Service reasons are less likely to be employed than those who did not move.
Employed refers to those in full-time, part-time and self-employment.
Figure 12.3: Spouses in employment
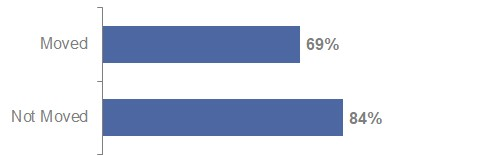
Figure 12.3 is a bar chart that shows 69% of spouses who moved are employed, lower than the 84% of spouses who did not move.
Spouses who moved are more likely to have looked for a job over the past year (54%) than those who did not move (30%).
These factors may contribute to spouses who moved feeling more negative about the effect on their career (64%) than those who did not move (52%).
Access to healthcare
Figure 12.4: Families by ability to access dental treatment
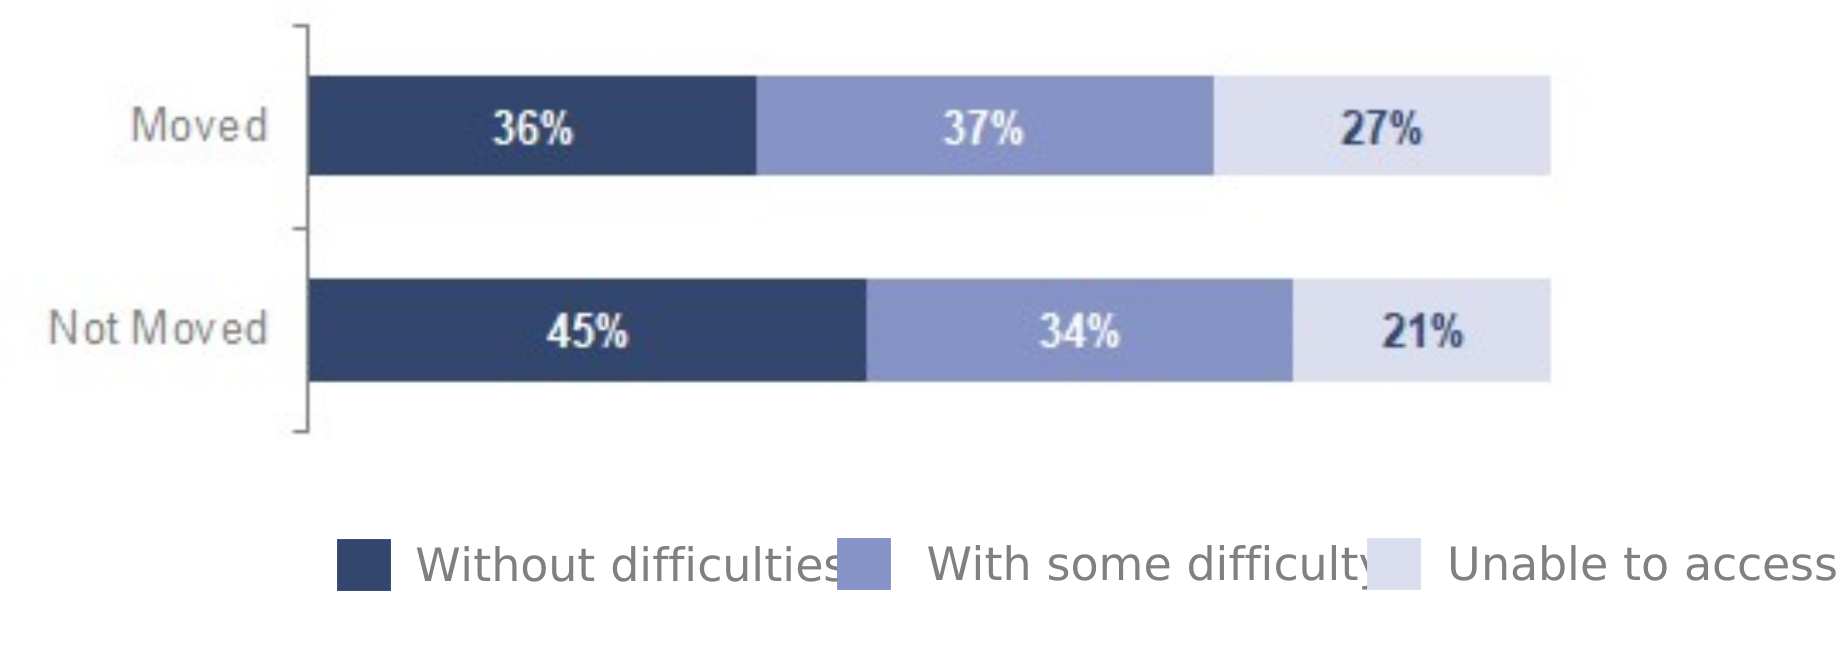
These results are based on those families who needed dental treatment.
Figure 12.4 contains two stacked bar charts showing families who moved are less able to access dental treatment than those who did not move.
Over a quarter of families who moved were unable to access dental treatment (27%) compared to 21% of those who did not move.
Over a third of families who moved were able to access dental treatment without difficulties (36%) compared to 45% of families who did not move.
Childcare
Families who moved are less likely to have children (72%) than those who did not move (79%). However, there is no difference in the proportion of families with school-aged children.
Of those who needed early years childcare, families who moved are less satisfied with access (63%) compared to those who did not move (75%).
Amongst those who needed early years childcare, families who moved are considerably more likely to have a child change early years childcare for Service reasons over the past year (58%) than those who did not move (4%).
Figure 12.5: Families satisfied with the availability of local childcare for their school-aged children
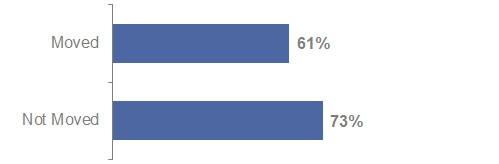
These results are based on those families who needed childcare for school-aged children.
Figure 12.5 is a bar chart that shows families who moved are less satisfied with the availability of local childcare for their school-aged children (61%) than those who did not move (73%).
Families who moved are also less satisfied with the quality of local childcare for their school-aged children (61%) than those who did not move (76%).
Amongst those who needed childcare for school-aged children, just over a third (34%) of those who moved use Wraparound Childcare (WAC). This compares to 48% of those who did not move.
Amongst those with children, over half of families who moved (52%) were unable to access free informal childcare compared to 42% for those who did not move.
Children’s education
Of families with school-aged children, those who moved are less likely to have a child at a state school (61%) compared to those who did not move (82%).
Amongst those with school-aged children, families who moved are more likely to have a child at a Service school (13%) than those who did not move (4%)
Families with school-aged children who moved are also more likely to have a child at an independent boarding school (24%) than those who did not move (7%).
As a result, those who moved are also more likely to be in receipt of Continuity of Education Allowance (CEA), 29% compared to 9% of those who did not move.
Figure 12.6: Families with a child who changed school for Service reasons
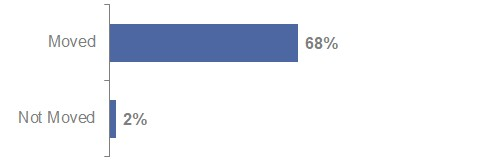
These results are based on those families with school-aged children.
Figure 12.6 is a bar chart that shows, of those with school-aged children, families who moved are much more likely to have a child change school for Service reasons (68%) than those who did not move (2%).
Amongst those with a child who changed school, those who moved were less able to apply at the schools’ normal point of entry (such as reception or year 7) than those who did not move (61% vs. 83%).
Amongst those with a child who changed school and who applied for a place at a state school, just over a fifth of those who moved (22%) were not entirely happy with their school allocation but chose not to appeal. This compares to 5% amongst those who did not move.
Figure 12.7: Families who experienced difficulties with their children’s schooling over the past year
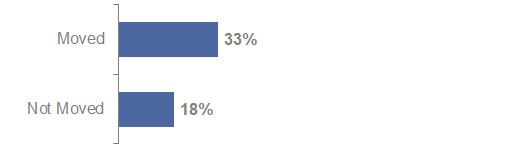
These results are based on those families with school-aged children.
Figure 12.7 is a bar chart that shows, of those with school-aged children, families who moved are more likely to have experienced difficulties with their children’s schooling (33%) compared to those who did not move (18%).
This difference is likely due, at least in part, to the larger proportion of children changing school for Service reasons amongst families who have moved.
Communication and welfare support
There is some evidence that families who moved are more able to access information and are more satisfied with welfare support than those who did not move.
Families who moved are less likely to disagree that they can find out about policies aimed at them and their families (34%) than those who did not move (43%).
Families who moved are also less likely to disagree that they can get the information they need about support offered to them by the Service (33%) than those who did not move (39%).
Figure 12.8: Families satisfied or dissatisfied with the welfare support provided by the Service for them and their families
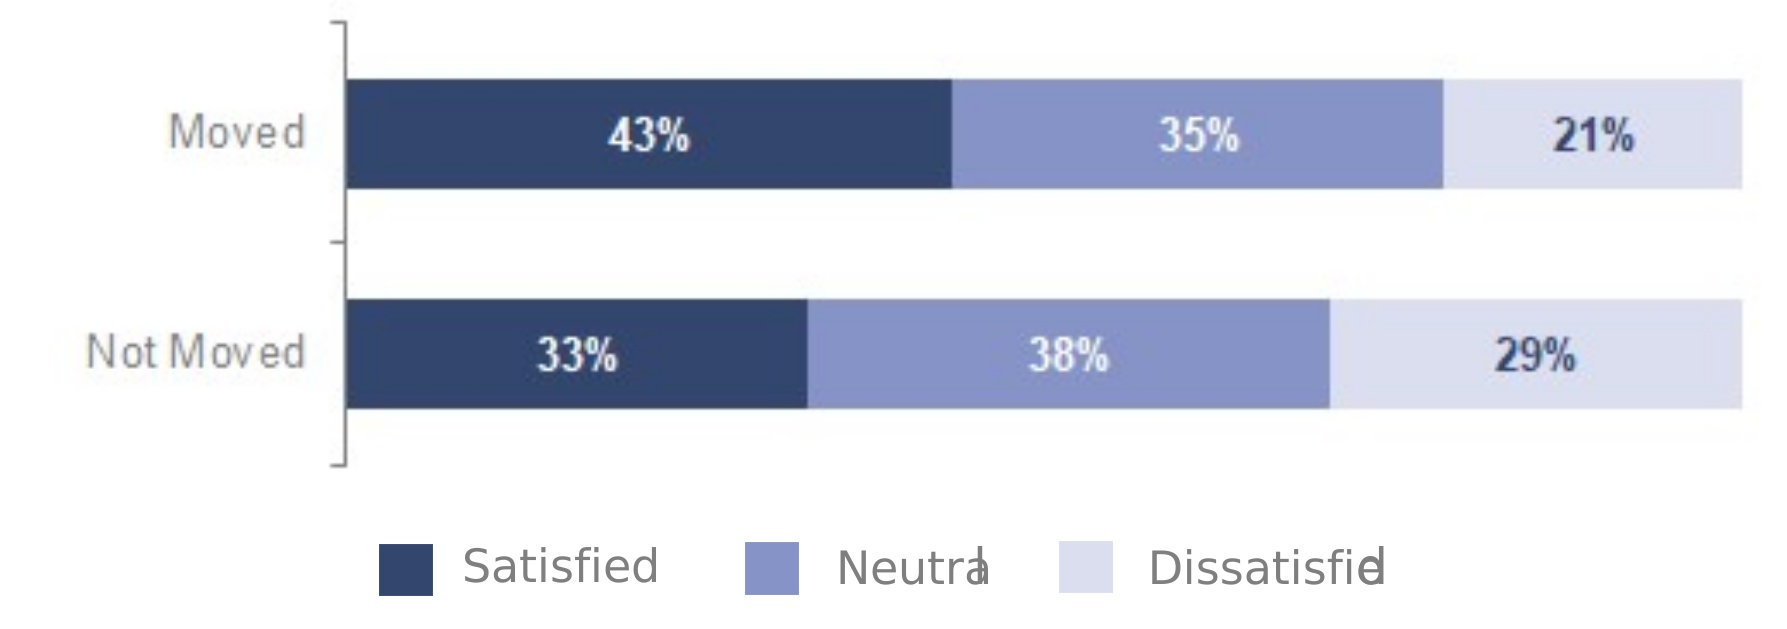
Figure 12.8 contains two stacked bar charts that show 43% of families who moved are satisfied with the support provided to them by the Service. This compares to 33% of families who did not move. Families who moved are also less likely to feel dissatisfied (21%) than those who did not move (29%).
Families who moved are also more satisfied with the support from the Service when their serving partner is absent (28%) than those who did not move (22%).
Attitudes to Service life
Moving home can cause upheaval for Service families, such as finding employment or changing their child’s school. The previous findings show those who moved are less likely to be employed, less likely to own a home and more likely to have difficulties with their children’s education.
These challenges may explain some of the differences between views on Service family life.
Figure 12.9: Spouses who feel negative about aspects of Service life
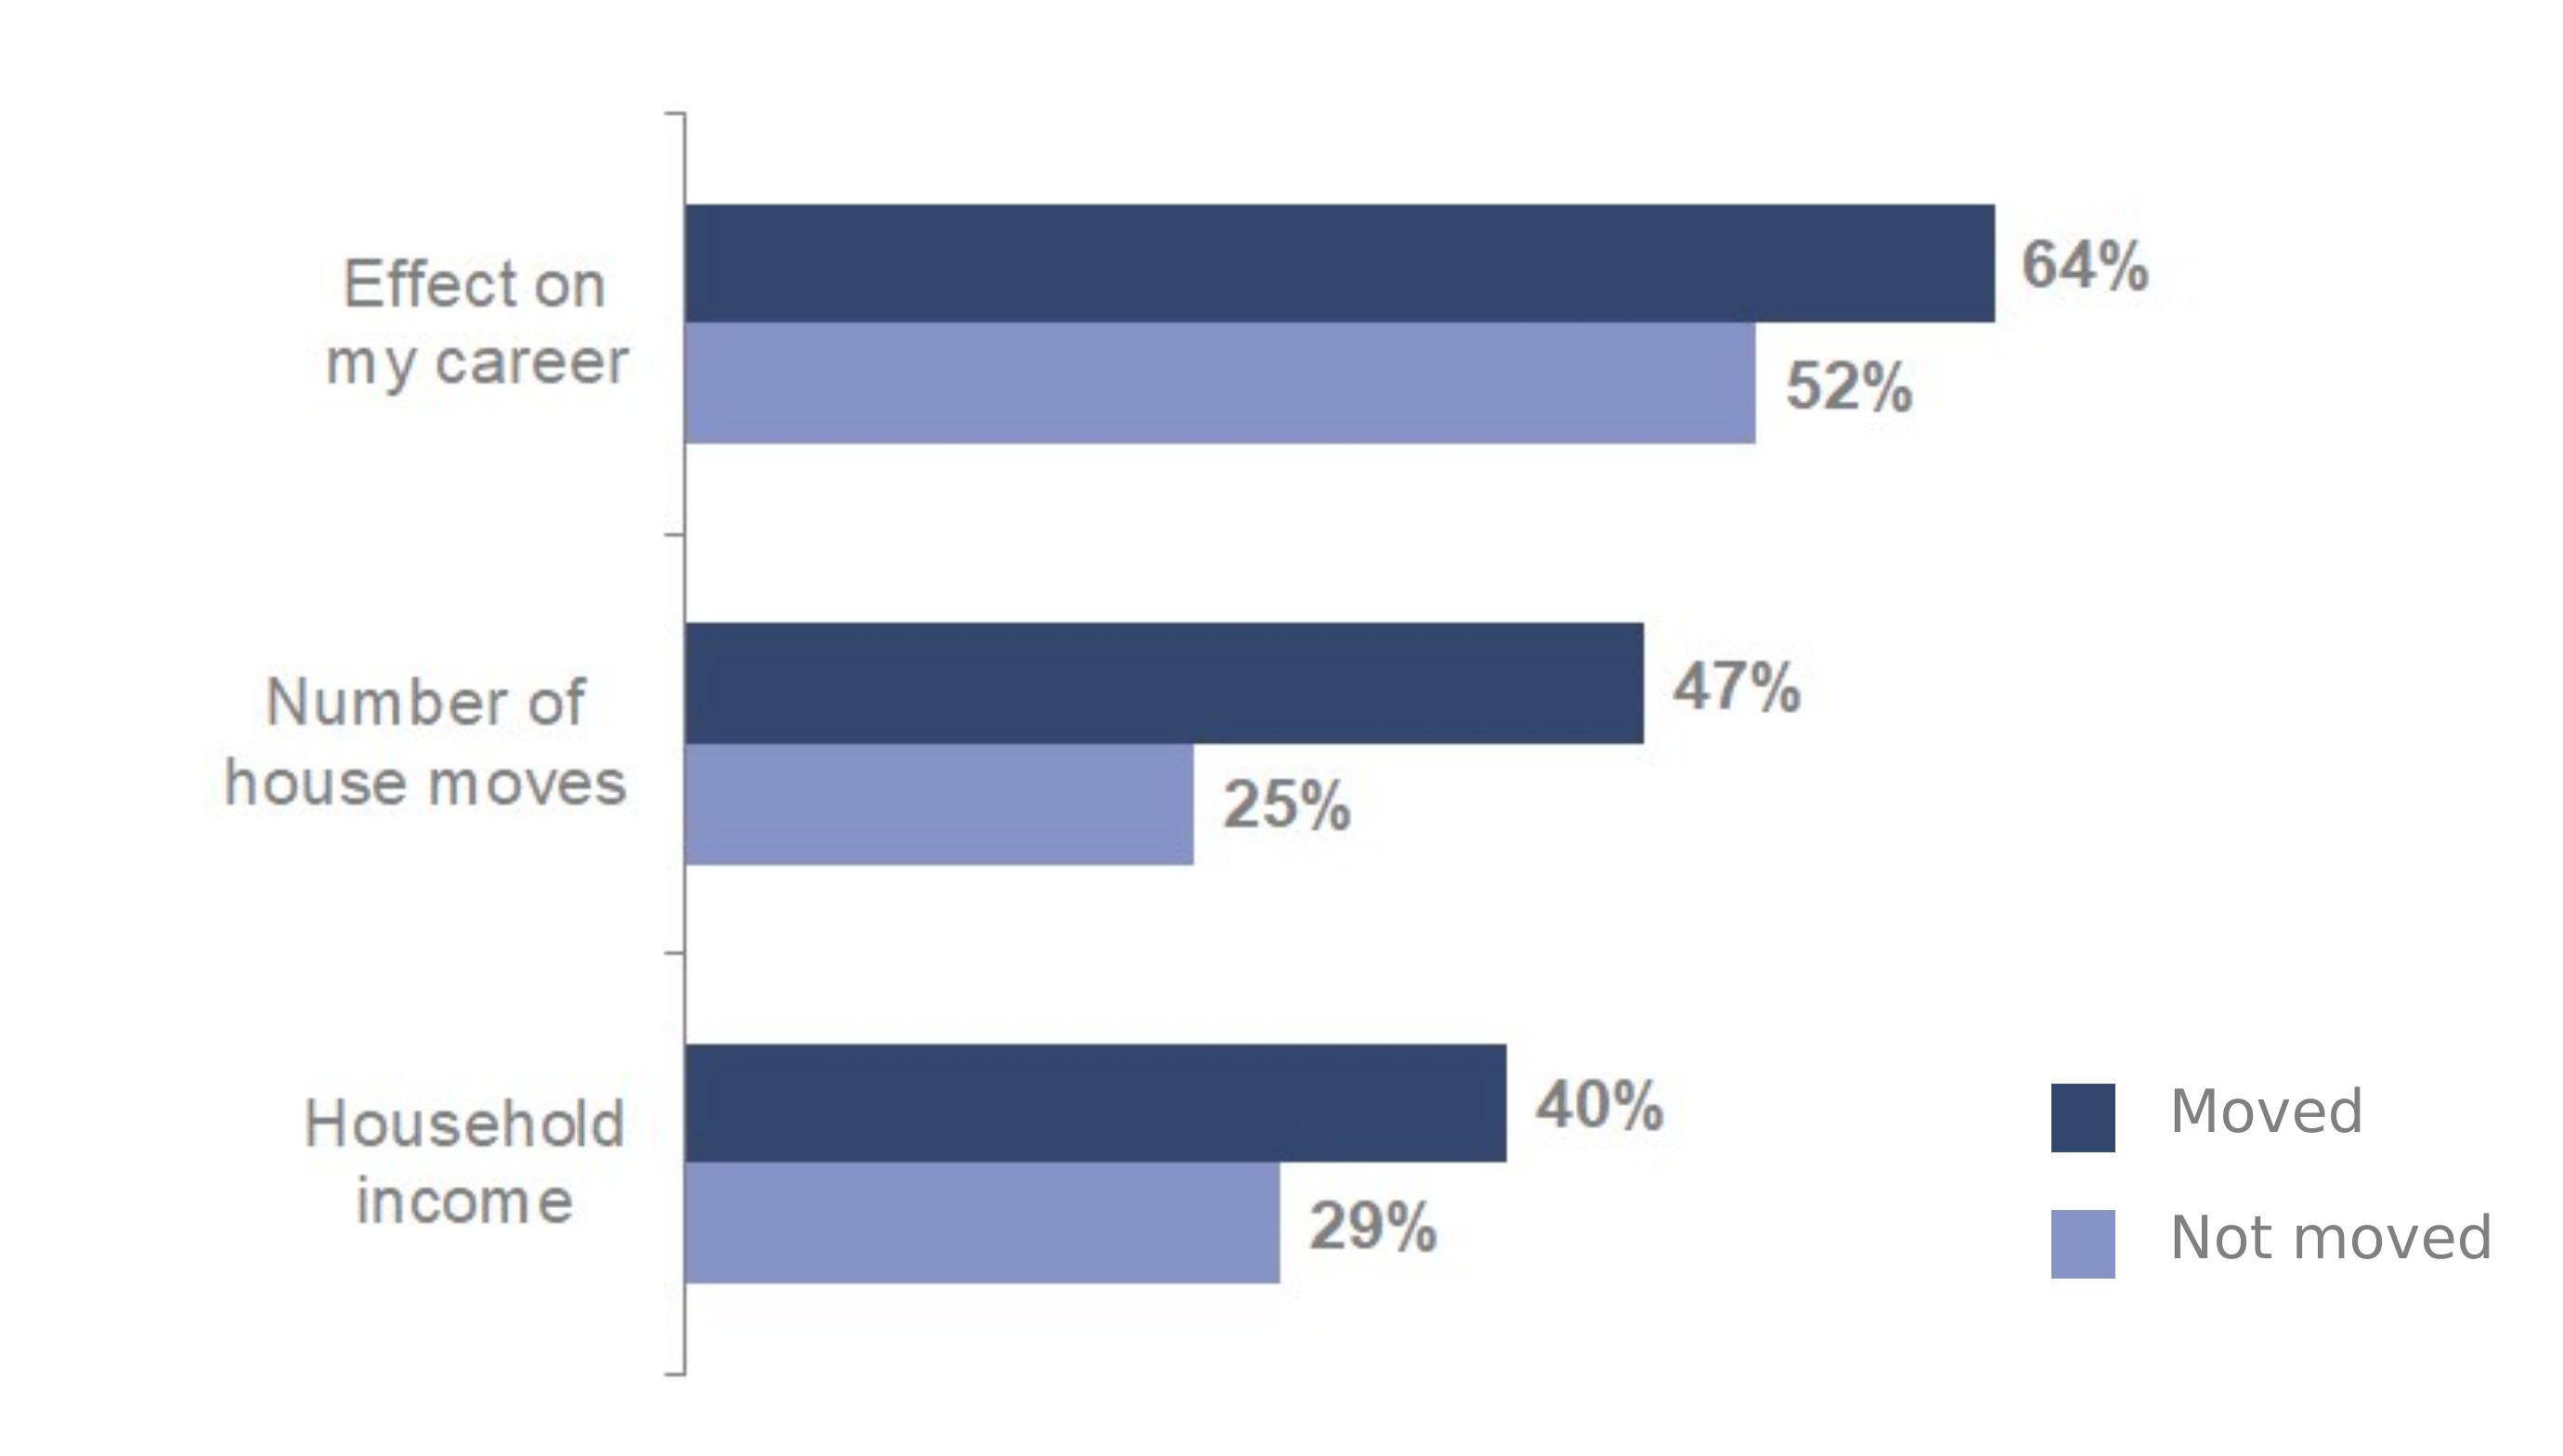
Figure 12.9 is a bar chart that shows spouses who moved feel more negative about the effect on their career, the number of house moves and household income than those who did not move.
Over six in ten spouses who moved feel more negative about the effect on their career (64%) compared to 52% of those who did not move.
Nearly half of spouses who moved feel negative about the number of house moves (47%) compared to 25% of those who did not move.
Four in ten spouses who moved feel negative about household income (40%) compared to 29% of those who did not move.
However, spouses who moved feel more positive about other aspects of Service life such as knowing other military families (52%) and community support for their family (29%) than those who did not move (39% and 21% respectively).
These, together with higher proportions living in SFA, may contribute to spouses who moved being more likely to feel part of the wider Service community.
Figure 12.10: Spouses who agree or disagree they feel part of the wider Service community
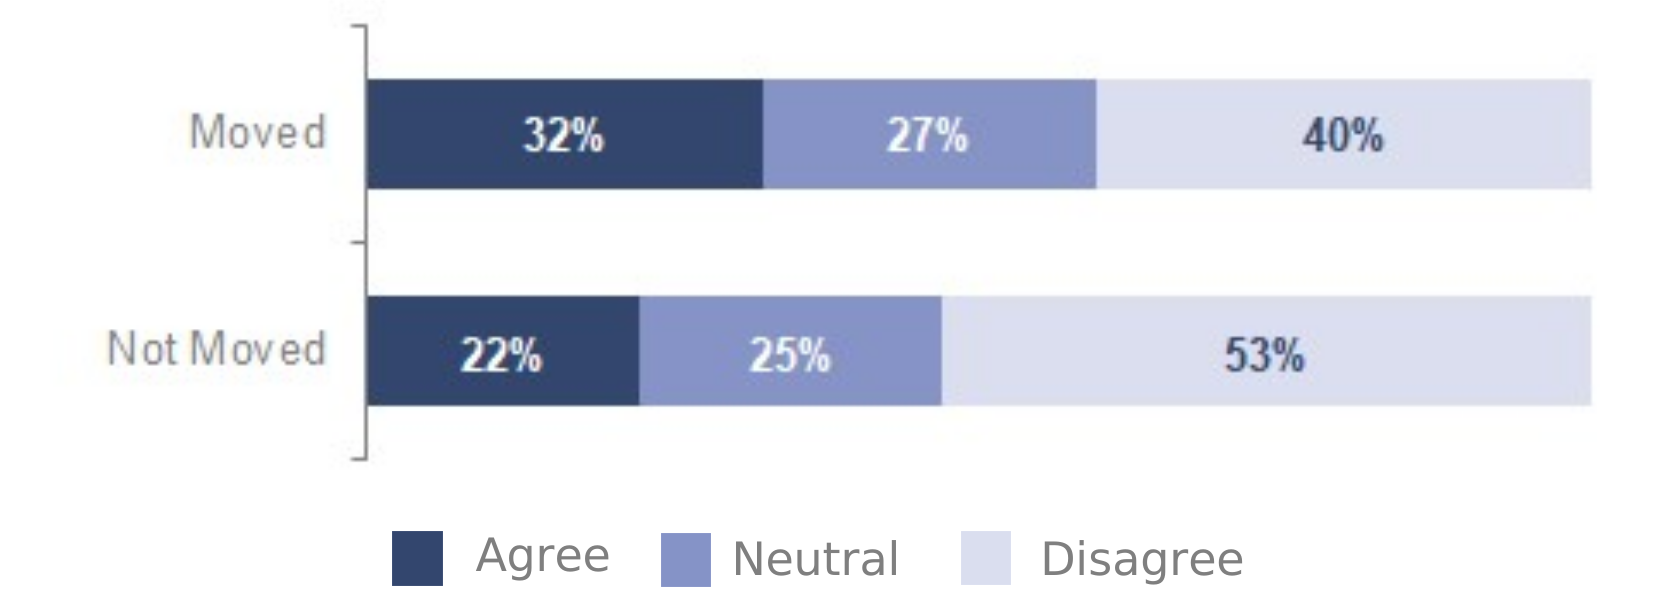
Figure 12.10 contains two stacked bar charts that show 32% of spouses who moved agree they feel part of the wider Service community compared to 22% of those who did not move.
Over half of spouses who did not move, disagree they feel part of the wider Service community (53%) compared to 40% of those who moved.
Spouses who moved feel less negative about separation from their Serving partner (46%) than those who did not move (53%). As mentioned earlier, spouses who moved are more likely to live with their Serving partner and less likely to experience separation of more than six months.
Views and experiences around separation may contribute to spouses who moved feeling more positive about the effect of Service life on their family.
Of those who moved, 27% feel positive about the effect of Service life on their relationship with their partner, compared to 20% of those who did not move.
Of those with children, spouses who moved also feel less negative about the effect of Service life on their children (38%) than those who did not move (48%).
Figure 12.11: Spouses agree or disagree their family benefits from being a Service family
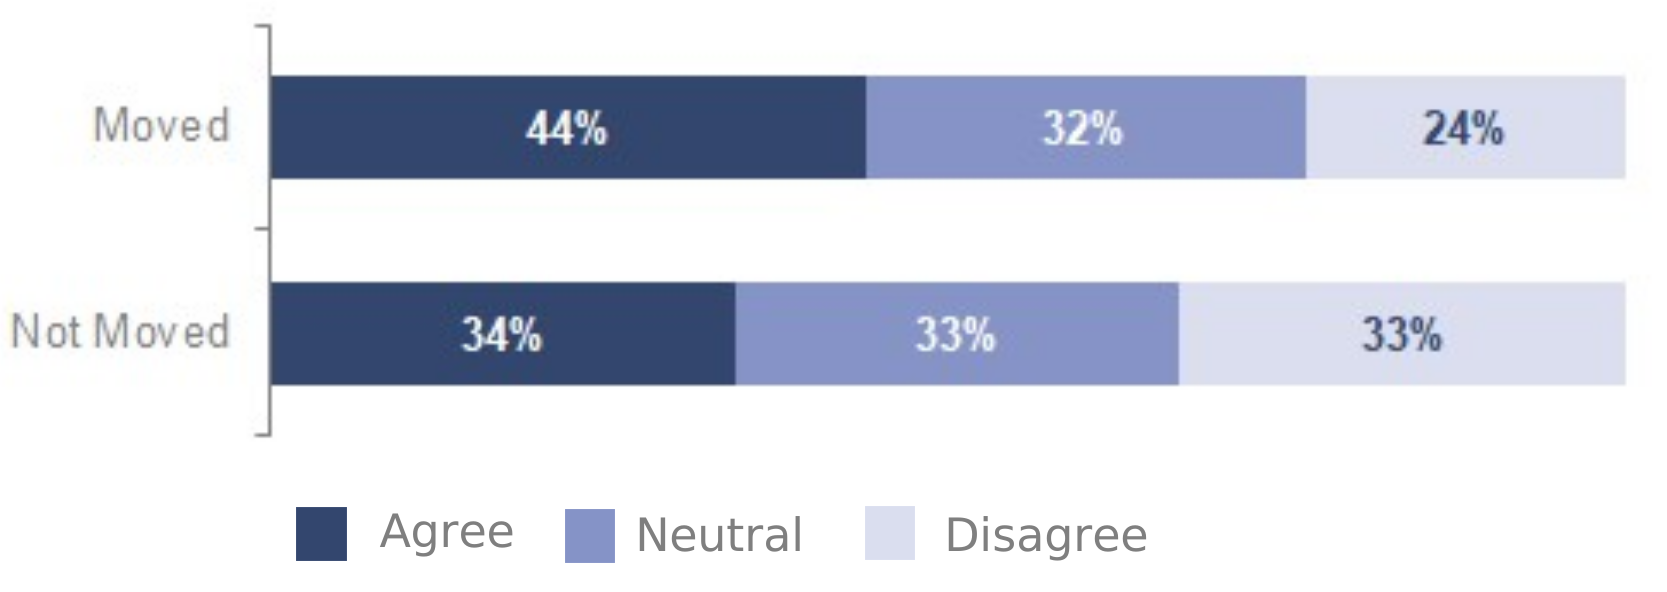
Figure 12.11 is a stacked bar chart that shows spouses who moved are more likely to agree their family benefits from being a Service family (44%) than those who did not move (34%). Families who moved are also less likely to disagree (24%) compared to those who did not move (33%).
This year, those who moved also feel more advantaged about family life (18%) than those who did not move (13%).
Feelings about staying or leaving the Service
Fewer spouses who moved would feel happier if their partner left the Service (28%) than those who did not move (34%).
However, there is no evidence of a difference between the proportions of spouses encouraging their Serving partner to stay or leave for those who moved and those who did not move.
13. Methodology
Target Population
The target population for FamCAS 2026 was the spouses/civil partners of all trained UK Regular Armed Forces personnel including Gurkhas but excluding Special Forces.
There are some single Service differences between further exclusions. RN/RM now conduct a census of all spouses/civil partners of Service personnel so make no further exclusions. Army and RAF exclude personnel on operational deployments or attending training courses at the time the survey sample was drawn from the Joint Personnel Administration system (JPA).
The survey
The single Service Families Surveys were available to complete online from 4th February 2026 until 17th April 2026.
An e-mail invite to the online questionnaire is sent to the Serving person who is asked to forward the invite onto their spouse/civil partner.
Wider methods of communications such as posters and web articles are also used.
The survey is anonymous, the data does not contain any identifier which can be linked back to the Service person or their spouse/civil partner. Individual level data are only available to a small group of civilian researchers working on the analysis and report production.
The sample
The total FamCAS 2026 sample consisted of 27,710 trained Regular Service personnel who were married or in a civil partnership, selected under a (disproportionate) stratified simple random sampling process.
The respondents
4,245 responses were used in the FamCAS 2026 analysis, giving an overall response rate of 15%.
A table of response rates by Service and rank group is provided within the reference tables (Annex B) published alongside this report on the FamCAS webpage.
Weighting methodology and non-response
Due to the sample design and the differences in non-response, responses are weighted by Service, rank and broad location to correct for the bias caused by over or under-representation.
Full details on each weighting class and the corresponding weights are provided within the reference tables (Annex B) published alongside this report on the FamCAS webpage.
Margins of error around estimates
Margins of error for each question can be found in reference tables published alongside this report on the FamCAS website.
Estimates at the Tri-Service level typically have a margin of error within 2%, whilst for each Service the margin of error is usually within 4%. Margins of error of estimates for Officer and Other Rank families by Service are typically around 5%.
Margins of error will be higher for smaller subsets. For example, estimates for families living in Wales can have a margin of error of around 8%. The response rate for Wales is a little lower than the overall response rate, but this is coupled by the fact that there are fewer Service families living in Wales than England. As such, about 150 families living in Wales responded to the survey leading to higher margins of error around estimates.
Analysis and statistical tests
Attitudinal questions in the questionnaires have generally been regrouped to assist in analysing results and to aid interpretation. For example, questions with a 5-point satisfaction response will be regrouped to a 3-point scale. This is done by grouping “Very Satisfied” and “Satisfied” into a single “Satisfied” group and similarly for dissatisfied.
Missing values, where respondents have not provided a valid response, or ‘don’t know’ or ‘not applicable’ responses have not always been included in the analysis. If they have been excluded, then this will be detailed in the table footnotes.
Some questions are filtered to exclude invalid responses. For example, questions about children’s schooling will be subset to those respondents with school-aged children. These “subsets” are detailed in the table footnotes.
As a result of these exclusions the unweighted counts (or ‘n’) will vary from question to question and these are shown within the reference tables published alongside this report on the FamCAS webpage.
Estimated proportions are rounded to the nearest whole number, as a result they will not always sum to 100%. Similarly, percentages shown on charts within the report may not always sum to 100%. Any combined results are summed from unrounded values. As such, combined results may not always correspond with sums from published tables.
Where applicable, Z tests at a 1% alpha level are used to test whether 2026 results are significantly different to previous years. A statistically significant difference means that there is enough evidence that the change observed is unlikely to be due to chance variation (less than a 1% probability that the difference is the result of chance alone).
Format of the reference tables
Reference tables are published separately to the report on the FamCAS webpage.
Each reference table refers to a question asked in the survey and includes estimates of the proportion of the population by each response category. Each table provides results by Service and by Officer/Other Rank with the total column for all ranks.
Excel tables are also available with additional breakdown of the spouse/civil partners broad location (England, Northern Ireland, Scotland, Wales & Non-UK), which are provided at Annex C.
Section 10 of Annex B provides a subset of tables that compare results of those who moved for Service reasons over the past year against those who did not move, with results presented by Service.
14. Further Information
Rounding
Where rounding has been used, totals and sub-totals have been rounded separately and so may not equal the sums of their rounded parts.
Revisions
There are no revisions to this publication of FamCAS.
Corrections to the published statistics will be made if errors are found, or if figures change because of improvements to methodology or changes to definitions. When making corrections, we will follow the Ministry of Defence Statistics, revisions and corrections policy. All corrected figures will be identified by the symbol [r], and an explanation will be given of the reason for and size of the revision. Corrections which would have a significant impact on the utility of the statistics will be corrected as soon as possible, by reissuing the publication. Minor errors will also be corrected, but for convenience these corrections may be timed to coincide with the next release of the publication.
Contact us
The Analysis Directorate welcomes feedback on our statistical products. If you have any comments or questions about this publication or about our statistics in general, you can contact us as follows:
Analysis Directorate (Surveys)
Email: Analysis-Surveys-Enquiries@mod.gov.uk
If you require information which is not available within this or other available publications, you may wish to submit a Request for Information under the Freedom of Information Act 2000 to the Ministry of Defence.
If you wish to correspond by mail, our postal address is:
Analysis Directorate (Survey) Ministry of Defence, Main Building, Floor 3 Zone M, Whitehall, London, SW1A 2HB
For general MOD enquiries, please call: 020 7218 9000