RRCGB 2025: Injury severity
Published 30 July 2026

© Crown copyright 2026
This publication is licensed under the terms of the Open Government Licence v3.0 except where otherwise stated. To view this licence, visit nationalarchives.gov.uk/doc/open-government-licence/version/3 or write to the Information Policy Team, The National Archives, Kew, London TW9 4DU, or email: psi@nationalarchives.gov.uk.
Where we have identified any third party copyright information you will need to obtain permission from the copyright holders concerned.
This publication is available at https://www.gov.uk/government/statistics/reported-road-casualties-great-britain-final-results-2025/rrcgb-2025-injury-severity
About this chapter
This chapter provides an overview of reported road casualties in Great Britain in 2025, and shows how casualty numbers and rates have changed over time for different groupings of casualty severity (fatalities, killed or seriously injured (KSI) casualties, and casualties of all severities). Figures for injured casualties are adjusted to account for changes in police injury-reporting practices over time, which are available from 2004, with a longer time series available for fatality data.
This chapter considers casualty patterns both in terms of absolute counts and in terms of casualty rates taking into account distance travelled. Casualty rates are calculated by dividing counts by vehicle mileage.
1. Main findings
Based on data on road collisions in Great Britain reported to the police, in 2025:
-
There were 1,538 reported road fatalities, 29,918 killed or seriously injured (KSI) casualties and 127,883 casualties of all severities.
-
Road fatalities remain substantially below historic levels. Fatalities have more than halved since 2004 and remain below pre-pandemic levels, with 2025 recording one of the lowest numbers of fatalities outside the pandemic period, a decline of 4% from 1,602 fatalities in 2024.
-
KSI casualties have fallen by around a third since 2004. However, most of this reduction occurred before 2010 and KSI numbers have remained relatively stable over the past decade, excluding the period affected by the pandemic. The 2025 figure was an increase of 4% from 28,876 in 2024.
-
Casualties of all severities have fallen by over half since 2004. Unlike fatalities and KSI casualties, the long-term decline in all casualties has remained relatively steady, though 2025 showed little change from 128,272 in 2024.
-
Casualty rates per mile travelled have generally declined over time. This indicates that improvements in road safety have occurred despite long-term growth in traffic volumes. In 2025, there were 4 fatalities, 86 KSI casualties and 369 casualties of all severities per billion vehicle miles travelled.
-
Data from police forces using injury-based reporting systems show that most casualties are classified as slight injuries, while less serious injuries account for the majority of serious injuries. More severe injuries such as fractures, internal injuries and serious head injuries are less common but represent a substantial proportion of serious casualties.
Further breakdowns and analysis are available in the sections below and in the accompanying data tables and factsheets.
2. Fatalities
2.1 Numbers
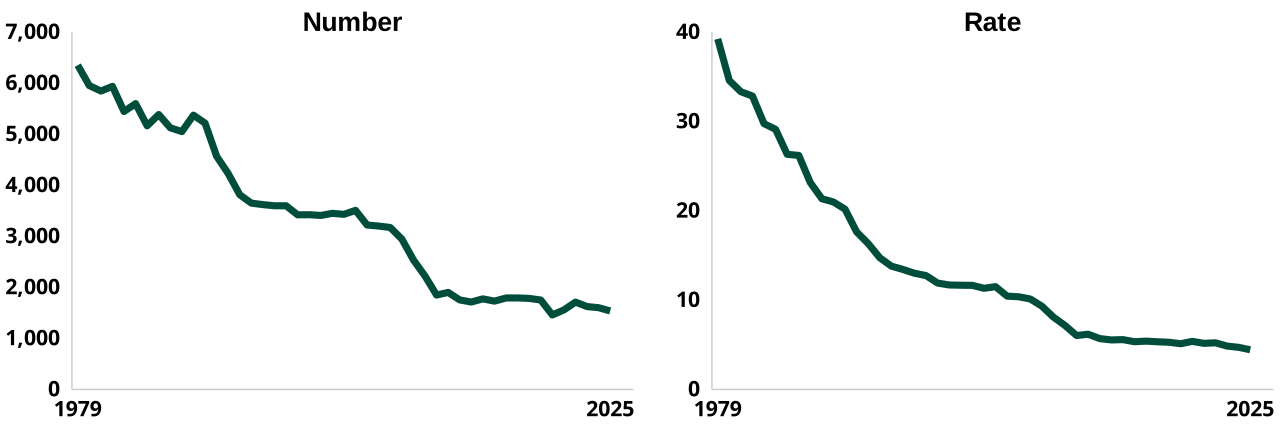
Chart 1 (left) shows that reported road fatalities in Great Britain have fallen substantially since 1979. In 2025 there were 1,538 reported road fatalities, a decline of 4% from 1,602 in 2024.
As casualty numbers can fluctuate from year to year, trends over longer periods provide a more reliable indication of underlying changes:
-
Since 1979, there has been a reduction of around three quarters and since 2004, fatalities have more than halved.
-
The largest decreases in fatalities between 1979 and 2025 occurred from the late 1980s to the early 2010s, with fatalities falling below 2,000 for the first time in 2010.
-
Since 2010, fatalities have remained relatively stable, aside from the sharp fall in 2020 during the coronavirus pandemic.
-
Since 2021, fatalities have remained below pre-pandemic levels with the 2025 figure being the lowest recorded outside of the pandemic period.
2.2 Rates
Chart 1 (right) shows that reported road fatalities per billion vehicle miles in Great Britain have fallen substantially since 1979 [footnote 1]:
-
Fatalities per billion vehicle miles fell from 39 in 1979 to 4 in 2025.
-
The largest decreases in the fatality rate occurred between 1979 and 2010, after which the rate remained relatively stable.
-
Over the last decade, the fatality rate has declined from 5 in 2015 to 4 in 2025
Chart 1: Reported road fatalities and fatalities per billion vehicle miles, Great Britain, 1979 to 2025 RAS0102
3. Killed or seriously injured
Casualties are broken down into fatalities (people killed in road collisions), and those injured (further split into seriously and slightly injured based on type of injury sustained). Killed and seriously injured casualties are commonly grouped together as ‘KSIs’.
The Road Safety Strategy has set a target to reduce KSI casualties by 65% by 2035, compared to the 2022 to 2024 average. For more information on the targets and the accompanying safety performance indicators, see the chapter on Safety Performance indicators.
3.1 Numbers
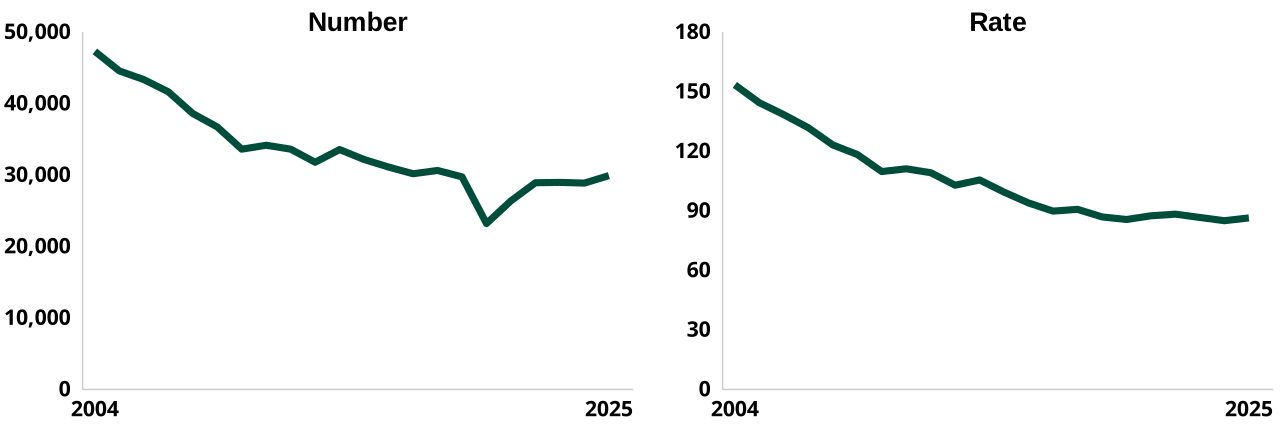
In 2025, there were 29,918 KSI casualties in reported road collisions in Great Britain, an increase of 4% from 28,876 in 2024. This increase should be interpreted with caution as it is too early to determine whether this represents a shift in the longer-term trend.
Chart 2 (left) shows that reported killed or seriously injured (KSI) casualties in Great Britain have fallen since 2004:
-
KSI casualties have decreased by around a third between 2004 and 2025.
-
Most of the decrease in KSI casualties over this period occurred between 2004 and 2010, after which levels remained relatively stable until the sharp fall in 2020 during the COVD-19 pandemic. Since 2021, KSI casualties have returned to around pre-pandemic levels.
3.2 Rates
Chart 2 (right) shows that reported killed or seriously injured (KSI) casualties per billion vehicle miles in Great Britain have fallen since 2004:
-
KSI casualties per billion vehicle miles fell from 153 in 2004 to 86 in 2025, a reduction of around half.
-
The KSI casualty rate increased slightly from 85 per billion vehicle miles in 2024 to 86 in 2025 but has been broadly stable in recent years
Chart 2: Reported killed or seriously injured (KSI) casualties and KSI casualties per billion vehicle miles, Great Britain, 2004 to 2025 RAS0102
4. All casualties
4.1 Numbers
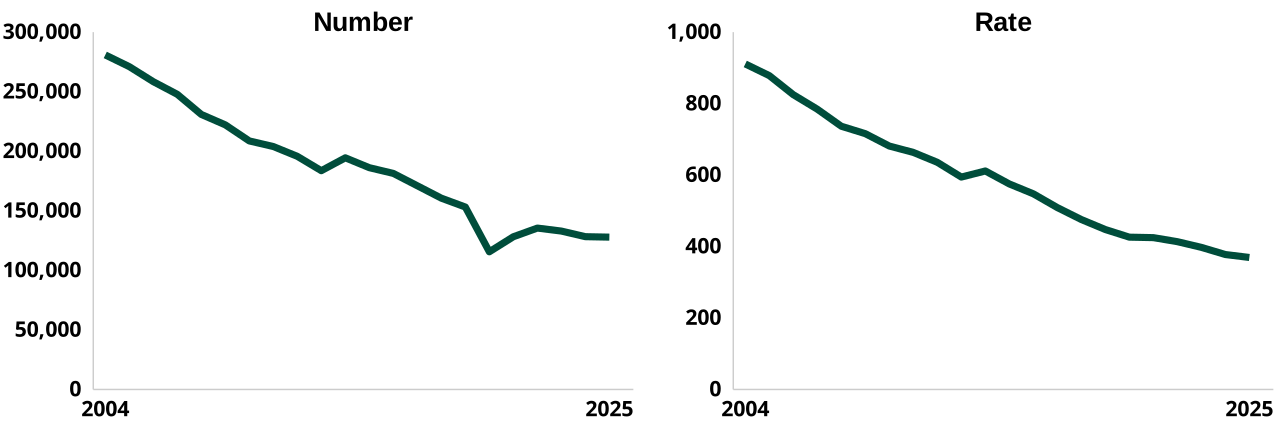
In 2025, there were 127,883 reported road casualties of all severities, little change from 128,272 in 2024.
Chart 3 (left) shows that reported road casualties of all severities in Great Britain have fallen substantially since 2004, with a steady downward trend:
-
Casualties of all severities have fallen by over half in this period.
-
Casualties fell sharply in 2020 during the coronavirus pandemic and have remained below pre-pandemic levels since 2021.
4.2 Rates
Chart 3 (right) shows that reported casualties of all severities per billion vehicle miles in Great Britain have fallen since 2004:
- Casualties of all severities per billion vehicle miles fell from 911 in 2004 to 369 in 2025, a reduction of over half.
Chart 3: Reported road casualties of all severities and road casualties of all severities per billion vehicle miles, Great Britain, 2004 to 2025 RAS0102
5. Injury severity and type
Historically, non-fatal casualties in STATS19 were classified as either seriously or slightly injured been based on the judgement of recording police officers, using an agreed definition of serious injury. In recent years, many police forces have adopted injury-based reporting systems.
Under these systems, officers record the injuries sustained by a casualty from a predefined list and overall casualty severity is determined from the most severe injury recorded. This provides more detailed information on the severity and nature of injuries than was previously available through police-reported road casualty statistics. Detailed injury information is expected to become increasingly important as injury-based reporting systems are adopted more widely across Great Britain.
The figures presented in this section are based on casualties reported by police forces using injury-based reporting systems. As these systems are not yet used by all police forces, the results do not represent a complete Great Britain picture and should be interpreted as indicative of the types and severity of injuries sustained in reported road collisions rather than national totals.
5.1 Detailed injury severity
While serious casualties are commonly presented as a single category within official statistics, data from injury-based reporting systems show that serious injuries range from fractures and deep lacerations to life-threatening injuries such as severe head, chest or spinal injuries. Serious injuries can be subdivided into very serious, moderately serious and less serious injuries:
- Within the serious injury category, less serious injuries accounted for the largest share, followed by moderately serious and very serious injuries.
- The majority of casualties reported by injury-based reporting system forces were classified as slight injuries. Around four-fifths of casualties were slight, while around one-fifth were reported as either killed or injured seriously.
- Fatalities accounted for around one per cent of casualties recorded by injury-based reporting system forces
Chart 4: Distribution of casualties by detailed injury severity, injury-based reporting system police forces, Great Britain, 2025 RAS0204
| Casualty severity | % of all 2025 casualties |
|---|---|
| Killed | 1.2 |
| Very Serious | 4.3 |
| Moderately Serious | 4.6 |
| Less Serious | 13.5 |
| Slight | 76.4 |
5.2 Injury type
Injury-based reporting systems also record the most severe injury sustained by each casualty. This provides additional information on the types of injuries resulting from reported road collisions, which was not previously available from STATS19 data. These figures highlight the breadth of injuries currently grouped within the overall “serious” casualty classification:
- Whiplash or neck pain was the most commonly recorded injury type.
- Cuts, abrasions, sprains, strains and bruising together accounted for a large proportion of casualties.
- Together these injury categories accounted for the majority of casualties recorded by injury-based reporting system forces.
- More severe injuries, such as fractures, internal injuries, severe head injuries or severe chest injuries, were less common but collectively represented a substantial proportion of serious casualties.
Chart 5: Distribution of most severe injury type, injury-based reporting system police forces, Great Britain, 2025 RAS0204
| Most Severe Injury Type | % of all 2025 casualties |
|---|---|
| Deceased | 1.2 |
| Broken neck or back | 1.1 |
| Internal injuries | 1.0 |
| Multiple severe injuries and unconscious | 0.2 |
| Severe chest injury with any difficulty breathing | 0.7 |
| Severe head injury and unconscious | 1.4 |
| Deep penetrating or puncture wound | 0.2 |
| Fractured pelvis or upper leg | 1.6 |
| Loss of arm or leg (or part) | 0.1 |
| Multiple severe injuries and conscious | 0.4 |
| Other chest injury (not bruising or shallow cut) | 2.3 |
| Deep cuts or lacerations | 1.9 |
| Fractured arm or collarbone or hand | 4.1 |
| Fractured lower leg or ankle or foot | 3.7 |
| Other head injury (not bruising or shallow cut or dental injuries) | 3.8 |
| Bruising | 19.0 |
| Shallow cuts or lacerations or abrasions or dental injuries (loss of tooth) | 16.9 |
| Shock (Requiring roadside attention) | 4.0 |
| Sprains or strains or dislocation | 15.5 |
| Whiplash or neck pain | 21.1 |
Patterns of injury vary considerably between different road user groups:
- Car occupants and van occupants have a relatively high proportion of injuries recorded as whiplash or neck pain, reflecting the types of impacts commonly experienced in vehicle collisions.
- Motorcyclists were more likely than other road users to sustain fractures
- Pedestrians, pedal cyclists and motorcyclists had comparatively higher proportions of serious head injuries.
These differences illustrate that casualty severity alone does not fully describe the harm resulting from road collisions. Detailed injury information can provide additional insight into the outcomes experienced by different road users and may help improve understanding of the types of injury that road safety interventions seek to prevent. Available figures are published in table RAS0204.
5.3 Hospital admissions data
This publication is based on casualties in collisions reported to the police. Other datasets provide information on road casualties, including hospital admissions data published by NHS England within their Hospital Episode Statistics. Initial work to assess the feasibility of linking police and hospital data on road casualties is in progress, with further details available from our factsheets page.
6. Further information
Further data and statistics showing the numbers and trend in reported road casualties by severity is available via:
- Spreadsheet data tables, particularly section RAS01: historic trends
- Interactive data tools
- Analysis of injury data from other sources, including hospital and fire service datasets
7. About this data
Detailed information about the data used in this chapter, including its strengths and limitations, can be found in the guidance pages.
7.1 STATS19 data
The statistics in this publication are based on data collected through the STATS19 system, which records personal injury road collisions on public roads in Great Britain. STATS19 data are reported to the Department for Transport by police forces using a common national specification, allowing consistent analysis across time and geography. All collisions reported by the police within 30 days and that occurred on a public highway involving at least one motor vehicle, horse rider or pedal cyclist, and where at least one person was injured, are included in these statistics.
STATS19 is the primary source used to understand long-term trends in road collisions and casualties, and to monitor and evaluate road safety policies and interventions. Its standardised approach enables comparison at local, regional and national level, and provides a long-running time series underpinning road safety analysis.
There is no obligation for people to report all personal injury collisions to the police, and not all collisions are reported to the police, particularly those involving only slight injuries, meaning some types of incidents are under recorded. Therefore these figures do not represent the full range of collisions or casualties in Great Britain.
The quality and completeness of the data can also vary, especially for variables based on officer judgement at the scene. Changes to data collection systems, guidance or reporting practices over time may also affect comparability of trends. For example, recent updates to the STATS19 specification (including the introduction of new variables) may lead to discontinuities in some data series.
7.2 Injury severity reporting
The figures in this release for injured casualties are based on adjusting figures reported by the police to take account of changes in the reporting of injury severity by some police forces in recent years. These adjusted figures can reliably be used to compare trends over time across the country. More details can be found in our severity adjustments guidance.
7.3 Data completeness by severity
Fatalities. STATS19 excludes confirmed suicides and deaths resulting from medical episodes rather than the collision itself. This means that the number of collisions and casualties recorded in STATS19 is likely to be lower than the total number occurring on Great Britain’s roads. For fatalities, comparisons between STATS19 records and death registration data from the Office for National Statistics (ONS) provide further evidence on the coverage of police-reported road fatalities. This work found that most road accident fatalities recorded in death registrations were also reported in STATS19, although there are some definitional and recording differences between the sources. For more information, see our initial work on linking STATS19 fatalities and ONS death registration data.
Non-fatal casualties. It is well established that a considerable proportion of non-fatal casualties are not known to the police. Hospital, survey and compensation claims data all indicate a higher number of casualties than police-reported road accident data would suggest. For more detail, see our guidance on other sources of information on road casualties. We have also carried out initial feasibility work linking police and health data. This suggests that police data may understate the number of road traffic casualties, including some casualties involved in relatively more serious collisions. For more detail, see our report on linking police and health data
7.4 Impact of online reporting
Some police forces allow members of the public to report road traffic collisions online, rather than by reporting them in person or by telephone. This can make it easier for people to report collisions, particularly those involving slight injuries where the police may not attend the scene. The move to online reporting may affect the number and type of casualties recorded in STATS19, particularly slight injuries. This means that changes in reported casualty numbers over time may partly reflect changes in reporting routes, as well as changes in the number of collisions occurring on roads. For more information, see our guidance on the impact of online reporting of road casualties
8. Instructions for printing and saving
Depending on which browser you use and the type of device you use (such as a mobile or laptop) these instructions may vary.
Tablets and mobile devices normally have the option to “find in text” and “print or save” in their sharing or quick options menu of their browser, but this will vary by device model.
9. How to search
Select Ctrl and F on a Windows laptop or Command and F on a Mac
This will open a search box in the top right-hand corner of the page. Type the word you are looking for in the search bar and press enter.
Your browser will highlight the word, usually in yellow, wherever it appears on the page. Press enter to move to the next place it appears.
10. Contact details
Road safety statistics
Email roadacc.stats@dft.gov.uk
To hear more about DfT statistical publications as they are released, follow us on X (formerly known as Twitter) at DfTstats.
-
Rates use traffic data from the Department for Transport National Road Traffic Survey. Total traffic used in rates include pedal cycles but excludes miles walked. ↩