Other sources of information on road casualties
Published 30 September 2021

© Crown copyright 2021
This publication is licensed under the terms of the Open Government Licence v3.0 except where otherwise stated. To view this licence, visit nationalarchives.gov.uk/doc/open-government-licence/version/3 or write to the Information Policy Team, The National Archives, Kew, London TW9 4DU, or email: psi@nationalarchives.gov.uk.
Where we have identified any third party copyright information you will need to obtain permission from the copyright holders concerned.
This publication is available at https://www.gov.uk/government/publications/other-sources-of-information-on-road-casualties/other-sources-of-information-on-road-casualties
Personal-injury accidents, and their associated casualties, are only recorded in STATS19 if they occur on public roads and become known to the police within 30 days. This means that the number of accidents and casualties on Great Britain’s roads according to STATS19 is likely to be lower than the true number. Comparisons between police road accident reports and ONS death registrations data show that very few, if any, road accident fatalities are not reported by the police. However, it is well-established that a considerable proportion of non-fatal casualties are not known to the police; hospital, survey and compensation claims data all indicate a higher number of casualties than police accident data would suggest.
To assess the coherence of the police reported data in terms of both absolute casualty numbers and trends in casualties, we considered data from 5 alternative sources. Each source and how it can be used in conjunction with the STATS19 data is described in more detail below.
-
The National Travel Survey (NTS): this includes questions asked since 2007 on whether respondents resident in England (both adults and children) have been involved in road accidents on public roads (including pavements and cycle lanes on public roads) in Great Britain; whether they sustained injuries, what type, and whether the police attended or if they reported the accident later. This provides a self-reported estimate, with a range of definitional differences in injuries and questions of recall bias that mean the results will differ from those obtained through the STATS19 data collection. Given the NTS data in theory captures all personal-injury road accidents experienced by the population in England, it provides a means to estimate the total number of road accidents, including those not recorded via STATS19.
-
Hospital Episodes Statistics (HES). These National Health Service (NHS) administrative data provide details of hospital patient episodes in England and Wales. For admitted patients, HES provides information on whether a casualty was involved in a road traffic accident, as well as the seriousness of a casualty’s injuries via diagnostic codes. The department has carried out analysis to better understand how well HES data maps to STATS19 police recorded road casualties that were clinically seriously injured. It determined that the injury-based approach, used in CRASH and COPA, has the possibility to produce something more objective and closer to medical definitions than the severity-based approach.
-
Compensation Recovery Unit data (CRU): this administrative data comes from the Department for Work and Pensions (DWP). The CRU works with insurance companies, solicitors and DWP customers to recover social security benefits paid as a result of an accident, injury or disease if a compensation payment has been made (the Compensation Recovery Scheme), and costs incurred by NHS hospitals and Ambulance Trusts for treatment from injuries from road traffic accidents and personal injury claims (Recovery of NHS Charges).
-
Motor Insurance Claims statistics: the Association of British Insurers collects data from insurers on the type and number of claims made.
-
Road Traffic Statistics: this is DfT data collected from around 8,000 roadside 12-hour manual counts, continuous data from around 300 automatic traffic counters, and data on road lengths. This provides estimates of vehicle miles travelled.
National Travel Survey
This section examines long term road accident trends up to 2020, based on self-reported responses to the National Travel Survey (NTS). Figures for 2020 should be interpreted with caution in comparison to previous years due to changes in the methodology of data collection, changes in travel behaviour, and a reduction in the sample sizes and amount of data collected for this year due to the COVID-19 pandemic.
Chart 1 presents the estimates of non-fatal road casualties from the NTS, with approximate confidence limits, for 5-year averages from 2009 to 2019. The corresponding estimate for 2020 is provided as a stand-alone figure - i.e. not averaged with previous years. Approximate uncertainty intervals are omitted for 2020 due to the small NTS sample sizes. Chart 1 shows that the number of personal injury road accidents decreased steadily between 2010 to 2014 and 2015 to 2019. The most recent figure follows the same trend, with an estimated 420,000 non-fatal casualties in 2020, down from 510,000 in 2015 to 2019.
Chart 1: The estimated number of non-fatal road casualties from National Travel Survey data, Great Britain RAS54004
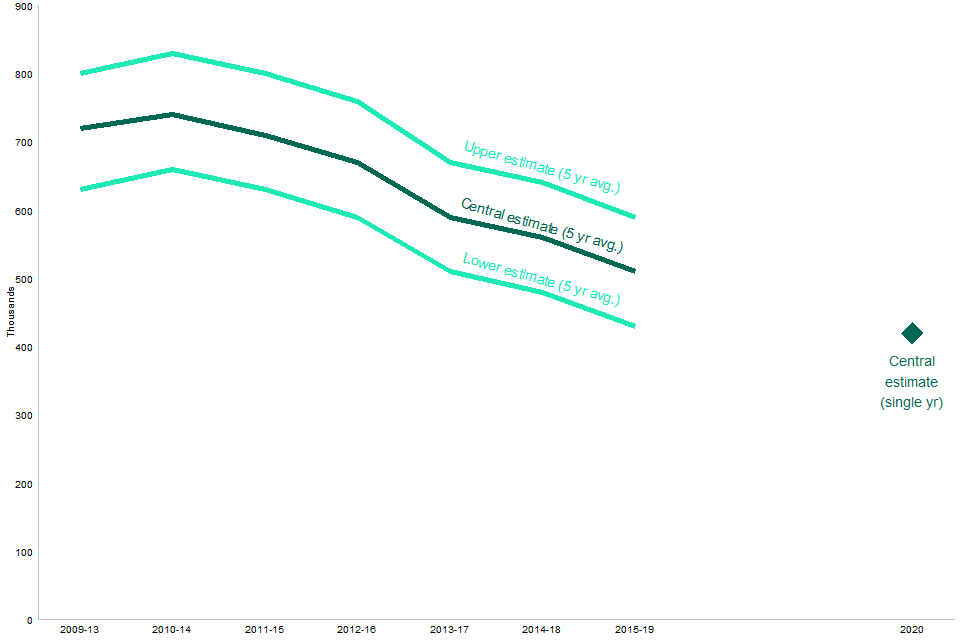
The overall downward trend in non-fatal road casualties over time appears smooth over all years, including between 2015 to 2019 and 2020. The latter shows a more gradual decline in casualties than that seen in STATS19 for the same period. However, this may be explained by the fact that each estimate up to 2015 to 2019 is the average over a 5 year period, and that the estimate in each case, including for 2020, considers the average proportion of respondents over 2 different time periods: the last year and the last 3 years. This means that the trend in the estimated number of non-fatal road casualties over time likely appears smoother than the underlying intrinsic one. Conversely, STATS19 records are collated annually and only relate to the year in question, meaning they are comparatively more sensitive to any sharp changes in casualty trends over time.
Figures derived from a combination of NTS and STATS19 data, including those presented in Chart 1, are published in the department’s RAS54 table series. They reveal several additional insights into recent national trends in road traffic accidents, which are summarised below. Results for 2020, however, should be interpreted with caution due to the effects of the COVID-19 pandemic that year, and for the reasons discussed at the start of this section.
The main results are as follows:
A substantial decrease - from 36% in 2017 to 2019 to 13% in 2020. In the proportion of respondents reporting having attended an accident and emergency department for injuries sustained in a road accident in the last 3 years. The proportion reporting having been admitted as an inpatient in the same period also decreased from 8% in 2017 to 2019 to 5% in 2020. RAS54003.
This is seemingly at odds with the more gradual decrease in the estimated number of total non-fatal casualties shown in Chart 1. One possible explanation is that respondents were less willing or able to attend accident and emergency departments in 2020 for less serious road traffic injuries due to restrictions imposed to reduce COVID-19 transmission. However, given the small NTS sample size for 2020, additional data and further analyses are required before any firm conclusions may be drawn.
A reduction between 2017 to 2019 and 2020 in the fraction of total road users that were pedestrians (8% to 3%) or car occupants (69% to 67%), and an increase in the fraction that were cyclists (14% to 20%) over the same period (Table 1).
Whilst figures based on NTS data for 2020 should be regarded with caution, these trends are similar to those seen in STATS19 and Hospital Episode Statistics data between 2019 and 2020. They may reflect the reductions in motor traffic and increased pedal cycle traffic measured for national lockdown periods in the latter year.
Table 1: The percentage of injured road traffic accident casualties by road user type in the NTS and STATS19 for periods between 2015 and 2020 (RAS54002)
| Source | Year(s) | Car Occupant | Cyclist | Motorcyclist | Pedestrian | Other |
|---|---|---|---|---|---|---|
| NTS | 2017/19 | 69 | 14 | 6 | 8 | 4 |
| STATS19 | 2015/19 | 61 | 10 | 12 | 11 | 6 |
| NTS | 2020 | 67 | 20 | 6 | 3 | 4 |
| STATS19 | 2020 | 57 | 14 | 13 | 10 | 6 |
A moderate increase - from 48% in 2017 to 2019 to 55% in 2020. In the proportion of respondents not reporting injuries sustained in a road accident in the last 3 years to the police. (NTS0624)
One explanation for this increase may be that casualties with minor injuries were less inclined to make an additional journey to report an accident to police in 2020 than previous years. Another explanation may be that increased cycle traffic in 2020 led to a higher than usual fraction of single vehicle pedal cycle accidents on the roads. Previous analyses of STATS19 and Hospital Episode Statistics data have shown that these types of accidents are less likely to be reported to police. However, additional data and further analyses are needed to firmly understand the reasons for this increase.
Hospital Episode Statistics
Analysis of the Hospital Episode Statistics from NHS Digital allows us to report on the number of admitted patient care (APC) admissions recorded as being related to a road traffic accident. HES APC data also includes diagnostic codes for each episode, which we can use to determine whether admitted casualties have a clinically defined serious injury. This definition is based on the maximum score on the abbreviated injury scale (MAIS). An injury is considered clinically serious with a score of three or higher (MAIS3+).
Overall trends in casualties
Chart 2 shows the number of hospital admissions for road traffic accidents in England between 1999 and 2020, broken down by MAIS score. This shows that the number of non-fatal road traffic accident hospital admissions has fluctuated around 35,000 year-on-year between 1999 and 2016. Admissions then drop slightly from 2017 to 2019, before sharply declining in 2020.
Chart 2: Estimated number of hospital admissions for road traffic accidents by MAIS score, England: 1999 to 2020 (RAS55)
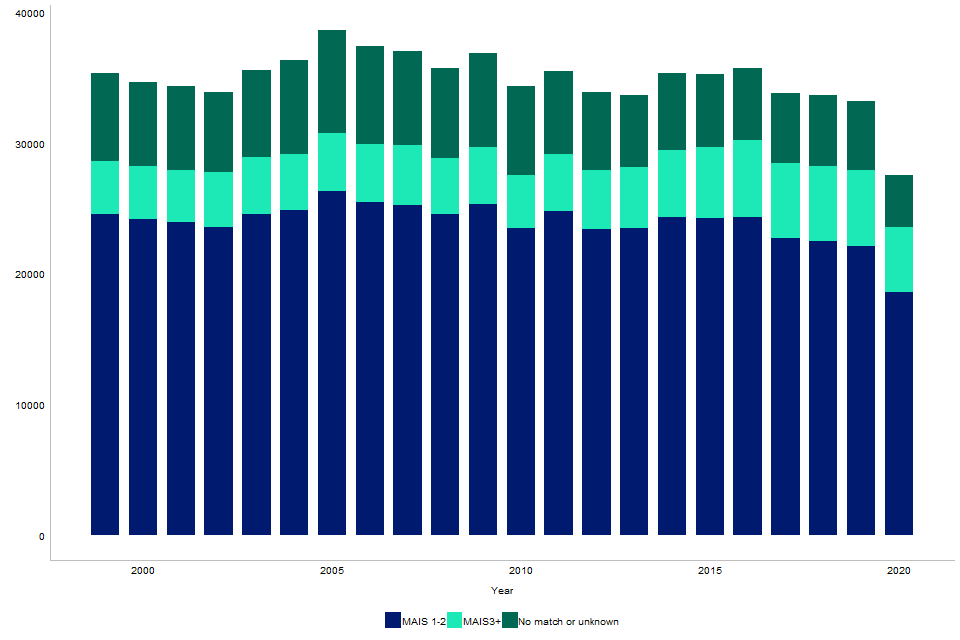
Chart 3 shows the proportion of total hospital admissions for road traffic accidents in England by MAIS score for each year between 1999 and 2020. The percentage of admissions with MAIS scores of 1 or 2 (clinically less serious injuries) remained relatively stable over this period at around 69%, albeit gradually declining by a few percentage points after 2015. The proportion with a MAIS score of 3 or more remained approximately constant, at around 12% annually, between 1999 and 2010.
However, since then it has increased each year to reach 18% in 2020. Conversely, the number of admissions with an unknown MAIS score or for which a MAIS score could not be matched remained stable at around 19% until 2010, before declining to 14% between 2011 and 2020. It is likely that changes in recording have allowed more records to be matched to MAIS3+ over time, rather than a genuine increase in clinically serious injuries in recent years. Further analysis is needed to fully understand this change.
Chart 3: The proportion of total hospital admissions for road traffic accidents by MAIS score, England: 1999 to 2020 (RAS55)
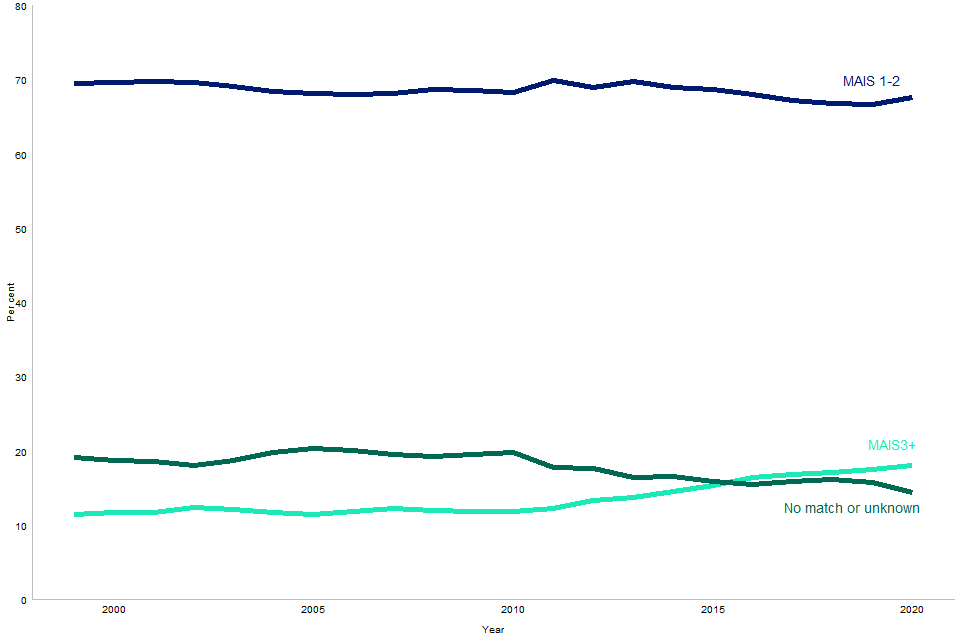
Chart 4 compares the adjusted number of STATS19 seriously injured casualties with the total number of patients admitted to hospital after road traffic accidents, and the MAIS3+ subset, between 2010 and 2020. Serious casualties in STATS19 on average gently decline over time until 2019, before dropping steeply in 2020 (a 22% reduction compared to 2019).
Chart 4: The number of road traffic accident hospital admissions (England) and STATS19 serious injured casualties (adjusted; GB): 2010 to 2020 (RAS55050)
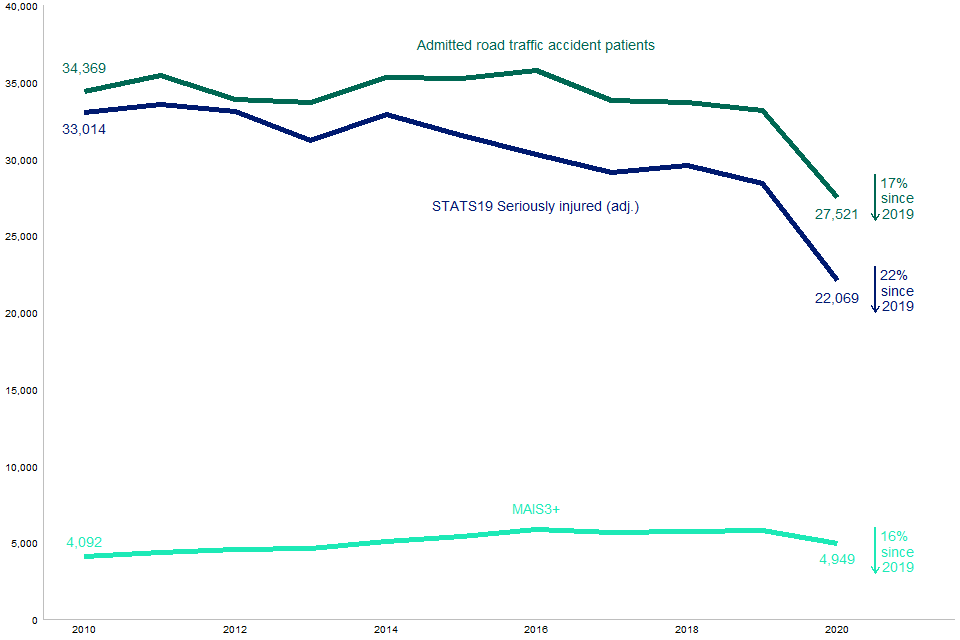
Total road traffic accident admissions are slightly higher than the number of STATS19 serious casualties each year over the same period. However, they still follow a very similar trend, remaining broadly flat or slightly declining between 2010 to 2019, before dropping substantially in 2020 (a 17% reduction from 2019). This suggests that, although not all road traffic accident casualties are recorded by police (and casualties deemed serious in STATS19 are not always admitted to hospital), STATS19 reporting nevertheless provides a reliable picture of the general overall trends in serious casualties over time.
There are many fewer MAIS3+ admissions than total road traffic accident admissions or STATS19 serious casualties between 2010 and 2020; the MAIS3+ trend over this period remains relatively stable at around 5,000 non-fatal casualties per year. This is likely because the MAIS3+ category captures the most severely injured patients with more severe injuries than the typical road traffic admission or casualty defined as seriously injured in police reported data. However, MAIS3+ hospital admission reduced in 2020 by 16% compared to 2019, a similar reduction to those seen for both total road traffic accident admissions and STATS19 seriously injured casualties over the same period.
Breakdowns by road user type
A considerable proportion of non-fatal casualties each year are not known to the police and therefore not recorded in STATS19. Furthermore, accidents involving certain road user types may be more often reported to police than others.
Chart 5: The number of road traffic accident hospital admissions (England) and STATS19 seriously injured casualties (adjusted; GB) by road user type between 2017 and 2019 (RAS55008)
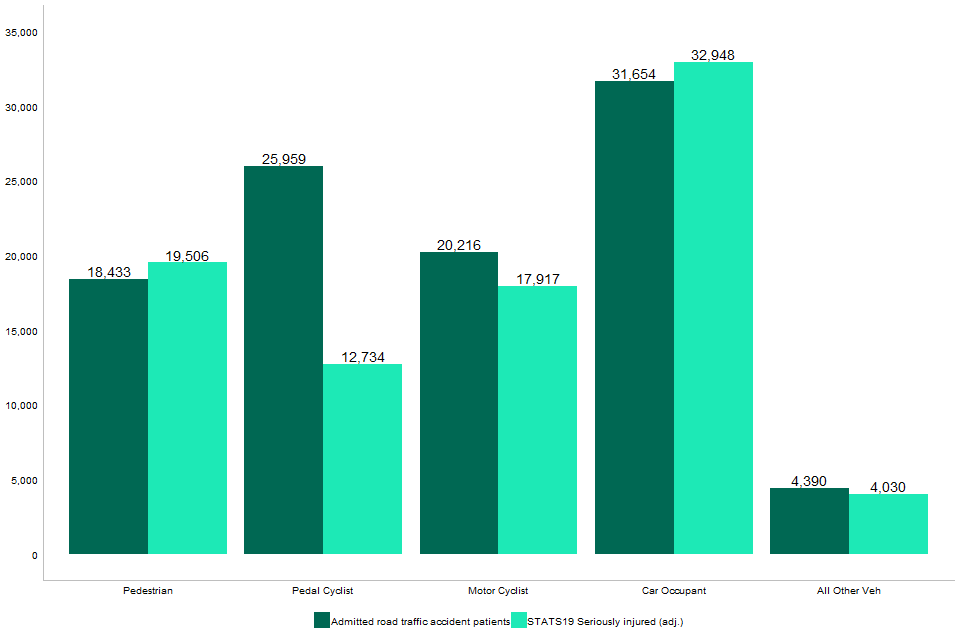
Chart 5 provides an example of this effect, showing the total number of road traffic accident admissions recorded in HES, and seriously injured casualties in STATS19, for different road user types between 2017 and 2019. Proportionally, pedestrians and car occupants are slightly over-represented amongst STATS19 seriously injured casualties in comparison to HES road traffic hospital admissions. Cyclists are comparatively under-represented.
The former differences may be explained if some pedestrian and car occupant road traffic casualties are recorded as seriously injured by police but not subsequently admitted to hospital. Conversely, the latter difference may be explained if some seriously injured pedal cyclists are admitted to hospital, but the accident is not reported to police.
Despite the differences in sensitivity to different road user types in HES compared to STATS19, the trends in casualties by road user type in recent years are similar. Chart 6 shows the number of patients admitted to hospital following a road traffic accident in 2019 and 2020, broken down by road user type. It shows a large reduction in the number of casualties for most road user types in 2020 compared to 2019. The exception is the number of pedal cyclist casualties, which substantially increased in 2020.
Chart 6: The number of hospital admissions for road traffic accidents by road user type in England in 2019 and 2020 (RAS55008)
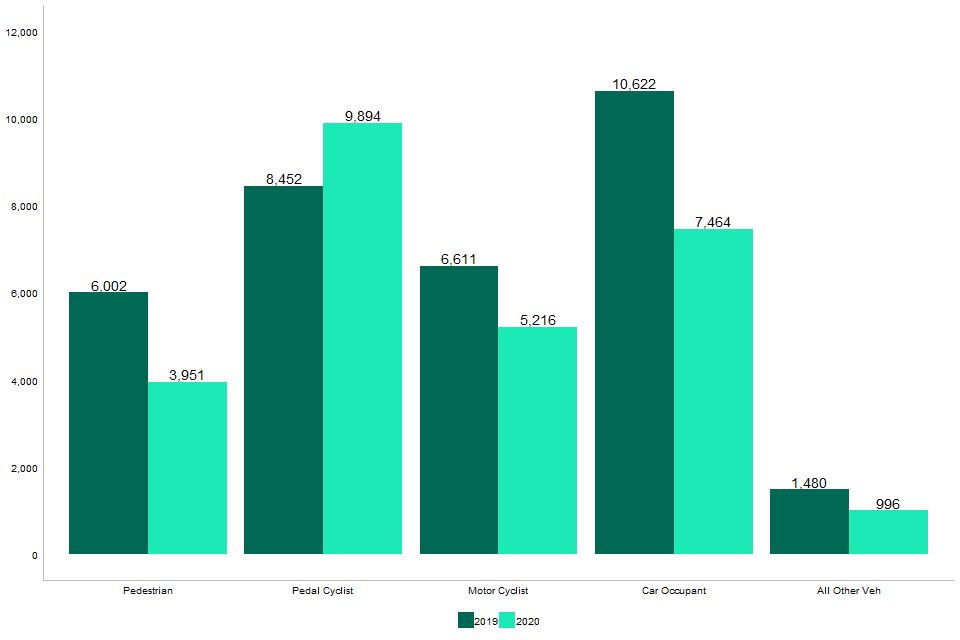
Prior to 2019, road traffic admissions by road user type had been stable for many years. The trends shown in Chart 6 for road traffic hospital admissions therefore generally mirror those seen for STATS19 casualties, which show a substantial drop in casualties for most road user types, except killed or seriously injured pedal cycle casualties in 2020. The similarity in HES and STATS19 trends is also confirmed in Table 2. This shows similar proportional changes in casualties between 2019 and 2020 for both across nearly every road user type. The exception is the proportional rise in pedal cycle casualties seen in HES, which is much larger than that seen in STATS19 over the same period.
The changes between 2019 and 2020 seen in road traffic hospital admissions and police-reported road traffic accident casualties are likely both linked to national COVID-19 lockdown periods in 2020 and associated stay at home and work from home orders (see The impact of lockdown on reported road casualties Great Britain, provisional results: 2020 for further details).
Table 2: The percentage change in hospital admissions for road traffic accidents (England), and STATS19 seriously injured casualties (GB), by road user type: 2019 to 2020
| Percentage change | Pedestrian | Pedal Cyclist | Motor Cyclist | Car Occupant | All Other Veh. Occupant |
|---|---|---|---|---|---|
| Traffic Admissions Non-duplicate | -34 | 17 | -21 | -30 | -33 |
| STATS19 Seriously injured (adj.) | -33 | 2 | -22 | -26 | -17 |
Compensation Recovery Unit data
The Department for Work and Pensions (DWP) Compensation Recovery Unit (CRU) works with insurance companies, solicitors and DWP customers, to recover:
- social security benefits paid in relation to an accident, an injury or disease, if a compensation payment has been made (the Compensation Recovery Scheme)
- costs incurred by NHS hospitals and Ambulance Trusts for treatment from injuries from road traffic accidents and personal injury claims (Recovery of NHS Charges)
Most of their cases are motor-related.
Table 3 shows a slight decrease in motor cases in 2019 to 2020 compared to 2018 to 2019. This is followed by a steep decline in cases between 2019 to 2020 and 2020 to 2021. The total number of cases follow a similar trend, with motor cases representing a similar fraction of total cases for 2019 to 2020 and 2020 to 2021 as in previous years. This might suggest either a large reduction in injury accidents in 2020 to 2021 with respect to previous years, and/or a change in the insurance and claims market over that period. The decline in cases in 2020 to 2021 generally follows that of accidents and casualties reported in STATS19 in 2020 compared to previous years – likely linked to an overall reduction in road traffic during national lockdown periods across GB in 2020.
Table 3: The total number of cases and the number of motor-related cases registered to the CRU each financial year from 2010 to 2011 to 2020 to 2021 (CRU data)
| Year | Motor Cases | Annual percentage change (Motor) | Total Cases | Annual percentage Change (Total) |
|---|---|---|---|---|
| 2010/11 | 790,999 | 987,381 | ||
| 2011/12 | 828,489 | 5 | 1,041,150 | 5 |
| 2012/13 | 818,334 | -1 | 1,048,309 | 1 |
| 2013/14 | 772,843 | -6 | 1,016,801 | -3 |
| 2014/15 | 761,878 | -1 | 998,359 | -2 |
| 2015/16 | 770,791 | 1 | 981,324 | -2 |
| 2016/17 | 780,324 | 1 | 978,816 | 0 |
| 2017/18 | 650,019 | -17 | 853,615 | -13 |
| 2018/19 | 660,608 | 2 | 862,356 | 1 |
| 2019/20 | 653,052 | -1 | 829,252 | -4 |
| 2020/21 | 446,976 | -32 | 564,359 | -32 |
Motor Insurance Claims Statistics
The Association of British Insurers collects aggregate data from all its members on the number and type of claims made, including motor insurance claims. However, the underlying data is not currently freely available, and the ABI have not yet reported on the number of personal injury claims in 2020.
However, the ABI’s 2019 State of the Market report states that ‘insurers have been reporting a slowly decreasing volume of motor-related personal injury claims since 2016’. This is in-line with general decreases in the (adjusted) number of serious and slight casualties seen in STATS19 between 2016 and 2019.
Road Traffic Statistics
Department for Transport Road Traffic Statistics show a substantial reduction in total road traffic in 2020, a decrease of 21% with respect to 2019. The largest reductions were seen in car and taxi traffic (down 25% since 2019) and bus and coach traffic (which reduced by 32% between 2019 and 2020). However, a reduction in traffic was borne out across all motor vehicle types in 2020. Conversely, pedal cycle traffic increased dramatically over the same period, rising by 46% in 2020 compared to 2019. (TRA0101).
These changes align with the overall reduction in casualties (but increase in pedal cycle casualties) seen in STATS19 data for the same period.
The dramatic changes in traffic volumes between 2019 and 2020 were likely linked to the ongoing COVID-19 pandemic, which was declared by the World Health Organisation in March 2020. Reductions in motor traffic in 2020 align with periods of national lockdowns across the UK and England that year. Furthermore, the National Travel Attitudes Study reported a shift in travel behaviours due to the COVID-19 pandemic in 2020, which varied by transport mode. For example, 79% of survey respondents reported travelling by buses less during the pandemic than before the pandemic. Conversely, 34% of those who cycled previously reported that they were cycling more during the pandemic than prior to it.
Summary and conclusions
Comparisons of STATS19 casualty trends to other sources revealed the following:
-
a fall in the estimated number of total road traffic accident casualties between 2015-19 and 2020, based on responses to the National Travel Survey.
-
a sharp decrease in the overall number of patients admitted to hospital for road traffic injuries in 2020 compared to previous years. This decrease is borne out across casualties of all road user types - except for pedal cycle casualties, which substantially increased in 2020.
-
a steep decline in motor-related cases registered to the Department for Work and Pensions Compensation Recovery Unit between 2019/20 and 2020/21.
-
a large decline in the total volume of road traffic recorded in Great Britain in 2020 compared to 2019. Traffic volumes reduced for all motor vehicle types in 2020, however pedal cycle traffic increased.
Overall, the alternative sources considered here indicate a substantial fall in road traffic and road traffic casualties in 2020 in comparison to previous years. They also suggest a marked shift in the modes of transport adopted for journeys in 2020 compared to years prior to that. This picture aligns with that seen in STATS19 data for the same period, which shows a steep reduction in road traffic accidents and casualties reported to police in 2020 - the exception being a rise in pedal cycle casualties.
Comparison of STATS19 to alternative sources therefore suggests that, overall, STATS19 has robustly captured the trends in road safety in Great Britain for 2020 and previous years. Nevertheless, quantitative differences exist between STATS19 and the other data sources considered. The most notable of these is a larger fractional rise in pedal cycle casualties between 2019 and 2020 recorded in HES data compared to STATS19.
Contact details
Road safety statistics
Email roadacc.stats@dft.gov.uk