The impact of lockdown on reported road casualties Great Britain, provisional results: 2020
Published 24 June 2021

© Crown copyright 2021
This publication is licensed under the terms of the Open Government Licence v3.0 except where otherwise stated. To view this licence, visit nationalarchives.gov.uk/doc/open-government-licence/version/3 or write to the Information Policy Team, The National Archives, Kew, London TW9 4DU, or email: psi@nationalarchives.gov.uk.
Where we have identified any third party copyright information you will need to obtain permission from the copyright holders concerned.
This publication is available at https://www.gov.uk/government/statistics/reported-road-casualties-great-britain-provisional-results-2020/the-impact-of-lockdown-on-reported-road-casualties-great-britain-provisional-results-2020
Figures in this release are provisional and will be revised in September after further validation, although this is not expected to have any impact on the trends and changes identified.
In line with the Government Digital Service guidance, we have published our latest releases in HTML. We have launched a survey to gather stakeholder feedback in relation to this change of format.
Things you need to know
The coronavirus pandemic and associated travel restrictions affected road safety in 2020. This release investigates the impact on reported road casualties, displaying monthly trends.
For overall results and high-level trends of road casualties in Great Britain, please see our provisional estimates release.
The injury figures in this release are adjusted to take account of changes in the reporting of injury severity by some police forces in recent years. More details on severity adjustments and changes in reporting systems can be found in the severity adjustments section in our 2019 annual report.
Table 1: Key dates during the coronavirus pandemic, Great Britain, 2020
| Date | Change to restrictions |
|---|---|
| 23 March 2020 | UK enters first national lockdown |
| 4 July 2020 | UK implements first local lockdown |
| 14 October 2020 | England introduces 3 tier system |
| 23 October 2020 | Wales introduces fire-break lockdown, ends 9 November |
| 2 November 2020 | Scotland introduces 5 tier system |
| 5 November 2020 | England enters second national lockdown, ends 2 December |
| 19 December 2020 | Tier 4 introduced for London, South East and East of England |
| 20 December 2020 | Wales enters third national lockdown |
| 26 December 2020 | Large parts of England enter tier 4 |
Road casualties decreased in line with road traffic and national lockdowns
Road casualties saw the greatest monthly percentage decrease of 68% in April 2020 compared to 3-year average for 2017 to 2019. This aligns with the first full month of national lockdown and the reduction in motor traffic (63%) (Chart 1).
Pedal cyclist fatalities followed a different trend compared to all road user types. However, pedal cyclist fatalities aligned with pedal cyclist traffic which increased during the first lockdown.
Chart 1: Percentage change of casualties of all severities and motor traffic, compared to 3-year average for 2017 to 2019: Great Britain, 2020
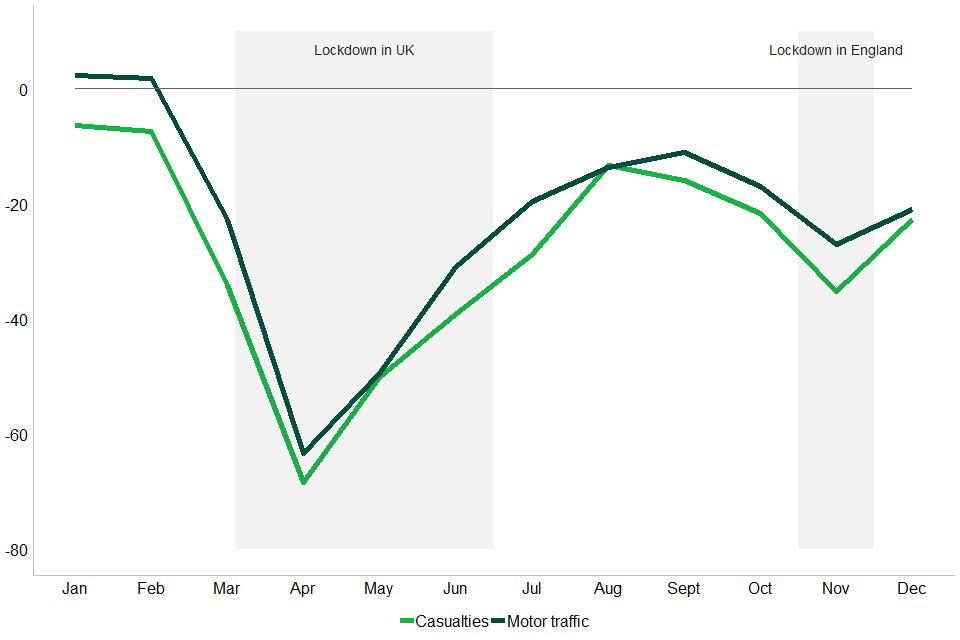
Chart 1: Percentage change of casualties of all severities and motor traffic, compared to three-year average for 2017 to 2019, Great Britain, 2020.
More details on traffic can be found at road traffic statistics.
Reductions of fatalities in Great Britain followed a similar pattern to the European Union
Road deaths in Great Britain saw a 16% decrease in 2020, compared to 2019, in line with the 17% decrease observed for countries within the European Union (EU) for the same period. See the report for more details.
The decrease in Great Britain followed a similar monthly pattern in 2020 to countries within the European Union. The greatest percentage decrease occurred in April, showing the impact of travel restrictions (Chart 2).
Chart 2: Percentage change of fatalities, compared to 3-year average for 2017 to 2019 in Great Britain and European Union, 2020
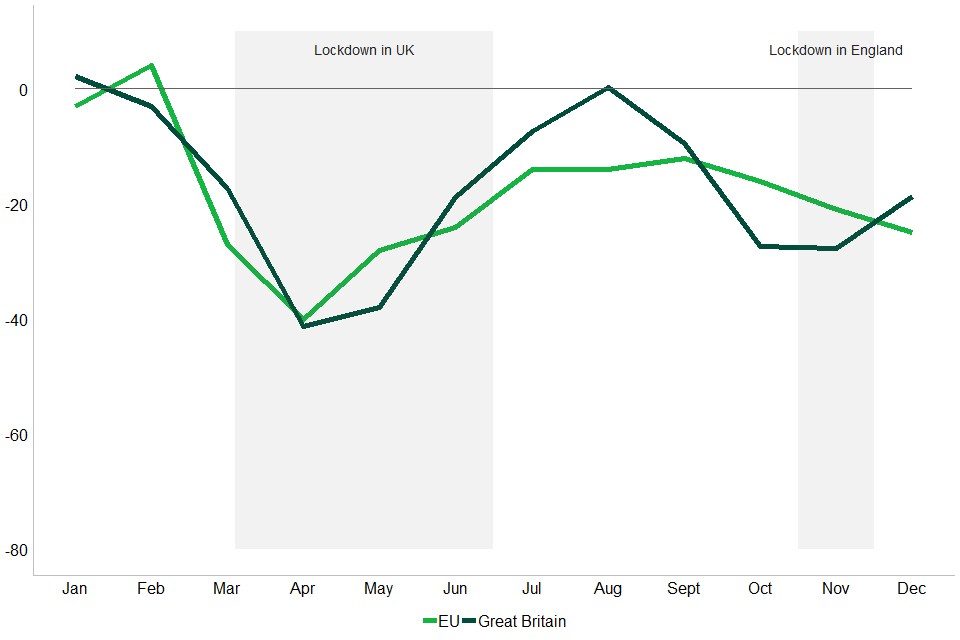
Chart 2: Percentage change of fatalities, compared to 3-year average for 2017 to 2019 in Great Britain and European Union, 2020.
Smaller reductions in fatalities than all casualties
There was a smaller reduction in fatalities (16%) than injured casualties (25%) throughout most of the year from March onwards. During lockdown months, there may have been low levels of reporting for slight casualties which may be linked to the larger reduction in these casualties.
Reductions in overall casualties followed a similar trend to fatalities. The greatest decrease was seen in April, the first full month of national lockdown, with a 68% reduction in all casualties and a 41% reduction in fatalities compared to the 3-year average for 2017 to 2019.
A smaller reduction was observed in the second national lockdown in November. Casualties of all severities decreased by 35% compared to the 3-year average for 2017 to 2019.
Chart 3: Percentage change of casualties and motor traffic, compared to the 3-year average for 2017 to 2019, by severity, Great Britain, 2020
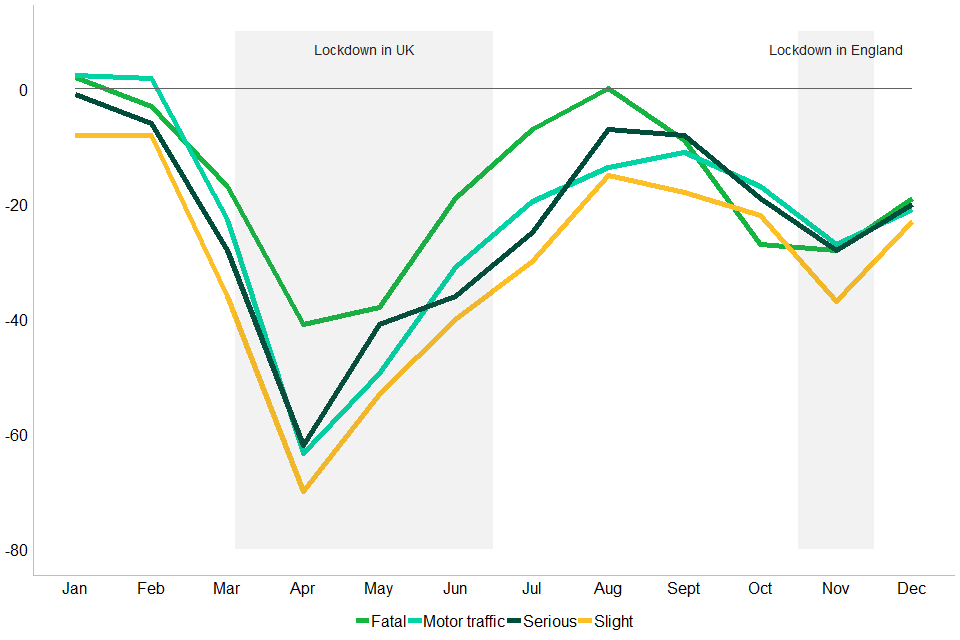
Chart 3: Percentage change of casualties and motor traffic, compared to the 3-year average for 2017 to 2019, by severity, Great Britain, 2020.
Greater reductions in pedestrian and car occupant casualties
Casualties for different road user types followed similar trends in 2020, with the lowest counts observed in April. However, the size of the reduction of casualties varied by road user type and severity (Table 2).
Pedestrian and car occupant casualties of all severities saw a greater percentage decrease compared to other road user types over this period (Chart 4).
Pedal cyclist casualties of all severities fell by 8% in 2020 compared to 3-year average for 2017 to 2019. However, this reduction varied by severity. Serious and slight injuries fell by 1% and 10%, respectively. However, the percentage of fatalities rose by 40%.
The change in pedal cyclist casualties also varied throughout the year. In August, September and December, there was an increase in casualties compared to the three-year average for 2017 to 2019 (Table 2).
There was a large reduction in bus occupant casualties which may be linked to the 50% reduction in local bus journeys in the year ending December 2020. For more detail please see the bus statistics report.
The department’s COVID-19 transport use statistics and the National Travel Attitudes Study (NTAS) suggest that there has been an increase in pedal cyclist traffic volume over the period following the COVID-19 restrictions, while motor vehicle traffic has reduced. For further detail, see:
This may also be linked to guidance published by the Department of Health and Social Care that if individuals “need to travel, they should walk or cycle where possible”.
A more detailed analysis of casualty rates for pedestrians and pedal cyclists will be provided as part of the 2020 annual statistics scheduled for publication in September 2021.
Chart 4: Percentage change of casualties compared to 3-year average for 2017 to 2019 by month and road user type: Great Britain, 2020
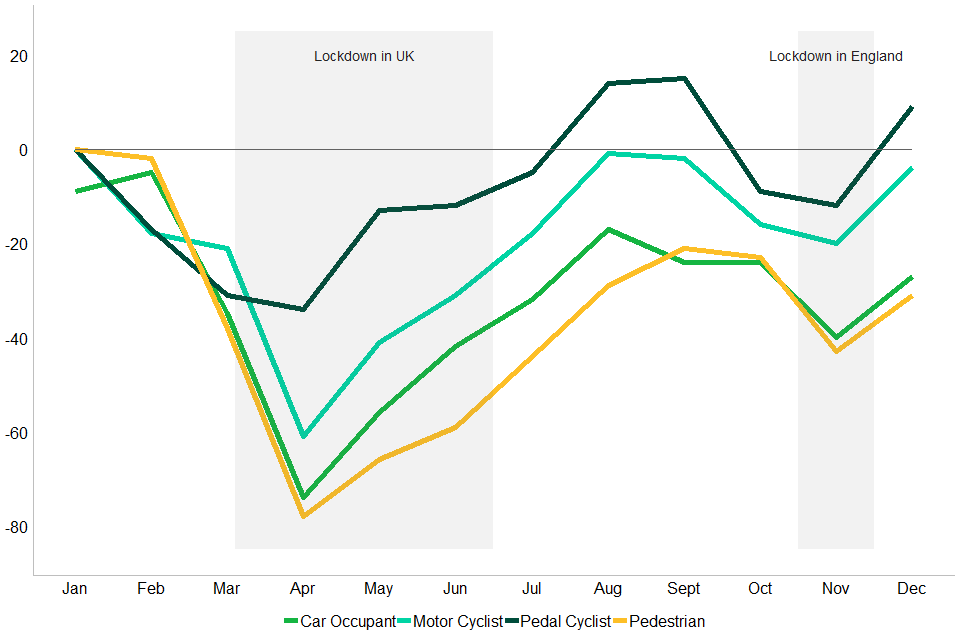
Chart 4: Percentage change of casualties compared to three-year average for 2017 to 2019 by month and road user type: Great Britain, 2020.
Table 2: Percentage change of casualties compared to 3-year average for 2017 to 2019 by month and road user type: Great Britain, 2020
| Road user type | Jan | Feb | Mar | Apr | May | June | July | Aug | Sept | Oct | Nov | Dec |
|---|---|---|---|---|---|---|---|---|---|---|---|---|
| Bus and Coach Occupant | -22 | -25 | -54 | -88 | -84 | -80 | -65 | -68 | -38 | -63 | -64 | -50 |
| Car Occupant | -9 | -5 | -35 | -74 | -56 | -42 | -32 | -17 | -24 | -24 | -40 | -27 |
| Goods Vehicle Occupant | -3 | -6 | -30 | -58 | -41 | -22 | -19 | -11 | -8 | -12 | -17 | -13 |
| Motor Cyclist | 0 | -18 | -21 | -61 | -41 | -31 | -18 | -1 | -2 | -16 | -20 | -4 |
| Other Vehicle Occupant | -18 | -13 | -31 | -44 | -35 | -20 | -17 | 73 | 59 | 46 | 15 | 64 |
| Pedal Cyclist | 0 | -17 | -31 | -34 | -13 | -12 | -5 | 14 | 15 | -9 | -12 | 9 |
| Pedestrian | 0 | -2 | -38 | -78 | -66 | -59 | -44 | -29 | -21 | -23 | -43 | -31 |
Fatality trends also differed by road user type
As motor traffic decreased during the first full months of lockdown, fatalities for road user types also decreased, compared to the 3-year average for 2017 to 2019.
Pedal cyclist fatalities followed a different trend to other road user types as fatalities increased for the same months.
In April, pedal cyclist fatalities saw the greatest increase which is in line with the increase in pedal cyclist traffic (Chart 5). See the monthly traffic flows for more detail.
This may be related to the travel restrictions imposed. For example, “people should aim to reduce the number of journeys they make where possible. If they need to travel, they should walk or cycle where possible, or plan ahead and avoid busy times and routes on public transport”.
Monthly casualty rates will be provided in the September publication.
Chart 5: Fatalities by month and road user type for Great Britain in 2020 compared to 2019
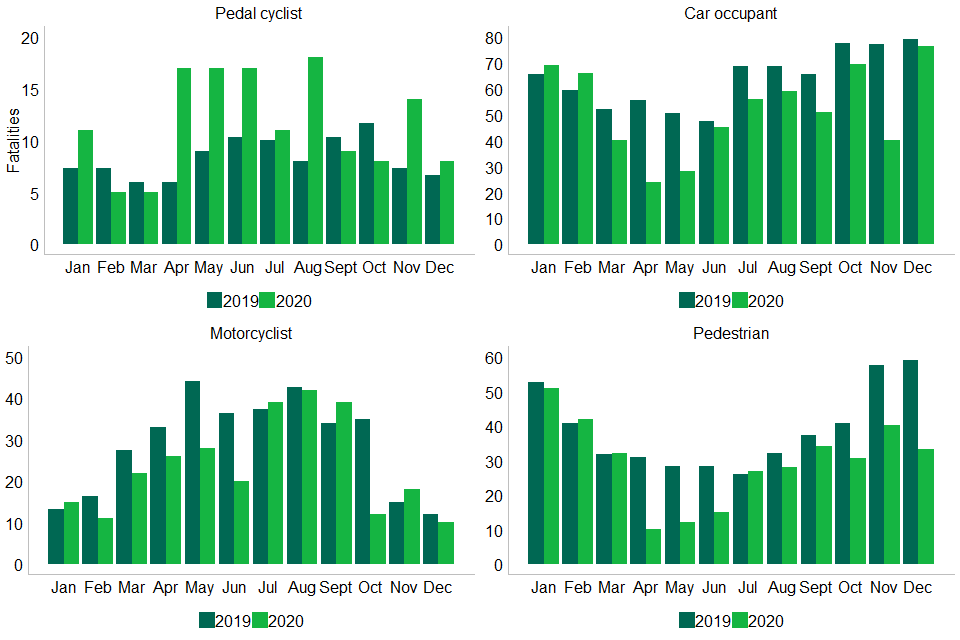
Chart 5: Fatalities by month and road user type for Great Britain in 2020 compared to 2019.
Pedal cycle fatalities and cycle traffic both increased during lockdowns
For all motor vehicles, there was a reduction in road traffic levels, casualties of all severities and fatalities during the nation and England lockdowns (Chart 6).
Conversely, pedal cyclist traffic increased compared to the 3-year average for 2017 to 2019 in April. Although casualties of all severities decreased for this month, an increase in fatalities was observed. The average pedal cyclist fatalities for 2017 to 2019 in April was 6 and this increased to 17 in 2020 (Chart 7).
We will investigate this further in our September release. The small number of pedal cyclist fatalities each month should be kept in mind when interpreting these patterns.
Chart 6: Percentage change of motor vehicle casualties, fatalities and traffic compared to 3-year average for 2017 to 2019 by month: Great Britain, 2020
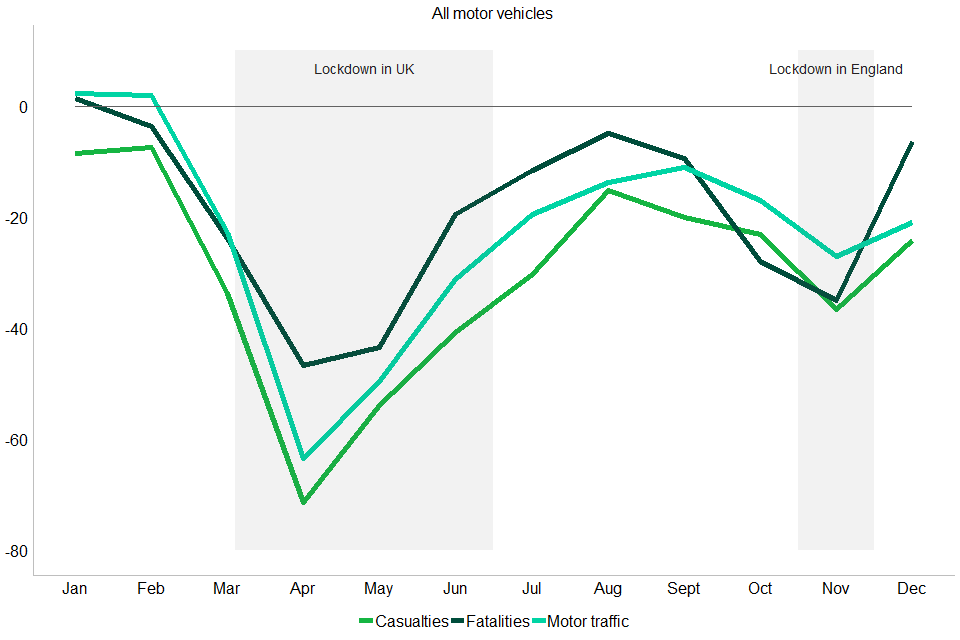
Chart 6: Percentage change of motor vehicle casualties, fatalities and traffic compared to 3-year average for 2017 to 2019 by month: Great Britain, 2020.
Chart 7: Percentage change of pedal cyclist casualties, fatalities and traffic compared to 3-year average for 2017 to 2019 by month: Great Britain, 2020
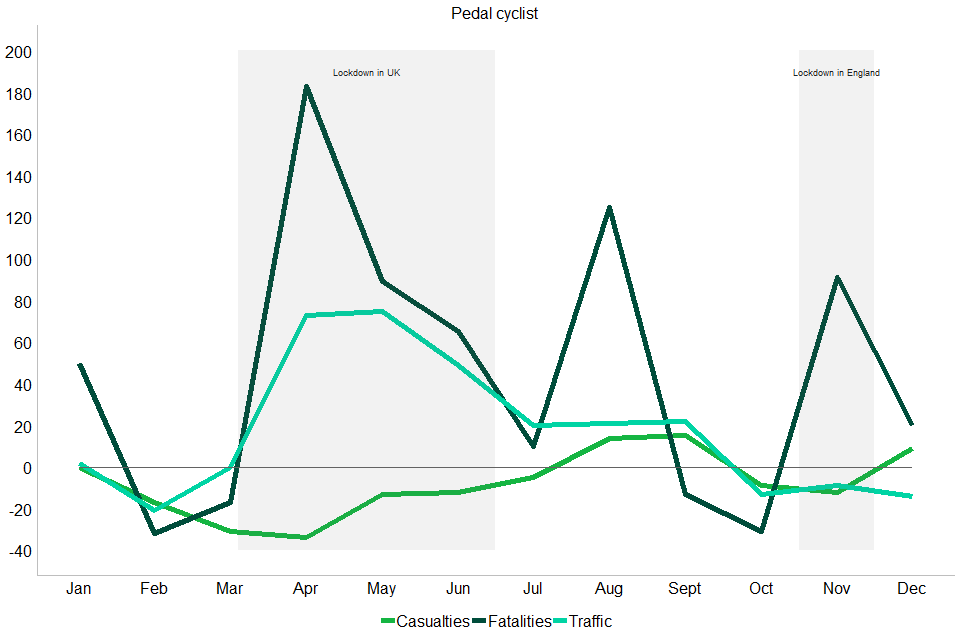
Chart 7: Percentage change of pedal cyclist casualties, fatalities and traffic compared to 3-year average for 2017 to 2019 by month: Great Britain, 2020.
Table 3: Percentage change of pedal cyclist casualties, fatalities and traffic compared to 3-year average for 2017 to 2019 by month: Great Britain, 2020
| Jan | Feb | Mar | Apr | May | June | July | Aug | Sept | Oct | Nov | Dec | |
|---|---|---|---|---|---|---|---|---|---|---|---|---|
| Casualties | 0 | -17 | -31 | -34 | -13 | -12 | -5 | 14 | 15 | -9 | -12 | 9 |
| Fatalities | 50 | -32 | -17 | 183 | 89 | 65 | 10 | 125 | -13 | -31 | 91 | 20 |
| Traffic | 2 | -21 | 0 | 73 | 75 | 49 | 20 | 21 | 22 | -13 | -9 | -14 |
Female casualties saw a greater decrease, compared to males
Casualties by sex followed a similar trend with reduction in casualties aligning with the implementation of lockdown (Chart 8).
Female casualties saw a greater reduction in lockdown months compared to male casualties. In April 2020, casualties decreased by 77% and 63%, for females and males respectively, compared to 3-year average for 2017 to 2019.
This may be linked to how people spent their time under lockdown. The Office for National Statistics reported females spent less time travelling and working not from home compared to males in March to April 2020.
In March to April, females also reported spending more time doing ‘unpaid childcare’ compared to males at 42.6 and 27.4 minutes per day, respectively. As children were home schooled during national lockdowns, it is likely females also stayed home to educate the children which could further explain the greater reduction in casualties. For further detail, see the report and dataset on how people spent their time under lockdown.
Chart 8: Percentage change of casualties compared to the 3-year average for 2017 to 2019 by month and sex: Great Britain, 2020
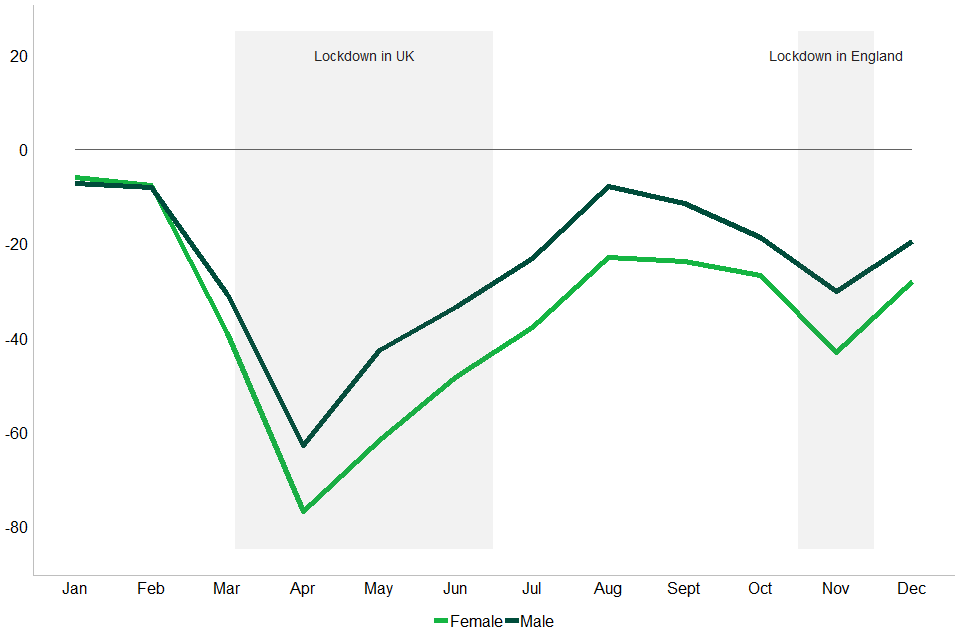
Chart 8: Percentage change of casualties compared to the 3-year average for 2017 to 2019 by month and sex: Great Britain, 2020.
Children and over 60s had greater reductions in casualties over the year
Casualties for different age groups followed similar trends in 2020, with the largest decrease observed in April and then November (Chart 9).
In April, children (aged 0 to 16 years) and older people (60 years and older) had the greatest percentage decrease of 84% and 74% respectively, compared to 3-year average for 2017 to 2019. A similar pattern was observed during the second national lockdown where child casualties and older casualties decreased by 37% and 41% respectively, over the same period.
This may be linked to the closure of schools, therefore reducing journeys for children, and the Department of Health and Social Care publishing guidance advising individuals over 70 years to stay at home as much as possible.
Younger (17 to 24 years) and adult casualties (25 to 59) increased at a faster rate in May, compared to children and older people.
These differences may be linked to the easing of restrictions. For example, on 10 May, the Prime Minister announced, “people who cannot work from home should return to the workplace”, affecting individuals of working age. Whereas, schools had a phased re-opening from 1 June.
Chart 9: Percentage change of casualties compared to 3-year average for 2017 to 2019 by month and age group: Great Britain, 2020 RAS30024
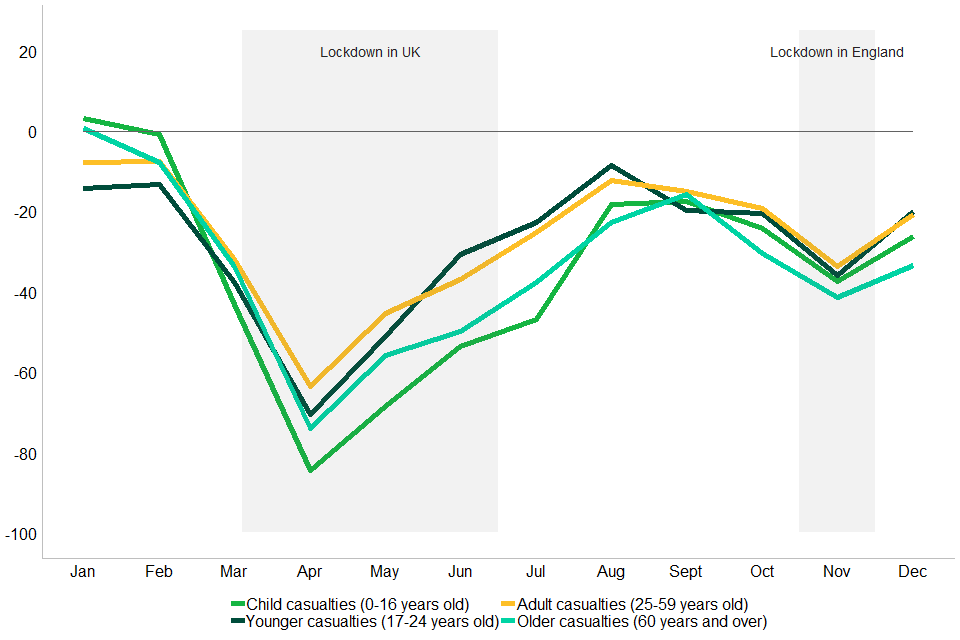
Chart 9: Percentage change of casualties compared to three-year average for 2017 to 2019 by month and age group: Great Britain, 2020.
Broadly similar patterns of casualties across police force areas
During the national lockdown implemented on 26 March, all police force areas saw a similar decrease in road casualties, compared to the 3-year average from 2017 to 2019. A similar trend was observed for the lockdown implemented in England.
Following the end of the first lockdown, casualties within police force areas started to increase to similar levels as the 3-year average from 2017 to 2019. Differences exist between police forces which may be as a result of varying restrictions.
Certain police forces saw another decrease in August (Leicestershire and Greater Manchester), which follows the implementation of local restrictions. For example, on the 4 July, the UK’s first local lockdown comes into force in Leicester and parts of Leicestershire. Whereas, Devon and Cornwall are typical of the national trends and did not have local restrictions implemented. Casualties for this police force align with casualties in all police forces.
For more detail please see our Table RAS30007 which includes figures for all police forces.
Chart 10: Percentage decrease of casualties compared to 3-year average for 2017 to 2019 by selected police forces and month, Great Britain, 2020 RAS30007
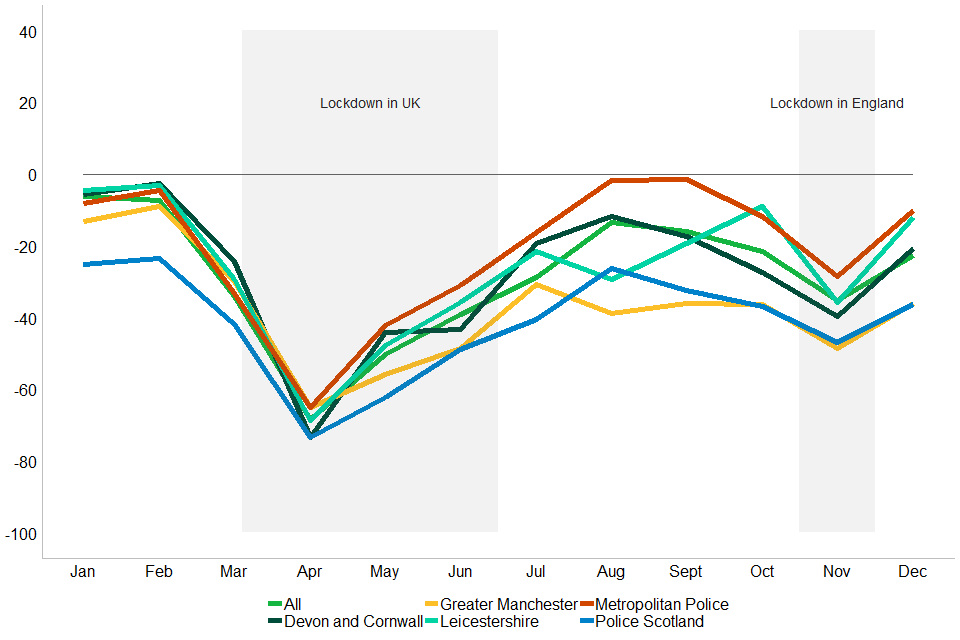
Chart 10: Percentage decrease of casualties compared to 3-year average for 2017 to 2019 by selected police forces and month, Great Britain, 2020.
Roads with a speed limit of 70 mph saw a greater decrease in casualties
The amount of road under each speed limit changes between years as highways authorities manage their network. Some of the year-on-year changes in this section will relate to increases or decreases in the length of the road with the given speed limit. This is particularly the case with roads limited to 20 mph which are likely to have increased significantly in recent years.
Casualties by all speed limit bands followed a similar pattern throughout 2020. Casualties from accidents occurring on roads with the speed limit band 1 to 20 mph saw the smallest decrease in April 2020 (55%) compared to other bands (Chart 11).
Casualties occurring in this 1 to 20 mph speed limit band also saw a percentage increase for the months July to October, compared to the 3-year average. The greatest percentage increase of 30% occurred in September. As mentioned above this is most likely related to the increase in the length of roads limited to 20 mph. However, this may also be linked to the published guidance advising individuals to “stay local” as more people may be travelling closer to home in 20 mph areas.
Roads with the speed limit of 70 mph saw the greatest decrease in 2020 and reduced by 81% in April. This may be linked to road traffic as motorways saw the greatest decrease in traffic from 2019 to 2020. More details on road traffic by road class can be found in the Table TRA0102.
A contributory factor (CF) analysis will be conducted for our September release with a focus on the CF exceeding the speed limit.
More detail regarding vehicle speed compliance on roads in Great Britain can be found in the published report.
Chart 11: Percentage change of casualties compared to 3-year average for 2017 to 2019 by month and speed limit (mph): Great Britain, 2020 RAS30006
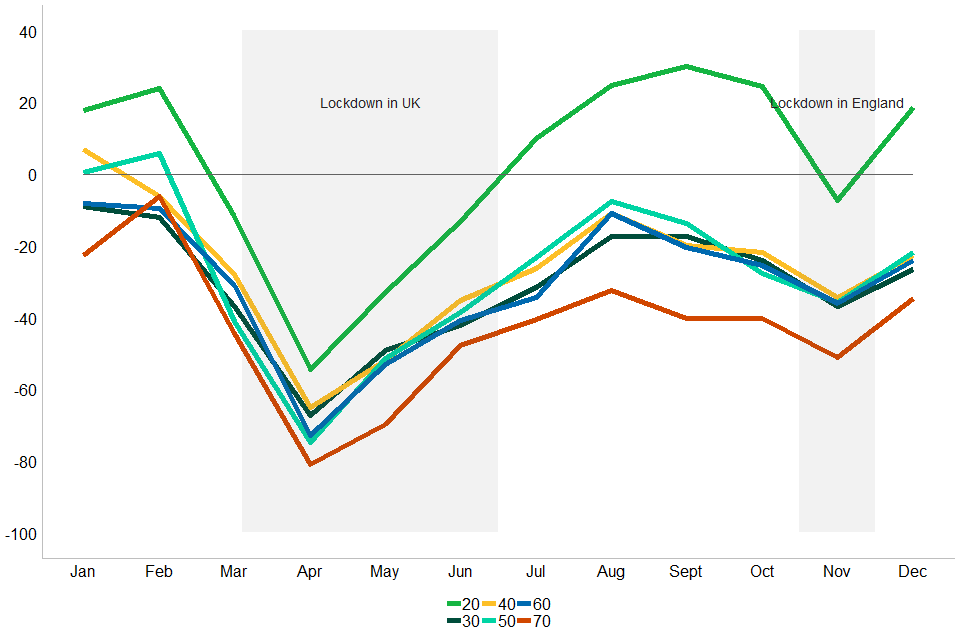
Chart 11: Percentage change of casualties compared to 3-year average for 2017 to 2019 by month and speed limit (mph): Great Britain, 2020.
Background information
Provisional estimates
Figures in this release are provisional and will be revised in the annual report in September after further validation, although this is not expected to have any impact on the trends and changes identified. Most of this validation is focused on accident coordinates and therefore some of the geographical results presented here may slightly change. The validation will also impact parameters used in the adjustment model for severity and therefore estimates for serious injuries, and to a lesser extent, slight injuries, may marginally change.
Related information
Information regarding our data tables, National Statistics and pre-release access can be found in our publication Reported road casualties Great Britain, provisional results: 2020.