Impact of online reporting of road casualties
Published 30 September 2021

© Crown copyright 2021
This publication is licensed under the terms of the Open Government Licence v3.0 except where otherwise stated. To view this licence, visit nationalarchives.gov.uk/doc/open-government-licence/version/3 or write to the Information Policy Team, The National Archives, Kew, London TW9 4DU, or email: psi@nationalarchives.gov.uk.
Where we have identified any third party copyright information you will need to obtain permission from the copyright holders concerned.
This publication is available at https://www.gov.uk/government/publications/impact-of-online-reporting-of-road-casualties/impact-of-online-reporting-of-road-casualties
Online self-reporting is part of a wider project for digital public contact called Single Online Home (SOH) funded by the Home Office to allow people involved in road traffic accidents to report the collision to the police online should they choose to do so rather than having to physically report it at a police station.
The principle of online reporting is to make it easier for members of the public to report accidents. It is expected that the introduction of online reporting will lead to an increase in the total number of accidents and casualties reported, as it will be easier for the public to perform this duty with more reporting options available. This is particularly likely to impact numbers for slight injuries, which might not have been reported otherwise. Serious injuries, on the other hand, are expected to be less impacted by this change since the police are more likely to physically attend the scene of serious accidents or for them to already be otherwise reported to the police. No change is expected to be found for fatal accidents as these cases are more likely to be attended at the scene and thoroughly investigated.
In addition to the overall volume, the introduction of online reporting is also likely to impact the nature of the collisions reported, for example by road user type.
The department is starting work as part of the STATS19 review to assess the scale of the discontinuity caused by the introduction of online reporting so far, and consider how to adjust for this as more forces roll it out. The rest of this section gives a high-level overview of the changes introduced by online reporting.
The forces that introduced online reporting of collisions through the Single Online Home (SOH) project in 2020 or before are listed below:
Table 1: Forces using online reporting as at end of 2020
| Force | Date online reporting introduced in SOH |
|---|---|
| Metropolitan Police Service | October 2016 |
| Thames Valley | January 2018 |
| Hampshire | January 2018 |
| Derbyshire | August 2018 |
| Merseyside | October 2018 |
| Surrey | December 2018 |
| Essex | September 2019 |
| Kent | September 2019 |
| Cheshire | November 2019 |
| Cleveland | November 2019 |
| Staffordshire | November 2019 |
| Gloucestershire | December 2019 |
| Sussex | December 2019 |
| City of London | January 2020 |
| Greater Manchester Police | February 2020 |
| Leicestershire | February 2020 |
| Northamptonshire | February 2020 |
| West Mercia | June 2020 |
| Warwickshire | September 2020 |
| Dyfed-Powys | November 2020 |
| Gwent | November 2020 |
| North Wales | November 2020 |
| South Wales | November 2020 |
As Warwickshire, Dyfed-Powys, Gwent, North Wales and South Wales introduced online reporting during since September 2020 or later they are excluded from this analysis. For the rest of this paper, forces listed above that introduced online reporting before September 2020 are compared to forces that have not introduced online reporting. Durham is also excluded as they use a different online reporting system called Sentrysis.
Change in accidents reported following the introduction of online reporting
Following the introduction of online reporting, the Metropolitan Police Service has seen an increase in the total number of casualties of all severities in the first year of operation (+7.7% between 2016 and 2017). The number of casualties in self reported accidents in each year since. However, the 19% reduction from 2019-20 is lower than the 27% reduction in forces that have not adopted online reporting.
Derbyshire and Hampshire saw a smaller decrease between 2017 and 2018 (their first year of using online reporting) in all casualties than forces that did not use online reporting between 2017 and 2018. Thames Valley, however, saw a larger decrease than forces not using online reporting. Between 2019 and 2020 all three forces saw a smaller decease than non online reporting forces.
Merseyside and Surrey who introduced online reporting late in 2018, saw a larger decrease between 2018 and 2019 (8.5% and 6.2% respectively) than forces that have not adopted online reporting.
All of the forces that introduced online reporting in 2019 saw a reduction in casualties in 2020. However, only Staffordshire (down 36%) saw a larger decrease in casualties in 2020 (27%) than in forces that have not adopted online reporting. The smallest reductions occurred in Cleveland and Essex (both down 14%).
Of the five forces that adopted online reporting in 2020 by June, only Leicestershire (down 16%) saw a much lower reduction than forces that have not yet adopted online reporting. However, the figures for the City of London are small and so conclusions cannot be drawn for them.
Table 2: Number of casualties in reported road accidents, by police force, 2016-2020
| Force | 2016 | 2017 | 2018 | 2019 | 2020 | % inc 2017 | % inc 2018 | % inc 2019 | % inc 2020 |
|---|---|---|---|---|---|---|---|---|---|
| Force adopting online reporting end 2016: | |||||||||
| Metropolitan Police | 29,902 | 32,200 | 30,318 | 29,745 | 24,246 | 7.7% | -5.8% | -1.9% | -18.5% |
| Forces adopting online reporting in 2018 (up to Sep): | |||||||||
| Derbyshire | 2,570 | 2,126 | 2,077 | 2,191 | 1,910 | -17.3% | -2.3% | 5.5% | -12.8% |
| Thames Valley | 6,580 | 5,567 | 5,105 | 4,592 | 3,472 | -15.4% | -8.3% | -10.0% | -24.4% |
| Hampshire | 5,477 | 5,089 | 4,931 | 4,576 | 3,763 | -7.1% | -3.1% | -7.2% | -17.8% |
| Forces adopting online reporting in 2018 (from Oct): | |||||||||
| Merseyside | 3,576 | 3,006 | 3,060 | 2,799 | 2,162 | -15.9% | 1.8% | -8.5% | -22.8% |
| Surrey | 5,021 | 4,614 | 4,172 | 3,913 | 2,909 | -8.1% | -9.6% | -6.2% | -25.7% |
| Forces adopting online reporting in 2019 (from Sep): | |||||||||
| Cheshire | 3,096 | 2,835 | 2,651 | 2,197 | 1,699 | -8.4% | -6.5% | -17.1% | -22.7% |
| Cleveland | 1,086 | 941 | 832 | 894 | 767 | -13.4% | -11.6% | 7.5% | -14.2% |
| Staffordshire | 3,593 | 2,474 | 2,001 | 1,786 | 1,146 | -31.1% | -19.1% | -10.7% | -35.8% |
| Essex | 4,941 | 4,363 | 4,226 | 3,903 | 3,345 | -11.7% | -3.1% | -7.6% | -14.3% |
| Kent | 6,949 | 6,626 | 6,173 | 5,718 | 4,513 | -4.6% | -6.8% | -7.4% | -21.1% |
| Sussex | 5,460 | 5,162 | 5,063 | 5,276 | 3,958 | -5.5% | -1.9% | 4.2% | -25.0% |
| Gloucestershire | 1,159 | 1,105 | 998 | 1,128 | 903 | -4.7% | -9.7% | 13.0% | -19.9% |
| Forces adopting online reporting in 2020 (up to Jun): | |||||||||
| Greater Manchester | 3,960 | 5,441 | 5,027 | 4,897 | 3,218 | 37.4% | -7.6% | -2.6% | -34.3% |
| West Mercia | 3,147 | 2,817 | 2,440 | 2,585 | 1,901 | -10.5% | -13.4% | 5.9% | -26.5% |
| Leicestershire | 2,924 | 2,219 | 2,141 | 1,769 | 1,493 | -24.1% | -3.5% | -17.4% | -15.6% |
| Northamptonshire | 1,603 | 1,374 | 1,460 | 1,499 | 1,102 | -14.3% | 6.3% | 2.7% | -26.5% |
| City of London | 405 | 347 | 299 | 306 | 115 | -14.3% | -13.8% | 2.3% | -62.4% |
| Forces using online self reporting in 2018 (up to Sep) | 14,627 | 12,782 | 12,113 | 11,359 | 9,145 | -12.6% | -5.2% | -6.2% | -19.5% |
| Forces using online self reporting in 2018 (from Oct) | 8,597 | 7,620 | 7,232 | 6,712 | 5,071 | -11.4% | -5.1% | -7.2% | -24.4% |
| Forces using online self reporting in 2019 (from Sep) | 26,284 | 23,506 | 21,944 | 20,902 | 16,331 | -10.6% | -6.6% | -4.7% | -21.9% |
| Forces using online self reporting in 2020 (up to Jun) | 12,039 | 12,198 | 11,367 | 11,056 | 7,829 | 1.3% | -6.8% | -2.7% | -29.2% |
| All other forces | 79,581 | 73,072 | 68,870 | 64,968 | 47,305 | -8.2% | -5.8% | -5.7% | -27.2% |
The Department for Transport is currently unable to reliably differentiate between self-reported casualties over the counter and online in the data.
Therefore, the rest of this paper concentrates on self-reported cases (whether over the counter or online). There is likely to be some switch from over the counter to online reporting: some members of the public who would have gone to a police station to report are likely to do so online instead.
However, overall any large increase in the number of self-reported cases is likely to be attributed to the introduction of online reporting.
Across forces that have not adopted online reporting, casualties in self-reported accidents fell by 0.5% from 2017 to 2018, rose by 10% between 2018 and 2019 and fell by 24% between 2019 and 2020. The data for 2020 is likely to have been impacted by the lockdown.
The size of the change for forces adopting online reporting has varied for each force. In the Metropolitan Police Service (MPS), which adopted online reporting at the end of 2016, casualties in self-reported accidents rose by 35% between 2016 and 2017, by 22% from 2017 to 2018 and by 19% from 2018 to 2019. The number fell from 2019 to 2020 by 9%, but this is much less than the fall in forces (down 24%) that have not adopted online reporting.
Of the forces that adopted online reporting in 2018 (January to September), Derbyshire and Thames Valley saw large increases in the number of casualties in self-reporting accidents between 2017 and 2018 (16% and 48% respectively). In both forces there was a smaller increase from 2018 to 2019 followed by a reduction in 2020. Hampshire’s adoption of online reporting did not result in an increase in the number of accidents reported. However, their reduction from 2019 to 2020 (at 15%) was lower than forces that have not adopted online reporting. Derbyshire and Thames Valley saw a larger reduction from 2019 to 2020 than forces that have not yet adopted online reporting.
Of the forces that introduced online in 2018 (October to December), Merseyside recorded a reduction in the casualties from 2018 to 2019 of 7%. However, this was much less than forces that do not offer online reporting. Surrey, on the other hand, had a large increase of 35% from 2018 to 2019.
Of the seven forces that adopted online reporting in 2019, all except Essex (up 1%) experienced reductions in 2020 although Cleveland (down 8%), Gloucestershire (down 20%) and Cheshire (down 22%) recorded a smaller reduction than in forces that those that have not adopted online reporting.
Of the forces that adopted online reporting in 2020, by the end of June, only Northamptonshire (up 17%) had an increase in casualties in self-reported accidents in 2020. However, West Mercia (down 21%) had a smaller reduction than forces that have not adopted online reporting.
The general picture, with some exceptions, suggests that overall online reporting results in more accidents being reported than would otherwise have been the case, even in a year as unusual as 2020. However, there are differences between forces.
Table 3: Number of casualties in self-reported road accidents, by police force, 2016-2020
| Force | 2016 | 2017 | 2018 | 2019 | 2020 | % inc 2017 | % inc 2018 | % inc 2019 | % inc 2020 |
|---|---|---|---|---|---|---|---|---|---|
| Force adopting online reporting end 2016: | |||||||||
| Metropolitan Police | 4,992 | 6,748 | 8,256 | 9,805 | 8,897 | 35.2% | 22.3% | 18.8% | -9.3% |
| Forces adopting online reporting in 2018 (up to Sep): | |||||||||
| Derbyshire | 599 | 554 | 643 | 694 | 418 | -7.5% | 16.1% | 7.9% | -39.8% |
| Thames Valley | 977 | 742 | 1,099 | 1,289 | 956 | -24.1% | 48.1% | 17.3% | -25.8% |
| Hampshire | 785 | 850 | 845 | 822 | 696 | 8.3% | -0.6% | -2.7% | -15.3% |
| Forces adopting online reporting in 2018 (from Oct): | |||||||||
| Merseyside | 537 | 535 | 786 | 734 | 607 | -0.4% | 46.9% | -6.6% | -17.3% |
| Surrey | 693 | 572 | 597 | 804 | 668 | -17.5% | 4.4% | 34.7% | -16.9% |
| Forces adopting online reporting in 2019 (from Sep): | |||||||||
| Cheshire | 627 | 563 | 492 | 481 | 374 | -10.2% | -12.6% | -2.2% | -22.2% |
| Cleveland | 222 | 152 | 160 | 187 | 172 | -31.5% | 5.3% | 16.9% | -8.0% |
| Staffordshire | 2,082 | 1,498 | 1,208 | 1,154 | 622 | -28.0% | -19.4% | -4.5% | -46.1% |
| Essex | 3,034 | 2,744 | 2,796 | 1,244 | 1,255 | -9.6% | 1.9% | -55.5% | 0.9% |
| Kent | 2,225 | 2,839 | 2,914 | 1,666 | 1,116 | 27.6% | 2.6% | -42.8% | -33.0% |
| Sussex | 1,180 | 1,178 | 1,183 | 1,192 | 806 | -0.2% | 0.4% | 0.8% | -32.4% |
| Gloucestershire | 212 | 275 | 288 | 219 | 176 | 29.7% | 4.7% | -24.0% | -19.6% |
| Forces adopting online reporting in 2020 (up to Jun): | |||||||||
| Greater Manchester | 720 | 1,551 | 1,581 | 1,676 | 1,021 | 115.4% | 1.9% | 6.0% | -39.1% |
| West Mercia | 584 | 555 | 453 | 490 | 385 | -5.0% | -18.4% | 8.2% | -21.4% |
| Leicestershire | 459 | 402 | 345 | 211 | 65 | -12.4% | -14.2% | -38.8% | -69.2% |
| Northamptonshire | 277 | 266 | 151 | 163 | 190 | -4.0% | -43.2% | 7.9% | 16.6% |
| City of London | 89 | 94 | 74 | 96 | 32 | 5.6% | -21.3% | 29.7% | -66.7% |
| Forces using online self reporting in 2018 (up to Sep) | 2,361 | 2,146 | 2,587 | 2,805 | 2,070 | -9.1% | 20.5% | 8.4% | -26.2% |
| Forces using online self reporting in 2018 (from Oct) | 1,230 | 1,107 | 1,383 | 1,538 | 1,275 | -10.0% | 24.9% | 11.2% | -17.1% |
| Forces using online self reporting in 2019 (from Sep) | 9,582 | 9,249 | 9,041 | 6,143 | 4,521 | -3.5% | -2.2% | -32.1% | -26.4% |
| Forces using online self reporting in 2020 (up to Jun) | 2,129 | 2,868 | 2,604 | 2,636 | 1,693 | 34.7% | -9.2% | 1.2% | -35.8% |
| All other forces | 17,172 | 16,529 | 16,452 | 18,086 | 13,830 | -3.7% | -0.5% | 9.9% | -23.5% |
Monthly casualties in self-reported road accidents in police forces that have adopted online reporting
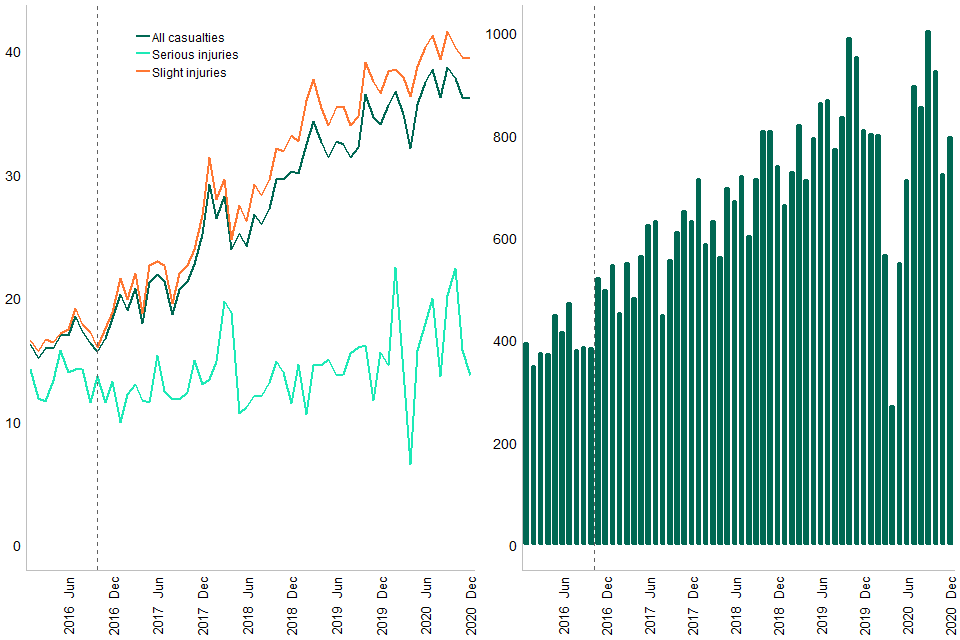
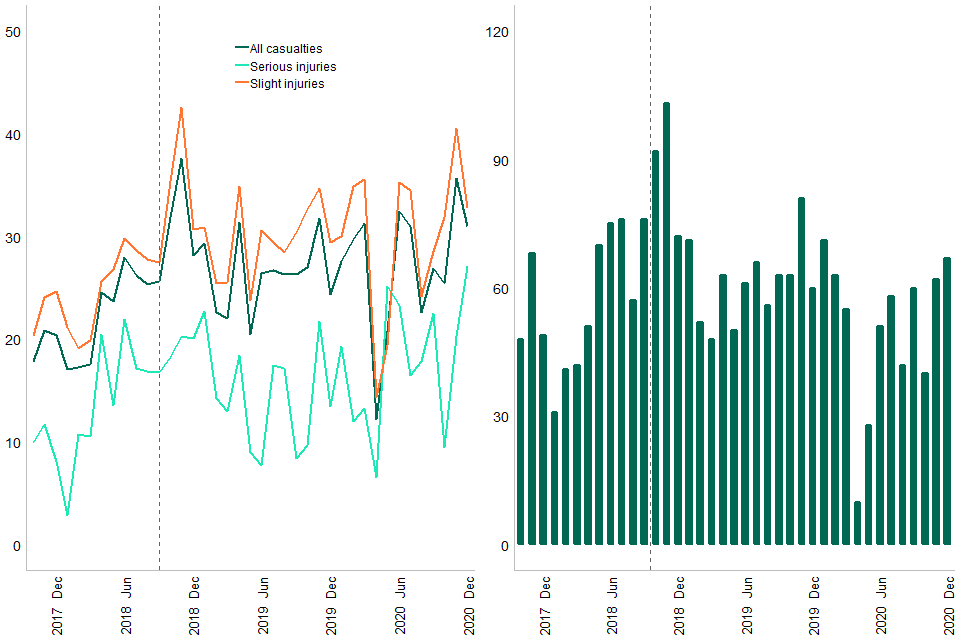
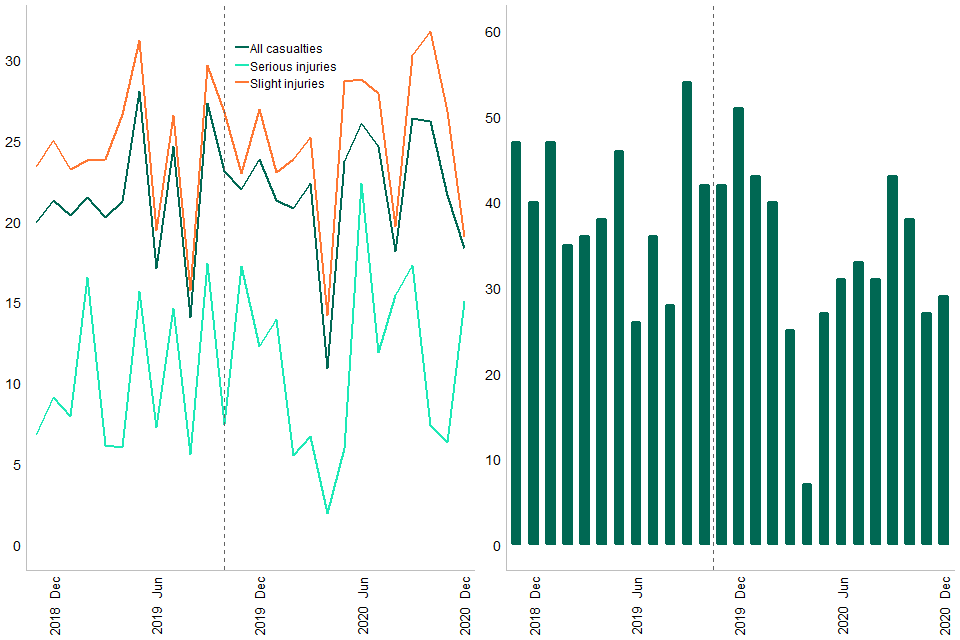
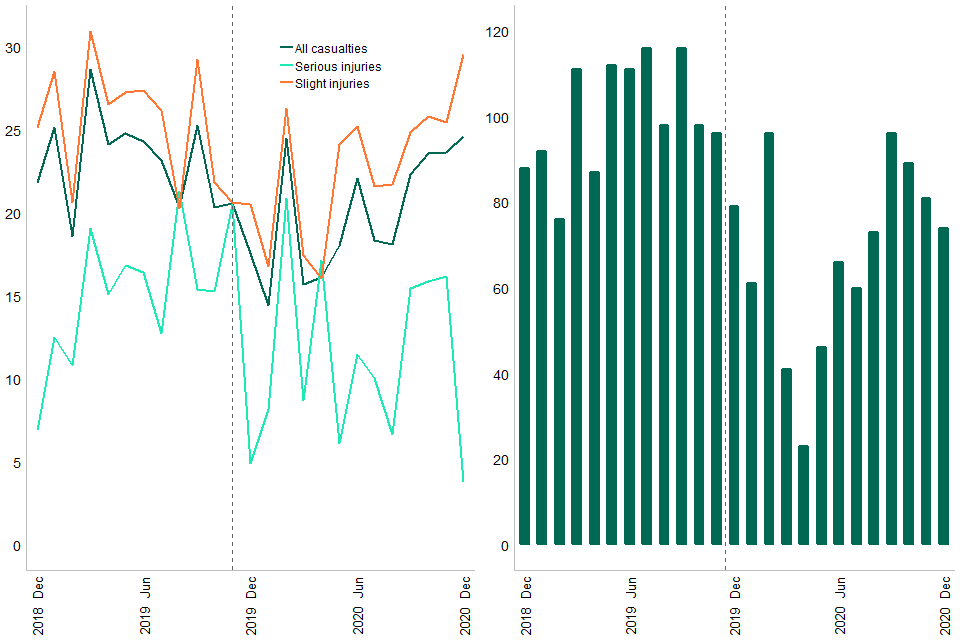
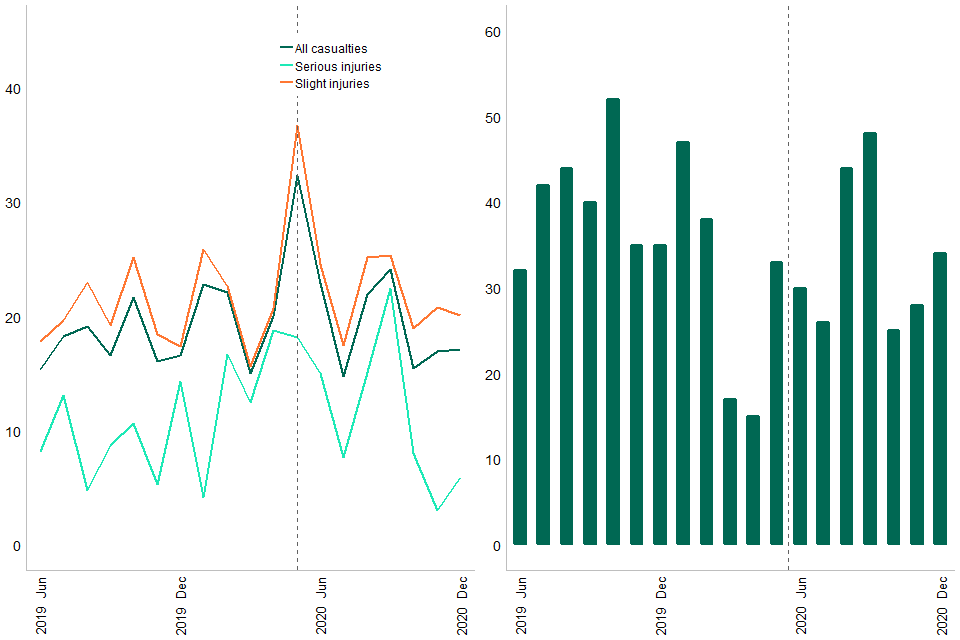
The series of charts below show the impact of the introduction of online reporting in the proportion and number of self-reported casualties by severity over time. Serious and slight injuries have been adjusted to account for changes in the severity reporting systems. More information on the change and adjustment process is available in the 2020 annual report. The change over to online reporting is indicated by the dotted grey line.
In the Metropolitan Police Service (MPS), less than 20% of casualties occurred in self reported accidents, prior to the introduction of online reporting in October 2016. The proportion is now over 40% and the progressive increase has yet to level off. The number of casualties has risen from around 400 a month to around 900.
Chart 1: Percentage of casualties by severity and number of overall casualties in self-reported road accidents, by month, Metropolitan Police
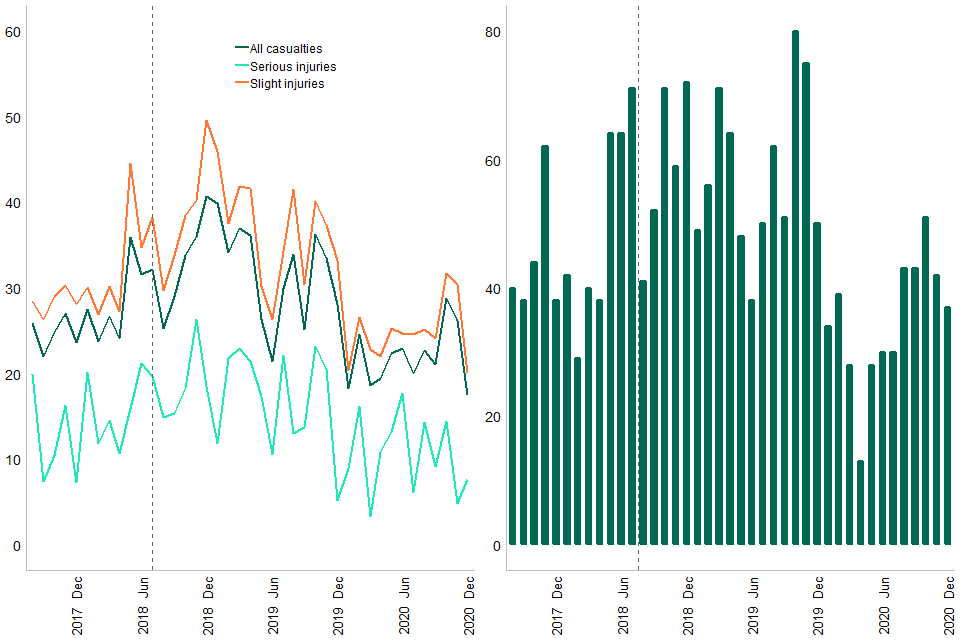
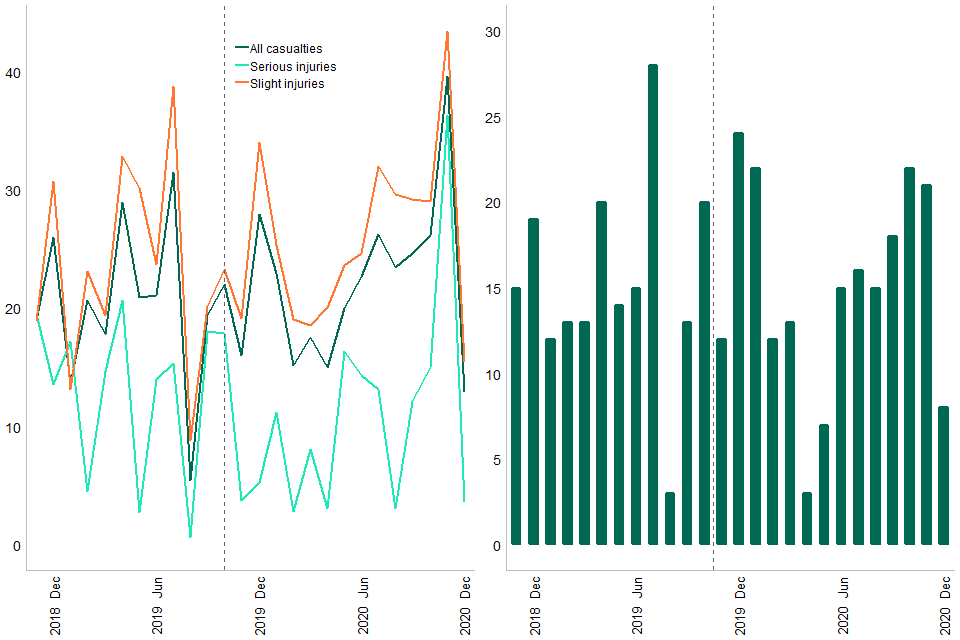
In Derbyshire, the proportion of casualties occurred in self reported accidents was around 30% before online reporting was introduced. This then rose to around 40% before falling back to around 20%. The monthly number of casualties had risen from around 40 to a high point of over 80 before falling back.
Chart 2: Percentage of casualties by severity and number of overall casualties in self-reported road accidents, by month, Derbyshire Police
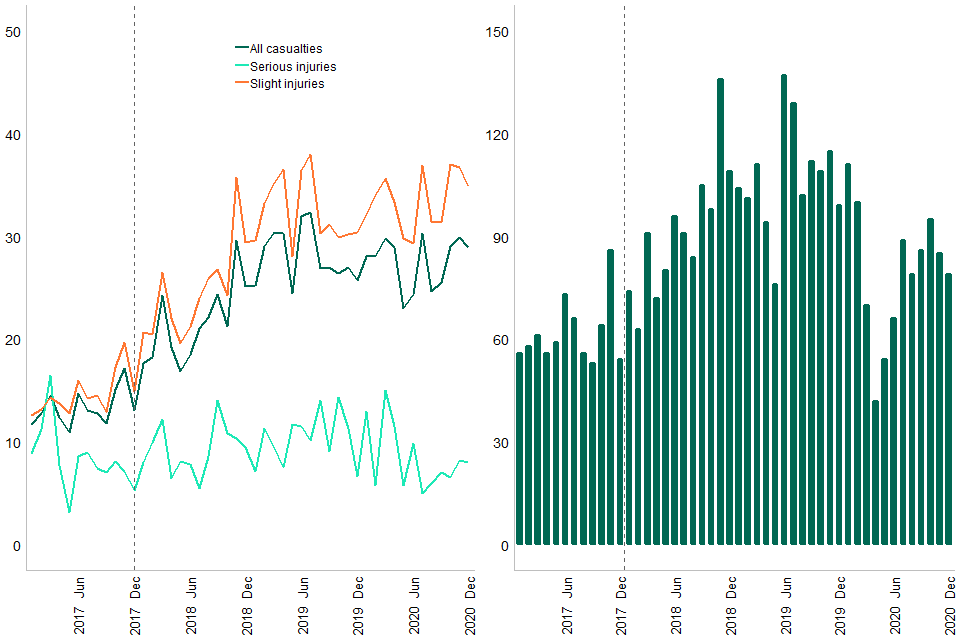
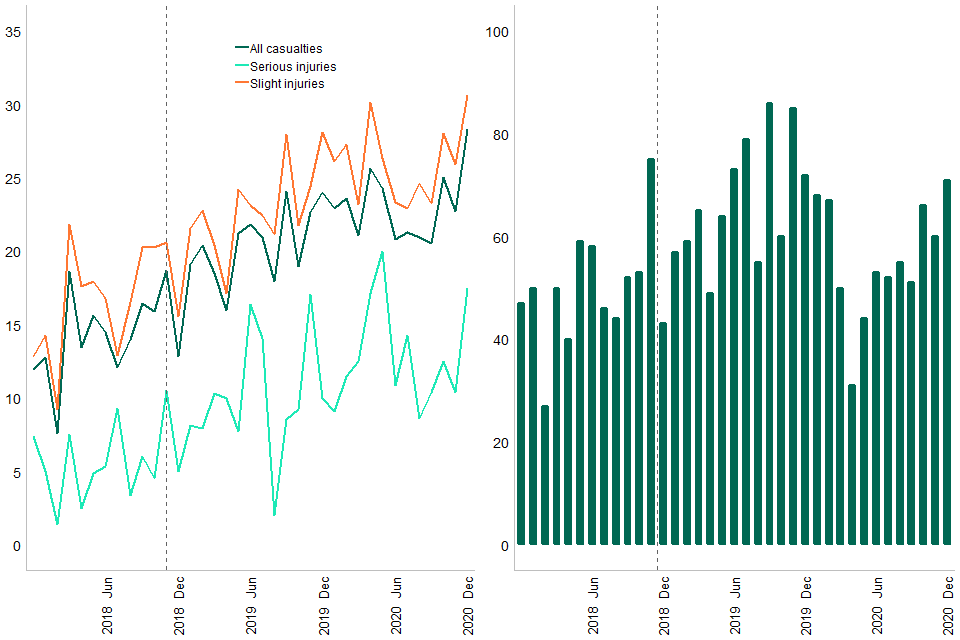
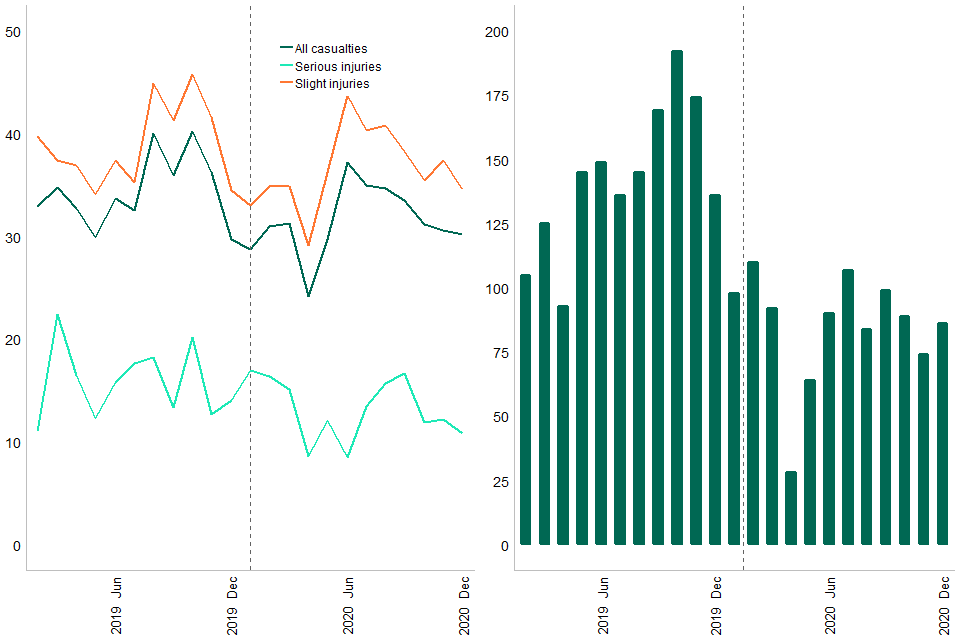
In the Thames Valley area, the proportion of casualties occurred in self reported accidents was around 15% before online reporting was introduced. This has now risen to over 30%. The number of casualties has risen from around 60 a month to around 100.
Chart 3: Percentage of casualties by severity and number of overall casualties in self-reported road accidents, by month, Thames Valley Police
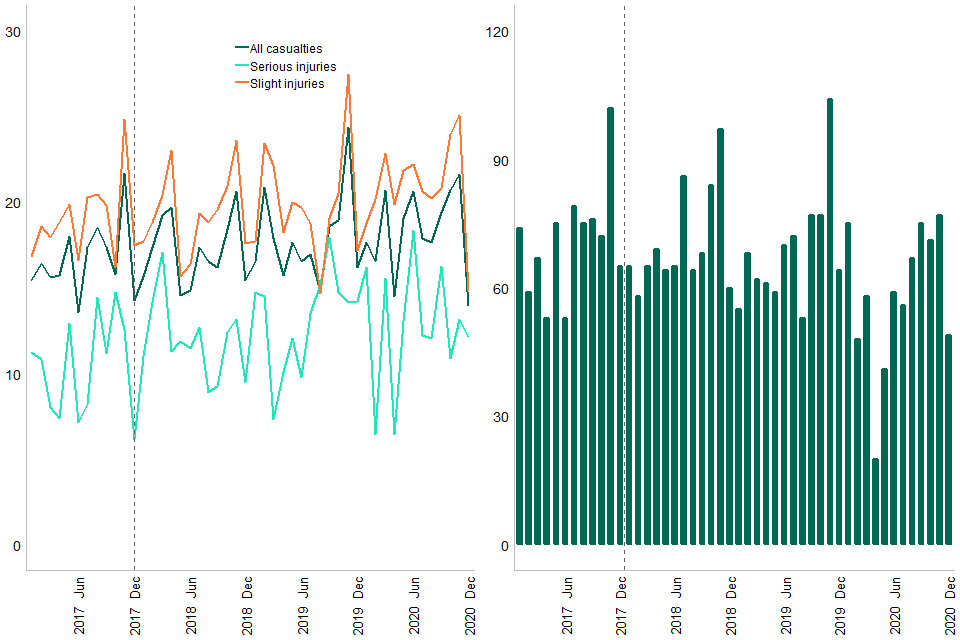
The number of casualties in self-reporting accidents in Hampshire is variable, but has not shown any discernible change since online reporting was introduced.
Chart 4: Percentage of casualties by severity and number of overall casualties in self-reported road accidents, by month, Hampshire Police
Merseyside experienced an initial increase in the number of self-reported accidents when online reporting was introduced, but reverted to pre online levels within three months.
Chart 5: Percentage of casualties by severity and number of overall casualties in self-reported road accidents, by month, Merseyside Police
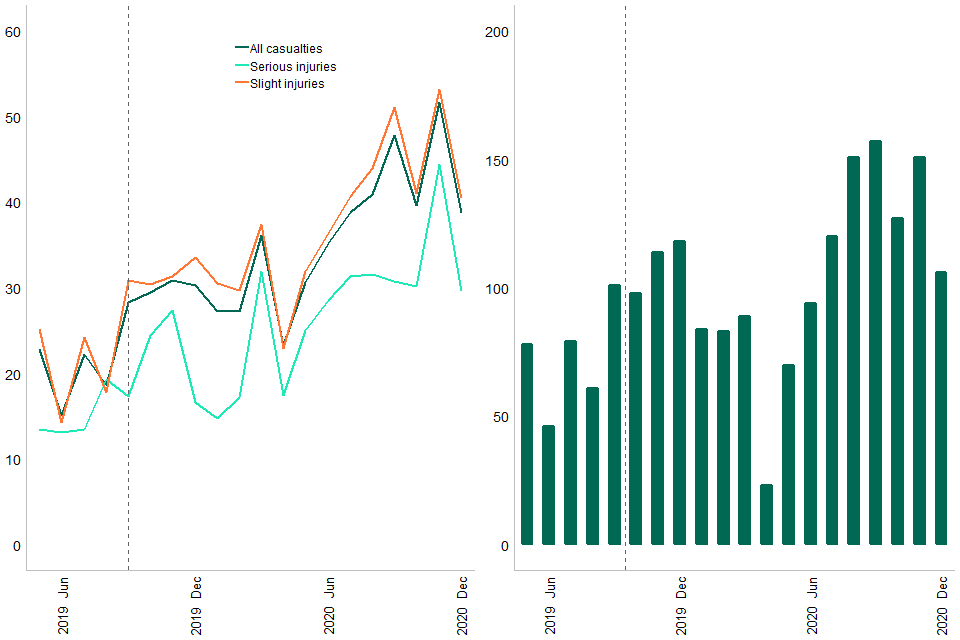
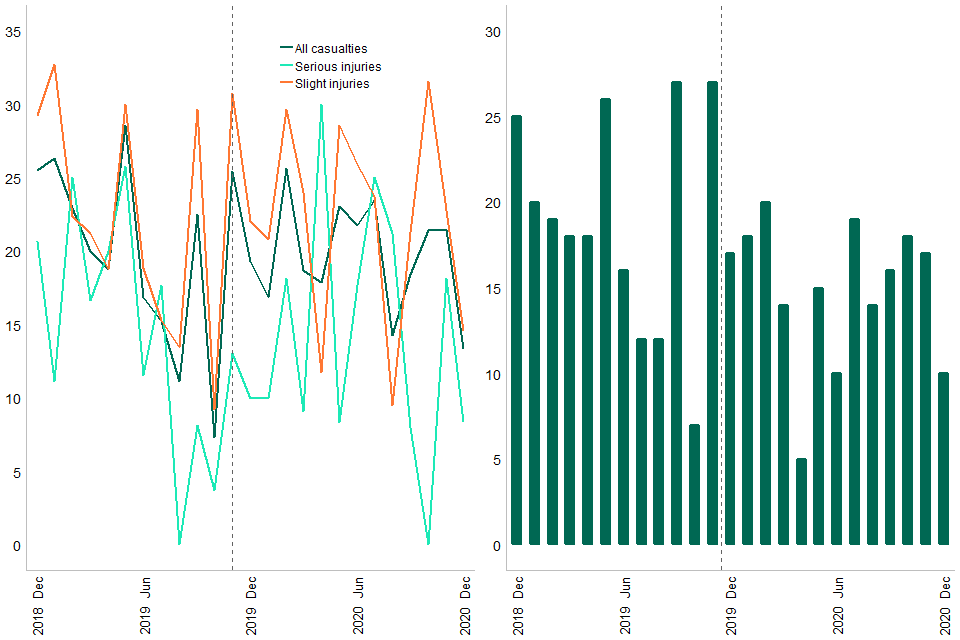
Prior to introducing online reporting in Surrey, the proportion of self-reported accidents was around 20%. It has now risen to around 30%. The number of casualties in self-reported accidents has risen from about 50 a month to around 70.
Chart 6: Percentage of casualties by severity and number of overall casualties in self-reported road accidents, by month, Surrey Police
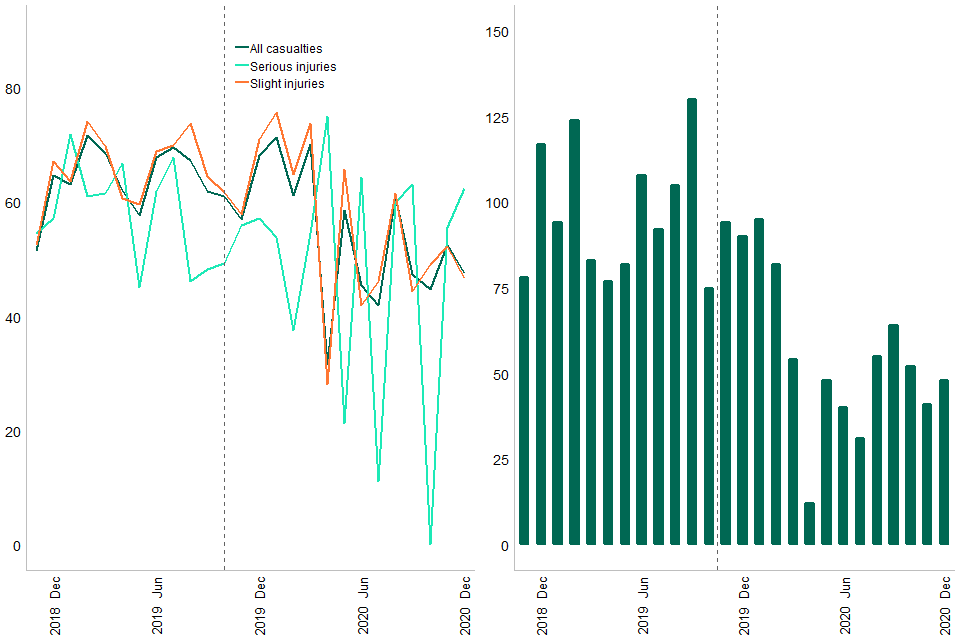
Before online reporting was introduced in Essex, the proportion of self-reported accidents was around 20%. It has now risen to around 50%. The number of casualties in self-reported accidents has risen from about 75 a month to around 150.
Chart 7: Percentage of casualties by severity and number of overall casualties in self-reported road accidents, by month, Essex Police
The proportion of casualties in self-reported road accidents in Kent is highly variable. This was the case before and after the introduction of online reporting.
Chart 8: Percentage of casualties by severity and number of overall casualties in self-reported road accidents, by month, Kent Police
The proportion of casualties in self-reported road accidents in Cheshire has been around 20% before the introduction of online reporting. It is now around 30%, but the number of casualties are about the same.
Chart 9: Percentage of casualties by severity and number of overall casualties in self-reported road accidents, by month, Cheshire Police
Prior to introducing online reporting in Cleveland, the proportion of self-reported accidents was variable and has remained so since online reporting was introduced.
Chart 10: Percentage of casualties by severity and number of overall casualties in self-reported road accidents, by month, Cleveland Police
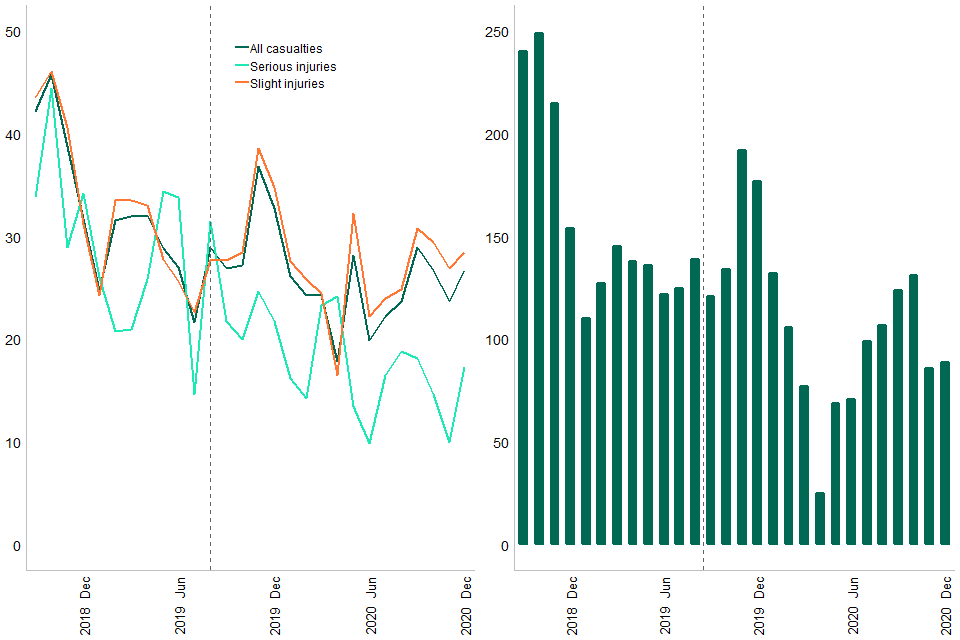
The proportion of self-reported accidents in Staffordshire was around 70% before adopting online reporting. It fell a few months after adoption and is now around 50%. The number of casualties in self-reported accidents per month have fallen from around 75 to 50.
Chart 11: Percentage of casualties by severity and number of overall casualties in self-reported road accidents, by month, Staffordshire Police
There has been no clear change in the proportion of casualties in self-reported accidents since the introduction of online reporting in Gloucestershire.
Chart 12: Percentage of casualties by severity and number of overall casualties in self-reported road accidents, by month, Gloucestershire Police
There has been no clear change in the proportion of casualties in self-reported accidents since the introduction of online reporting in Sussex.
Chart 13: Percentage of casualties by severity and number of overall casualties in self-reported road accidents, by month, Sussex Police
There are too few accidents in the City of London to draw conclusions on the trend following the adoption of online reporting.
There is no clear trend in the proportion of casualties in self-reporting accidents in Greater Manchester following the adoption of online reporting.
Chart 14: Percentage of casualties by severity and number of overall casualties in self-reported road accidents, by month, Greater Manchester Police
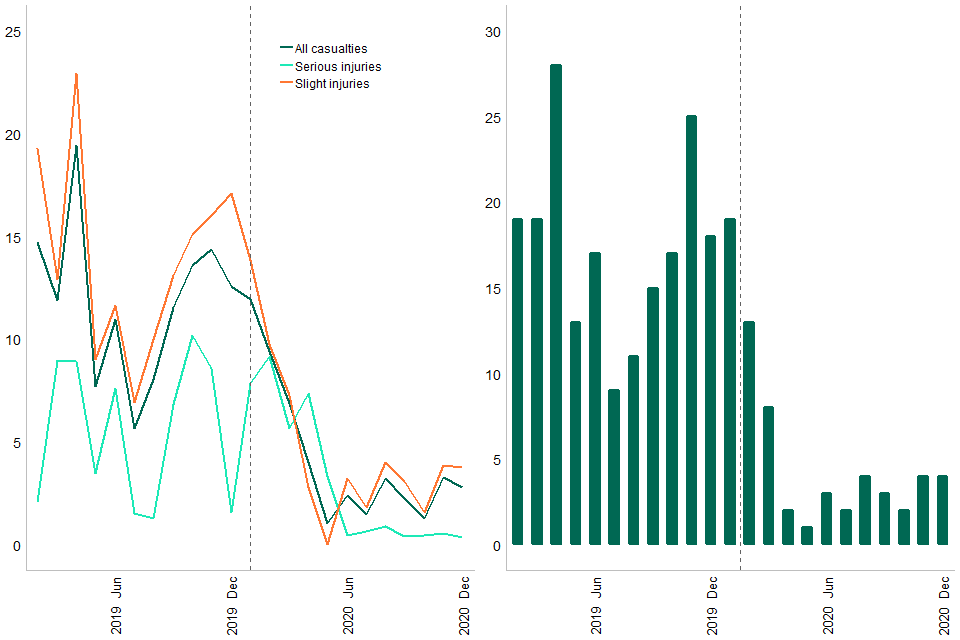
Before the introduction of online reporting, the proportion of casualties is self-reported accidents in Leicestershire was around 15%. It has no fallen to 5%. The monthly number of casualties in these accidents has fallen from around 20 to 5.
Chart 15: Percentage of casualties by severity and number of overall casualties in self-reported road accidents, by month, Leicestershire Police
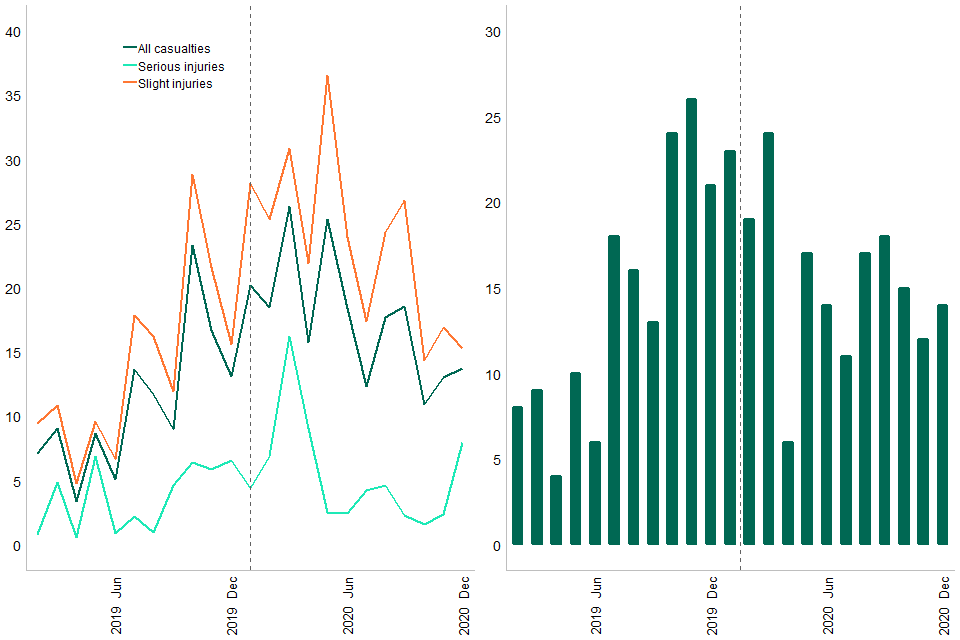
The proportion of casualties in self-reported road accidents in Northamptonshire rose from around 25% prior to the introduction of online reporting before rising to 35% and then dropping back.
Chart 16: Percentage of casualties by severity and number of overall casualties in self-reported road accidents, by month, Northamptonshire Police
Before online reporting was introduced in West Mercia, the proportion of self-reported accidents was around 20%. It had risen to 25% before online reporting was introduced and has remained at this level since.
Chart 17: Percentage of casualties by severity and number of overall casualties in self-reported road accidents, by month, West Mercia Police
Changes in trends by road user type
Since 2016, around 94% of casualties in self-reported road accidents each year are pedestrians, pedal cyclists, motorcyclists or car occupants. Therefore, table 4 shows the changes for these casualty types only.
Between 2016 and 2017 in accidents that were self-reported online in the MPS, pedal cyclist casualties increased by 50%, pedestrians by 45%, motorcyclists by 41%, and car occupants by 26%. For the second full year of online reporting in the MPS, car occupant casualties rose by 34% and the increases for the other casualty types were smaller. In the third year car occupants rose by 19%. Between 2019 and 2020 motorcycle casualties rose by 30% and pedal cycle casualties by 3%. Pedestrian casualties fell by 29% and car occupant casualties by 20%.
For forces that adopted online reporting in 2018 up to the end of September, Derbyshire saw the biggest increase for pedestrians (34%) while Thames Valley saw largest increases for car occupants (78%), motorcyclists (59%) and pedal cyclists (28%). Within these forces only motorcycle casualties rose (up 15%) from 2019 and 2020.
For the two forces that adopted online reporting in 2018 after September, Surrey saw increases for all casualty types: motorcyclists (100%), cars (46%), pedal cyclists (20%) and pedestrians (16%), while Merseyside only saw increases for pedestrians (2%). From 2019 to 2020, there were increases in pedal cycle casualties in both forces and for motorcycle casualties on Merseyside.
For the seven forces that adopted online reporting in 2019, pedestrian and car occupant casualties in self-reported accidents fell in all areas. There were increases for pedal cyclist and motorcycle casualties in some forces, the highest increases being recorded in Essex - up 42% for pedal cycle casualties and 22% for motorcyclists.
For the five forces that introduced online report in 2020 (up to June), casualties for all four user types fell overall from 2019 to 2020 between 22% and 42%. Pedal cycle casualties rose in West Mercia (up 22%) and for all user types in Northamptonshire.
For forces that have not adopted online reporting, the year-on-year percentage changes between 2016 to 2017 to 2018 to 2019 for all these casualty types range between a reduction of 9% and an increase of 13%. Between 2019 and 2020 all user types fell significantly. Pedestrians were down 29%, car occupants (down 27%), pedal cyclists (down 10%) and motorcyclists (down 7%).
Generally, forces that have adopted online reporting have recorded larger increases (or smaller decreases) for each of these 4 casualty types than for those forces that have not adopted online reporting. These differences might reflect differences in travel behaviours of the population of these police forces and therefore the type of accidents that occur in each of them.
Table 4: Percentage change of casualties in self-reported road accidents, by police force and user type, 2016/17-2019/20
| Force | Year | Pedestrians | Pedal cyclists | Motorcyclists | Car occupants |
|---|---|---|---|---|---|
| Force adopting online reporting end 2016: | |||||
| Metropolitan Police | 2016/17 | 45.0% | 50.2% | 40.8% | 26.4% |
| Metropolitan Police | 2017/18 | 13.6% | 9.6% | 16.8% | 34.2% |
| Metropolitan Police | 2018/19 | 3.1% | 7.7% | 78.3% | 19.3% |
| Metropolitan Police | 2019/20 | -28.7% | 2.7% | 30.4% | -19.5% |
| Forces adopting online reporting in 2018 (up to Sep): | |||||
| Derbyshire | 2017/18 | 33.9% | 1.7% | 27.0% | 16.2% |
| Thames Valley | 2017/18 | 17.4% | 27.7% | 59.0% | 78.0% |
| Hampshire | 2017/18 | 17.2% | 3.3% | -9.5% | -11.8% |
| Derbyshire | 2018/19 | 6.5% | 1.7% | -4.3% | 19.5% |
| Thames Valley | 2018/19 | -9.7% | 10.3% | -11.3% | 33.1% |
| Hampshire | 2018/19 | -16.4% | -3.9% | 16.4% | 0.4% |
| Derbyshire | 2019/20 | -47.6% | -14.9% | -53.3% | -41.5% |
| Thames Valley | 2019/20 | -32.9% | -16.7% | 14.5% | -33.3% |
| Hampshire | 2019/20 | -25.7% | -7.8% | -12.8% | -16.5% |
| Forces adopting online reporting in 2018 (from Oct): | |||||
| Merseyside | 2018/19 | 2.3% | -14.3% | -30.8% | -1.5% |
| Surrey | 2018/19 | 16.0% | 19.9% | 100.0% | 45.6% |
| Merseyside | 2019/20 | -37.4% | 22.0% | 72.2% | -24.2% |
| Surrey | 2019/20 | -38.6% | 25.2% | -12.9% | -27.6% |
| Forces adopting online reporting in 2019: | |||||
| Cheshire | 2019/20 | -41.9% | -6.5% | -26.9% | -25.2% |
| Cleveland | 2019/20 | -28.0% | 12.8% | -25.0% | -3.9% |
| Staffordshire | 2019/20 | -45.1% | -17.7% | -35.9% | -48.5% |
| Essex | 2019/20 | -5.3% | 41.5% | 22.2% | -8.3% |
| Kent | 2019/20 | -30.4% | -11.2% | -43.9% | -35.7% |
| Sussex | 2019/20 | -49.3% | -5.9% | -17.6% | -42.0% |
| Gloucestershire | 2019/20 | -37.5% | 8.1% | -64.3% | -23.3% |
| Forces adopting online reporting in 2020 (up to Jun): | |||||
| Greater Manchester | 2019/20 | -47.3% | -29.4% | -35.0% | -39.3% |
| West Mercia | 2019/20 | -25.7% | 22.2% | -29.2% | -32.5% |
| Leicestershire | 2019/20 | -59.0% | -61.4% | -71.4% | -80.5% |
| Northamptonshire | 2019/20 | 35.0% | 40.0% | 100.0% | 6.5% |
| City of London | 2019/20 | -69.0% | -60.0% | -90.9% | -55.6% |
| Forces adopting online reporting in 2018 by Sep | 2017/18 | 21.9% | 11.7% | 17.3% | 27.9% |
| Forces adopting online reporting in 2018 by Sep | 2018/19 | -7.1% | 2.8% | 1.1% | 21.4% |
| Forces adopting online reporting in 2018 by Sep | 2019/20 | -35.7% | -12.9% | -14.6% | -31.7% |
| Forces adopting online reporting in 2018 from Oct | 2018/19 | 7.4% | 0.6% | 40.4% | 20.1% |
| Forces adopting online reporting in 2018 from Oct | 2019/20 | -37.9% | 23.6% | 6.2% | -26.1% |
| Forces adopting online reporting in 2019 | 2019/20 | -34.0% | 0.5% | -24.2% | -31.2% |
| Forces adopting online reporting in 2020 by Jun | 2019/20 | -41.8% | -22.9% | -41.3% | -37.2% |
| Forces that have not adopting online reporting | 2016/17 | 3.1% | 5.7% | -8.8% | -8.3% |
| Forces that have not adopting online reporting | 2017/18 | -2.7% | -4.6% | -5.2% | 2.4% |
| Forces that have not adopting online reporting | 2018/19 | 12.9% | 7.4% | 8.5% | 11.7% |
| Forces that have not adopting online reporting | 2019/20 | -29.0% | -10.3% | -7.4% | -26.5% |
Conclusion on the impact on trends
In summary, online reporting has resulted in more accidents being reported in most of the police forces that have introduced this method of self-reporting compared to forces that have not. While forces had different starting points in terms of the proportion of accidents that are self-reported, trends over time in several forces show a progressive increase in self-reported slight casualties. The size of the effect, and the road user groups most impacted, differ between forces, and is likely to reflect the mix of travel patterns and accidents in these police force areas. It also suggests that collisions involving vulnerable road users (pedestrians, pedal cyclists and motorcyclists) are reported more online.
Because of the number and size of forces having adopted online reporting, this is already impacting the national figures. Online reporting tools delivered through the Single Online Home project will be made available to more police forces in the future and as a result, the department anticipates that this will impact even more the total number of accidents and casualties reported as the system is adopted. Other forces have already planned to adopt online reporting in the near future. It is therefore expected that the discrepancy in data trends caused by the introduction of online reporting will continue to expand.
The department will explore further how to estimate the impact of the introduction of online reporting as part of the STATS19 review. This will include research to understand differences in practices of back office staff between forces where online reporting is available, and review the STATS19 requirements of online reporting from a user perspective.
Impact on quality
The introduction of online reporting has also impacted the quality of data received by the Department. It is believed that the introduction of online reporting has introduced a different interpretation for unknown values (for example, unknown to the public as opposed to unknown by the police) that has not been subsequently populated by the police. As a result, the number of unknown values on some variables like left hand drive vehicle, special conditions at site and carriageway hazards, has increased compared to previous years.
The specific variables affected are the following:
Vehicle level variables
-
Skidding or overturning
-
Hit object in carriageway
-
Vehicle leaving carriageway
-
Vehicle location
-
First object hit off carriageway
-
Junction location of vehicle
-
Was vehicle left hand drive?
-
First point of impact
-
Towing and articulation
Accident level variables
-
Weather conditions
-
Junction control
-
Carriageway type
-
Pedestrian crossing
-
Special conditions at site
-
Carriageway hazards
-
Junction type
-
Road surface conditions
The vast majority of the unknown values above are observed in the Metropolitan Police Service, however there are indications that some, including weather conditions and carriageway type, are also observed in other online reporting forces.
Comparisons with earlier years for these variables should therefore be made with caution. This is indicated as a footnote in published tables where relevant.
In particular, there has been an issue in the recording of the left hand drive information for vehicles in the Metropolitan Police Service. There has been a large increase in unknowns for this field since 2016, which is linked to the introduction of online reporting, and a large increase in vehicles recorded as left hand drive since 2016, which is believed to be linked to the introduction of COPA.
This is indicated in RAS40005, which has been amended to include 2 tables since 2017, 1 for Great Britain and 1 for Great Britain excluding the Metropolitan Police Service.
The department is actively engaged with the project team to improve the capture of the geographic location of the collision and to add additional validation to improve the quality of online self-reported data.
Instructions for printing and saving
Depending on which browser you use and the type of device you use (such as a mobile or laptop) these instructions may vary.
You will find your print and save options in your browser’s menu. You may also have other options available on your device. Tablets and mobile device instructions will be specific to the make and model of the device.
How to search
Select Ctrl and F on a Windows laptop or Command and F on a Mac
This will open a search box in the top right-hand corner of the page. Type the word you are looking for in the search bar and press enter.
Your browser will highlight the word, usually in yellow, wherever it appears on the page. Press enter to move to the next place it appears.
Contact details
Road safety statistics
Email roadacc.stats@dft.gov.uk