Reported road casualties Great Britain, annual report: 2024
Published 25 September 2025

© Crown copyright 2025
This publication is licensed under the terms of the Open Government Licence v3.0 except where otherwise stated. To view this licence, visit nationalarchives.gov.uk/doc/open-government-licence/version/3 or write to the Information Policy Team, The National Archives, Kew, London TW9 4DU, or email: psi@nationalarchives.gov.uk.
Where we have identified any third party copyright information you will need to obtain permission from the copyright holders concerned.
This publication is available at https://www.gov.uk/government/statistics/reported-road-casualties-great-britain-annual-report-2024/reported-road-casualties-great-britain-annual-report-2024
About this release
This release provides the number of personal injury road traffic casualties in Great Britain that were reported by the police to the Department for Transport in 2024 using the STATS19 reporting system.
This report focuses on severity, road user group, age and sex of these casualties, compared with previous years and over the last decade (that is, since 2014). Other variables and a longer time series are available in accompanying data tables, via our interactive casualty dashboard, data download tool and open dataset.
These are accredited official statistics[footnote 1] and were independently reviewed by the Office for Statistics Regulation in July 2009. For more information, see the about these statistics section.
We welcome any feedback on the statistics, by email to roadacc.stats@dft.gov.uk.
1. Headline figures
Chart 1 shows the trend in fatal road casualties over the last 4 decades. Since 1979, there has been a general downward trend in the number of people killed on roads in Great Britain with a flatter trend in the decade since 2010. In 2024, road casualties showed a slight decline from 2023.
In reported road collisions in Great Britain in 2024, the final estimates are:
-
1,602 fatalities, a decline of 1% compared to 2023
-
29,467 killed or seriously injured (KSI) casualties, a decline of 1% compared to 2023
-
128,272 casualties of all severities, a decline of 4% compared to 2023
Considering road collision rates per billion miles travelled, the final estimates show:
-
340 billion vehicle miles travelled in 2024, a return to travel levels seen in 2019 prior to the COVID-19 pandemic
-
4.7 road fatalities per billion vehicle miles travelled in 2024, down 3% compared to 2023
The final estimates further show:
-
of the four major road user types the group with the most fatalities was car occupants with 692 fatalities in 2024
-
in 2024, 76% of fatalities and 61% of casualties of all severities were male
-
in international comparisons for 2024, Great Britain ranked 4 out of 36 countries with available data for lowest number of road fatalities per million population
Chart 1: Reported road fatalities in Great Britain, 1979 to 2024

Statistical summary
Between 2023 and 2024 there was a small decline in reported road casualties in Great Britain with casualty numbers broadly following the trends observed in recent years. The number of fatalities in 2024 is the lowest recorded, outside of years affected by the COVID-19 pandemic, although fatality figures are relatively low and can fluctuate from year to year. The number of seriously injured casualties has also shown a similar slight decline in recent years with a larger decline observed in the number of slightly injured casualties.
While car occupants accounted for the majority of road casualties in 2024, the highest casualty rates per billion miles travelled were for motorcyclists, indicating that a person is more likely to be injured on the road when travelling by motorcycle than for other modes.
In 2024, very few casualties were recorded on motorways, despite motorways accounting for a fifth of all road traffic in Great Britain, indicating that a person is less likely to be involved in a collision when travelling on a motorway compared to urban or rural roads.
2. Things you need to know
2.1 Severity adjustment
The figures in this release for injured casualties are based on adjusting figures reported by the police to take account of changes in the reporting of injury severity by some police forces in recent years. These adjusted figures can reliably be used to compare trends over time across the country. More details can be found in our severity adjustments guidance.
2.2 Data coverage
There is no obligation for people to report all personal injury collisions to the police. These figures, therefore, do not represent the full range of all collisions or casualties in Great Britain. All collisions reported by the police and that occurred on a public highway involving at least one motor vehicle, horse rider or pedal cyclist, and where at least one person was injured, are included in these statistics.
In previous years unexpected issues with data collection for some police forces have meant that the reliability and accuracy of the recorded road collisions in some regions cannot be guaranteed as some collisions may have been misrecorded or not recorded at all. This is unlikely to noticeably impact on the overall Great Britain road collision trends, but caution should be applied when considering geographical breakdowns by police force area (RAS0401) and local authority (RAS0403). Further details can be found in the quality and methodology report.
More information on STATS19, how road traffic casualty data is collected from police forces and how these figures are produced can be found in the accompanying guidance.
3. Overall casualties and rates
This report considers casualty patterns both in terms of absolute counts and in terms of casualty rates taking into account distance travelled. Casualty rates are calculated by dividing counts by vehicle or pedestrian mileage.
3.1 Casualties by severity
Casualties are broken down into fatalities (people killed in road collisions), and those injured (further split into seriously and slightly injured based on type of injury sustained). Killed and seriously injured casualties are commonly grouped together as ‘KSIs’.
It has long been known that non-fatal (and particularly slight) casualties are under-reported to the police, though we believe that the trends shown are likely to reflect genuine changes. Further information is available in the quality section below.
Chart 2 and Table 1 show the trend in road casualties by severity over the last decade. There is a decrease in casualty numbers between 2023 and 2024 - with this being a continuation of the slightly decreasing trend in the number of casualties in the last 10 years.
Casualty counts are also impacted by traffic levels with casualty trends following a broadly similar pattern to motor traffic (in terms of billion vehicle miles) during periods of national COVID-19 lockdown. Trends in casualty rates are further explored in the next section. In 2024, there were 340 billion vehicle miles travelled, up 2% compared to 2023.
In reported road collisions in Great Britain in 2024, there were an estimated:
-
1,602 fatalities, a decline of 1% compared to 2023
-
29,467 KSI casualties, a decline of 1% compared to 2023
-
128,272 casualties of all severities, a decline of 4% compared to 2023
Chart 2: Reported road casualties by severity and all road traffic (billion vehicle miles) in Great Britain, 2014 to 2024 RAS0201

Table 1: Reported road casualties by severity in Great Britain, 2024 compared with 2023 and 2014 RAS0201
| Severity | 2024 | % change from 2023 | % change from 2014 |
|---|---|---|---|
| Killed | 1,602 | -1 | -10 |
| Seriously injured (adjusted) | 27,865 | 0 | -15 |
| KSI (adjusted) | 29,467 | -1 | -14 |
| Slightly injured (adjusted) | 98,805 | -4 | -38 |
| All casualties | 128,272 | -4 | -34 |
| Traffic (billion vehicle miles) | 340 | 2 | 7 |
3.2 Trends in casualty rates
Chart 3 and Table 2 show the trend in road casualty rates over the last decade. These show that the rates of fatalities and KSIs have steadily declined by a small amount over the last 10 years. The overall casualty rate has fallen by a larger amount over the last 10 years. It is uncertain from the current data if the decline in the overall casualty rate reflects a genuine reduction in the number of casualties or if this reflects changes in the level of reporting of collisions, particularly collisions with no fatalities or serious injuries.
In reported road collisions in Great Britain in 2024, there were an estimated:
-
4.7 fatalities per billion vehicle miles travelled, a decline of 3% compared to 2023
-
87 KSI casualties per billion vehicle miles travelled, a decline of 2% compared to 2023
-
378 casualties of all severities per billion vehicle miles travelled, a decline of 5% compared to 2023
Chart 3: Reported road casualty rates per billion vehicle miles by severity in Great Britain, 2014 to 2024 RAS0201

Table 2: Reported road casualty rates per billion vehicle miles by severity in Great Britain, 2024 compared to 2023 and 2014 RAS0201
| Severity | 2024 | % change from 2023 | % change from 2014 |
|---|---|---|---|
| Fatalites per billion vehicle miles | 4.7 | -3 | -15 |
| KSIs per billion vehicle miles | 86.7 | -2 | -20 |
| Casualties per billion vehicle miles | 377.6 | -5 | -38 |
4. Casualties and rates by road user type
Vulnerable road users include pedestrians, pedal cyclists, motorcyclists and e-scooter users.
Car occupant casualties accounted for 43% of road fatalities and 55% of all road casualties in 2024, and the majority of road collisions involved at least one car.
Higher casualty rates are observed for vulnerable road users than other vehicle occupants. However very few other road users are killed in collisions involving pedestrians or cyclists and these higher rates reflect the fact that vulnerable road users are more likely to be killed or injured when hit by a vehicle. Our separate road safety factsheets provide more detail on pedal cycle, motorcyclist, pedestrian and e-scooter casualties.
4.1 Fatalities and rates by road user type
The 4 main road user types (car occupants, pedestrians, motorcyclists and pedal cyclists) are used in the charts below to show comparisons between 2024 and 2023.
Chart 4 and Table 3 show fatalities for different road users over the past decade. This shows that in 2024, the group with the largest number of fatalities was car occupants, followed by pedestrian, motorcyclists and then pedal cyclists. The number of fatalities for all of these groups is similar to what was seen in 2023. Overall, most road user types have shown a decrease in reported fatalities over the last 10 years, although there are some notable exceptions, the number of motorcyclist fatalities has remained fairly stable over this period with 2024 showing a slight increase from 2023. The number of HGV occupants fatalities has also increased over this time period, however there are a small number of fatalities in this group and this is subject to year on year fluctuations.
In 2024, 43% of fatalities were car occupants, 26% were pedestrians, 21% were motorcyclists and 5% were pedal cyclists. Of these 4 road user types, compared to 2023:
-
motorcyclist fatalities showed an increase of 8%
-
pedal cyclist fatalities showed a decline of 6%
-
car occupant fatalities showed a decline of 5%
-
pedestrian fatalities showed an increase of 1%
Chart 4: Reported road fatalities by road user type in Great Britain, 2024 compared with 2023 RAS0201
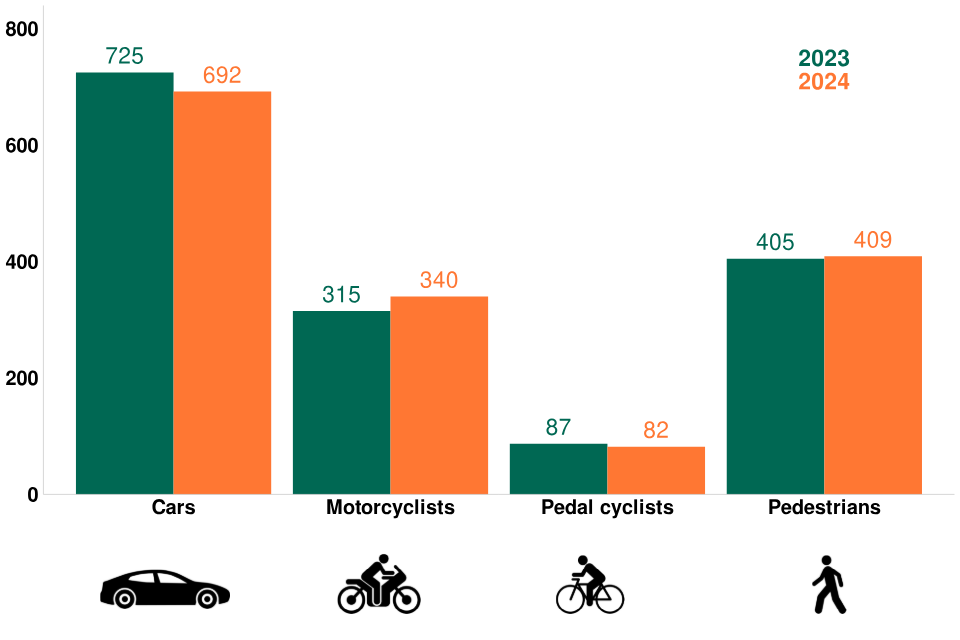
Table 3: Reported road fatalities by road user type in Great Britain, 2024 compared with 2023 and 2014 RAS0201
| Road user | 2024 | % change from 2023 | % change from 2014 |
|---|---|---|---|
| Car occupants | 692 | -5 | -13 |
| Pedestrians | 409 | 1 | -8 |
| Motorcyclists | 340 | 8 | 0 |
| Pedal cyclists | 82 | -6 | -27 |
| LGV occupants | 32 | -16 | -3 |
| Other vehicle occupants | 27 | -25 | 4 |
| HGV occupants | 17 | 21 | 21 |
| Bus or coach occupants | 3 | -25 | -57 |
‘Other vehicle occupants’ include e-scooters, which account for much of the increase in casualties for this road user category compared to 2014 figures. An annual update on e-scooter casualties for 2024, which are not explicitly covered in this release, is available in our e-scooter factsheet.
Chart 5 and Table 4 show reported road collision fatalities in Great Britain per billion miles travelled for different road users over the past decade. For all road users except pedestrians, rates are calculated from billion vehicle miles travelled (Department for Transport’s Road Traffic Statistics). For pedestrians, rates are calculated from billion miles walked (Department for Transport’s National Travel Survey).
Compared to 2014, the fatality rates for pedal cyclists have continually fallen over the last decade (Chart 5). Fatality rates for motorcyclists and car occupants have remained fairly stable for most of this period, although there has been a slight fall in recent years. Pedestrian fatality rates declined during the COVID-19 pandemic and have subsequently remained substantially below pre-pandemic levels.
As shown in Table 4, of the 4 main road user types, comparing 2024 to 2023, fatality rates have fallen for all except motorcyclists, who have seen a slight increase in 2024 following a decline in the fatality rare in recent years. The number of fatalities for other road user types is relatively low and therefore subject to a high level of year to year variability.
Chart 5: Reported road fatalities per billion miles travelled by road user type in Great Britain, 2014 to 2024 (indexed: 2014 = 100) RAS0201

Table 4: Reported road fatalities per billion miles travelled by road user type in Great Britain, 2024 compared with 2023 and 2014 RAS0201
| Road user | 2024 | % change from 2023 | % change from 2014 |
|---|---|---|---|
| Motorcyclists | 115.2 | 4 | -7 |
| Pedestrians | 26.4 | -3 | -30 |
| Pedal cyclists | 23.3 | -3 | -26 |
| Car occupants | 2.7 | -6 | -16 |
| Bus or coach occupants | 1.5 | -26 | -37 |
| HGV occupants | 1.0 | 24 | 18 |
| LGV occupants | 0.5 | -17 | -24 |
4.2 All casualties and rates by road user type
Chart 6 and Table 5 show overall road casualties figures (including fatal, serious and slight injuries) for different road users over the past decade. This shows that in 2024, there were either decreases or little change in road casualty numbers across the majority of different road users, and that most road casualties were car occupants.
In 2024, 55% of casualties were car occupants, 15% were pedestrians, 12% were motorcyclists and 11% were pedal cyclists.
Chart 6: Reported road casualties by road user type in Great Britain, 2024 compared with 2023 RAS0201
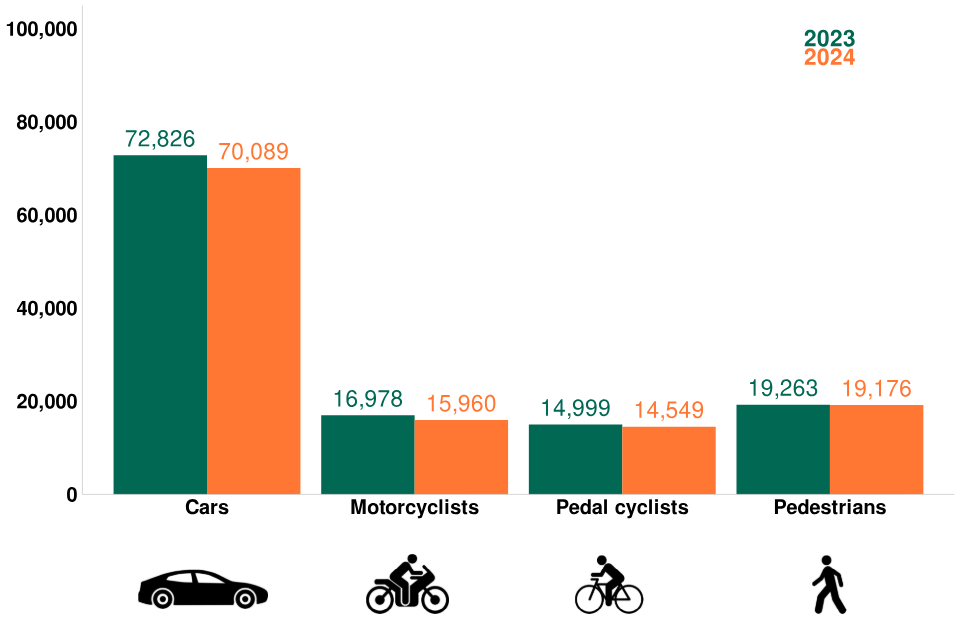
Table 5: Reported road casualties by road user type in Great Britain, 2024 compared with 2023 and 2014 RAS0201
| Road user | 2024 | % change from 2023 | % change from 2014 |
|---|---|---|---|
| Car occupants | 70,089 | -4 | -39 |
| Pedestrians | 19,176 | 0 | -23 |
| Motorcyclists | 15,960 | -6 | -22 |
| Pedal cyclists | 14,549 | -3 | -32 |
| LGV occupants | 3,485 | -9 | -29 |
| Bus or coach occupants | 2,234 | -7 | -57 |
| Other vehicle occupants | 2,181 | 7 | 102 |
| HGV occupants | 598 | -9 | -56 |
‘Other vehicle occupants’ include e-scooters, which account for much of the increase in casualties for this road user category compared to 2014 figures. An annual update on e-scooter casualties for 2024, which are not explicitly covered in this release, is available in our e-scooter factsheet.
Chart 7 and Table 6 show overall reported road casualties in Great Britain per billion miles travelled for different road users over the past decade. Compared to 2014, road casualty rates have generally decreased over the past decade, but some recent increases have been observed for pedal cyclist and pedestrians. However, following a substantial fall in the casualty rates during the COVID-19 pandemic, casualty rates for both pedal cyclist and pedestrians remain below pre-pandemic levels.
Chart 7: Reported road casualties per billion miles travelled by road user type in Great Britain, 2014 to 2024 (indexed: 2014 = 100) RAS0201

Table 6: Reported road casualties per billion miles travelled by road user type in Great Britain, 2024 compared with 2023 and 2014 RAS0201
| Road user | 2024 | % change from 2023 | % change from 2014 |
|---|---|---|---|
| Motorcyclists | 5,408 | -9 | -27 |
| Pedal cyclists | 4,128 | -1 | -30 |
| Pedestrians | 1,239 | -4 | -41 |
| Bus or coach occupants | 1,145 | -8 | -37 |
| Car occupants | 274 | -6 | -42 |
| LGV occupants | 60 | -10 | -45 |
| HGV occupants | 36 | -7 | -57 |
5. Casualties by vehicle type involved
In the previous section, casualty numbers and rates are presented by casualty type, showing that rates are higher for vulnerable road users. This section also looks at the vehicles involved in fatal collisions.
5.1 Vehicles involved in fatal collisions
Chart 8 and Table 7 show the number of fatalities in collisions involving different types of vehicle (note that figures across all vehicle types do not sum to total fatalities, as a collision can involve more than one type of vehicle). This shows that in 2024 most fatalities occurred in collisions involving a car, consistent with previous years.
The relationship between vehicles and casualties in collisions is explored further in our road user risk factsheet.
Chart 8: Reported road fatalities in collisions involving different types of vehicles in Great Britain, 2024 compared to 2023 RAS0601

Table 7: Reported road fatalities in collisions involving different types of vehicles in Great Britain, 2024 compared with 2023 and 2014 RAS0601
| Vehicle | 2024 | % change from 2023 | % change from 2014 |
|---|---|---|---|
| Car | 1,251 | 0 | -10 |
| Motorcycle | 364 | 8 | 3 |
| HGV | 201 | 7 | -25 |
| LGV | 176 | -10 | -1 |
| Pedal cycle | 85 | -8 | -28 |
| Bus or coach | 45 | -24 | -31 |
5.2 Fatalities by road user type and (other) main vehicle involved in the collision
Chart 9 shows a breakdown of fatalities in reported road collisions by road user type (in the rows) and the other main vehicle involved (in the columns) - this is the largest vehicle in the collision, excluding any that the casualty was travelling in or on. This breakdown illustrates, for example, how the majority of pedestrian fatalities are in collisions with cars, and that there are very few deaths in collisions involving pedestrians or cyclists other than the pedestrians or cyclists themselves.
Chart 9: Reported road fatalities in collisions by road user type and (other) main vehicle involved in the collision, Great Britain 2024 RAS0601

6. Casualties by age and sex
Chart 9 and Tables 8 and 9 shows road fatalities and all casualties (including fatal, serious and slight injuries) split by both sex and age group. This shows that generally road fatalities and casualties have decreased for both males and females over the last decade (although male numbers remain consistently higher). The main exception to this pattern has been an increase in the number of fatalities for males in the 50 to 69 and the 70 and over age groups.
Overall, in 2024:
- 76% of fatalities and 61% of casualties of all severities were male
- 4% of fatalities and 11% of casualties were aged 16 years old and under
- 22% of fatalities and 28% of casualties were aged 17 to 29 years old
- 22% of fatalities and 8% of casualties were aged 70 years old and over
Chart 9: Reported road fatalities and all casualties by age group and sex in Great Britain, 2014 to 2024 RAS0202

6.1 Fatalities by age and sex
Overall across all ages, male road fatality numbers show little change in 2024 to those observed in 2023, however there is variation in this by age with a decrease in the number of fatalities aged under 49 and an increase in the number aged 50 and over. Female road fatality numbers have decreased for all age groups except 30 to 49 (Table 8). Compared to 2014, the majority of age groups show a decrease in road fatalities, but some increases can be seen for males aged 50 to 69 and aged 70 and over, likely reflecting a growing elderly population over the past decade as well as more travel being conducted by people in these age groups. Additionally male fatalities aged 0 to 16 have increased compared to 2014.
Table 8: Reported road fatalities by age group and sex in Great Britain, 2024 compared with 2023 and 2014 RAS0202
| Sex | Age group (years) | 2024 | % change from 2023 | % change from 2014 |
|---|---|---|---|---|
| Male | 0 to 16 | 42 | -19 | 20 |
| Male | 17 to 29 | 294 | -4 | -27 |
| Male | 30 to 49 | 336 | -6 | -11 |
| Male | 50 to 69 | 329 | 19 | 11 |
| Male | 70 and over | 219 | 1 | 12 |
| Male | All ages | 1,220 | 1 | -7 |
| Female | 0 to 16 | 22 | -4 | -31 |
| Female | 17 to 29 | 65 | -11 | -36 |
| Female | 30 to 49 | 78 | 16 | -9 |
| Female | 50 to 69 | 90 | -13 | -5 |
| Female | 70 and over | 127 | -14 | -16 |
| Female | All ages | 382 | -8 | -18 |
6.2 All casualties by age and sex
Overall, both male and female casualty numbers in all age groups have decreased substantially in 2024 compared to 2014. When considering trends across all ages, this percentage change reduction is slightly greater for females compared to males with the greatest reduction observed in females aged 17 to 29 (Table 9). Comparing to 2023 most age groups show small decreases change in both male and female casualty numbers.
Table 9: Reported road casualties by age group and sex in Great Britain, 2024 compared with 2023 and 2014 RAS0202
| Sex | Age group (years) | 2024 | % change from 2023 | % change from 2014 |
|---|---|---|---|---|
| Male | 0 to 16 | 7,904 | 1 | -29 |
| Male | 17 to 29 | 22,938 | -5 | -40 |
| Male | 30 to 49 | 25,065 | -6 | -35 |
| Male | 50 to 69 | 15,267 | -1 | -23 |
| Male | 70 and over | 5,138 | 2 | -14 |
| Male | All ages | 77,456 | -4 | -33 |
| Female | 0 to 16 | 5,208 | -2 | -36 |
| Female | 17 to 29 | 12,333 | -5 | -49 |
| Female | 30 to 49 | 15,805 | -3 | -36 |
| Female | 50 to 69 | 10,317 | -3 | -30 |
| Female | 70 and over | 4,861 | 2 | -22 |
| Female | All ages | 49,356 | -3 | -38 |
7. Casualties by road type
In this report, roads in urban areas are defined as those within an area of population of 10,000 or more in England and Wales or more than 3,000 in Scotland - roads outside of these areas are classified as roads in rural areas (Department for Transport types of road definitions).
Chart 10 and Table 10 show road fatalities and all road casualties (including fatal, serious and slight injuries) for motorways, roads in rural areas and roads in urban areas.
In 2024, the majority of road fatalities occurred on roads in rural areas, whereas the majority of all casualties occurred on roads in urban areas. Although motorways account for 21% of road traffic, they account for a much smaller proportion of road fatalities (6%) and casualties (4%). By contrast, fatalities on roads in rural areas (60%) are over represented compared to the proportion of traffic on roads in rural areas (45%). Similarly, roads in urban areas account for a much higher proportion of road casualties (62%) than their relative traffic level (35%). This indicates that although more casualties occur on roads in urban areas, collisions that happen in rural areas are more likely to have a casualty that is killed.
Chart 10: Reported road casualties by severity and traffic proportion for different road types in Great Britain, 2024 RAS0302
| Severity | Motorways | Roads in rural areas | Roads in urban areas | Total |
|---|---|---|---|---|
| Killed | 6% | 60% | 35% | 100% |
| All casualties | 4% | 34% | 62% | 100% |
| Traffic (billion vehicle miles) | 21% | 45% | 35% | 100% |
Table 10: Reported road casualties by severity and road type in Great Britain, 2024 compared with 2023 and 2014 RAS0302
| Severity | Road type | 2024 | % change from 2023 | % change from 2014 |
|---|---|---|---|---|
| Killed | Motorways | 91 | 8 | -5 |
| Killed | Roads in rural areas | 956 | -1 | -10 |
| Killed | Roads in urban areas | 555 | -3 | -10 |
| All casualties | Motorways | 5,055 | -4 | -45 |
| All casualties | Roads in rural areas | 43,479 | -2 | -34 |
| All casualties | Roads in urban areas | 79,734 | -4 | -33 |
| Traffic (billion vehicle miles) | Motorways | 70 | 0 | 8 |
| Traffic (billion vehicle miles) | Roads in rural areas | 151 | 2 | 10 |
| Traffic (billion vehicle miles) | Roads in urban areas | 118 | 2 | 2 |
7.1 Fatal rates by road type
Chart 11 and Table 11 show overall reported road fatalities in Great Britain per billion miles travelled for different road types over the past decade. Since 2014, road fatality rates for roads in rural areas have generally decreased (with some fluctuations over the years). Motorway fatality rates are very small overall, but have shown a varied trend over the past decade. Fatality rates on roads in urban areas have stayed fairly steady over the last decade but declined in the recent years.
Chart 11: Reported road fatalities per billion miles travelled by road type in Great Britain, 2014 to 2024 (indexed: 2014 = 100) RAS0302

Table 11: Reported road fatalities per billion miles travelled by road type in Great Britain, 2024 compared with 2023 and 2014 RAS0302
| Road type | 2024 | % change from 2023 | % change from 2014 |
|---|---|---|---|
| Motorways | 1.3 | 8 | -13 |
| Roads in rural areas | 6.3 | -3 | -19 |
| Roads in urban areas | 4.7 | -4 | -11 |
7.2 Casualty rates by road type
Chart 12 and Table 12 show overall reported road casualties in Great Britain per billion miles travelled for different road types over the past decade. Compared to 2014, road casualty rates have generally decreased for all road types, with the largest change seen in motorway casualty rates.
Chart 12: Reported road casualties per billion miles travelled by road type in Great Britain, 2014 to 2024 (indexed: 2014 = 100) RAS0302

Table 12: Reported road casualties per billion miles travelled by road type in Great Britain, 2024 compared with 2023 and 2014 RAS0302
| Road type | 2024 | % change from 2023 | % change from 2014 |
|---|---|---|---|
| Motorways | 72 | -5 | -49 |
| Roads in rural areas | 287 | -4 | -40 |
| Roads in urban areas | 675 | -6 | -34 |
8. International comparisions
Comparisons between countries are only possible for fatalities per million population, as casualties and traffic data are collected less consistently across different countries. Table RAS0404 compares figures for Great Britain, Northern Ireland, and the United Kingdom as a whole with others in Europe and, where data is available, the rest of the world.
Chart 13 shows an international comparison of road fatalities per million population. Figures for Great Britain have been among the lowest in the world for many years. In 2024, Great Britain ranked 4 out of 36 countries with available data for lowest number of road fatalities per million population. Northern Ireland ranked 13 out of 36 in 2024.
Further information about comparisons in road safety progress between countries is available in the European Transport Safety Council’s Performance Index (PIN) for European countries. Once data is available worldwide for 2024 it will be published by the International Traffic Safety Data and Analysis Group (IRTAD).
Chart 13: Road fatalities per million population by country, 2024 RAS0404
| Country | Road fatalities per million population |
|---|---|
| Norway | 16 |
| Sweden | 20 |
| Malta | 21 |
| Great Britain | 24 |
| Denmark | 24 |
| Japan | 26 |
| Luxembourg | 27 |
| Switzerland | 28 |
| Finland | 31 |
| Slovenia | 32 |
| Irish Republic | 32 |
| Germany | 33 |
| Northern Ireland | 36 |
| Spain | 36 |
| Netherlands | 38 |
| Austria | 38 |
| Belgium | 40 |
| Lithuania | 42 |
| Cyprus | 42 |
| Israel | 44 |
| Czech Republic | 45 |
| Australia | 48 |
| France | 48 |
| Slovakia | 48 |
| Estonia | 50 |
| Italy | 51 |
| Poland | 52 |
| Hungary | 52 |
| New Zealand | 55 |
| Portugal | 60 |
| Latvia | 60 |
| Croatia | 62 |
| Greece | 64 |
| Bulgaria | 74 |
| Romania | 77 |
| Serbia | 78 |
9. Factors contributing to fatalities
Road collisions occur for a wide range of reasons, including those related to road user behaviour and the roads and vehicles involved. A single collision can be the result of several different factors, so reliably attributing the cause of collisions is difficult. An analysis giving further details was included in the 2019 annual report. However, statistics are available covering several key areas, including the following.
9.1 Road safety factors (RAS0701 to RAS0703)
STATS19 data provides some insight into why and how road collisions occur. When police officers attend the scene of a collision, they can select up to 6 factors they believe contributed to the collision (for vehicles and casualties involved). This does not assign blame for the collision to any specific road user, but gives an indication of which factors the attending officer thought contributed to the collision. More information is available in the DfT guide to contributory factors for reported road casualties.
The most recent STATS19 review recommended that contributory factors (CFs) be replaced with a new system of road safety factors (RSFs). These were designed to focus on recording factors related to areas where action can be taken to improve road safety, and to reduce the list of potential factors, with a new set of codes. It is possible to convert data recorded as CFs to RSFs using a mapping table as detailed in the road safety factors initial analysis report, however it is not possible to convert data recorded as RSFs to CFs.
In 2024 RSFs were natively recorded for approximately 25% of collisions. For the remaining collisions the data were collected using the contributory factor system and converted to RSFs either in police systems or by DfT. Analysis of the collisions directly recorded as RSFs has shown that there is a step change in which factors are being recorded compared to the data that have been converted from CFs. Analysis of these changes can be found in the road safety factors data collection report.
In order to avoid presenting misleading data the following results are based only collisions that were recorded using the contributory factor system and subsequently converted to RSFs. This represents the majority of collisions and is consistent with what has been published in previous years, to allow for analysis of trends in collision factors over time. However it does mean that data for some police forces will not be included in this section. In future years, as more police forces move to collecting data directly as RSFs what is published on RSFs will be reviewed.
Chart 14 shows the proportion of fatal collisions with at least one factor recorded that fall into each RSF section. A collision can be assigned multiple factors and therefore the numbers in Chart 14 may sum to more than 100%. The 3 sections with the largest number of collisions were:
- Speed
- Behaviour or inexperience
- Distraction or impairment
Chart 14: Proportion of fatal collisions with RSFs assigned, by RSF section in Great Britain, 2024 RAS0701
| Road Safety Factor section | 2024 (%) |
|---|---|
| Speed | 59 |
| Behaviour or inexperience | 52 |
| Distraction or impairment | 34 |
| Road | 13 |
| Non-motorised road users | 9 |
| Not coded | 4 |
| Vehicles | 3 |
9.2 Deprivation
The main measurement of deprivation for England is the Index of Multiple Deprivation (IMD), which is a measure of relative deprivation of lower layer super output areas (LSOAs). LSOAs are small areas roughly equivalent to postcode areas, each with a similar population size. IMD ranks the LSOAs in England from most deprived to least deprived, based on 7 different domains of deprivation (income deprivation, employment deprivation, education, skills and training deprivation, health deprivation and disability, crime, barriers to housing and services and living environment deprivation). More information about how IMD is calculated is available in the latest IMD statistics.
Road collision location and casualty home postcode are recorded by police forces for STATS19 road casualty data. This means that the IMD rank of the collision location and casualty home postcode can be added to the data and used for analysis.
Chart 15 shows the percent of road casualties by IMD decile of casualty home postcode for 2024. Generally, there are a higher proportion of road casualties in the more deprived areas. In 2024, the difference in casualties between the most deprived 10% and least deprived 10% IMD decide was 4.9 percentage points.
The relationship between reported road casualties and deprivation in England is explored further in our deprivation factsheet.
Chart 15: Percentage of total road casualties by IMD decile of casualty home postcode, 2024 (England only)
| IMD decile of casualty home postcode | 2024 road casualties (%) |
|---|---|
| Most deprived 10% | 11.8 |
| More deprived 10% to 20% | 12.2 |
| More deprived 20% to 30% | 11.7 |
| More deprived 30% to 40% | 11.3 |
| More deprived 40% to 50% | 10.6 |
| Less deprived 40% to 50% | 10.1 |
| Less deprived 30% to 40% | 9.2 |
| Less deprived 20% to 30% | 8.6 |
| Less deprived 10% to 20% | 7.8 |
| Least deprived 10% | 6.8 |
9.3 Seatbelt non-wearing (RAS0711)
STATS19 records details of whether vehicle occupant casualties were wearing seatbelts, though this information is only mandatory for fatalities. Seatbelt use is recorded by the reporting police officer based on the information available within a short time of the collision occurring, rather than a detailed investigation.
Chart 16 shows the proportion of car occupant fatalities not wearing a seatbelt in 2024 for different occupant types. In 2024 around a quarter of all car occupants were not wearing seatbelts, but this proportion was higher for male car occupant fatalities and occupants travelling in the evening and night (8pm to 6am).
Chart 16: Proportion of car occupant fatalities not wearing a seatbelt in Great Britain, 2024 RAS0711
| Car occupant type | Fatalities not wearing a seatbelt (%) |
|---|---|
| All occupants | 25 |
| Female occupants | 18 |
| Male occupants | 28 |
| Occupants travelling in the daytime (6am to 8pm) | 17 |
| Occupants travelling in the evening and night (8pm to 6am) | 39 |
9.4 Drink and drug driving (RAS20)
Statistics on drink-driving, based on data from STATS19 as well as coroner reports are published separately. The latest statistics available cover 2023, published in our report on road casualties in Great Britain, involving illegal alcohol levels . The department is also developing statistics on drug-driving. Currently an initial feasibility study has been produced, and it is hoped to develop this further.
9.5 Collisions involving driving for work
It is estimated that around 1 in 3 fatal collisions involve at least one driver who is driving for work, based on the journey purpose recorded within STATS19 or assumptions based on vehicle type. Further details are available in our new analysis of work-related collisions which has been published alongside this release.
10. Other topics
Alongside this publication, data tables are available providing statistics on other topics including.
Road type breakdowns (RAS03): Including urban and rural roads, and casualties on the strategic road network (SRN). More detailed statistics for SRN roads, including smart motorways, are published by National Highways for example in the smart motorway evidence stocktake reports.
Area comparisons (RAS04): Including police force, country, region and local authority breakdowns.
Vehicles and drivers involved (RAS05): Covering vehicles involved in collisions by type, manoeuvre and driver characteristics.
Value of prevention of collisions (RAS40): Covering estimates of preventing report and unreported collisions, derived from STATS19 collision and casualty numbers together with information on average costs from the Transport Analysis Guidance (TAG) data book.
Besides the published tables, users can explore road casualty data in further detail or for specific areas via our interactive dashboard, data download tool and open dataset.
11. Background quality information
Detailed guidance on road casualty statistics is given on our guidance page. A full list of the definitions used in this publication can be found in our notes and definitions documentation.
11.1 Quality and methodology
Quality
Road casualty statistics have been assessed as Accredited Official Statistics, indicating compliance with the Code of Practice for Statistics. Full details of the quality of these statistics are available in the background quality report.
There are several important areas which users of the statistics should be aware of which are listed below.
Final estimates
Figures in this release are considered as final estimates and will not usually be revised in future. They are based on complete data from all 42 police authorities in Great Britain (as at 1 September 2025) with no imputation required.
These figures update the provisional estimates published in May following further validation. This validation also impacts parameters used in the adjustment model for severity and therefore estimates for serious injuries, and to a lesser extent, slight injuries, have also changed marginally.
Note, also, that unexpected issues with data collection for some police forces in previous years mean the reliability and accuracy of the recorded road collisions in some regions cannot be guaranteed as some collisions may have been misrecorded or not recorded at all. This is unlikely to noticeably impact on the overall Great Britain road collision trends, but caution should be applied when considering geographical breakdowns by police force area (RAS0401) and local authority (RAS0403).
Under-reporting
Comparisons of road collision reports with death registrations show that very few, if any, road collision fatalities are not reported to the police. However, a considerable proportion of non-fatal casualties are not known to the police, as hospital, survey and compensation claims data all indicate a higher number of casualties than those recorded in police collision data. More information on the coherence of the police reported data with alternative sources can be found in our comparison to other sources of information on road casualties.
Changes in reporting systems used by police forces
From 2016 onwards, figures on the severity of injury have been affected by a large number of police forces changing their reporting systems. It is likely that the recording of injury severity is more accurate for forces using these new reporting systems.
The Office for National Statistics (ONS) Methodology Advisory Service have completed analysis to quantify the effect of the introduction of new injury based reporting systems on the number of slight and serious injuries reported to the police, and to estimate the level of slight and serious injuries as if all police forces were using injury-based reporting systems.
For more information, please see our guide to severity adjustments.
Online self-reporting
Online self-reporting is part of a wider project for digital public contact known as Single Online Home. It is funded by the Home Office to allow people involved in road traffic collisions to report the collision to the police online should they choose to do so, rather than having to physically report it at a police station.
The principle of online reporting is to make it easier for members of the public to report collisions. It is expected that the introduction of online reporting will affect the number of non-fatal (and particularly slight) casualties reported, and therefore impact the total for Great Britain, as the public will have more reporting options available to them. This is particularly likely to impact numbers for slight injuries, which may not have been reported otherwise.
See our analysis of the impact of online self reporting for more details.
11.2 User engagement, developments and STATS19 review
Details of users and uses of road casualty statistics and response to recent user feedback is available from our user engagement page.
The STATS19 system which provides the majority of statistics for this publication is periodically reviewed to keep up with changes in technology, to make improvements to completeness and accuracy, and to reduce the reporting burden. Key recommendations of the latest review, carried out in 2018, can be found in the full STATS19 review report.
11.3 About these statistics
These official statistics were independently reviewed by the Office for Statistics Regulation in July 2009. They comply with the standards of trustworthiness, quality and value in the Code of Practice for Statistics and should be labelled ‘accredited official statistics’.
They undergo regular quality assurance reviews to ensure they meet customer needs. More information can be found on our national statistics status webpage.
Details of Ministers and officials who receive pre-release access to these statistics up to 24 hours before release can be found in our pre-release access list.
12. Instructions for printing and saving
Depending on which browser you use and the type of device you use (such as a mobile or laptop) these instructions may vary.
You will find your print and save options in your browser’s menu. You may also have other options available on your device. Tablets and mobile device instructions will be specific to the make and model of the device.
13. How to search
Select Ctrl and F on a Windows laptop or Command and F on a Mac.
This will open a search box in the top right-hand corner of the page. Type the word you are looking for in the search bar and press enter.
Your browser will highlight the word, usually in yellow, wherever it appears on the page. Press enter to move to the next place it appears.
14. Contact details
Road safety statistics
Email roadacc.stats@dft.gov.uk
To hear more about DfT statistical publications as they are released, follow us on X at DfTstats.
-
Accredited official statistics are called National Statistics in the Statistics and Registration Service Act 2007. Accredited Official Statistics Policy – Office for Statistics Regulation ↩