Personal Income Statistics 2020 to 2021: Supporting Documentation
Updated 29 February 2024

© Crown copyright 2024
This publication is licensed under the terms of the Open Government Licence v3.0 except where otherwise stated. To view this licence, visit nationalarchives.gov.uk/doc/open-government-licence/version/3 or write to the Information Policy Team, The National Archives, Kew, London TW9 4DU, or email: psi@nationalarchives.gov.uk.
Where we have identified any third party copyright information you will need to obtain permission from the copyright holders concerned.
This publication is available at https://www.gov.uk/government/statistics/personal-incomes-statistics-for-the-tax-year-2020-to-2021/personal-income-statistics-2020-to-2021-supporting-documentation
1. Background information
This is a National Statistics publication produced by HM Revenue and Customs (HMRC). For more information on National Statistics and governance of statistics produced by public bodies please see the UK Statistics Authority website.
The tables in this publication provide detailed breakdowns of individuals liable to UK Income Tax (taxpayers) and their incomes using sample based estimates.
2. What is the Survey of Personal Incomes?
The Survey of Personal Incomes (SPI) is based on information held by HMRC on individuals who could be liable to UK Income Tax. It is carried out annually by HMRC and covers income assessable to tax for each tax year.
3. Uses of the SPI
The SPI is compiled to provide a quantified evidence base from which to cost proposed changes to tax rates, personal allowances and other tax reliefs for Treasury Ministers. It is used to inform policy decisions within HMRC, the Treasury and the Devolved Administrations, as well as for tax modelling and forecasting purposes. In addition, it is used to provide summary information for the National Accounts that are prepared by the Office for National Statistics. Finally, it is used to provide information to Members of Parliament, other Government Departments, companies, organisations and individuals.
4. Sample Design
HMRC holds information about individuals who could be liable to UK Income Tax in two operational computer systems.
-
The National Insurance and PAYE Service (NPS) system covers all employees and occupational pension recipients with a Pay As You Earn (PAYE) record.
-
The Computerised Environment for Self Assessment (CESA) system covers people with self-employment, rental or untaxed investment income. It also covers those with higher incomes and other people with complex tax affairs. Where people have both NPS and CESA records, their CESA record is selected because it provides a more complete picture of their taxable income.
Separate samples are drawn from these systems and then joined together to create the SPI.
For more information about how the SPI is constructed, its coverage and methodological changes from previous SPIs, please see the data sources and methodology section below.
5. What does this publication tell me?
The tables in this publication provide detailed statistics about individuals liable to UK Income Tax (Income Tax payers) and their incomes using sample-based estimates. They provide detailed information based on sex, age, income source, income by source and tax distribution.
The tables in this release exclude individuals who are not Income Tax payers, which may occur if the individual has no Income Tax liability due to their deductions, reliefs and Personal Allowances exceeding their total income, if their income is below their Personal Allowance, or if they do not currently have any income.
Tables are based on a sample of administrative data for the relevant tax year. Income Tax liabilities are modelled using the HM Revenue and Customs Personal Tax Model. Methods used to calculate Income Tax liabilities are described in the supporting documentation accompanying the Income Tax Liabilities Statistics.
6. Who might be interested?
These tables would be of interest to policy makers in government, academics, journalists, think tanks, and other research bodies. They would be of use to individuals or organisations interested in the distributions of numbers and amounts of personal incomes, for example by taxpayer marginal rate or income band. Users may also like to view the tables on Income Tax Liabilities.
7. User engagement
We are committed to providing impartial quality statistics that meet our users’ needs. We encourage our users to engage with us so we can improve our Official Statistics and identify gaps in the statistics that we produce.
Comments or queries on these statistics can be sent to the statistical contacts named at the end of this section, or through the feedback form link below. We will review user comments and use this information to influence the development of our Official Statistics. Contact us
8. Publication and revision strategy
The SPI statistics are published annually, usually in February/March. The exact date of publication will be announced no less than four weeks before publication. This date and any subsequent changes to this date will be announced on the HMRC’s statistics announcement webpage.
9. Statistical contacts
Enquiries about these statistics should be directed to the statisticians who are responsible for this publication:
Statistical contact: N Anderson, spi.enquiries@hmrc.gov.uk
Any media enquiries should be directed to the HMRC Press Office contacts below:
Media contact: HMRC Press Office, news.desk@hmrc.gov.uk
10. Data Sources and Methodology
The data sources and methods used to compile the statistics in this release are set out below:
The SPI is based on information held by HMRC on persons who could be liable to UK Income Tax for the Income Tax year. It is carried out annually and covers the income assessable for tax in each tax year. The tables in this publication are based on the surveys for tax year 2020 to 2021 and earlier.
Samples were selected from two HMRC operational computer systems, which are as follows:
-
The National Insurance and PAYE Service (NPS) system covers all employees and occupational pension recipients with a Pay As You Earn (PAYE) record
-
The Computerised Environment for Self Assessment (CESA) system covers people with self-employment, rental or untaxed investment income. It also covers directors, those subject to higher rate tax and other people with complex tax affairs. Where people have both NPS and CESA records, their CESA record is selected because it provides a more complete picture of their taxable income
Separate samples were drawn from each of these systems and different sampling strategies were used for each. The samples were structured as follows:
-
the PAYE population from NPS was stratified by sex and by the sum of pay plus occupational pension income for the previous tax year. Where the previous year’s income was not available, cases were stratified by sex and by whether they were a higher rate or additional rate taxpayer for the current tax year based on information available at the time the sample was drawn. The sampling fractions varied from 1 in 9 for individuals with high incomes and rare allowances to about 1 in 140 for people with low combined pay and pensions. In all, about 400,000 individuals were selected from NPS for inclusion in the SPI for tax year 2020 to 2021.
-
for the Self Assessment population from CESA, the main source of income (self-employment or employment/ occupational pension) and ranges of income and tax were used to stratify the sample, with the sampling fraction varying from 1 in 1 for cases with very high income or income tax liabilities and up to around 1 in 70 for employees and occupational pensioners with smaller income or tax. In all, about 450,000 individuals were selected from SA for inclusion in the SPI for tax year 2020 to 2021.
Once data was collected for the two constituent parts of the sample, the data sets were joined together. After allowing for non-response and for records that failed data validation tests, there were around 850,000 valid cases in the final SPI dataset for tax year 2020 to 2021.
Coverage of the SPI
Not all of the individuals in the SPI sample are taxpayers. About 26 per cent of sample cases (35 per cent grossed) have no Income Tax liability because deductions and reliefs and personal allowances exceed their total income. The National Statistics in this publication - with the exception of tables 3.9 and 3.10 (see section 13 for additional information) only cover individuals liable to UK Income Tax (taxpayers) and their incomes.
An individual with income below the personal allowance can still be a taxpayer in some circumstances. This can arise where individuals who have income liable to UK tax do not qualify for a personal allowance under the residence and/ or domicile rules. Some people who do qualify for the personal allowance choose to give up their personal allowance as part of the qualifying conditions for having their income taxed under the “remittance basis”. These taxpayers may only have a small amount of income liable to UK tax (i.e. below where the personal allowance is set), but this income is still liable to tax and is charged at the starting, and/ or basic rates.
Most sources of income are liable for Income Tax and adding all these sources together will give an individual’s total income assessable for tax for the tax year. There are some sources of income that are not liable for tax. As they do not contribute towards an individual’s taxable income; they are excluded from the SPI. These sources include some social security benefits and income from some tax efficient savings vehicles (e.g. Individual Savings Accounts and some National Savings & Investment products).
Capital Gains arising from the disposal of assets are subject to Capital Gains Tax (CGT) and are not treated as income for Income Tax purposes, so gains from the disposal of assets are not included in the SPI.
Imputations
The coverage of investment income for the sample drawn from NPS is incomplete. This means that some values need to be imputed to the required levels.
Those income streams are set out in more detail below. For more information on the imputations process please refer to the supporting documentation accompanying the latest Income Tax Liabilities Statistics
1. Dividends
In order to create a full picture of total income for this survey, it is necessary to attribute (or impute) values of dividends to some sample cases. For the dividends imputation, the amount for each SPI case:
-
is known for cases in Self Assessment from the amount declared on the Self Assessment Return
-
can be inferred or estimated reasonably for NPS cases where there is an adjustment to the tax code for taxpayers
-
is unknown for NPS cases where there is no coding adjustment
Where no information at case level is available from HMRC administrative systems, estimated values are imputed to cases so that the population as a whole has amounts consistent with evidence from other sources.
Starting from control totals at UK level for the number of cases and total amount of dividends, the Self Assessment and NPS cases with coding adjustments are deducted to leave targets for the remainder of the taxpayer population. These targets are at UK level – no attempt is made to control the targets to sub-UK geographical units. For dividend income, the number of non SA cases with dividend income and distribution of imputed amounts were inferred from Family Resources Survey data for tax year ending 2021. The cases to which amounts are attached by the imputation process and the amounts attached are determined by probabilistic methods with just the UK targets and distributions in mind.
2. Pension Contributions
HMRC does not have complete information about pension contributions. Pension contributions can be made under two types of arrangement:
-
net pay schemes
- relief at source schemes
- salary sacrifice schemes
HMRC holds information on the value of employee pension contributions paid under “net pay arrangements” in Real Time Information (RTI) submissions by their employer. This data has been used to match SPI cases to “net pay” pension contributions. Pension schemes operating a net pay scheme are occupational pension schemes. However, as some employers operate relief at source or salary sacrifice schemes, contributions to those schemes are not included in the “net pay” figures and thus the ”net pay” figures do not include all “occupational” individual contributions.
HMRC receives information from relief at source (RAS) schemes on individual contributions via the APSS106 and RPSCOM100(Z). These contributions are made post-tax, relevant rate relief (equivalent to the rUK basic rate of income tax) is claimed on all individual contributions by scheme providers from HMRC. Individuals with higher marginal tax rates than the relevant rate can claim the additional relief from HMRC via self-assessment.
The APSS106 and RPSCOM100(Z) have been used to match PAYE cases in the SPI to “RAS” pension contributions – net of any relief claimed. For SA cases, this has been taken from the information submitted via Self Assessment returns, which is gross of basic rate tax. Additionally, the SPI includes contributions made to retirement annuity contracts and contributions made to employer’s schemes not deducted at source.
Employers, individuals and schemes providers are not required to report individual contributions made using salary sacrifice to HMRC. These contributions are deducted from an individual’s gross earnings and added to the contributions made by their employer. Individual contributions made using salary sacrifice arrangements are not included in this publication.
The estimated value for “RAS” and for “net pay” contributions has been combined with other pension reliefs and included in these statistics. For more info on these pensions data sources please refer to the latest methodology document for the Private pension statistics release.
Note: the methodology for estimating contributions to relief at source pensions was revised in the 2021 to 2022 tax year so it better aligns with the methodology used in HMRC’s Private Pension statistics. For the tax year 2020 to 2021 only, relief at source pension contributions matched to PAYE cases in the SPI were net of basic rate tax relief. For tax years prior to 2020 to 2021 and the tax year 2021 to 2022, relief at source pension contributions matched to PAYE cases were gross of basic rate tax relief. It is estimated that including basic rate tax relief would increase total individual relief at source contributions in the 2020 to 2021 SPI by around £1.5 billion to £12.9 billion.
3. Marriage Allowance
HMRC collects data regarding claimants (receivers and transferers) of Marriage Allowance through coding adjustments for those in NPS or via Self Assessment returns. The latest available administrative data is matched to the SPI sample data allowing for the calculation of tax liabilities adjusting for Marriage Allowance.
The SPI sample is not stratified around any subsets of populations including Marriage Allowance claimants, and therefore when grossed up and subset for just Marriage Allowance claimants it does not exactly match the population of claimants separately estimated and published using the collected administrative data. To calibrate to published Marriage allowance claimants, estimated values are imputed to cases so that the population as a whole has amounts consistent with the evidence from these other sources.
Starting from published estimates at UK level for the number of cases, the Self Assessment and NPS cases with coding adjustments are deducted to leave targets for the remainder of the claimant population. These targets are at UK level – no attempt is made to control the targets to sub-UK geographical units. For Marriage Allowance, the number of eligible claimant cases were inferred from Family Resources Survey data for tax year ending 2021. The cases to which claims are received or transferred are attached by the imputation process to align to the published estimates of take up.
11. Estimates and measures of precision
Population and sample design
The SPI aims to cover all individuals with a UK Income Tax liability. The sample drawn from HMRC operational computer systems will include some cases where income is less than allowances, so no tax liability arises. The section above explains how the records in each operational computer system are grouped (stratified) before the sample is selected and the proportion of taxpayers versus non-taxpayers. A random sample of records is drawn from each grouping (or stratum), where the proportion of cases selected varies from stratum to stratum.
Reliability of estimates
As with aall sample surveys, estimates from the SPI have a sampling error attached to them. A statistic (e.g. an estimate of a mean or a total from a random sample) will be subject to sampling variation – its value will vary from one sample to the next if repeated random samples are drawn. The Standard Error of the statistic measures the extent of the variability. It reflects how much spread exists in the observations from the sample and the size of the sample.
In general, the larger the sample size, the smaller the Standard Error. To a lesser extent, the standard error of the statistic will decline as the proportion of the population surveyed increases, but only by taking measurements for the whole population can sampling error for the statistic be removed entirely.
A Confidence Interval for the statistic is constructed from the Standard Error. It gives an estimated range of values which is likely to include the estimated population size statistic. If independent samples are taken repeatedly from the same population and the Confidence Interval is calculated for each sample, then a proportion (known as the Confidence Level) of such intervals will include the unknown population parameter.
A 95% Confidence Interval is one that if compiled repeatedly would encompass the population parameter 19 times in 20. For a given sample size, narrower intervals can be compiled if a greater risk of failing to encompass the true population value is acceptable, whereas if greater certainty of including the true value is required, the interval will be wider.
The Upper and Lower boundaries of the Confidence Interval are called the Confidence Limits. They are a function of the statistic, the Standard Error of the statistic and the degree of confidence required of the interval.
The calculation of sampling errors assumes a simple random sampling method but can be extended to more complex sample designs. The sample for the SPI, as described earlier, is selected using a stratified sample.
12. Precision of estimates: sub UK areas
The population is not stratified by geographical area before the SPI sample is selected. The precision of estimates of taxpayer numbers for low level UK geographical areas depend on measuring the proportion of the UK population which belong to the area. Typically, these proportions are very small and to ensure high precision for any estimated proportion, the sample size across the UK needs to be large.
The table below gives an indication of the level of precision which may be assumed, with 95% confidence, for an estimate of taxpayer numbers from a simple random sample as large as the SPI. It shows that for estimated populations of 2.5 million or more, the estimate will be within 1% of the true population with 95% confidence.
As the estimated population falls, the 95% Confidence Interval increases in size relative to the estimate (far right column). For a typical Parliamentary Constituency with an estimated taxpayer count of 46,000, the true figure may lie between 42,000 and 50,000. The error could be +/- 8% of this estimate. For a large Parliamentary Constituency, the error may be about 4,000 (7% of the estimate), while for a small constituency, the error may be 3,000 (about 9%).
Table 1: Survey of Personal Incomes: Confidence Intervals for estimates of taxpayer numbers
| Geographical area | Estimated value | Confidence Limits (lower) | Confidence Limits (upper) | 95% Confidence Interval (+/-) | As % of estimate | |
|---|---|---|---|---|---|---|
| Lower limit | Upper limit | |||||
| Number(000s) | Number (000s) | Number (000s) | Number (000s) | Number (000s) | ||
| Government Office Region (medium) | 2,500 | 2,475 | 2,525 | 25.0 | 1.00% | |
| County (large) | 500 | 488 | 512 | 11.6 | 2.32% | |
| County (small) | 200 | 193 | 207 | 7.4 | 3.69% | |
| Parliamentary Constituency (large) | 57 | 53 | 61 | 4.0 | 6.93% | |
| Parliamentary Constituency (medium) | 46 | 42 | 50 | 3.6 | 7.72% | |
| Parliamentary Constituency (small) | 34 | 31 | 37 | 3.1 | 8.98% |
Note to table 1: Assumes a taxpayer population of 29 million and a simple random sample of 400,000.
In practice, estimates will reflect the more complex SPI sample design.
Year on year changes in published estimates of taxpayer numbers within small geographical areas (e.g. districts and constituencies) should be viewed with caution. They involve measuring small differences between two very small proportions. The Confidence Interval for the difference could be large relative to the measured difference, so any observed change may be due to sampling fluctuation alone.
Similar precision, or relative precision, to that shown in the table above in estimates for subsets of taxpayers (e.g. pensioners or higher rate taxpayers) in small geographical areas (e.g. districts and constituencies) requires even greater national samples, far in excess of the present sample size of the SPI. Estimates in such detail are not considered sufficiently reliable to be published.
13. Methodological Changes this year
Basis for income tax liability calculations
Different tax regimes apply to Scottish and Welsh taxpayers, compared to taxpayers in the rest of the UK. Please see section 14 for further information. For tax years up to and including 2019 to 2020, the income tax liability for an individual in the SPI was calculated with reference to their residential postcode. For the tax year 2020 to 2021 and future years, this approach has been updated to reflect the tax regime that would be applicable to an individual to provide a more precise basis for tax forecasting and greater consistency with other publications.
In the SPI, an individual’s postcode is drawn at the end of the tax year under study. This is in contrast to the Scottish or Welsh taxpayer indicators which are set with reference to a number of conditions over the course of the tax year. Therefore, there are some individuals who may have a postcode outside of Scotland or Wales, but their income tax liabilities are aligned with the Scottish or Welsh tax regimes respectively, and vice versa. As there are only a small proportion of such cases, the impact is likely to be negligible.
From the tax year 2020 to 2021 the Personal Income statistics are compiled using the resulting tax liabilities on the basis of which tax regime they are liable to tax. Tables 3.16 and 3.17 allow users to compare Income Tax liabilities on earned income for Scottish and Welsh taxpayers by different classifications – where tax is due versus where the taxpayer is a resident at the end of the tax year. The underlying tax liability calculations are the same for both tables.
Allowances for Coronavirus Support Schemes
As part of the government’s economic response to the Coronavirus pandemic, in early 2020, two support schemes were announced – the Self-Employment Income Support Scheme (SEISS) and the Coronavirus Job Retention Scheme (CJRS).
Self-Employment Income Support Scheme (SEISS)
The SEISS was announced by the Chancellor of the Exchequer on 26 March 2020 and the key objective was to support self-employed individuals (including members of partnerships) whose self-employment activities had been adversely affected by COVID-19 restrictions.
In order to ensure that economic activity continued where pandemic restrictions allowed, claimants were able to continue to work, start a new trade, or take up other employment, including voluntary work, provided they intended to continue trading as a self-employed individual and met all other eligibility criteria.
Coronavirus Job Retention Scheme
The scheme was launched in April 2020 and aimed to protect jobs affected by the coronavirus pandemic and prevent widespread unemployment and permanent employer closures. The scheme initially offered employers the opportunity to apply for a grant to fund the wages of their employees who were on furlough, equivalent to 80% of usual wages up to £2,500 per month.
It initially also covered associated employer NICs and mandatory pension costs. This design aimed to ensure that workers could retain their job and the majority of their usual salary, even if their employer could not afford to pay them.
To enable and encourage the return of employees into active work from summer 2020, despite some continuing restrictions, changes were made to allow employees to work for some of their working hours and claim the CJRS grant for hours not worked. In addition, an increasing portion of the cost began to be shared by employers.
Approach for this statistical release
Given that these schemes began in early 2020, the tax year 2020 to 2021 is the first year that SEISS and CJRS data will be submitted to HMRC and feed into the SPI. Such amounts are counted as a component of an individual’s income and taxed at the individual’s marginal rate of tax where applicable.
-
CJRS payments form part of an individual’s employment pay where applicable
-
SEISS grant form part of an individual’s total taxable trade profits where applicable
These amounts are combined with other components of income such as employment pay and pension for the purposes of the Personal Income Statistics. No additional tables are published as part of the Personal Income Statistics to assess the impact of pandemic. For further details of CJRS please refer to the Coronavirus Job Retention Scheme interim evaluation and for SEISS please refer to SEISS interim evaluation.
There are a small proportion of individuals who have informed HMRC that they have incorrectly claimed SEISS grants. These amounts have been excluded from this statistical release.
Changes to Self-Employment Criteria
The criteria for identifying individuals with self-employment income and unknown sources of self-employment income have been refined to ensure greater consistency across the publication.
For the tax year 2019 to 2020:
-
In Table 3.9, sources of income were identified based on Standard Industry Classification (SIC) 2007. If industry information was missing from the tax return, sources were classified as “Unknown Industries”. If industry and profits information was missing from the tax return, sources were not included in this table.
-
In Table 3.10, individuals were identified as having self-employment income if one or more pages covering income from trades or from partnerships had been completed in the tax return. If information about profits was missing from the tax return, individuals were treated as having profits equal to zero and counted in the £0-1 range of self-employment income.
For the tax year 2020 to 2021:
- In both tables 3.9 and 3.10, individuals are identified as having self-employment income if there was evidence of business activity in the tax return. This evidence included more than just profits. If information about profits was missing, both the individuals and the sources are counted in the £0-1 range of self-employment income.
Tables 2 and 3 illustrate the impact of moving from the previous methodology to the current methodology based on returns submitted in the tax year 2019 to 2020. The main effect of changes to our methodology is an increase in the number of sources of self-employment income classified as “Unknown Industries” and a reduction in the number of individuals with self-employment income.
The total value of self-employment profits is unchanged but estimates of the composition of total income for individuals with self-employment income have changed. This is because the reduction in the number of individuals with self-employed income was due to the exclusion of some individuals with nil profits but these individuals still had other income from employment, pensions or other income sources. These individuals and their income are still included in the other appropriate statistics. Figure 1 shows there has been a 1% reduction in the number of self-employed individuals with employment income and a 3% reduction in the amount of employment income they receive.
Table 2: “Unknown Industries” sources of self-employment income assessable to tax, tax year 2019 to 2020
| Previous methodology | Current methodology | Change | |
|---|---|---|---|
| Number of sources (‘000) | 792 | 870 | + 78 |
| Self-employment profits (£m) | 10,700 | 10,700 | 0 |
Table 3: Individuals with self-employment income, tax year 2019 to 2020
| Previous methodology | Current methodology | Change | % Change | |
|---|---|---|---|---|
| Number of individuals (‘000) | 5,330 | 5,300 | -30 | -1% |
| Self-employment profits (£m) | 99,900 | 99,900 | 0 | 0% |
Figure 1: Percentage change in estimates about the composition of total income for individuals with self-employment income, tax year 2019 to 2020
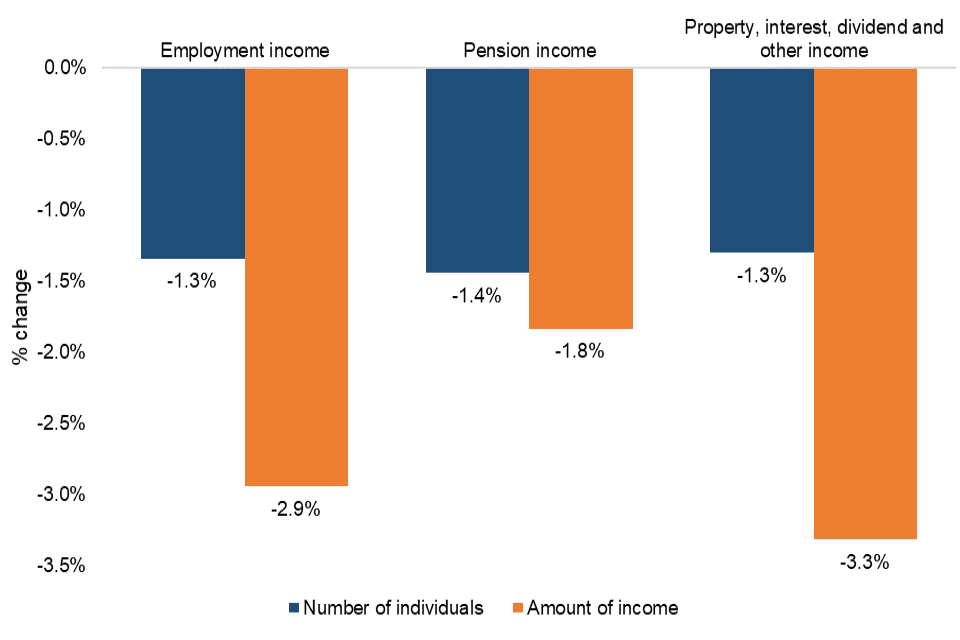
Percentage change in estimates about the composition of total income for individuals with self-employment income, tax year 2019 to 2020
Changes to Multiple Sources of Self-Employment Income
The classification of sources of income to income bands has also been refined in table 3.9 to ensure greater consistency when an individual has multiple sources of self-employment income.
In the tax year 2019 to 2020, an individual who had multiple sources of income from the same industry (e.g. one source generating profits of £200 and another £4,900) was counted as many times as they had sources according to the value of total profits from both sources in that industry (e.g. twice in the income range £5,000-£7,500). The same approach was used to produce the breakdown of sources across All Industries.
In the tax year 2020 to 2021, an individual who has multiple sources of income from the same industry has each source reflected once at the appropriate income level for that source (e.g. once in the income range £1-500, and once in the range £4,000-£5,000). The same approach was used to produce the breakdown of sources across All Industries.
The distribution of the number of self-employment sources and value of profits by income range has shifted to the left because of this change. The total number of self-employment sources and value of profits for the whole population is unchanged.
Figure 2 shows the cumulative impact of changes to self-employment criteria and the classification of sources of income to income bands on the distribution of self-employment sources from all industries, and value of profits by income range. The increase in the total number of self-employment sources in the population for all income ranges is due to changes made to the self-employment criteria, as shown in table 2.
Figure 2: Percentage change in estimates about self-employment income assessable to tax by income range, tax year 2019 to 2020
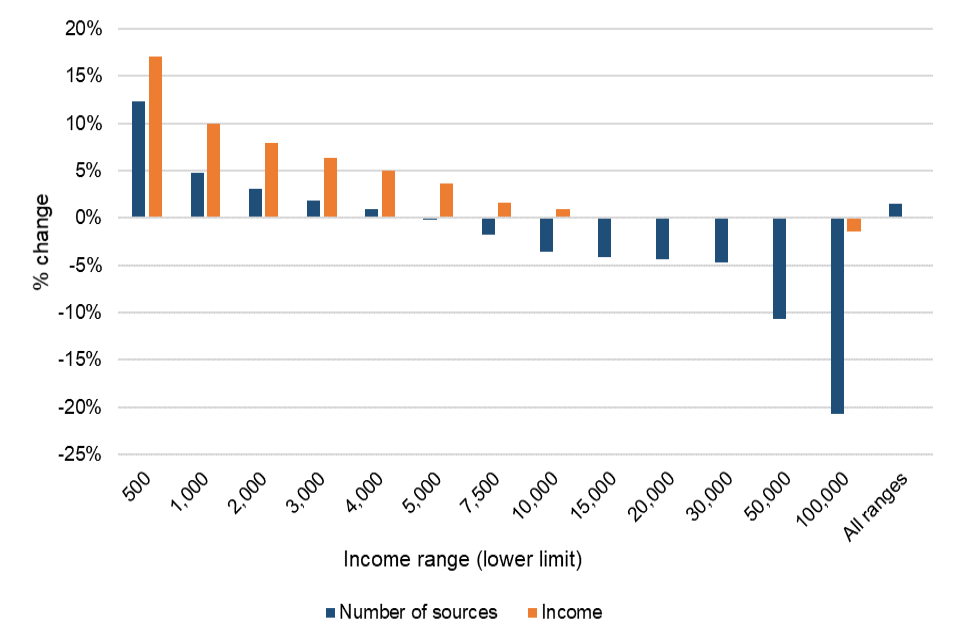
Percentage change in estimates about self-employment income assessable to tax by income range, tax year 2019 to 2020
Changes to the Self Assessment Data
Loan charges
Historically, loan charges (or disguised remuneration income) declared via Self-Assessment was excluded from total income for tax years to 2019 to 2020. This is because these returns related to income from previous years and not income received in the tax year under study. The value of loan charges has been decreasing each year. For the tax year 2020 to 2021, this amount has not been excluded as income in the Personal Income statistics, however this amount is expected to be negligible.
Restricting finance cost relief for individual landlords
Landlords are no longer able to deduct any of their finance costs from their property income to arrive at their property profits. Instead, they receive a basic rate (20%) reduction from their Income Tax liability for their finance costs.
In tax year 2020 to 2021 deductions for finance costs reduced to nil, therefore the property income that was subject to tax in these tables is higher than in previous years. The remaining 100% of finance costs are given tax relief at basic rate which is accounted for in the total tax liability.
Further information on the policy changes can be found here:
Changes to tax relief for residential landlords
Changes to tax relief for residential landlords: how it is worked out
Revision in relation to non-resident taxpayers
In 2021, inconsistencies in the regional classification of a small number of SA taxpayers were discovered in HMRC’s NPS and SA systems.
These taxpayers had Welsh/Scottish residency flags in HMRC’s NPS records and would thus be identified as Welsh/Scottish taxpayers. However, it is not possible to be Welsh or Scottish taxpayer while being non-resident in these respective locations.
Data submitted via self-assessment returns indicated that some individuals were resident (for tax purpose) outside Scotland and Wales, which contradicted the flag in the NPS records. Therefore, the Income Tax revenue generated from these non-resident taxpayers should have been allocated to the rest of UK. As such, the process for classifying individuals has been updated accordingly for this statistical release.
For further information, please refer to Section 14 below and the Section 7.8 in the Scottish Income Tax Outturn.
14. Devolved Income Tax Tables
Tables 3.16 and 3.17 reflect the devolution of Income Tax to Scotland and Wales. They show estimates constructed from the SPI of the amount of tax that is due from non-savings/ non-dividend (NSND) income, that is, “earned income”.
Background to devolved Income Tax
Scottish Rates of Income Tax (SRIT)
The Scotland Act 2012 gave the Scottish Parliament the power to set a Scottish rate of Income Tax. The Scottish Rate of Income Tax (SRIT) regime applies to non-savings non-dividend (NSND) income. It allows the Scottish Government to change the amount of Income Tax that Scottish taxpayers pay and, as a result, the amount that the Scottish Government had to spend in Scotland.
Furthermore, the Scotland Act 2016 enhanced the Scottish Parliament’s tax powers, devolving all NSND income and allowing the Scottish Parliament to set and change its own tax rate bands and limits (but not the Personal Allowance) and introduce new ones. These enhanced powers were introduced from 6 April 2017.
In 2018 to 2019, SRIT was changed to introduce two new tax bands, the starter rate (19%) and the intermediate rate (21%) either side of the basic rate (20%). The higher and additional rates of tax were also increased by 1% for Scottish taxpayers increasing from 40% and 45% to 41% and 46% respectively. Whilst the rates of income tax have remained unchanged between the tax years 2019 to 2020 and 2020 to 2021, the incomes to which they apply have changed for the Starter, Basic and Intermediate rates in Scotland. For further details of the income tax rates that apply to historic years, please refer to Income Tax rates and allowances for current and past years.
HMRC publishes statistics in the Scottish Income Tax Outturn
Wales Rate of Income Tax (WRIT)
From April 2019, the UK government reduced each of the three main rates of income tax – basic, higher and additional rate – paid by Welsh taxpayers by 10 percentage points (ppts). The Wales Act 2014 enables the Welsh Government to control the three Welsh Rates of Income Tax (WRIT) which are added to the reduced UK Government rates. These are all set at 10 ppts for the 2020 to 2021 tax year. The combination of reduced UK rates plus the Welsh rates determines the overall rate of income tax paid by Welsh taxpayers, so the overall rates paid by Welsh taxpayers remained the same as elsewhere in the UK in the 2020 to 2021 tax year. HMRC publishes statistics in the Welsh Income Tax Outturn
Comparing figures with the SPI
The Income Tax liabilities shown in tables 3.16 and 3.17 differ from these outturn figures due to a range of factors including data (the outturn is based on a 100% data extract, however, the SPI is based on a sample) and measurement of Income Tax. In addition, there can be a difference between being a Scottish or Welsh taxpayer as set out in the Scotland and Welsh Acts and having a Scottish or Welsh residential postcode - for example if someone moves to Scotland or Wales towards the end of the year.
Tables 3.16 and 3.17 allow users to compare Income Tax liabilities on earned income for Scottish and Welsh taxpayers by different classifications – where tax is due versus where the taxpayer is a resident at the end of the tax year. The underlying tax liability calculations are the same for both tables. Please see section 13 for further details of the changes in the tax liability calculations.
The forecasts of Scottish and Welsh Income Tax that may be produced by the Office for Budget Responsibility, Scottish Fiscal Commission or Welsh Government and the outturn reported in the HMRC Accounts, may differ from what is shown in tables 3.16 and 3.17 for many reasons, including the following:
-
Economic forecasting error: forecast assumptions such as earnings increases may prove incorrect, for example, if the economy grows more or less than expected.
-
Methodology and data: the SPI is based on a sample and therefore produces estimates rather than exact figures. These estimates have a margin of sampling error associated with them as discussed above. The outturn figures published in HMRC’s Annual Accounts are based on a 100% data.
-
Measurement of Income Tax: for example, the outturn figures include an adjustment for uncollected tax but the SPI tables in this document purely reflect taxpayers’ tax liabilities.
Comparison with Table 3.11
The information provided in tables 3.16 and 3.17 differs from that presented in table 3.11. Table 3.11 shows Income Tax due from all sources of income, whereas tables 3.16 and 3.17 show the amount of tax due on non-savings/non-dividend (NSND) income only.
Furthermore, table 3.16, which uses the Scottish and Welsh taxpayer indicators, differs from tables 3.11 and 3.17 (and the sub-regional breakdowns in the separate annual release covering tables 3.12 to 3.15a) which classify each individual based on their residential postcode.
There will be some individuals who are included in table 3.16 as a Scottish or Welsh taxpayer who are living outside of Scotland or Wales at the end of the year and are therefore included in a different area in table 3.11 or as having a non-Scottish or non-Welsh residential postcode in table 3.17. Similarly, there will also be some individuals who are not Scottish or Welsh taxpayers for the 2020 to 2021 tax year but will be living in Scotland or Wales on 5th April 2021 and included in the Scotland or Wales categories in table 3.11 and 3.17.
Table 3: Summary of the differences between taxpayer classification and tax definitions for tables 3.11 (and 3.12 to 3.15a), 3.16 and 3.17
| Table | Taxpayer classification | Tax definition |
|---|---|---|
| 3.11 (and 3.12 to 3.15a) | Residential postcode on 5th April for a given tax year | Income Tax from all sources of income |
| 3.16 | Scottish and Welsh taxpayer indicator (individuals taxed under the Scottish or Welsh tax systems for a given tax year) | Non-savings/non-dividend (NSND) tax |
| 3.17 | Residential postcode on 5th April for a given tax year | Non-savings/non-dividend (NSND) tax |
15. UK Standard Industrial Classification of Economic Activities 2007 (SIC2007)
For table 3.9, the industry categories are based on UK Standard Industrial Classification of Economic Activities 2007 (SIC2007). Most categories comprise one or several of the 21 Sections from SIC2007. The exception is that Section M (Professional, Scientific and Technical Activities) has been split into two parts so that Legal and Accounting activities, a significant component of self-employment activity, can be separately identified.
Table 4: SIC2007 Section letter and range of SIC2007 5 digit codes that form each industry category in table 3.9
| Table 3.9 Category | Section | SIC2007 codes |
|---|---|---|
| Agriculture, Forestry and Fishing | A | 01110 – 03220 |
| Manufacturing | C | 10110 - 33200 |
| Construction | F | 41100 - 43999 |
| Wholesale and Retail Trade; Repair of Motor Vehicles and Motorcycles | G | 45110 – 47990 |
| Transportation and Storage | H | 49100 – 53202 |
| Accommodation and Food Service Activities | I | 55100 – 56302 |
| Information & Communication | J | 58110 – 63990 |
| Financial, Insurance and Real Estate Activities | K, L | 64110 - 68320 |
| Legal & Accounting Activities | M | 69100 – 69203 |
| Other Professional, Scientific and Technical Activities | M | 70100 – 75000 |
| Administrative and Support Service Activities | N | 77110 – 82990 |
| Education | P | 85100 – 85600 |
| Human Health and Social Work Activities | Q | 86100 - 88990 |
| Arts, Entertainment and Recreation | R | 90010 – 93290 |
| Other Industries | B, D, E, O, S, T and U | 05100 – 09900, 35110 – 39000, 84110 – 84300, 94110 – 99000 |
| Unknown Industries | Blank or invalid values |
More information about SIC2007 can be found on the ONS website at: Standard Industrial Classification index
16. Glossary of Terms
This section aims to explain acronyms, abbreviations and terms associated with personal incomes and Income Tax liabilities.
Allowances
The amount of income which an individual can receive before being liable for Income Tax. The Personal Allowance is an example of an allowance.
Average rate of tax
The ratio of Income Tax liability to total income, where income is measured before deductions, reliefs and allowances.
Basic rate limit
The highest income point for taxable income (after allowances) at which basic rate Income Tax is charged.
CESA (Computerised Environment for Self Assessment)
The computer system used to administer Self Assessment from which SA data for the SPI has been extracted since 1996 to 1997. See Self Assessment (SA).
COP (Computerisation of PAYE)
The computer system which used to administer PAYE until it was replaced by NPS and from which PAYE data for the SPI was extracted for tax years 1997 to 1998 to 2007 to 2008 inclusive.
Deductions and Reliefs
Amounts deducted from total income, along with personal allowances to arrive at the amount of taxable income subject to an Income Tax charge. This includes amounts for contributions to occupational and personal pensions, and a variety of other Deductions and Reliefs including charitable giving and loss relief etc.
Dividend Income
Income derived from shares.
Geographical Areas
Some tables present information for sub-UK areas described as Government Office Region, County, District and Parliamentary Constituency. Administrative and Political geographical areas are not held on taxpayers’ records. For the SPI, the areas are attached by matching the individual’s postcode to the Office for National Statistics Postcode Directory.
Industry
Industry categories are based on UK Standard Industrial Classification of Economic Activities 2007 (SIC2007). Income from self-employment (sole trade and partner) is assigned an industry using the business text descriptions supplied on Self Assessment returns.
National Insurance and PAYE System (NPS)
NPS is the computer system HMRC uses to administer PAYE. It replaced COP and is the source of PAYE data for SPI for tax year 2008 to 2009 onwards.
National Insurance Recording System 2 (NIRS2)
The computer system used to monitor payment of National Insurance (NI) contributions and to calculate and prove entitlement to contributory benefits. These include Job Seekers Allowance (JSA) and the National Insurance Pension. It provides contribution information to a number of government departments.
P14s
Form P14 is an End of Year summary for an employment that is submitted by the employer to HMRC, showing pay, tax and NI contributions for the year. The employer provides similar information to the employee on an end of year certificate, form P60.
Pay As You Earn (PAYE)
PAYE is the system used by HMRC to collect and account for Income Tax on earnings from employment and pensions. Income Tax and National Insurance Contributions are deducted by the employer and paid over to HMRC on behalf of the individual for each pay period.
Personal Allowance
The amount of income you can receive for the tax year without having to pay tax on it.
Real Time Information (RTI)
The RTI data used in this release come from HMRC’s PAYE RTI system. It covers the whole population rather than a sample of people or companies.
Savings Income
A particular class of income that includes interest on bank and building society accounts.
Self Assessment (SA)
SA is a system where an individual declares their income and can calculate their own Income Tax due after the end of the tax year. Taxpayers included in SA can be higher earners, self-employed and taxpayers with complex tax affairs.
Starting rate limit/Starting rate for savings limit
The highest income point for taxable income (after allowances) at which starting rate Income Tax is charged. From tax year 2008 to 2009 the starting rate was abolished for non-savings income and applied only to non dividend savings income. From tax year 2015 to 2016 the starting rate of tax for savings income was reduced from 10% to 0%, and the amount of savings income that the new 0% rate applies to was increased from £2,880 to £5,000. For more information please see the following briefing: Starting tax rate for savings interest
Superannuation contributions
The regular amounts paid by an employee into an employer occupational pension fund; these are deducted from the employee’s salary. Superannuation contributions to an authorised fund or scheme are not liable to Income Tax and the employer would deduct the amount of superannuation contributions from the gross pay before assessing the Income Tax liability through PAYE.
Survey of Personal Incomes (SPI)
An annual survey of individuals who could be liable for Income Tax derived from HMRC administrative systems holding data on persons within PAYE, SA and Income Tax claims.
Tax liabilities
The amount of Income Tax due on taxable income after applying tax rates to the tax base. The Income Tax liability for each sample case in SPI is calculated by reference to the amounts of income by type, deductions and reliefs and the tax regime parameters that apply for the year. The calculated liability for a tax year will differ from the amount of tax receipts collected in a financial year.
Tax receipts
The amount of Income Tax collected by HMRC. The SPI measures the amount of Income Tax liability for a tax year, but not the amount of receipts in the financial year.
Taxable income
Income assessable to Income Tax after allowances.
Taxpayer
An individual calculated to have a positive Income Tax liability for the tax year, based on the income, allowances, reliefs and deductions for the year.
Total income
The sum of an individual’s components of income taken into account in calculating Income Tax. This includes earnings from employment, profits from self-employment, pension income, some social security benefits, savings income, income from shares (dividends), rental income, and income paid from trusts. It excludes:
-
gains from the disposal of assets that are classified as capital gains
-
interest, dividends or bonuses from tax exempt investments (for example, ISAs and National Savings & Investments Savings Certificates)
-
interest and terminal bonuses from Save As You Earn Schemes
-
Premium Bond, National Lottery and gambling prize winnings
Total income is calculated before relief for contributions to occupational and personal pensions, other deductions and reliefs or personal allowances.
In the tax system, income is streamed into three main categories: dividends; savings income (not dividends); and non-savings income as different rules apply.