Scottish Income Tax Outturn Statistics: 2020 to 2021
Published 7 July 2022

© Crown copyright 2022
This publication is licensed under the terms of the Open Government Licence v3.0 except where otherwise stated. To view this licence, visit nationalarchives.gov.uk/doc/open-government-licence/version/3 or write to the Information Policy Team, The National Archives, Kew, London TW9 4DU, or email: psi@nationalarchives.gov.uk.
Where we have identified any third party copyright information you will need to obtain permission from the copyright holders concerned.
This publication is available at https://www.gov.uk/government/statistics/scottish-income-tax-outturn-statistics-2020-to-2021/scottish-income-tax-outturn-statistics-2020-to-2021
1. Overview
The aim of these Experimental Statistics is to provide users with information of interest in relation to the Scottish Income Tax (SIT) Outturn. This details net non-savings non-dividends (NSND) Income Tax for Scottish taxpayers.
This publication also shows:
- how many Scottish taxpayers are liable at each rate of tax
- an Outturn of Scottish Income Tax revenue at each rate of tax
- an estimated breakdown of the NSND Income Tax paid by Scottish taxpayers split between payments collected via Pay as You Earn (PAYE) and payments collected via Self Assessment (SA)
Additionally, the statistical tables released alongside this bulletin also provide equivalent information for the rest of the UK (rUK) taxpayers on the same basis so comparisons can be made. References to numbered tables throughout this bulletin refer to statistical tables released alongside this bulletin. References to tables labelled with letters pertain to the tables present within the bulletin.
Calculations in this bulletin (for example, on the average tax paid by taxpayers) are based on unrounded numbers so may not match calculations based on figures in the statistical release which are rounded.
1.1 What does it mean that these are Experimental Statistics?
Experimental Statistics are statistics that are within their development phase and are published in order to involve potential users at an early stage in building a high-quality set of statistics that meet user needs.
The Experimental Statistics label highlights to users that HM Revenue and Customs (HMRC) are still working on further developing the style and content for the tables and commentary in this publication.
It should be emphasised that the label of Experimental Statistics does not mean that the statistics are of low quality, but it does signify that the statistics are novel and what statistics are reported and how is still being developed.
2. Main Findings
2.1 Note on the definition of ‘rUK’
From 2019 to 2020, a proportion of Income Tax paid by taxpayers living in Wales has been transferred to the Welsh Government through the introduction of the Welsh Rates of Income Tax (WRIT). These are controlled by the Welsh Government (WG). HMRC publishes separate statistics on Welsh Income Tax.
Prior to 2020 to 2021, indexing of the Scottish Block Grant was based upon growth of NSND Income Tax in England, Northern Ireland and Wales (EWNI). However, with the introduction of WRIT the indexing of the Scottish Block Grant will now be determined by the NSND Income Tax Outturn for England and Northern Ireland (ENI) only. Despite the remainder of WRIT being allocated to rUK; this is not used to calculate the Block Grant Adjustment for Scotland.
From the 2020 to 2021 reconciliation onwards, the rUK (ENI) outturn will be used by HM Treasury to calculate and agree with the Scottish Government (SG) the BGA reconciliation.
All rUK figures in this bulletin include England and Northern Ireland outturn only.
2.2 Scottish Income Tax 2020 to 2021
The main findings of these statistics are:
- the total amount of NSND Income Tax generated by Scottish taxpayers in the 2020 to 2021 tax year was £11,948 million – an increase of 1.0% compared to 2019 to 2020
- this represents an average increase in NSND Income Tax of £25 per Scottish taxpayer
- the total amount of NSND Income Tax generated by rUK taxpayers in the 2020 to 2021 tax year was £163,460 million – an increase of 2.0% compared to 2019 to 2020
- this represents an average increase in NSND Income Tax of £95 per rUK taxpayer
- the total number of Scottish taxpayers in the 2020 to 2021 tax year was 2,537,900 – an increase of 0.5% compared to 2019 to 2020
- the total number of rUK taxpayers in the 2020 to 2021 tax year was 27,002,800 – an increase of 0.4% compared to 2019 to 2020
- the Scottish share of UK NSND Income Tax has decreased from 6.7% in the 2019 to 2020 tax year to 6.6% in the 2020 to 2021 tax year
3. Background
3.1 Definitions of ‘non-savings non-dividends’
The statistics in Tables 1 to 3 provide information detailing Income Tax due on NSND income. NSND income includes earnings from employment, pensions, profits from self-employed sources and property.
All Income Tax due on NSND income is devolved to Scotland. These tables provide a comparison of how NSND Income Tax for Scottish taxpayers compares to that of rUK taxpayers.
Tax on NSND income in these tables is measured as the Income Tax liability expected to be collected by HMRC. There is also an adjustment to reflect reliefs which are not allocated to individual taxpayer accounts.
Taxpayers in these tables are defined as individuals who have some net NSND Income Tax liability due after reliefs have been deducted from their Income Tax bill.
In Table 2, taxpayers have been assigned to a marginal tax rate (the Income Tax band that a taxpayer would pay their next pound of Income Tax into) based solely on their NSND Income Tax, however, it is possible that they have paid tax at a higher rate on their savings/dividend income.
3.2 Established liabilities and where tax is paid
Employers and pension providers must normally operate PAYE as part of their payroll. PAYE is HMRC’s system to collect Income Tax and National Insurance (NI) from employments and is largely paid in the same year as the taxable activity. When an employer pays their employees through payroll, they also need to make tax and NI deductions for PAYE. Employers are then obliged to report the amount of these payments and deductions to HMRC as well as paying the tax and NI deducted to HMRC.
An individual is required to file a Self Assessment (SA) return if they meet certain criteria. This is required even for individuals who also pay employment income into the PAYE system, if a requirement for filing in SA is met. SA returns are generally submitted in the year after the taxable activity has taken place, and the SA return filing deadline is typically nine months after the tax year has ended.
For the outturn calculation, an individual who files an SA return will have all their Income Tax liability established (reconciled) in SA when they submit their return, even if they have had some tax deducted through PAYE.
An individual who is not required to file in SA will have their liability established in PAYE when their tax information is reconciled by the National Insurance and PAYE Service (NPS).
Table 3 shows the system that established NSND Income Tax liabilities are paid through; that is ‘collected at source’ (PAYE) or paid through SA. This split in table 3 is different to the split of established liabilities in table 1, which is based on the system which the individuals’ liabilities are reconciled in.
For example, an individual earning income from an employment and additional sources may have their employment Income Tax deducted from their pay by their employer, whilst also paying Income Tax for additional income (e.g. property income) by filing an SA return. In this case, all Income Tax for this taxpayer is recorded in the SA Established component of the outturn as this is where the record will be reconciled. However, amounts paid will be split between PAYE and SA accordingly, as is reflected in table 3.
4. Scottish NSND Income Tax Outturn and rUK comparison
4.1 Outturn components
Table 1 of the statistical release shows how each component of the outturn is combined to calculate the figure for the total NSND Income Tax for Scottish taxpayers. We also see how this compares to rUK. Please see section 7 for further information on the outturn components.
Overall, SIT grew slightly less than rUK Income Tax (1.0% compared to 2.0%). SIT had stronger growth in SA Established Liabilities (1.5%) compared to PAYE Established Liabilities (0.6%).
The largest components of the outturn are SA Established Liability and PAYE Established Liability. More NSND Income Tax liability is established through PAYE in Scotland whilst more is established through SA for rUK. Table 1 below shows 57.5% of rUK liabilities are reconciled in the SA Established component, whilst the same figure for SIT is 42.8%.
Figure 1: Breakdown of NSND Income Tax for Scottish taxpayers by component, 2019 to 2020 and 2020 to 2021
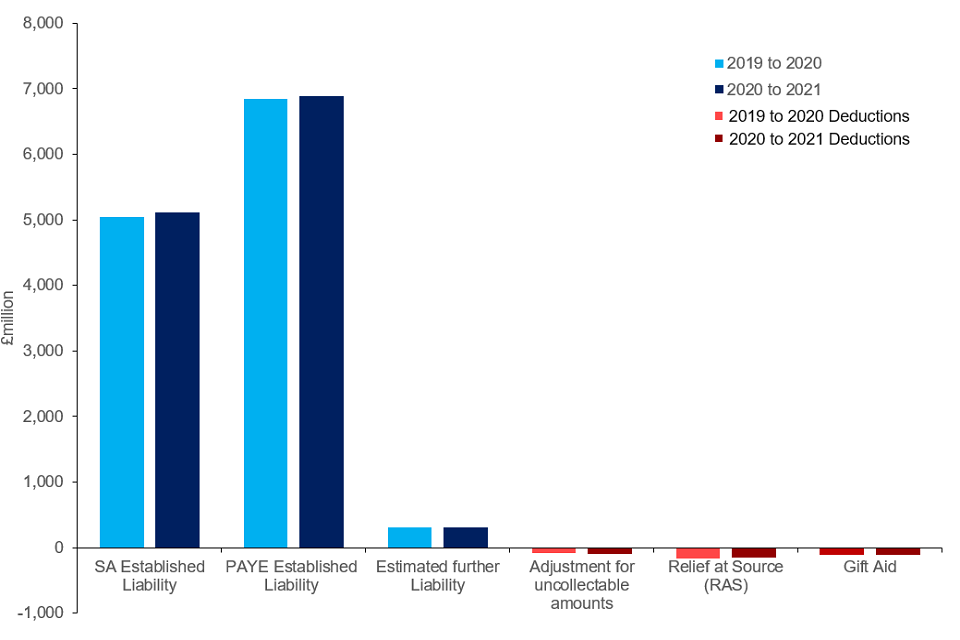
Table A: Breakdown of NSND Income Tax for Scottish taxpayers by component, 2019 to 2020 and 2020 to 2021
| 2019 to 2020 Scottish NSND Income Tax | 2020 to 2021 Scottish NSND Income Tax | |
|---|---|---|
| SA Established Liability | £5,041 million | £5,116 million |
| PAYE Established Liability | £6,845 million | £6,884 million |
| Estimated further Liability | £307 million | £315 million |
| Adjustment for uncollectable amounts | -£89 million | -£97 million |
| Relief at Source (RAS) | -£172 million | -£155 million |
| Gift Aid | -£108 million | -£114 million |
| Total | £11,825 million | £11,948 million |
Figure 2: Breakdown of NSND Income Tax for rUK taxpayers by component, 2019 to 2020 and 2020 to 2021
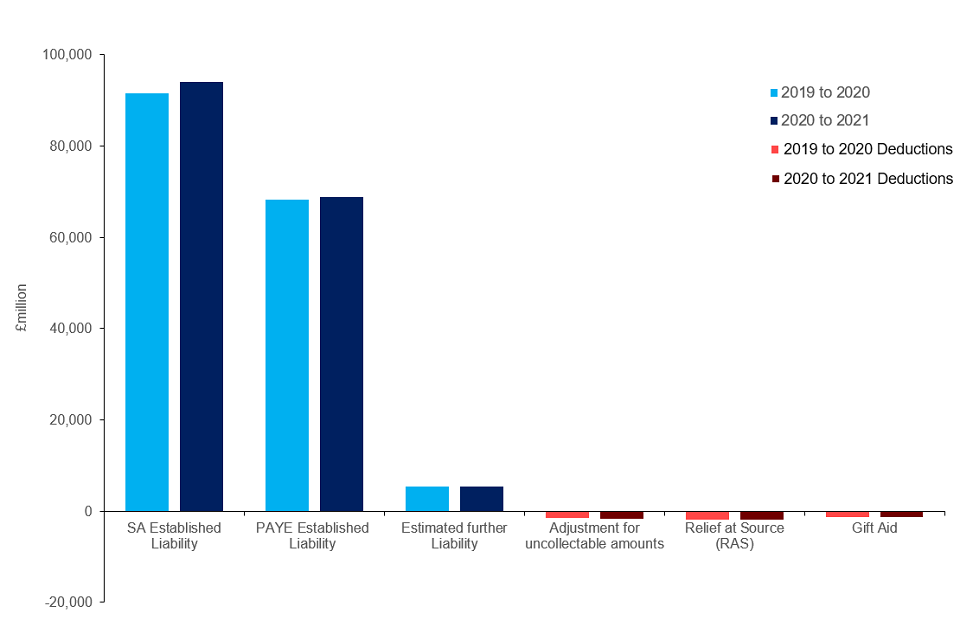
Table B: Breakdown of NSND Income Tax for rUK taxpayers by component, 2019 to 2020 and 2020 to 2021
| 2019 to 2020 rUK NSND Income Tax | 2020 to 2021 rUK NSND Income Tax | |
|---|---|---|
| SA Established Liability | £91,454 million | £94,068 million |
| PAYE Established Liability | £68,177 million | £68,761 million |
| Estimated further Liability | £5,410 million | £5,461 million |
| Adjustment for uncollectable amounts | -£1,580 million | -£1,694 million |
| Relief at Source (RAS) | -£1,935 million | -£1,841 million |
| Gift Aid | -£1,221 million | -£1,294 million |
| Total | £160,305 million | £163,460 million |
Although the SA Established component constitutes the majority of rUK liabilities by reconciliation method, the majority of liabilities in the rUK system are paid at source (through a PAYE scheme). Table 3 of the statistical release shows 85.0% of all rUK liabilities are collected through the PAYE system. For Scotland, the equivalent figure is 87.6% - the lowest figure in our time series.
The lower proportion of tax collected at source is partially caused by a significantly higher proportion of rUK taxpayers being required to submit SA returns compared to SIT taxpayers.
Table C: Established Scottish NSND Income Tax by collection method, 2016 to 2017 through to 2020 to 2021
| 2016 to 2017 Scottish NSND Income Tax | 2017 to 2018 Scottish NSND Income Tax | 2018 to 2019 Scottish NSND Income Tax | 2019 to 2020 Scottish NSND Income Tax | 2020 to 2021 Scottish NSND Income Tax | |
|---|---|---|---|---|---|
| Collected at Source | £9,758 million (88.5%) | £9,891 million (88.1%) | £10,465 million (87.9%) | £10,791 million (88.5%) | £10,790 million (87.6%) |
| Paid through SA | £1,271 million (11.5%) | £1,340 million (11.9%) | £1,435 million (12.1%) | £1,401 million (11.5%) | £1,524 million (12.4%) |
| Total NSND Income Tax | £10,706 million | £10,908 million | £11,549 million | £11,825 million | £11,948 million |
4.2 Tax liabilities by band – all NSND Income Tax
Table 2 of the statistical release provides breakdowns of all NSND Income Tax liabilities by tax band and taxpayer types (defined by their highest marginal rate; the Income Tax band that a taxpayer would pay their next pound of Income Tax into).
There was a slight increase in the proportion of higher rate taxpayers in Scotland (14.3% in 2020 to 2021 compared to 14.1% in 2019 to 2020), continuing the upward trend from 2018 to 2019 (12.7%). Although the proportion of higher rate taxpayers is smaller for rUK, the percentage increase between 2019 to 2020 and 2020 to 2021 was similar to SIT from 11.3% to 11.7%.
Figure 3: Share of Scottish and rUK taxpayers by their marginal tax rate, 2019 to 2020 and 2020 to 2021
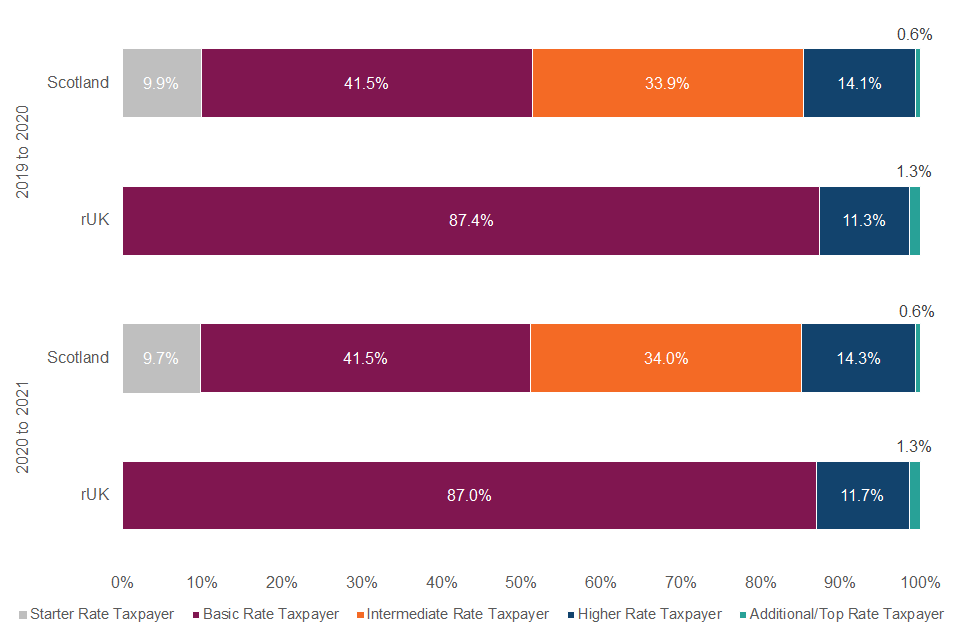
Table D: Share of Scottish and rUK taxpayers by their marginal tax rate, 2019 to 2020 and 2020 to 2021
| 2019 to 2020 Scottish Taxpayers | 2019 to 2020 rUK Taxpayers | 2020 to 2021 Scottish Taxpayers | 2020 to 2021 rUK Taxpayers | |
|---|---|---|---|---|
| Starter Rate Taxpayer | 9.9% | N/A | 9.7% | N/A |
| Basic Rate Taxpayer | 41.5% | 87.4% | 41.5% | 87.0% |
| Intermediate Rate Taxpayer | 33.9% | N/A | 34.0% | N/A |
| Higher Rate Taxpayer | 14.1% | 11.3% | 14.3% | 11.7% |
| Additional/Top Rate Taxpayer | 0.6% | 1.3% | 0.6% | 1.3% |
Table E highlights that although a small proportion (14.8%) of Scottish taxpayers were higher or top rate taxpayers, they were liable for 59.8% of NSND Income Tax in Scotland during 2020 to 2021.
Figure 4: Proportion of Scottish and rUK NSND Income Tax paid by each taxpayer type, 2019 to 2020 and 2020 to 2021

Table E: Proportion of Scottish and rUK NSND Income Tax paid by each taxpayer type, 2019 to 2020 and 2020 to 2021
| 2019 to 2020 Scottish Taxpayers | 2019 to 2020 rUK Taxpayers | 2020 to 2021 Scottish Taxpayers | 2020 to 2021 rUK Taxpayers | |
|---|---|---|---|---|
| Starter Rate Taxpayer | 0.4% | N/A | 0.4% | N/A |
| Basic Rate Taxpayer | 10.2% | 35.1% | 10.7% | 34.9% |
| Intermediate Rate Taxpayer | 29.1% | N/A | 29.1% | N/A |
| Higher Rate Taxpayer | 43.5% | 32.5% | 43.7% | 32.7% |
| Additional/Top Rate Taxpayer | 16.8% | 32.4% | 16.1% | 32.4% |
The proportion of total NSND Income Tax liable at the higher and top rate tax bands decreased slightly in Scotland between 2019 to 2020 and 2020 to 2021 (from 40.5% to 39.9%) despite the thresholds for each of these bands remaining unchanged. The number of higher rate taxpayers increased by 1.9% and the number of top rate taxpayers decreased by 4.7% over the period.
Figure 5: Share of Scottish and rUK NSND Income Tax by Income Tax band, 2019 to 2020 and 2020 to 2021
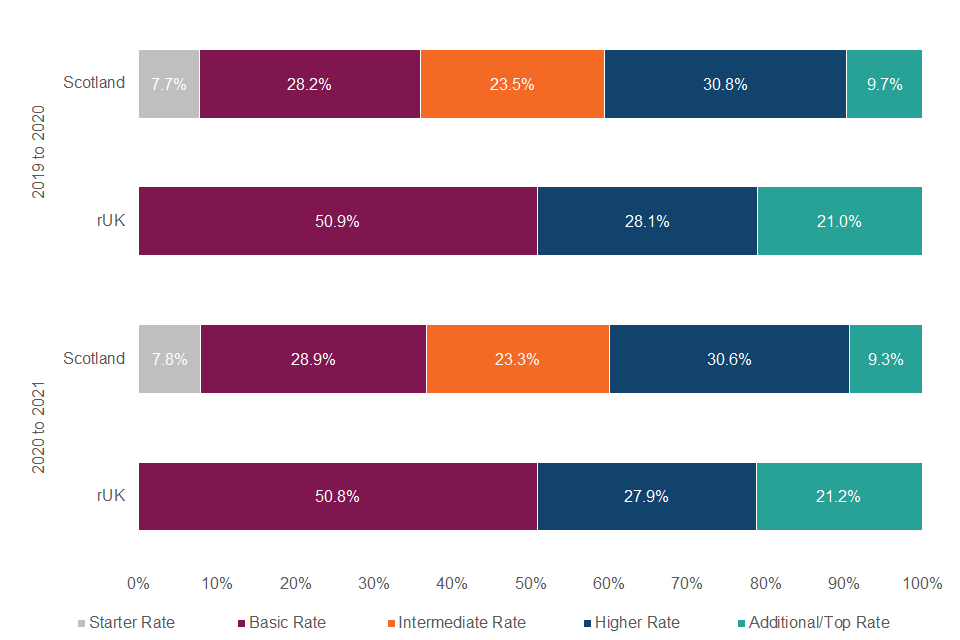
Table F: Share of Scottish and rUK NSND Income Tax by Income Tax band, 2019 to 2020 and 2020 to 2021
| 2019 to 2020 Scottish NSND Income Tax | 2019 to 2020 rUK NSND Income Tax | 2020 to 2021 Scottish NSND Income Tax | 2020 to 2021 rUK NSND Income Tax | |
|---|---|---|---|---|
| Starter Rate | 7.7% | N/A | 7.8% | N/A |
| Basic Rate | 28.2% | 50.9% | 28.9% | 50.8% |
| Intermediate Rate | 23.5% | N/A | 23.3% | N/A |
| Higher Rate | 30.8% | 28.1% | 30.6% | 27.9% |
| Additional/Top Rate | 9.7% | 21.0% | 9.3% | 21.2% |
4.3 Average Amounts of NSND Income Tax Liability
There was a reduction in average NSND Income Tax paid at the intermediate rate in SIT from 2019 to 2020 and 2020 to 2021. This can in part be explained by a £214 narrowing of the intermediate rate Income Tax band (see Table M). The narrowing of this Income Tax band reduces the maximum tax that can be paid into this band by £44.94.
Figure 6: Average NSND Income Tax paid at each Income Tax Band, 2019 to 2020 and 2020 to 2021
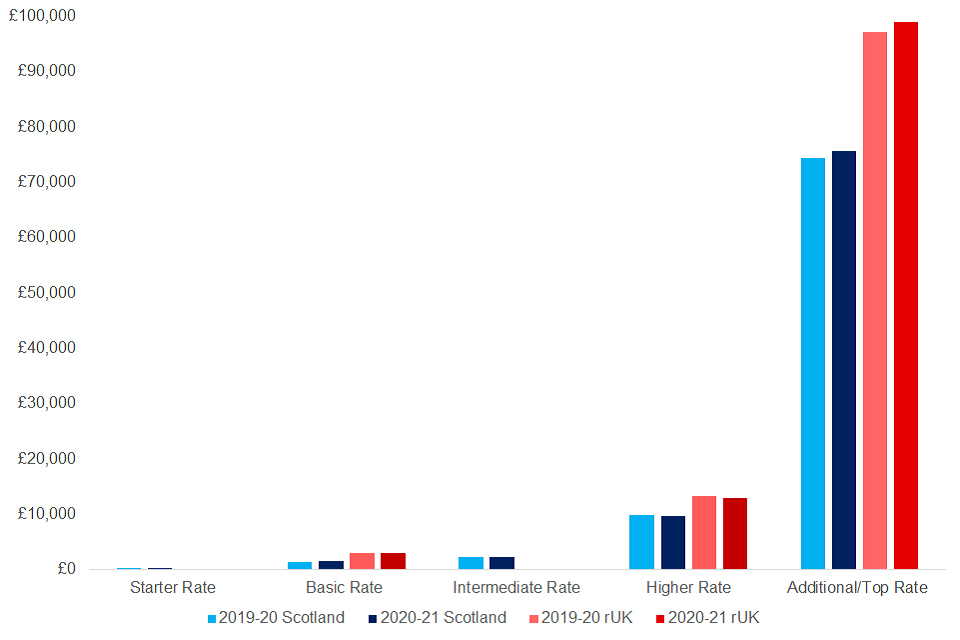
Table G: Average NSND Income Tax paid at each Income Tax band, 2019 to 2020 and 2020 to 2021
| 2019 to 2020 Scottish NSND Income Tax | 2019 to 2020 rUK NSND Income Tax | 2020 to 2021 Scottish NSND Income Tax | 2020 to 2021 rUK NSND Income Tax | |
|---|---|---|---|---|
| Starter Rate | £363 | N/A | £369 | N/A |
| Basic Rate | £1,465 | £3,030 | £1,508 | £3,077 |
| Intermediate Rate | £2,266 | N/A | £2,249 | N/A |
| Higher Rate | £9,832 | £13,313 | £9,701 | £13,006 |
| Additional/Top Rate | £74,361 | £97,160 | £75,684 | £98,927 |
Both SIT and rUK exhibit increases in average NSND Income Tax generated for all taxpayer types (defined by their highest marginal rate), aside from the higher rate taxpayers.
The average NSND Income Tax paid by higher rate taxpayers in Scotland decreased from £14,477 in 2019 to 2020 to £14,432 in 2020 to 2021 (a decrease of 0.3%).
There were approximately 700 fewer top rate taxpayers in the 2020 to 2021 tax year and the average NSND Income Tax for top rate taxpayers grew by £1,619 (1.3%).
Similar trends are present in the rUK data, with the average rUK higher rate taxpayer’s liability declining by £228 from £17,155 in 2019 to 2020 to £16,927 in 2020 to 2021.
These changes were driven by movements in the NSND income distribution of Scottish and rUK taxpayers.
Figure 7: Average NSND Income Tax paid by each taxpayer type, 2019 to 2020 and 2020 to 2021
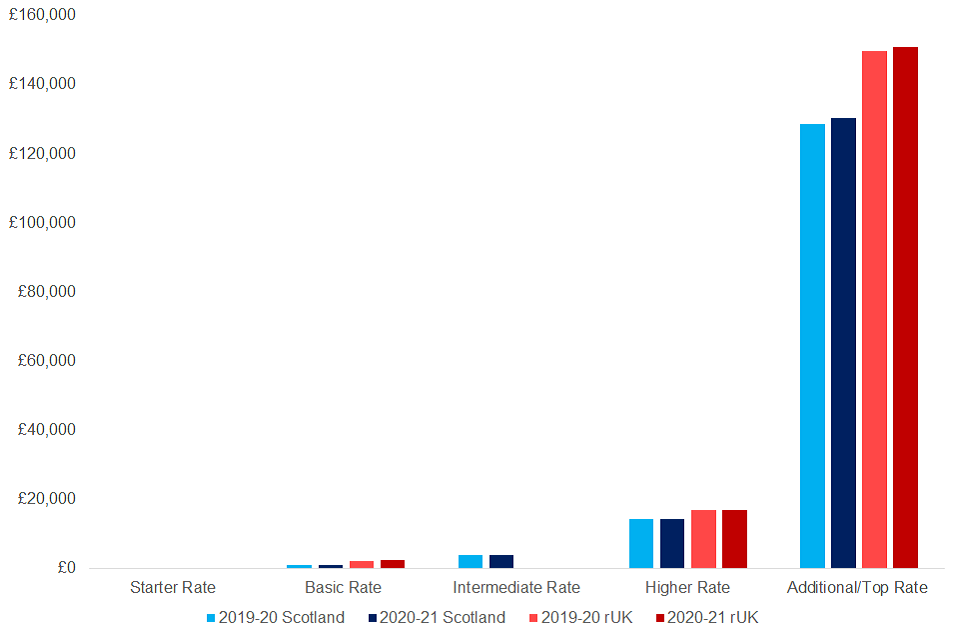
Table H: Average NSND Income Tax paid by each taxpayer type, 2019 to 2020 and 2020 to 2021
| 2019 to 2020 Scottish NSND Income Tax | 2019 to 2020 rUK NSND Income Tax | 2020 to 2021 Scottish NSND Income Tax | 2020 to 2021 rUK NSND Income Tax | |
|---|---|---|---|---|
| Starter Rate Taxpayers | £186 | N/A | £187 | N/A |
| Basic Rate Taxpayers | £1,156 | £2,392 | £1,213 | £2,428 |
| Intermediate Rate Taxpayers | £4,010 | N/A | £4,039 | N/A |
| Higher Rate Taxpayers | £14,477 | £17,155 | £14,432 | £16,927 |
| Additional/Top Rate Taxpayers | £128,665 | £149,648 | £130,284 | £150,864 |
5. Indicative In-Year Scottish Income Tax
5.1 Background
HMRC provides in year monitoring for Scottish NSND Income Tax from Real Time Information (RTI) data to the Scottish Government (SG), Scottish Fiscal Commission (SFC) and the Office for Budget Responsibility (OBR) each month.
Table 4 of the statistical release shows these statistics as a monthly time series. It shows the amount of UK Income Tax withheld by employers on behalf of their employees (as reported in RTI) and the proportion of tax from Scottish taxpayers. The table also contains amounts of Income Tax withheld on behalf of Welsh residing taxpayers.
The Income Tax measure in Table 4 is not equivalent to that presented in Tables 1 to 3 as Income Tax in RTI will include amounts for reserved charges other than NSND Income Tax. For example, any tax code adjustments to account for Savings and Dividend Income or High Income Child Benefit Tax charge (HICBC), which are not devolved to the Scottish government.
However, it is a useful guide of the in-year Income Tax paid by SIT taxpayers prior to the publication of the Outturn statistics.
Scottish taxpayers are identified using the Scottish indicator variable provided by NPS (see section 6.2 for more details of how Scottish taxpayers are defined in NPS).
Although, the tax figures are updated for each month during the in-year monthly process. The final RTI monthly time series will generally not be updated following the end of the tax year.
5.2 Income Tax reported as withheld from RTI
There are seasonal fluctuations within the monthly time series of withheld Income Tax in RTI. These are relatively consistent throughout the period 2019 to 2020 to 2021 to 2022.
There is a clear spike in tax in March each year. This reflects the time period when bonuses are generally paid at the end of the tax year.
There is also a smaller spike in December which is likely to reflect an increase in employment activity around the Christmas holiday period, for example, seasonal workers in supermarkets.
Figure 8: RTI Income Tax reported as withheld for Scottish taxpayers, 2019 to 2020 through to 2021 to 2022
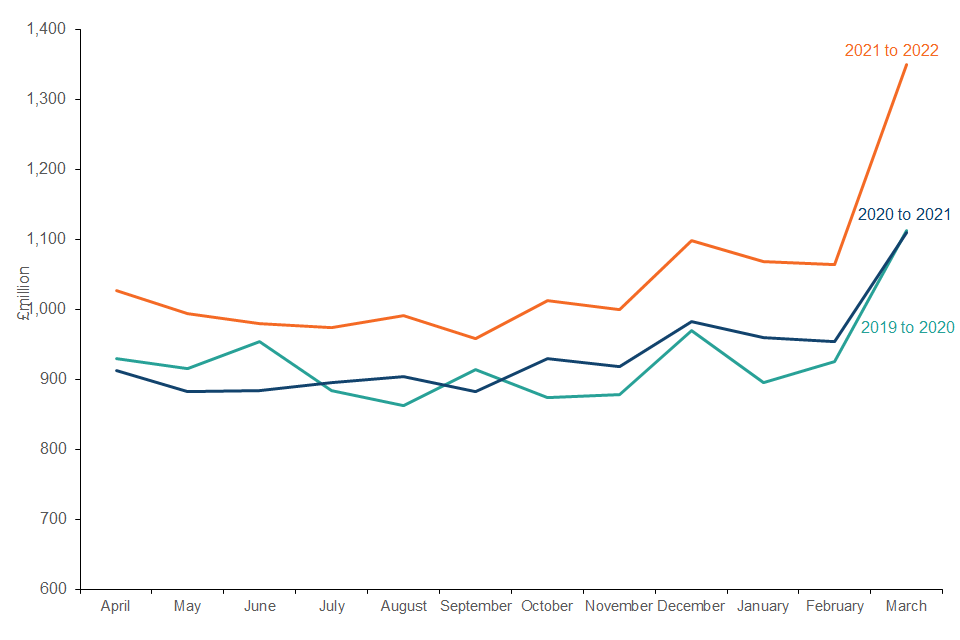
Table I: RTI Income Tax reported as withheld for Scottish taxpayers, 2019 to 2020 through to 2021 to 2022
| Month | 2019 to 2020 | 2020 to 2021 | 2021 to 2022 |
|---|---|---|---|
| April | £930 million | £912 million | £1,027 million |
| May | £915 million | £882 million | £994 million |
| June | £954 million | £884 million | £980 million |
| July | £884 million | £895 million | £974 million |
| August | £863 million | £904 million | £991 million |
| September | £914 million | £882 million | £958 million |
| October | £874 million | £930 million | £1,013 million |
| November | £878 million | £919 million | £1,000 million |
| December | £970 million | £983 million | £1,099 million |
| January | £896 million | £960 million | £1,069 million |
| February | £925 million | £954 million | £1,064 million |
| March | £1,113 million | £1,110 million | £1,350 million |
Seasonal fluctuations in the Scottish share of the whole UK RTI Income Tax are also relatively consistent with the two previous tax years.
Following on from an October peak, the Scottish share exhibits a gradual decline up until it reaches a low point of around 7% in March. This likely reflects bonus payments forming a smaller proportion of remuneration for Scottish employees compared to rUK.
However, generally, the share has decreased consistently since the 2019 to 2020 tax year, with the overall average for the 2021 to 2022 tax year being 6.75%.
Figure 9: Scottish share of RTI Income Tax reported as withheld, 2019 to 2020 through to 2021 to 2022
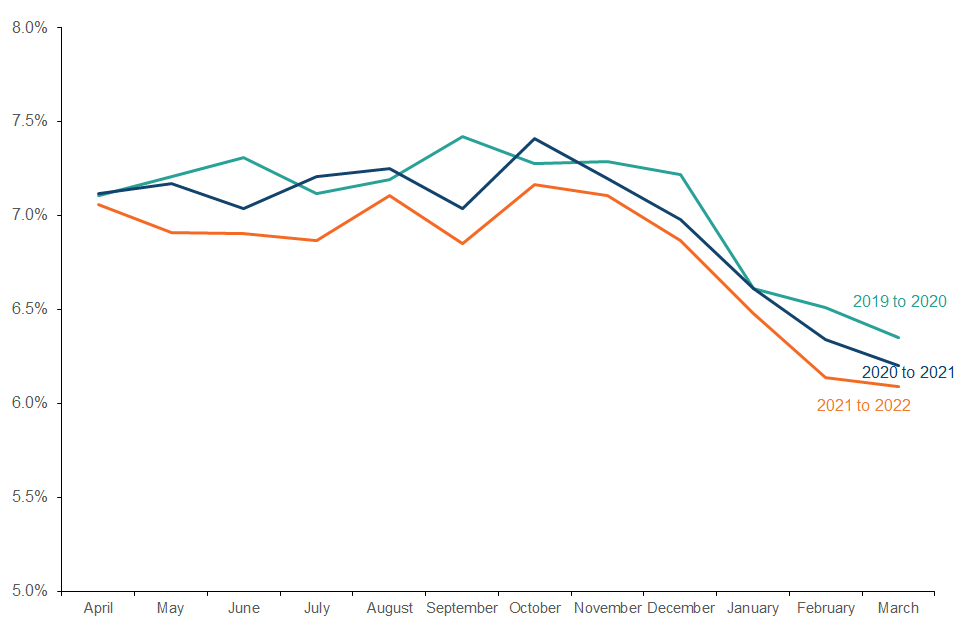
Table J: Scottish share of RTI Income Tax reported as withheld, 2019 to 2020 through to 2021 to 2022
| Month | 2019 to 2020 | 2020 to 2021 | 2021 to 2022 |
|---|---|---|---|
| April | 7.11% | 7.12% | 7.06% |
| May | 7.21% | 7.17% | 6.91% |
| June | 7.31% | 7.04% | 6.91% |
| July | 7.12% | 7.21% | 6.87% |
| August | 7.19% | 7.25% | 7.11% |
| September | 7.42% | 7.04% | 6.85% |
| October | 7.28% | 7.41% | 7.17% |
| November | 7.29% | 7.20% | 7.11% |
| December | 7.22% | 6.98% | 6.87% |
| January | 6.61% | 6.61% | 6.48% |
| February | 6.51% | 6.34% | 6.14% |
| March | 6.35% | 6.20% | 6.09% |
| Average | 7.02% | 6.93% | 6.75% |
6. Definitions
6.1 Background
The Scotland Act 2012 gave the Scottish Parliament the power to set a Scottish rate of Income Tax (SRIT). SRIT applied to non-saving non-dividend (NSND) income only; savings and dividend (SANDD) income was not devolved. It allowed the Scottish Government (SG) to change the amount of Income Tax that Scottish taxpayers pay and, as a result, the amount that the SG had to spend on their annual Budget.
SRIT replaced 10 percentage points of each of the main UK rates of tax for the tax year commencing 6 April 2016. In that year the UK basic, higher and additional rates for NSND income were reduced by 10 pence in the pound for Scottish taxpayers. This reduction was replaced by a Scottish rate set at 10 percentage points, so the overall rates paid by Scottish taxpayers remained the same as elsewhere in the UK.
The Scotland Act 2016 extended these powers, enabling the Scottish Parliament to set the tax band thresholds (excluding the Personal Allowance) as well as the rates. This applies to all NSND income of Scottish taxpayers and took effect from 6 April 2017.
As a result of the Scotland Act 2016; the Scottish government decided to set up separate rates of Income Tax for Scottish taxpayers with the new rates taking effect from the 2018 to 2019 tax year (see table M and N). These tax rates incorporated two new tax bands: the starter and intermediate rate.
6.2 Who is a Scottish taxpayer?
The definition of a Scottish taxpayer is based on where an individual resides in the course of a tax year. Scottish taxpayer status applies for a whole tax year – it is not possible to be a Scottish taxpayer for part of a tax year.
For most taxpayers, the location where they live will be obvious, but there will be less straightforward cases – for example, where people have more than one home, or have moved into or out of Scotland during the year. HMRC has provided guidance to help in these circumstances.
The location of a person’s employer is not relevant. So, for example, someone who works in Scotland, but has their home elsewhere in the UK, will not be a Scottish taxpayer.
Detailed guidance to whom Scottish Income Tax will apply
6.3 How do the tax systems on NSND income compare for Scottish and rUK taxpayers?
In 2018 to 2019 SIT was changed to introduce 2 new tax bands, the starter rate (19%) and the intermediate rate (21%) either side of the basic rate (20%). The higher and top rates of tax were also increased by 1% for Scottish taxpayers increasing from 40% and 45% to 41% and 46%, respectively.
The higher rate threshold for rUK increased to £50,000 in 2019 to 2020 but remained unchanged at £43,430 for Scotland.
Table M: Scottish and rUK Income Tax Thresholds, 2019 to 2020 and 2020 to 2021
| Tax Band Threshold | Scotland 2019 to 2020 | rUK 2019 to 2020 | Scotland 2020 to 2021 | rUK 2020 to 2021 |
|---|---|---|---|---|
| Personal Allowance | £12,500 | £12,500 | £12,500 | £12,500 |
| Basic Rate Threshold | £14,549 | N/A | £ 14,585 | N/A |
| Intermediate Rate Threshold | £24,944 | N/A | £25,158 | N/A |
| Higher Rate Threshold | £43,430 | £50,000 | £43,430 | £50,000 |
| Additional/Top Rate Threshold | £150,000 | £150,000 | £150,000 | £150,000 |
Table N: Tax rates for Scottish and rUK Income Tax, 2019 to 2020 and 2020 to 2021
| Tax Rates | Scotland 2019 to 2020 | rUK 2019 to 2020 | Scotland 2020 to 2021 | rUK 2020 to 2021 |
|---|---|---|---|---|
| Starter Rate | 19% | N/A | 19% | N/A |
| Basic Rate | 20% | 20% | 20% | 20% |
| Intermediate Rate | 21% | N/A | 21% | N/A |
| Higher Rate | 41% | 40% | 41% | 40% |
| Additional/Top Rate | 46% | 45% | 46% | 45% |
6.4 Why are we producing these statistics?
The SIT outturn in HMRC’s Annual Report determines the SG’s Income Tax revenues while the equivalent outturn for Income Tax on NSND income for rUK taxpayers in these statistics is used by HMT to determine the deduction to the SG’s Block Grant. The final adjustments to the SG’s Block Grant will only be confirmed once the figures in this publication have been formally signed off by the NAO through their annual audit of the HMRC Trust Statement.
These statistics are being published to give more information about NSND Income Tax paid by Scottish taxpayers.
6.5 What is the relationship between these statistics and other personal tax statistics and information?
There are other publications which show similar statistics to what is shown in this publication. It is important to understand how these other statistics relate to what is being released here and highlight differences in coverage or data used to compile each set of statistics.
The following publications are explained below:
- Devolved tax and spending forecasts (OBR)
- Scotland’s Economic and Fiscal forecasts (SFC)
- Personal Income Statistics from the Survey of Personal Incomes
- Earnings and Employment Statistics from PAYE Real Time Information
- Income Tax Receipts Publication
OBR: Devolved tax and spending forecasts
The OBR was established in 2010 to provide independent and authoritative analysis of the UK’s public finances. Alongside the UK Government’s Budgets and other fiscal statements, they produce forecasts for the economy and the public finances. They publish these in their Economic and Fiscal Outlook (EFO).
Since 2014, the OBR have also forecasted the tax streams that are devolved to the Scottish Parliament. The OBR publish devolved tax and spending forecasts alongside each EFO that are consistent with their main UK forecasts. The Treasury draws on the OBR’s tax forecasts when making spending settlements for the Scottish Government in accordance with their fiscal framework.
In the EFO, the OBR forecast based on the national accounts, with SA recorded in the year in which it is received. This contrasts to the OBR Devolved tax and spending publication and in the statistics set out here, where SA is recorded on a liabilities basis (i.e. in the year in which the tax liability arose).
The latest OBR devolved forecasts of SIT were published in March 2022. This shows the OBR forecast of SIT for 2020 to 2021 to be £12.3bn and the rUK NSND equivalent to be £169.3bn.
OBR March 2022 Devolved Tax and Spending Forecast
SFC: Scotland’s Economic and Fiscal forecasts
The SFC was established in 2017 and is Scotland’s official and independent budget forecaster. As such, it is the SFC’s forecasts, rather than the OBR’s forecast, for SIT that determines the amount the Scottish Government can draw down from the Treasury. The SFC reports to the Scottish Parliament.
The SFC produces 5-year forecasts of SG tax revenues, social security expenditure and of the Scottish economy. The SFC publication ‘Scotland’s Economic and Fiscal Forecasts’ details their forecasts of devolved taxes including devolved Income Tax. This publication also provides an explanation of how the SFC and OBR forecasts, as well as the outturn presented in this SIT publication, are used to adjust Scotland’s Budget.
The latest SFC Economic and Fiscal Forecasts publication was released in May 2022. This shows the SFC forecast of SIT to be £12,118 million for 2020 to 2021.
SFC Economic and Fiscal forecasts
SPI: Personal Income Statistics
HMRC release an annual publication from the Survey of Personal Incomes (SPI) which shows statistics for taxpayers’ personal incomes. This publication provides breakdowns to highlight the number of individuals with different sources of income and subject to certain reliefs.
In March 2022 HMRC published the annual Personal Income statistics for 2019 to 2020 which are based on the SPI. The data used in the SPI publication is different to the data used in this publication.
The SPI is a sample of around 800,000 individuals in either SA or PAYE. The SPI is designed to measure total income and the total tax impact on the Exchequer and therefore includes the tax impact of RAS payments to pension providers and Gift Aid payments to charities. It also measures liability and takes no account of some tax not being collected.
There is a further HMRC publication, ‘Income Tax Statistics and Distributions’, which provides projections for future tax years based on the SPI. The projections in that publication reflect announced changes to the Income Tax system and use determinants from the OBR to model tax liabilities in future years. The latest publication of this series was released in June 2022 and provides projections for tax years 2019 to 2020 to 2022 to 2023.
Income Tax Statistics and Distributions
The statistics presented in these two publications are not expected to be consistent with what is shown in this publication. This is due to sampling variation, the measurement differences described above and the fact that projections are a forecast of how tax liabilities may evolve for future years.
RTI: Earnings and Employment Statistics
Since April 2020 HMRC and the Office for National Statistics (ONS) have jointly released monthly statistics on earnings and employment statistics using data from PAYE RTI. The aim of this publication is to provide users with information on the number of individuals receiving pay from PAYE, their mean and median pay as paid through PAYE and the total amount of pay from PAYE in each country or region of the UK.
UK Real Time Information Experimental Statistics
The statistics in the RTI earnings and employment publication are different to the RTI statistics shown in Table 4 of this statistical release, although both are compiled from the same source of data.
The RTI publication presents information relating to employees only and excludes data on payments made to occupational pensioners while this publication includes tax collected from occupational pensions as well as employments
In addition, the RTI publication only presents statistics for number of employees and their pay. This release shows tax collected via PAYE, which may include collection of tax due on other income collected via the PAYE tax code. This can arise from savings or dividend income and other charges such as the HICBC.
Income Tax Receipts Publication
HMRC publish an annual National Statistics publication on Income Tax Receipts. The statistics presented in this publication show tax liabilities for specific tax years.
Income Tax Receipts Statistics
Liabilities are amounts of tax due on incomes arising in a given tax year, whereas receipts show amounts paid and collected in a given year. Due to lags in the Income Tax payment regimes, particularly for SA, liabilities and receipts for the same year can differ significantly.
Liabilities and receipts will also differ for other reasons, for example when over or underpayments occur which are repaid or recovered in a later year altering total receipts in that year in a way unrelated to tax liabilities for that year.
7. Outturn data methodology
The methodology set out in this section reflects the methodology for calculating the outturn which has been agreed between the SG and HMRC.
The final outturn figures reflect accrued revenue and have been calculated using actual liabilities data together with some estimation where actual data is unavailable. Details of this for each of the 6 components of the outturn figure is explained below.
Total NSND outturn =
- +SA Established liability
- +PAYE established liability
- +Estimated further liability
- -Adjustment for uncollectable amounts
- -Relief at Source (RAS) pension relief
- -Gift Aid
7.1 SA Established Liability
Income Tax liability is established for all individuals in SA once their SA return has been received and their tax calculation has been conducted.
This includes any individual who is required to file a SA return who also has an employment or occupational pension for which tax is deducted at source through PAYE.
The established liability for those who submit an SA return is calculated for each taxpayer identified in SA by summing the Income Tax due at each tax rate on NSND income and then reducing it by a share of reliefs.
Reliefs
Income Tax reliefs reduce the total amount of Income Tax an individual is liable to pay.
Some reliefs, such as relief for qualifying distributions and refinance relief for landlords, can only be claimed when an individual has a specific source of income. In calculating the SA established liability, such reliefs are prioritised to the appropriate stream of income before any excess is apportioned to other streams of income.
All other reliefs, such as marriage allowance, married couples’ allowance and relief for gift aid payments, can be claimed irrespective of what income sources an individual has. These ‘generic’ reliefs are applied proportionately to tax due on savings/dividend income and tax due on NSND income based on the level of gross Income Tax liability.
Other SA charges and CRCs
There are other charges which can be raised against an individual in SA through investigations/assessments or via a ‘Create Return Charge’ when an individual has failed to submit their return.
These additional charges, if known when data is being compiled, are also included when determining the SA established Income Tax liability.
The charge may include other tax liabilities (for example Capital Gains Tax). The share of the charge that relates to Income Tax is therefore estimated. This is based on the share of total liability relating to Income Tax for taxpayers who have submitted their return.
Scottish share
The total SA established Scottish liability is then calculated by summing the NSND liability, net of reliefs, across each Scottish taxpayer in SA.
Scottish taxpayers are defined by having a Scottish tax calculation in the SA system or being included in the Scottish NPS extract explained below.
The rUK established SA liability is calculated in a similar way but summing across all rUK taxpayers where rUK taxpayers are all taxpayers not included in the Scottish or Welsh NPS extracts.
Taxpayers who have indicated they were non-resident in their SA return will be counted as rUK taxpayers.
7.2 PAYE Established Liability
PAYE established liability includes:
- liabilities for individuals who are reconciled in PAYE
- PAYE settlement agreements
Individuals reconciled in PAYE
For individuals who are in PAYE but have not been issued with a notice to file in SA, their Income Tax liability is established when their PAYE account is reconciled.
Bespoke data extracts of all Scottish and rUK individuals in NPS for each tax year were commissioned specifically to assist in compiling the outturn figures.
This provided the liability for NSND income, net of reliefs, for all Scottish and rUK taxpayers by tax rate.
PAYE settlement agreements
The established PAYE amount includes a share of liabilities raised through PAYE Settlement Agreements (PSA).
A PSA allows an employer to make one annual payment to cover all the tax and NI due on minor, irregular or impracticable expenses or benefits for their employees.
The expenses and benefits reflected in the PSA are not recorded through payroll and are not required to be included on end of year P11D forms, in which other employment expenses and benefits are reported to HMRC.
The Scottish share is determined by using RTI data to determine the share of Income Tax withheld by employers through PAYE schemes which have a PSA. RTI data is also used to determine how the tax is distributed across tax bands for Scottish and rUK taxpayers.
7.3 Estimated further liability
In addition to the established liability the final outturn figure includes an estimate for:
- liabilities from late filed SA returns
- liabilities realised from compliance activity
- liabilities from unreconciled PAYE cases
Late filed SA returns
The value of late filed SA returns has been estimated for each tax year by examining historic SA data to determine the pattern of SA filing in the preceding five tax years. It is assumed that the average growth of liabilities for these years will be similar to how the liabilities will grow for the years presented in these statistics.
This is performed separately for Scottish and rUK taxpayers. Taxpayers with a Scottish postcode were used as a proxy for Scottish taxpayers in these years, as no Scottish indicator exists before SIT was introduced.
This is performed at a total level and a tax band level. The estimated value of late filed SA returns at each tax band is then scaled to the total estimated value.
Liabilities from compliance activity
Included in the estimated further liability is an amount to reflect Contract Settlement Agreements which are raised as part of compliance investigations. The Scottish and rUK NSND share (as well as the split between tax bands) of this is assumed to be the same proportion as observed in the SA established liability.
As many Contract Settlement Agreements will be raised in the tax years following the outturn, this amount is estimated. The estimate is forecast based on the total value of Contract Settlement Agreements in previous tax years and OBR’s forecast of future SA Income Tax.
For the 2020 to 2021 outturn, the forecast was slightly adjusted to take into account below average Contract Settlement Agreement receipts in the 2021 to 2022 tax year caused by COVID-19.
Liabilities from unreconciled PAYE cases
Almost all PAYE cases are reconciled within 12 months of the end of the tax year. However, complex tax affairs or operational changes means that HMRC occasionally delays some customers’ end of year reconciliations to prevent them receiving an incorrect tax calculation or accounting update.
The Income Tax liabilities for these unreconciled cases has been estimated by using data from RTI.
7.4 Adjustment for uncollectable amounts
Uncollected SA amounts
An initial amount of uncollected debt for the current outturn year is calculated by using current SA data.
The proportion of this debt that will be collected in the future is estimated by using the same historic SA data over the previous five tax years used to establish the late filed SA returns for the ‘Estimated further liability’. The average growth in the collection rate of SA liabilities observed in this historic data is applied to the initial amount of uncollected debt in the current outturn year. This is completed separately for Scottish and rUK taxpayers to calculate specific uncollected amounts for each.
This is performed at a total level and a tax band level. The estimated value of uncollected amounts at each tax band is then scaled to the total estimated uncollected amount.
Uncollected PAYE amounts
Not all tax due is collected by HMRC and some is subsequently remitted or written off when it cannot be recovered.
This component reflects the amount written off from PAYE employers when they have failed to pay all the Income Tax they were expected to.
The uncollected amount is based on HMRC PAYE Income Tax write-offs/remissions data. The data is used to calculate the value of write-offs/remissions that have already taken place for the outturn year and to forecast the value of future write-offs/remissions. These are combined to give an estimate of how much PAYE Income Tax (at a UK level) is expected to be remitted or written off in total for the outturn year. RTI PAYE data is then analysed for each PAYE scheme with a write-off/remission to calculate what proportion of total tax collected by these schemes is in respect of Scottish taxpayers.
RTI data is also used to determine how the tax is distributed across tax bands for Scottish and rUK taxpayers.
For the 2020 to 2021 outturn, a slight adjustment to the methodology was applied to estimate these uncollected amounts to account for the impact COVID-19 may have on the profile of write-offs related to the 2019 to 2020 and 2020 to 2021 tax years.
The total proportion of uncollected PAYE NSND Income Tax was assumed to be in-line with the amounts observed in pre-COVID outturn figures.
7.5 Relief at Source (RAS) pension relief
When an individual pays into a pension scheme, the scheme treats this as being received net of basic rate tax and reclaims that basic rate tax relief back from HMRC to add to the member’s pension pot.
This adjustment in the outturn calculation reflects the basic rate tax being passed to the pension provider and no longer held as Income Tax by the exchequer.
The RAS for pension contributions is calculated by using information from annual returns made by pension schemes which show the amount of gross contributions made by scheme members in the appropriate tax year.
The proportion relating to Scottish taxpayers is calculated by identifying individual contributions made by scheme members who have a Scottish postcode held on the pension contribution data.
7.6 Gift Aid
When a taxpayer makes a charitable donation, the charity can claim basic rate tax relief from HMRC on the value of the donation.
This adjustment in the outturn calculation reflects the basic rate tax being passed to the charity and no longer held as Income Tax by the exchequer.
Charities can back date claims for this basic rate tax by up to four years. Therefore, the value which will ultimately relate to a specific tax year has been estimated using previous years data.
The Scottish share has been estimated as an average of Scotland’s share of the UK population and Scotland’s share of total UK Income as measured by the SPI. Scottish cases were identified based on postcode as the Scottish indicator did not exist before SIT was introduced.
7.7 HMRC RTI for PAYE methodology
The estimates in Table 4 have been sourced from data held on HMRC’s PAYE RTI administrative system. The RTI administrative system covers all individuals who have a live employment or occupational pension open on a PAYE Scheme.
Most people pay Income Tax through PAYE. This is the system that employers or pension providers use to take Income Tax and National Insurance contributions before they pay an employee’s wages or pension. An employee’s tax code tells the employer how much Income Tax to deduct.
Under RTI, employers are required to send HMRC information about tax and other deductions made through the PAYE system every time an employee is paid. Since April 2014, all employers have been required to report in real time through RTI. This provides HMRC with a very rich source of data, which can be used to better inform public understanding of the labour market.
Individuals who pay tax through the SA system are included in these statistics if they are also employed and paid via PAYE. Individuals with more complex financial affairs (for example the self-employed or those who have a high income) may also pay or be refunded Income Tax and NI through SA. Individuals in SA who are not in the PAYE system will not be included in these statistics.
Production of in-year monitoring of Scottish Income Tax withheld in RTI, provided in Table 4 of this publication, has the following caveats:
- the sum of these figures will not equate to the final outturn and are only intended to be an indication of part of the outturn (from employments covered by PAYE)
- RTI data does not include all income reported through Self Assessment such as profits from self-employment or income from property and thus only provides a partial picture of NSND Income Tax liabilities in Scotland.
- Income Tax due on other sources of income such as savings interest may be collected through PAYE using a process known as coding out. This process is also used to collect amounts due for some non-Income Tax charges, such as the HICBC. Coded out tax amounts are included in RTI data and therefore appear in these figures
- RTI data in-year is subject to amendments throughout the year, and any end-of-year updates that may occur are not included
- these figures are pre-reconciliation and provisional
- the NPS flag is taken as a snapshot in time and this means that as taxpayers change residential address during the year, their status and therefore the figures may change
7.8 Revision in relation to non-resident taxpayers
In 2021, inconsistencies in the regional classification of a small number of SA taxpayers were discovered in HMRC’s NPS and SA systems.
These taxpayers had Welsh/Scottish residency flags in HMRC’s NPS records and were thus identified as Welsh/Scottish taxpayers for the purpose of the Outturn.
However, the flag indicator variable in HMRC’s SA database for these taxpayers showed as rUK. An examination of tax returns for a sample of these individuals was conducted and it was discovered that these taxpayers were non-resident for tax purposes.
It is not possible to be a WRIT or SIT taxpayer while being non-resident so the NSND Income Tax revenue generated from these non-resident taxpayers should have been allocated to rUK.
The process of producing the outturn figures has been revised for the 2020 to 2021 outturn. The figures from previous outturn years have also been revised accordingly in this statistical release.
Overall, this leads to an average yearly reduction of SIT outturn of £8.9 million (-0.08%) over the period 2016 to 2017 to 2019 to 2020, for WRIT this represents a one-time reduction of £1.5 million (-0.07%) in 2019-20.
Through further analysis, we have accounted for these adjustments in the Income Tax paid through Self Assessment and PAYE (Table 3) and the by band breakdown of NSND Income Tax (Table 2).