NTS 2025: Mode share and multi-modal trips
Updated 11 September 2026
Applies to England

© Crown copyright 2026
This publication is licensed under the terms of the Open Government Licence v3.0 except where otherwise stated. To view this licence, visit nationalarchives.gov.uk/doc/open-government-licence/version/3 or write to the Information Policy Team, The National Archives, Kew, London TW9 4DU, or email: psi@nationalarchives.gov.uk.
Where we have identified any third party copyright information you will need to obtain permission from the copyright holders concerned.
This publication is available at https://www.gov.uk/government/statistics/national-travel-survey-2025/nts-2025-mode-share-and-multi-modal-trips
The introduction of the digital travel diary in 2025 appears to be associated with a lower rate of recording for certain types of trips. The most notable impacts are observed in walking and car driver and passenger trips, and falls in these modes are driving the overall decline in trip rates observed in 2025. There is no observable disruption to the rate of recording of multi-modal trips. Users are advised to interpret changes in trip rates by mode between 2024 and 2025 with this in mind.
Further details of work to understand the impact of the digital diary can be found in the quality report and technical report for 2025.
Main findings
- In 2025, 31% of trips were made by active travel[footnote 1], 59% by private transport[footnote 2] and 10% by public transport[footnote 3], similar to 2024.
- Around 24% of trips were under 1 mile, and 70% under 5 miles.
- Nearly all walks recorded were under 5 miles (99.7%) and for trips over a mile the car was the most frequent mode of travel.
- Children aged 0 to 16 made the highest proportion of trips using active transport modes such as walking and cycling (37%).
- The majority of trips (93%) used a single mode of transport and 7% of trips were multi-modal (involving more than one transport mode) in 2025.
- Around 56% of trips which used more than one mode (multi-modal trips) started with walking.
- People living in higher income households tend to travel more than people living in lower income households.
- Households within the lowest income quintile made the most public transport trips (105 trips per person).
- Private car was the most frequently used mode of transport with 82% of people reported to have used it at least once a week.
- Walking had the highest level of satisfaction in 2025, with around 70% of people reporting that they were satisfied with provision.
Mode share for public, private and active travel modes
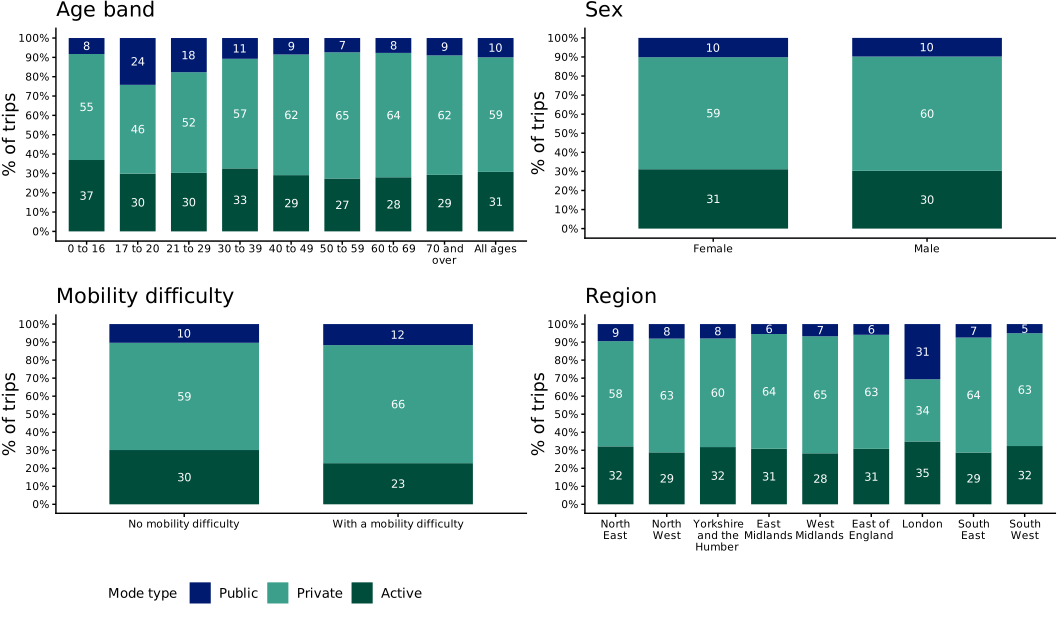
Chart 2.1: Public, private and active mode share by age band, sex, mobility difficulty and region of residence: England, 2025 (NTS0601), (NTS0709) and (NTS0318)
Age band
- Children aged 0 to 16 made the highest proportion of trips using active transport modes such as walking and cycling in 2025 with 37%.
- People aged 30 to 39 made the second highest proportion of trips using active transport modes (33%).
- The proportions of trips by active, private and public transport modes were similar across all age bands for people aged 40 and over.
- Those aged 17 to 20 made the smallest proportion of their trips using private transport modes with 46%, however, this age group made the highest proportion of their trips using public transport modes with 24%.
Sex
- The mode share between active, private and public transport modes was similar for males and females.
Mobility difficulty
- People with no mobility difficulties made a higher proportion of their trips using active transport modes (30%), compared with 23% for people with a mobility difficulty.
- Those with no mobility difficulties made a smaller proportion of their trips using private transport modes (59%), compared with 66% for those with a mobility difficulty.
- Those without a mobility difficulty made 10% of their trips using public transport modes, a similar proportion to those with a mobility difficulty (12%).
Region
- People living in London made the highest proportion of trips using active transport modes with 35%, and public transport modes with 31%.
- Residents of the North East made the second highest proportion of their trips using public transport modes with 9%.
- Residents of the West Midlands made the highest proportion of their trips using private transport modes (65%).
Mode share by trip length
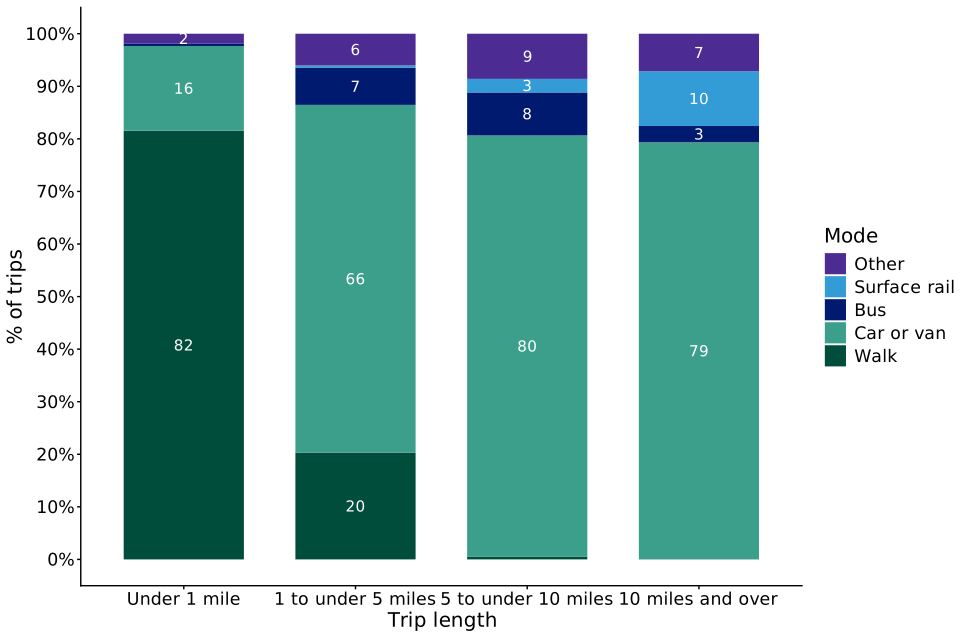
Chart 2.2: Mode share of trips by main mode[footnote 4] for different trip lengths: England, 2025 (NTS0308)
Short trips
- Most trips are relatively short. In 2025, 24% of trips were under 1 mile, and 70% under 5 miles.
- Walking was the most frequent mode used for short trips. For trips under a mile, 82% were completed by walking. Nearly all walks recorded in the NTS were under 5 miles in 2025 (99.7%).
Longer trips
- For trips over a mile, the car was the most frequent mode of travel.
- Around three-quarters (74%) of rail trips were 10 miles and over in 2025.
- Most (88%) bus trips were between 1 and 10 miles.
Multi-modal trips
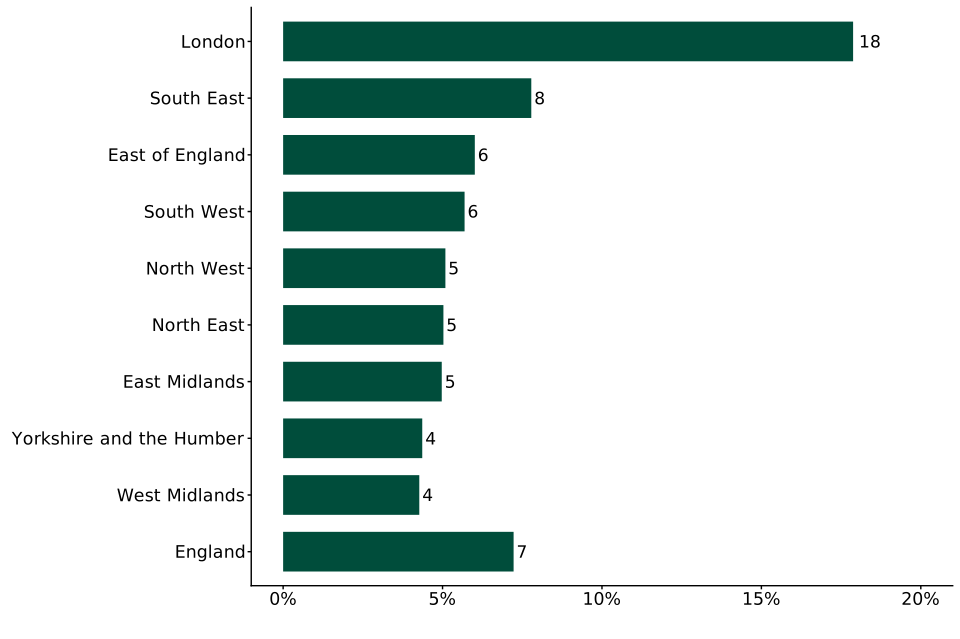
Chart 2.3: Percentage of trips recorded on day 1 of the travel diary using more than one transport mode by region of residence: England, 2025 (ad hoc analyses) NTSQ09079
Multi-modal trips by region of residence
- Around 7% of trips by England residents were multi-modal (involving more than one transport mode) in 2025, 7% of trips were multi-modal in 2024.
- The proportion of trips using more than one transport mode (multi-modal trips) varies by region of residence. This ranges from 4% by residents in the West Midlands to 18% by residents in London.
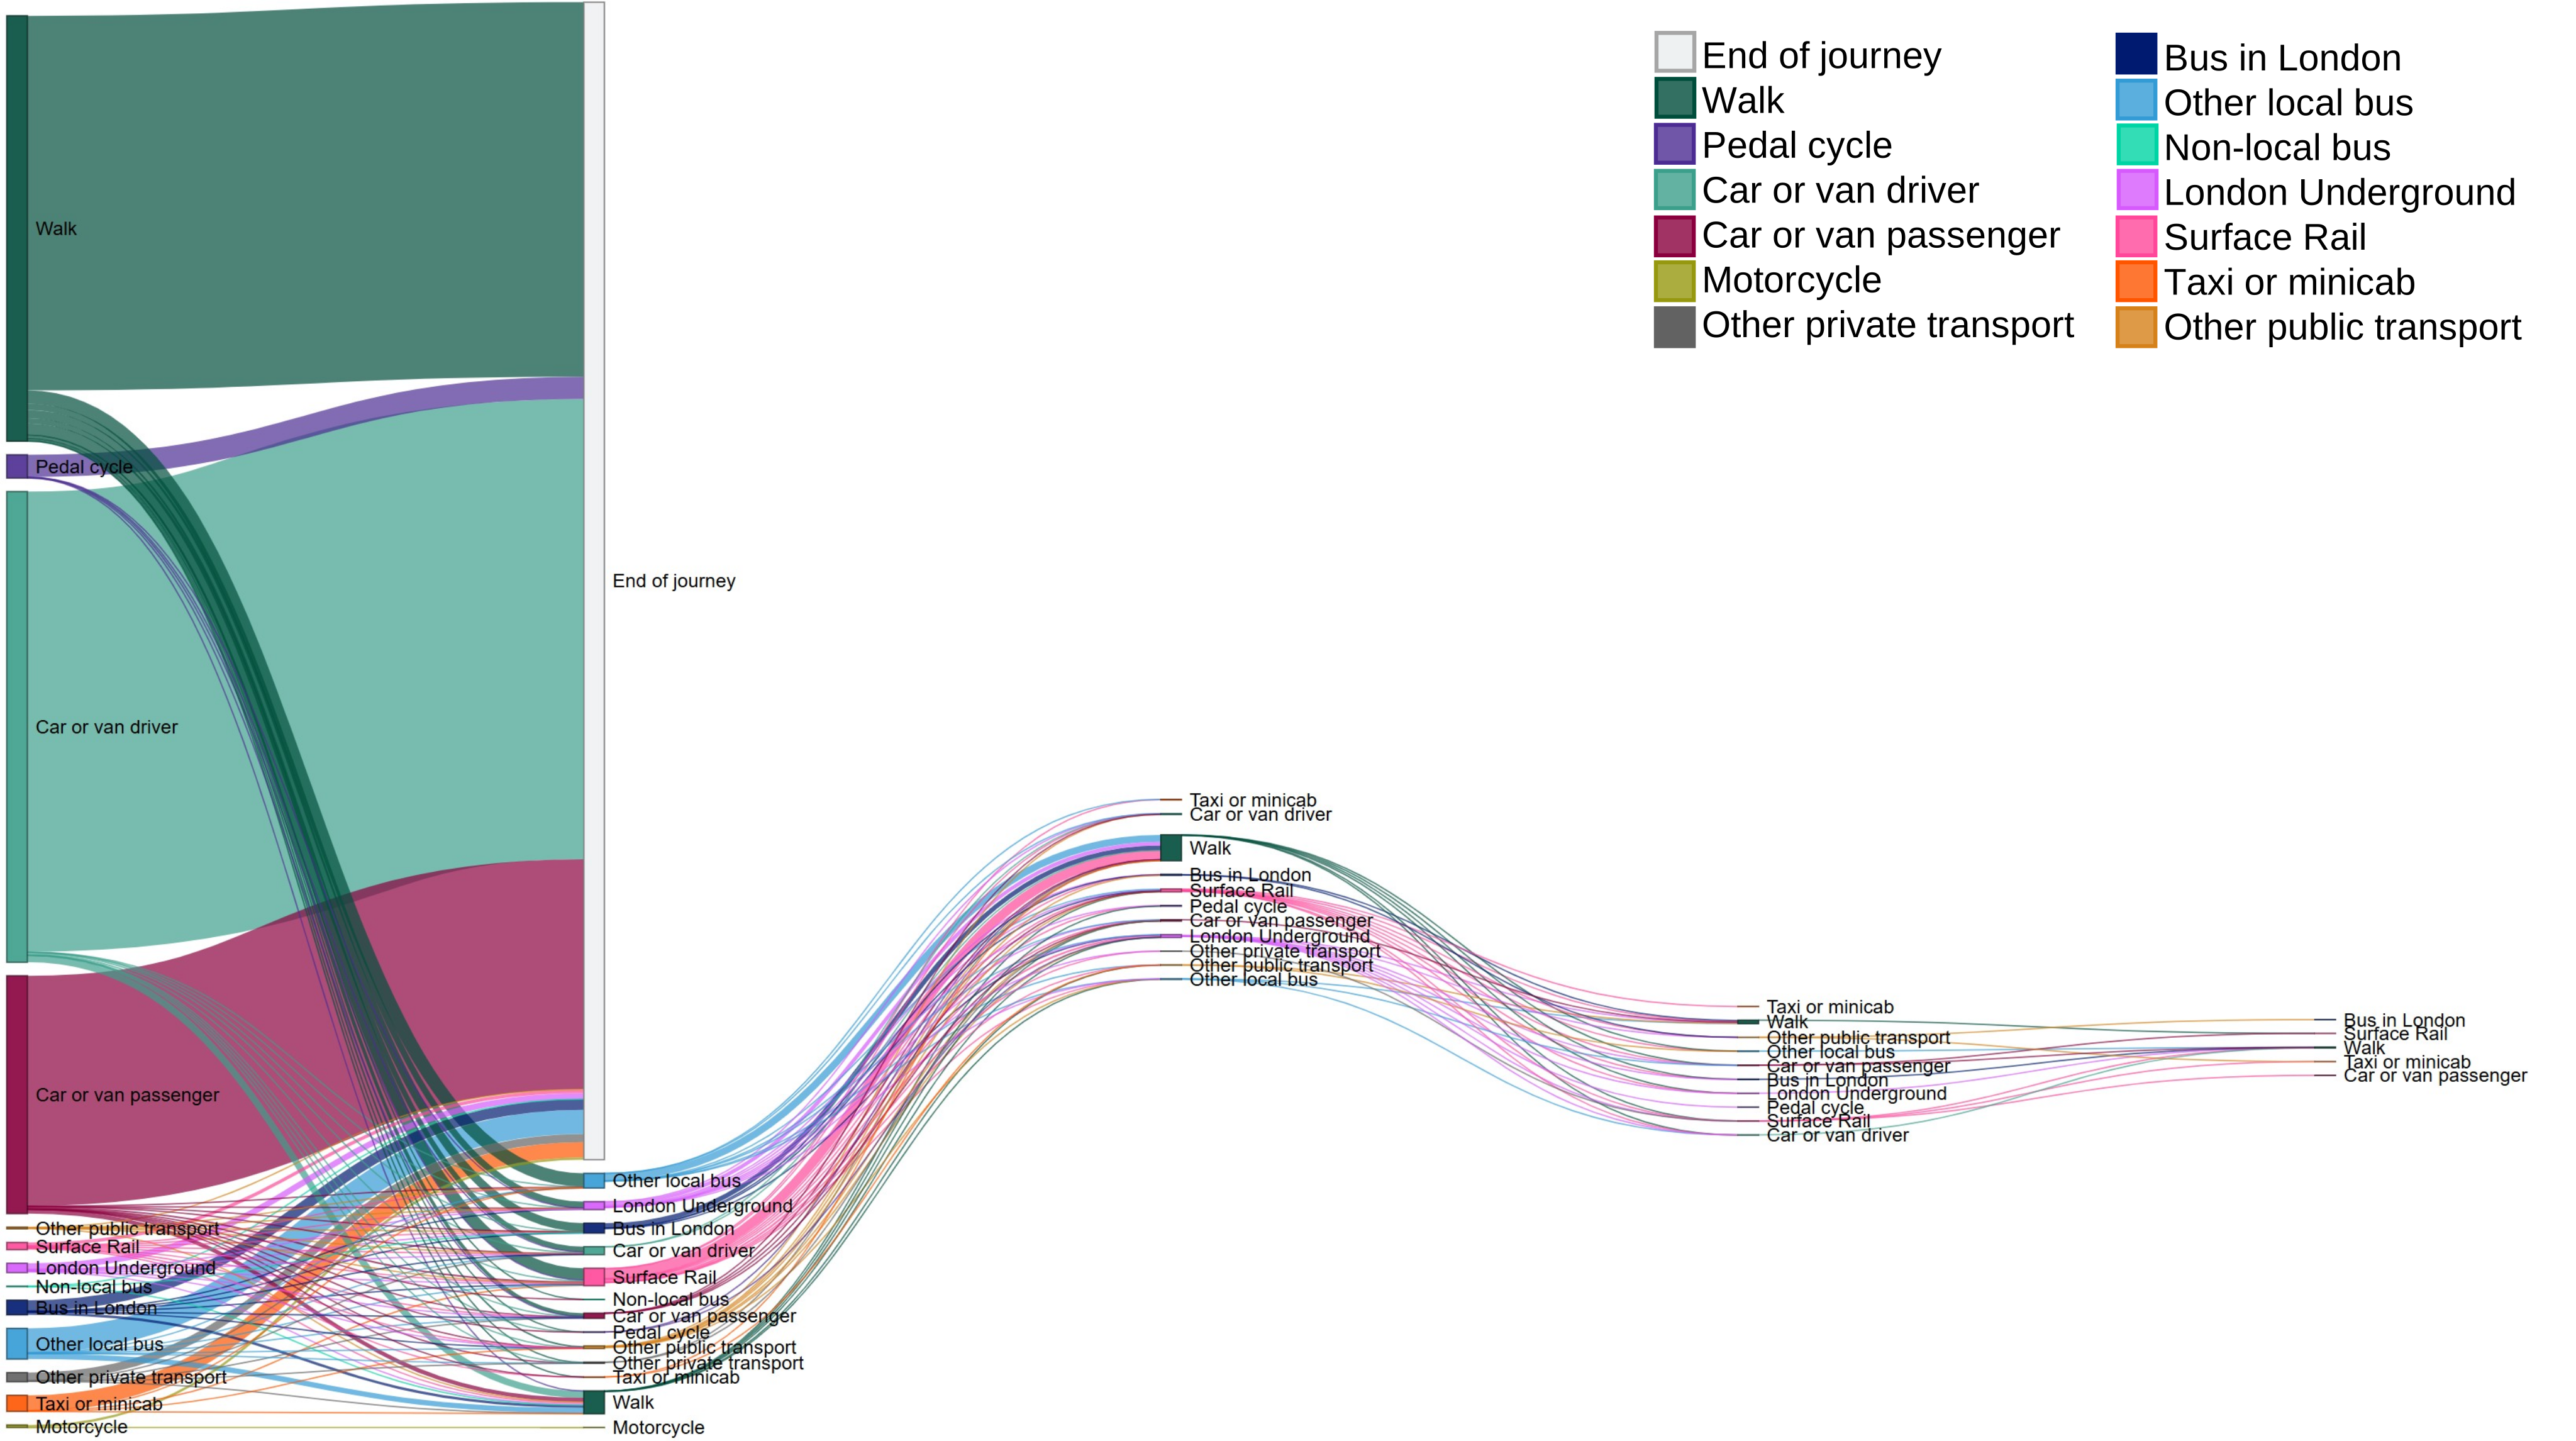
The below chart shows the modes used within trips by England residents. Most trips have only one stage and therefore used a single mode. The chart shows the various combinations of modes for trips where more than one mode is used, as well as trips where a single mode is used. The most complex trips recorded in this data had seven stages. Less than 0.01% of trips had 6 or more stages and these have been trimmed from the below charts for simplicity. Each column represents a stage, and the thickness of lines is proportional to the number of trips.
Chart 2.4: Flow of travel by mode for trips recorded on day 1 of the travel diary: England, 2025 (ad hoc analyses) NTSQ09079
Flow of trips between modes of transport
This analysis is based on data from the first day of the travel diary as this is the only day on which walks of under a mile are recorded. No walks of under 50 yards are recorded.
The Department has recently published a separate factsheet on the topic of trip chaining using NTS data. This analysis looks at how people link trips for different purposes together into a single chain. This approach helps reveal the complexity of daily routines and how people combine activities within their travel. More information here: Trip chaining: 2024.
- The majority of trips (93%) in 2025 used a single mode of transport.
- For all trips in 2025, car driver was the most frequent mode to begin a trip, with 38%, followed by walk (34%) and car passenger (19%).
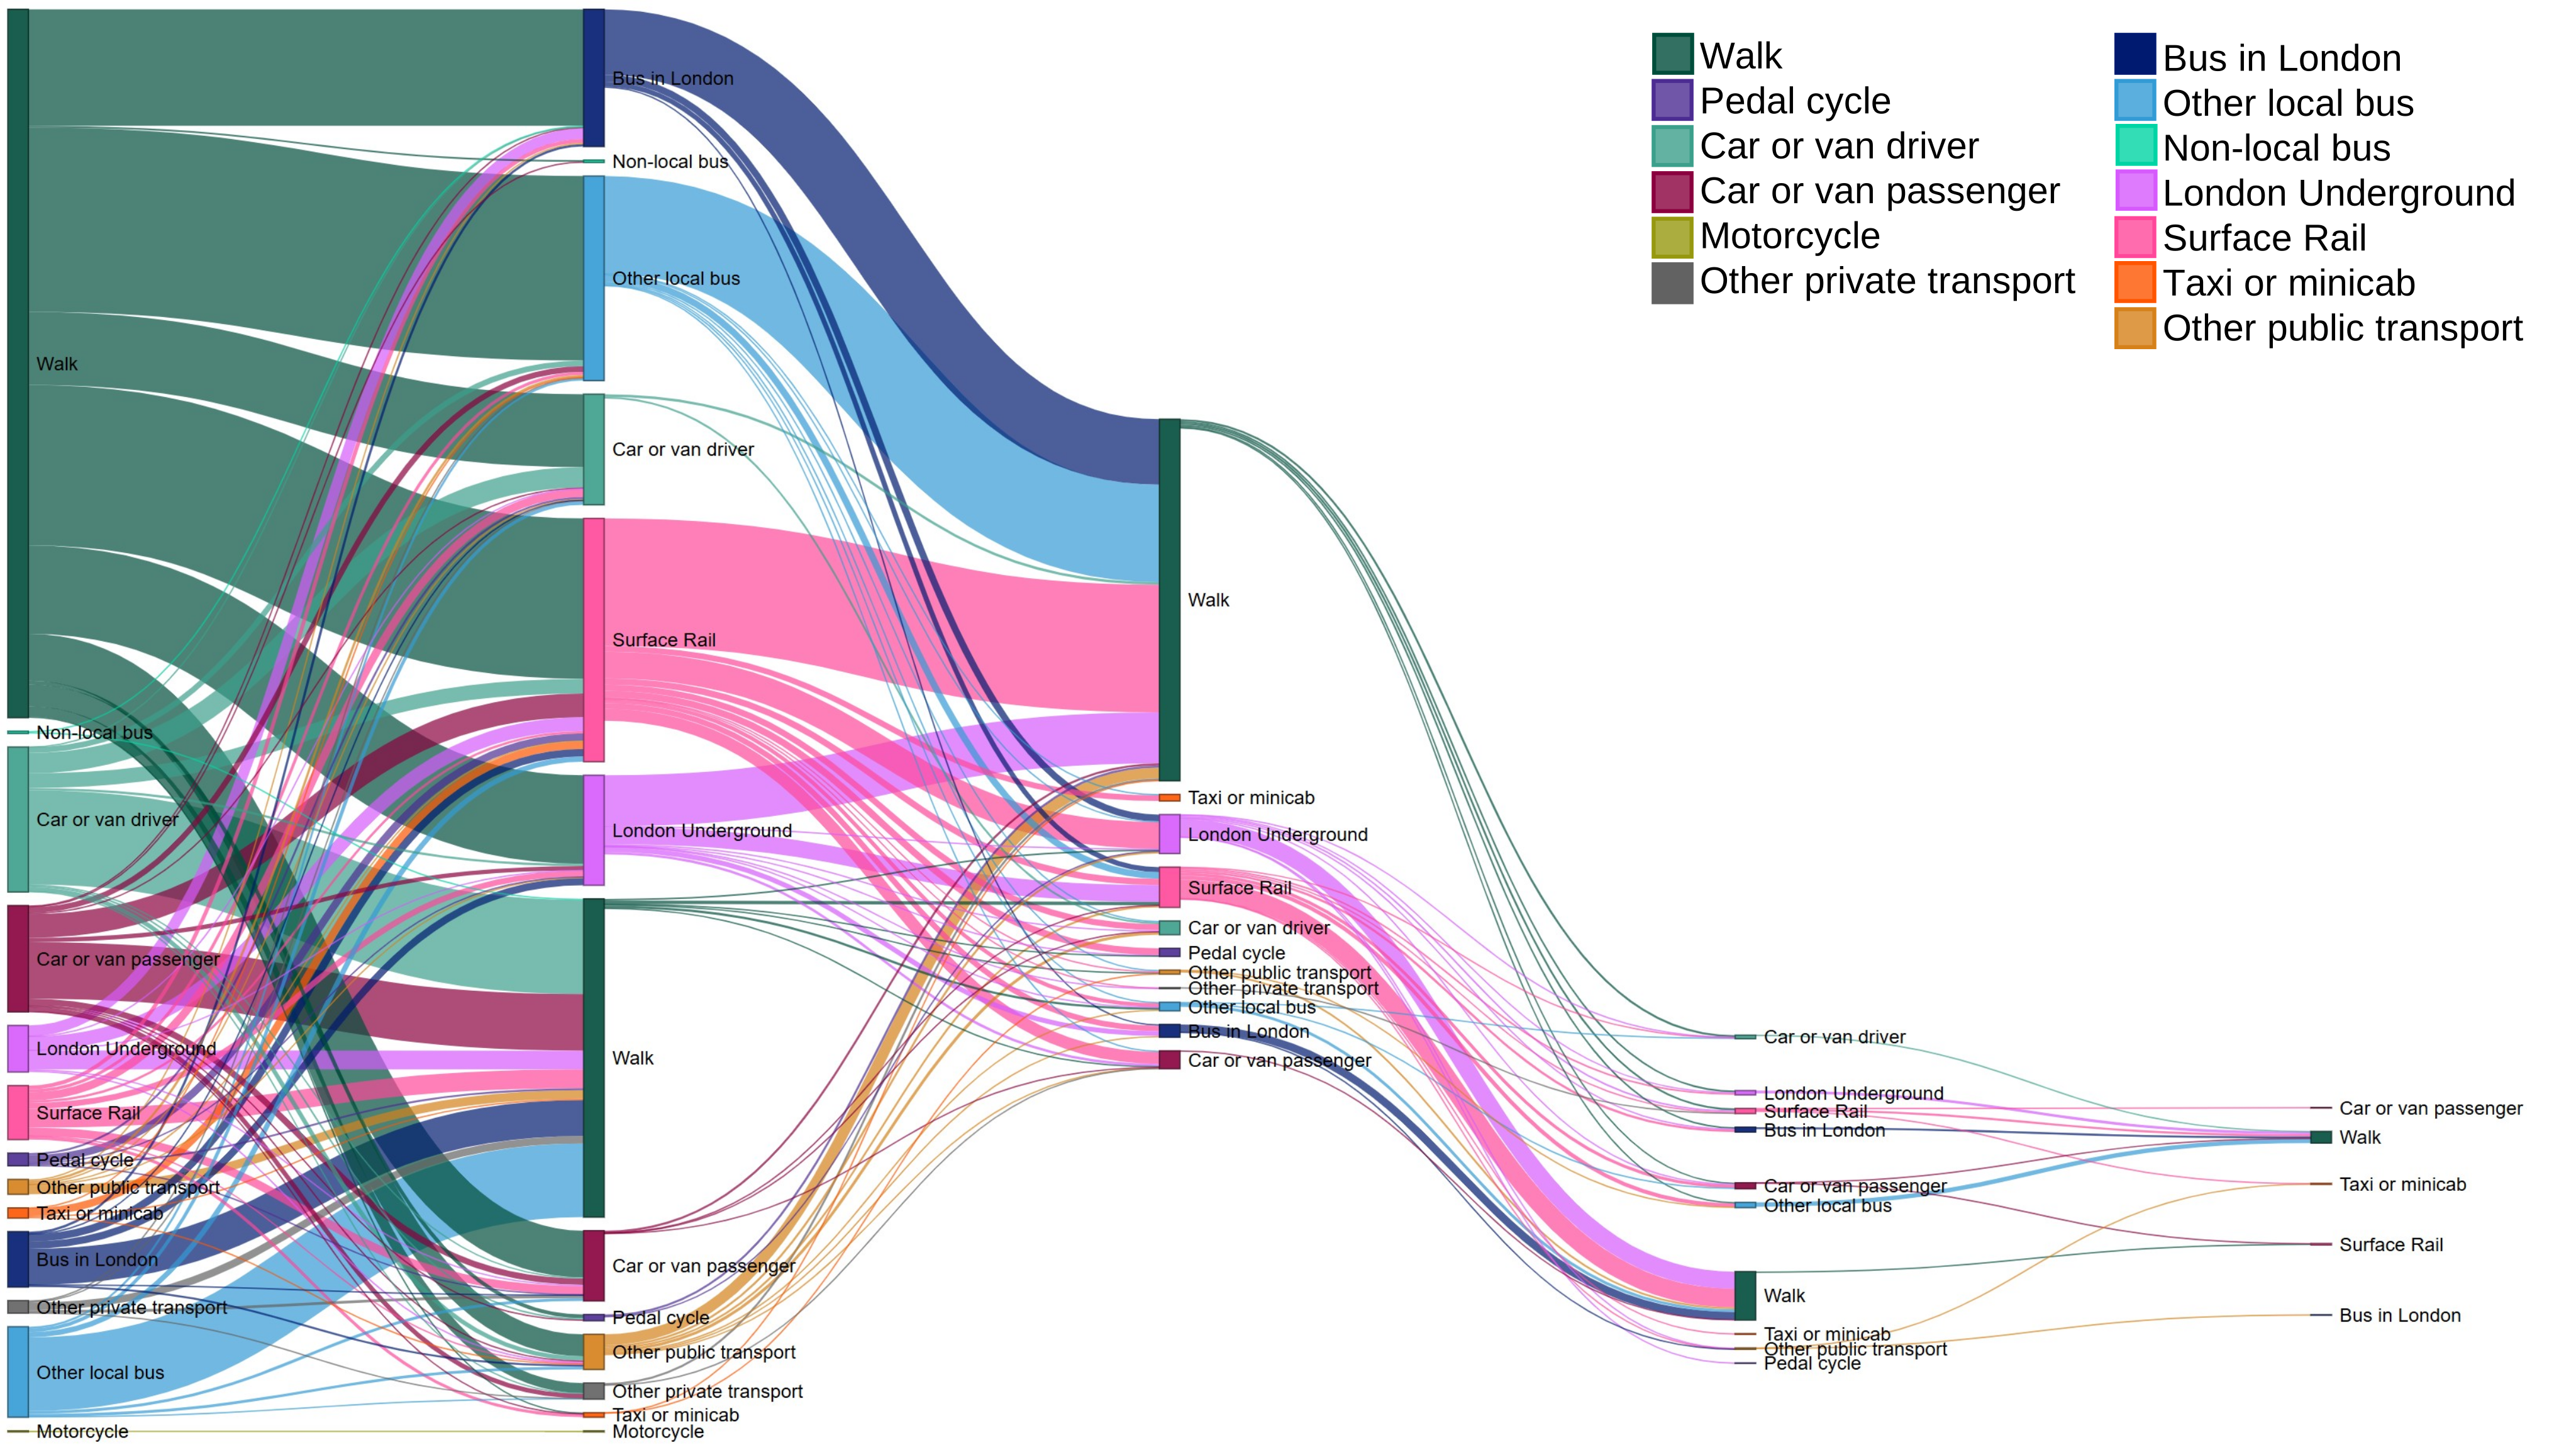
The following chart includes only the 7% of trips which were multi-modal, showing the various combinations of modes used within each trip.
Chart 2.5: Flow of travel by mode for multi-modal trips recorded on day 1 of the travel diary: England, 2025 (ad hoc analyses) NTSQ09079
Multi-modal trips
- Over half of trips using more than one mode started with walking (56%). Of these trips, public transport modes were used most often as the second mode in the trip, with other local bus being the most common (15% of multi-modal trips), followed by surface rail (13% of multi-modal trips), bus in London (9%) and London Underground (7%). Around 24% of multi-modal trips then continued with further walking.
- Around 20% of multi-modal trips began with a car (as a driver or passenger), and the majority of these trips continued with walking (12%) or surface rail (3%).
Mode share by household income quintile
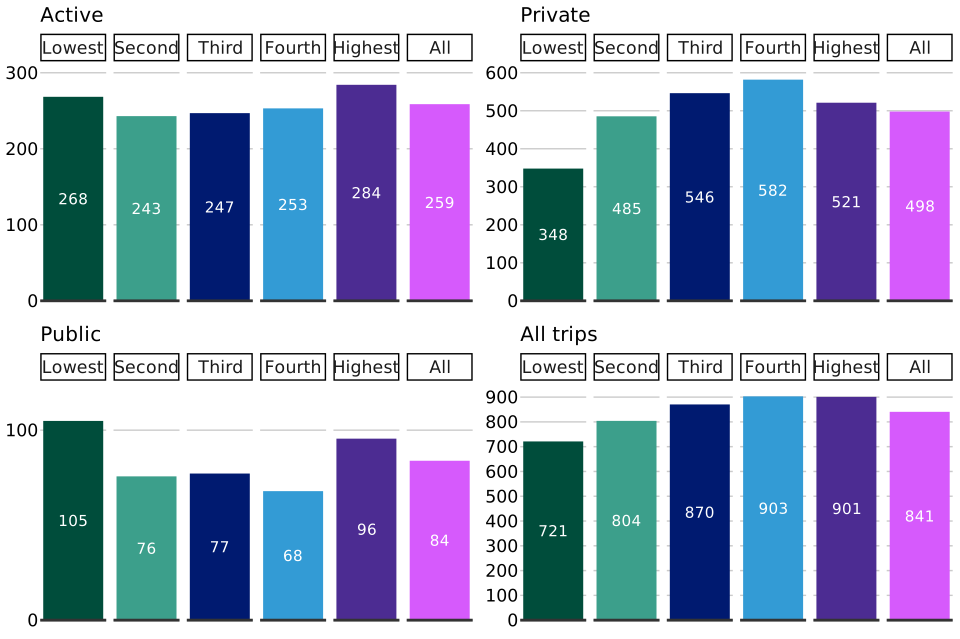
Chart 2.6: Average active, private, public and all trips by household income quintile: England, 2025 (NTS0705)
Household income quintile
Income quintiles are created by dividing all households into five groups of equal size according to their level of real household income equivalent (accounting for inflation and household composition).
All trips
- In 2025, people living in higher income households travelled more than people living in lower income households.
- Households within the second highest income quintile made the most trips on average (903 trips per person), closely followed by households within the highest income quintile (901 trips per person).
- Households within the lowest income quintile made the fewest trips on average with 721 trips per person.
Active travel
- Households within the highest income quintile made the most active travel[footnote 1] trips on average in 2025 with 284 trips per person, followed by households within the lowest income quintile (268 trips per person).
- People living in households within the second level income quintile made the fewest active transport trips on average with 243 trips per person.
Private transport
- Households within the second highest income quintile made the most private transport[footnote 2] trips with 582 trips per person.
- Households within the lowest income quintile made the least private transport trips (348 trips per person).
Public transport
- Households within the lowest income quintile made the most public transport[footnote 3] trips, with 105 trips per person in 2025, with greater use of local buses compared to households within all other income quintiles.
- Households within the highest income quintile made the second most public transport trips with 96 trips per person in 2025, with greater use of rail and London Underground (within and outside London) compared to households within all other income quintiles.
Frequency of mode use
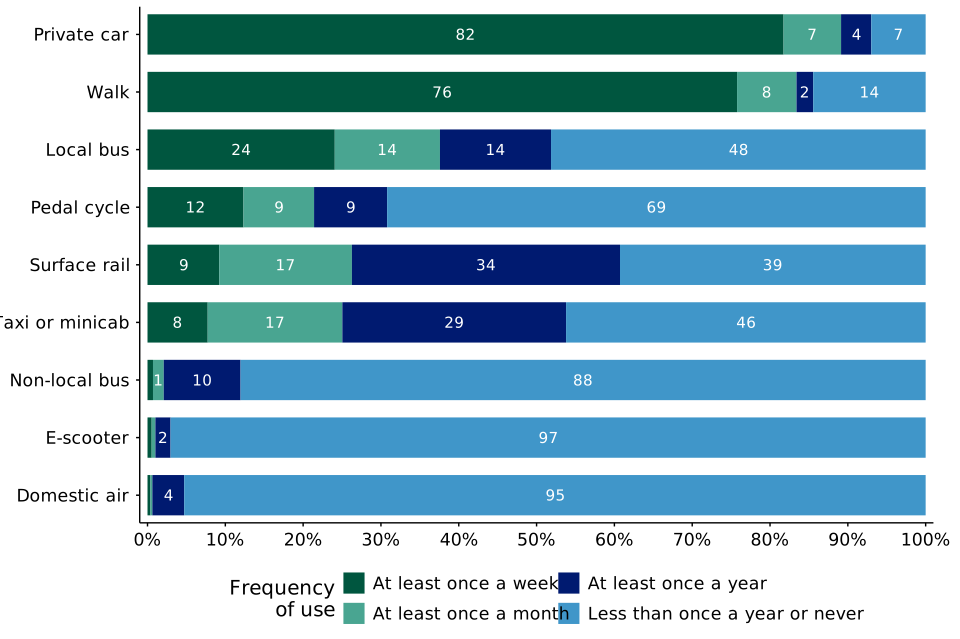
Chart 2.7: Frequency of use of different transport modes: England, 2025 (NTS0312), (NTS0313)
Frequency of use of different transport modes
- In 2025 private car was the most frequently used mode of transport with 82% of people reported to have used it at least once a week, followed by walks of 20 minutes or more with 76%.
- Just over a half (52%) of people reported using a local bus at least once a year.
- Surface rail and taxi or minicab had the highest proportions of people reporting that they used these modes at least once a year but less than once a week, with 52% and 46% respectively.
- E-scooter was among the least frequently used modes of transport with 97% of people reported to have used it less than once a year or never, closely followed by domestic air travel (95%).
- Private car had the lowest proportion of people reporting that they used the mode less than once a year or never (7%).
Satisfaction with transport provision
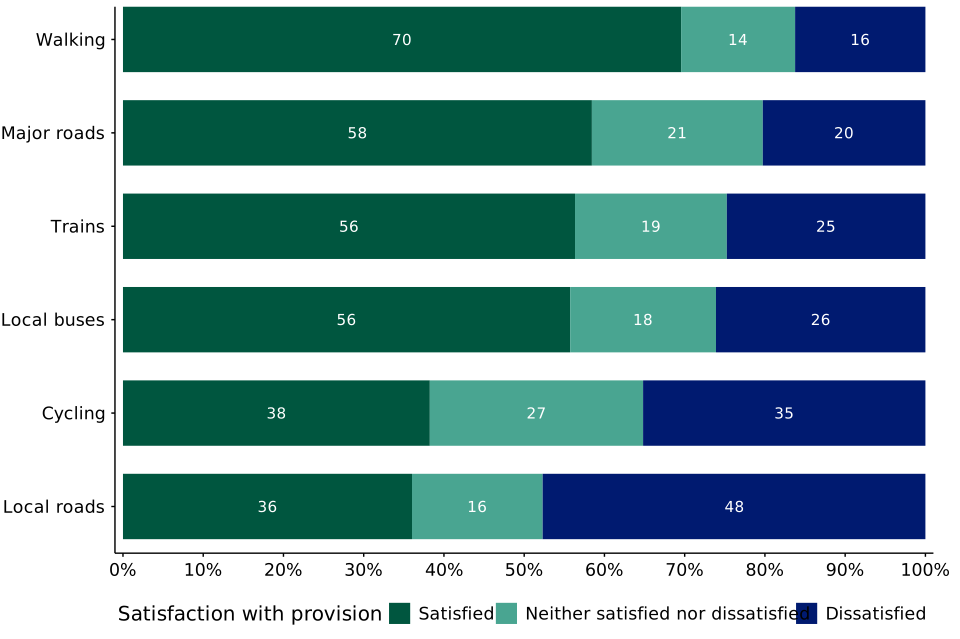
Chart 2.8: Satisfaction with overall provision across modes: England, 2025 (NTS0802)
Overall satisfaction by mode
- Walking had the highest level of satisfaction with provision in 2025, with around 70% of people reporting that they were satisfied and 16% dissatisfied.
- The proportions of people satisfied and dissatisfied with the provision of trains and local buses were similar.
- Satisfaction with the provision for cycling (38%) was lower than for both trains and local buses (56% each).
- Local roads had the lowest proportion of satisfied people (36%) and the highest proportion of dissatisfied people (48%). In contrast, 58% of people were satisfied with the provision for major roads.
NTS modernisation – we want your feedback
From autumn 2026, the NTS is launching a modernisation programme, which aims to review the survey’s methodology, data collection and outputs. The intention is to make the survey more flexible and scalable, reduce burden on respondents, and utilise modern technologies where appropriate.
The first stages involve capturing the views of our users and stakeholders on their use of, and need for, NTS data and statistics. We are contacting a number of known stakeholders directly, however we are keen to gather views from as wide a range of users as possible.
We want to ensure that the survey meets the needs of users, and any feedback provided will help inform the future design and development of the survey. If you have any feedback or wish to discuss this with the team, please email National Travel Survey statistics.
Background information
The 2025 National Travel Survey (NTS) is the latest in a series of household surveys of personal travel by residents of England travelling within Great Britain, from data collected via interviews and a 7 -day travel diary. The NTS is part of a continuous survey that began in 1988, following ad-hoc surveys from the 1960s, which enables analysis of patterns and trends.
Some key uses of the data include describing patterns, for example how different groups of people travel, monitoring trends in travel, including sustainable modes; assessing the potential equality impacts of different groups; and contributing to the evaluation of policies.
These official statistics were independently reviewed by the Office for Statistics Regulation in September 2018. They comply with the standards of trustworthiness, quality and value in the Code of Practice for Statistics and are labelled ‘Accredited Official Statistics’.
Further information is available, including:
Instructions for printing and saving
Depending on which browser you use and the type of device you use (such as a mobile or laptop) these instructions may vary.
You will find your print and save options in your browser’s menu. You may also have other options available on your device. Tablets and mobile device instructions will be specific to the make and model of the device.
How to search
Select Ctrl and F on a Windows laptop or Command and F on a Mac.
This will open a search box in the top right-hand corner of the page. Type the word you are looking for in the search bar and press enter.
Your browser will highlight the word, usually in yellow, wherever it appears on the page. Press enter to move to the next place it appears.
Contact details
National Travel Survey statistics
To hear more about DfT statistical publications as they are released, follow us on X at DfTstats.
-
Active travel refers to journeys where walking or cycling is the main mode of transport. ↩ ↩2
-
Private transport refers to journeys where car, motorcycle or other private transport mode is the main mode of transport. ↩ ↩2
-
Public transport refers to journeys where bus in London, other local bus, non-local bus, London Underground, surface rail, taxi or minicab and other public transport mode is the main mode of transport. ↩ ↩2
-
In this chart, other includes pedal cycle, motorcycle, other private transport, non-local bus, London Underground, taxi or minicab and other public transport. ↩