NTS 2025: Active travel
Updated 11 September 2026
Applies to England

© Crown copyright 2026
This publication is licensed under the terms of the Open Government Licence v3.0 except where otherwise stated. To view this licence, visit nationalarchives.gov.uk/doc/open-government-licence/version/3 or write to the Information Policy Team, The National Archives, Kew, London TW9 4DU, or email: psi@nationalarchives.gov.uk.
Where we have identified any third party copyright information you will need to obtain permission from the copyright holders concerned.
This publication is available at https://www.gov.uk/government/statistics/national-travel-survey-2025/nts-2025-active-travel
The introduction of the digital travel diary in 2025 appears to be associated with a lower rate of recording for certain types of trips. Within active modes, the largest impact appears to be in the recording of walks of less than a mile, whereas rates of recording of walks of a mile or more and pedal cycling appear less affected as trip rates are similar to the previous year. Users are advised to interpret changes in trip rates between 2024 and 2025 with this in mind.
Further details of work to understand the impact of the digital diary can be found in the quality report and technical report for 2025.
Main findings
- In 2025, there were 15 cycling trips per person and 16 cycling stages per person which was similar to the previous year.
- In 2025, people cycled an average of 57 miles per person, which was an increase of 8% compared to the previous year.
- The most common purpose for a cycling trip was for leisure with 35% of all cycling trips in 2025.
- Males of all ages made substantially more cycling trips on average and also cycled a longer distance than females.
- Walking trips made up 29% of trips, 33% of stages and 4% of distance travelled, on average in 2025.
- In 2025, there were 243 walking trips per person, a decrease of 9% compared to the previous year, and 310 walking stages per person, a decrease of 9% compared to the previous year.
- Walking distance travelled decreased by 6% to 215 miles per person in 2025.
- Females of all ages apart from those aged 70 and over made more walking trips on average than males.
- The most common purpose for walking trips in 2025 was just walk (33%).
- In 2025, 38% of males and 33% of females report that the top reason for not walking more was that they walk enough already.
Trends in cycling trips
Chart 5.1: Average cycling trips, stages and miles travelled, per person per year: England, 2002 to 2025 (NTS0303)

Cycling trips, stages and distance travelled
- Cycling made up 2% of trips, 2% of stages and 1% of distance travelled, on average, in 2025.
- Cycling trip rates remained broadly similar between 2002 and 2025, with a slight increase shown in 2020. The relatively small number of cycling trips in the sample means that this series can be volatile, but it has remained between 14 and 20 trips per person per year since 2002.
- In 2025, there were 15 cycling trips per person, similar to the previous year. There were 16 cycling trips per person in 2019.
- In 2025, there were 16 cycling stages per person, similar to the previous year. There were 17 cycling stages per person in 2019.
- There was a general upward trend in average cycling miles travelled from 2002 to 2019 followed by a sharp increase in 2020, which then fell back to pre-pandemic levels by 2023 and has since increased.
- In 2025 there were 57 cycling miles per person travelled which was an increase of 8% compared to the previous year (53 miles per person) and an increase of 5% compared to 2019 (54 miles per person).
- Traffic statistics[footnote 1] published by the department show that there were 3.7 billion vehicle miles travelled by cycling in 2025, an increase of 4% compared to 2024 but similar to 2019.
- The National Travel Attitudes Study wave 9 statistical release contains more information on attitudes towards the ownership and use of pedal cycles, the use of rental pedal cycle services and e-cycles, as well as barriers and encouragements to the use of pedal cycles.
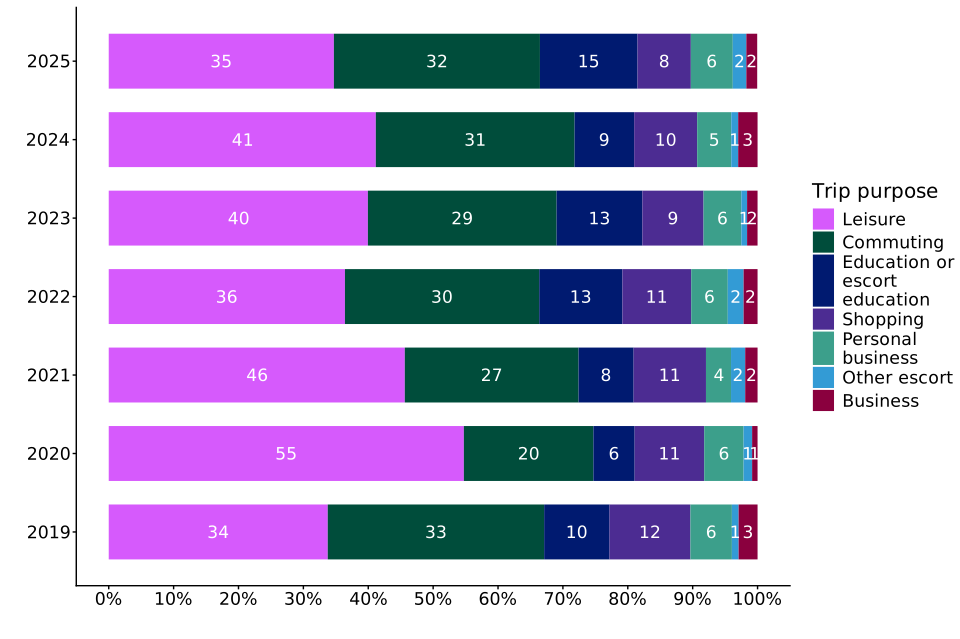
Chart 5.2: Cycling trips per person per year by trip purpose: England, 2019 to 2025 (NTS0409)
Cycle trips by trip purpose
- The most common purpose for a cycling trip was for leisure with 35% of all cycling trips in 2025. This was followed by commuting (32%), education or escort education (15%) and shopping (8%).
- The proportion of leisure cycling trips had become similar to before the pandemic in 2019 (34%) but remains lower than during the pandemic peak in 2020 (55%). The proportion of commuting cycling trips is also similar to pre-pandemic levels in 2019 (33%).
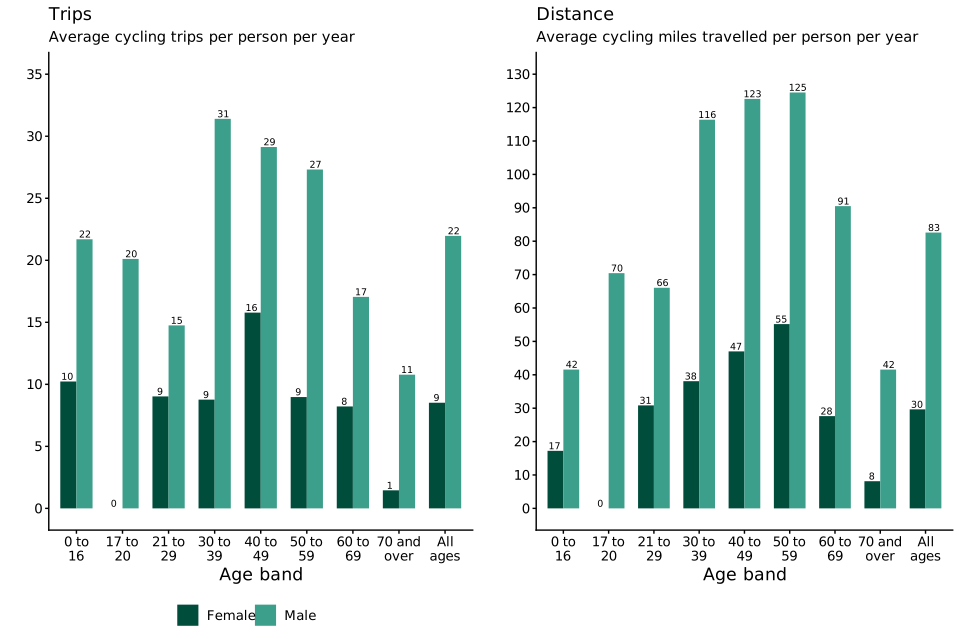
Chart 5.3: Average cycling trips and miles travelled, by age and sex: England, 2025 (NTS0601)
Cycle trips and distance travelled by age and sex
- In 2025, males of all ages made substantially more cycling trips on average and also cycled a longer distance than females. On average, males made 22 cycling trips and travelled 83 miles compared to females who made 9 cycling trips and travelled 30 miles.
- Males aged 30 to 39 and females aged 40 to 49 made the most cycling trips amongst their sex with 31 trips per person and 16 trips per person respectively. Males and females aged 50 to 59 cycled the longest distance amongst their sex with 125 miles per person and 55 miles per person respectively.
- The National Travel Attitudes Study wave 9 statistical release shows that individuals aged 16 to 39 are more likely to say that they don’t cycle, or choose not to cycle more, because of having children, other passengers or too much to carry. This age group also say they live too far from where they need to get to, and poor weather is an issue. Older age groups of those 60 and over are more likely to say that they have a health condition which prevents them from cycling, or cycling more, or that cycling isn’t for people like them.
Trends in walking trips
Chart 5.4: Average walking trips, stages and miles travelled, including walks of a mile or more, per person per year: England, 2002 to 2025 (NTS0303)

Walking trips, stages and distance travelled
Short walks
The recorded average trip rate for walks of less than a mile has decreased by 12% since 2024. This is believed to be associated with the introduction of the digital diary in 2025 and may not reflect a real change in the rate of walking.
Further details of work to understand the impact of the digital diary, including plans for the future, can be found in quality report and technical report for 2025.
- Walking trips made up 29% of trips, 33% of stages and 4% of distance travelled, on average in 2025.
- In 2025, the average number of walking trips decreased by 9% compared to 2024 with 243 trips per person. This was similar to 2019 (250 trips per person).
- The number of walking trips of a mile or more remained similar to 2024 with 79 trips per person in 2025. This represented an increase of 21% compared to 2019 (65 trips per person).
- In 2025, there were 310 walking stages per person, a 9% decrease compared to the previous year (339 stages per person).
- The number of walking stages of a mile or more remained similar to 2024 with 86 stages per person in 2025. This represented an increase of 18% compared to 2019 (73 stages per person).
- Average walking distance travelled decreased by 6% to 215 miles per person in 2025. This was an increase of 5% compared to 2019 (205 miles per person).
- Average walking trip length remains similar to the previous year with 0.8 miles in 2025, as a result, the fall in average walking distance travelled in 2025 could be as a result of fewer walking trips recorded on average.
- The distance travelled for walks of a mile or more was 125 miles per person in 2025, similar to 2024 (129 miles per person) and an increase of 25% compared to 2019 (100 miles per person).
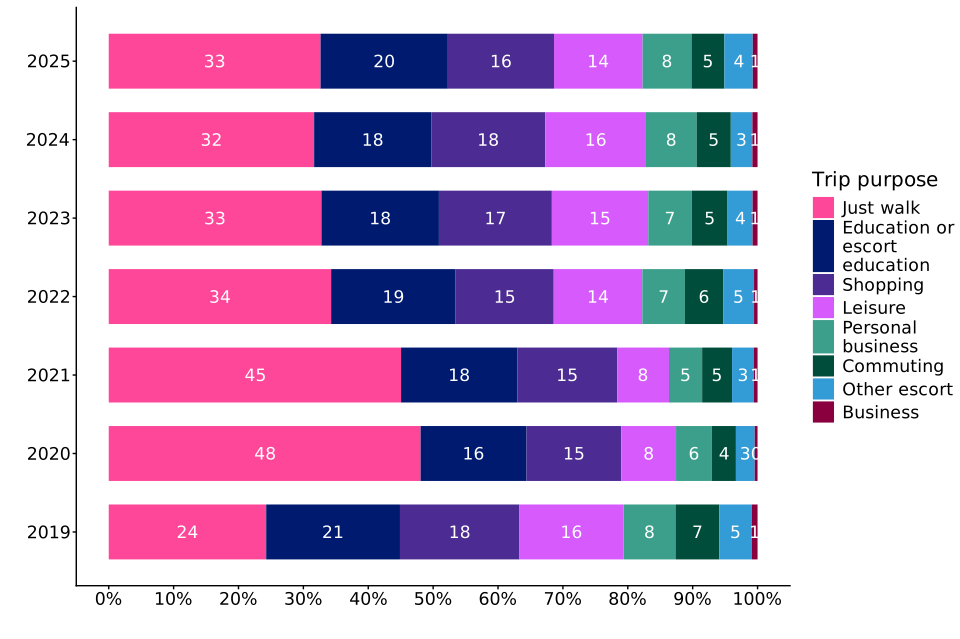
Chart 5.5: Walking trips per person per year by trip purpose: England, 2019 to 2025 (NTS0409)
Walking trips by trip purpose
- The most common purpose for walking trips in 2025 was just walk (33%). This was followed by education or escort education (20%), shopping (16%) and leisure (14%).
- Despite an increase in the average number of walking trips compared to 2019, and noticeable changes in the proportions in the previous six years, the most common walking trip purposes were the same in 2025 and 2019.
- Since 2020, the proportion of walking trips for just walk reduced but remained higher than pre-pandemic levels (2019).
- Since 2020, the proportion of education or escort education, shopping, leisure and commuting walking trips increased but remained slightly lower than pre-pandemic levels in 2019.
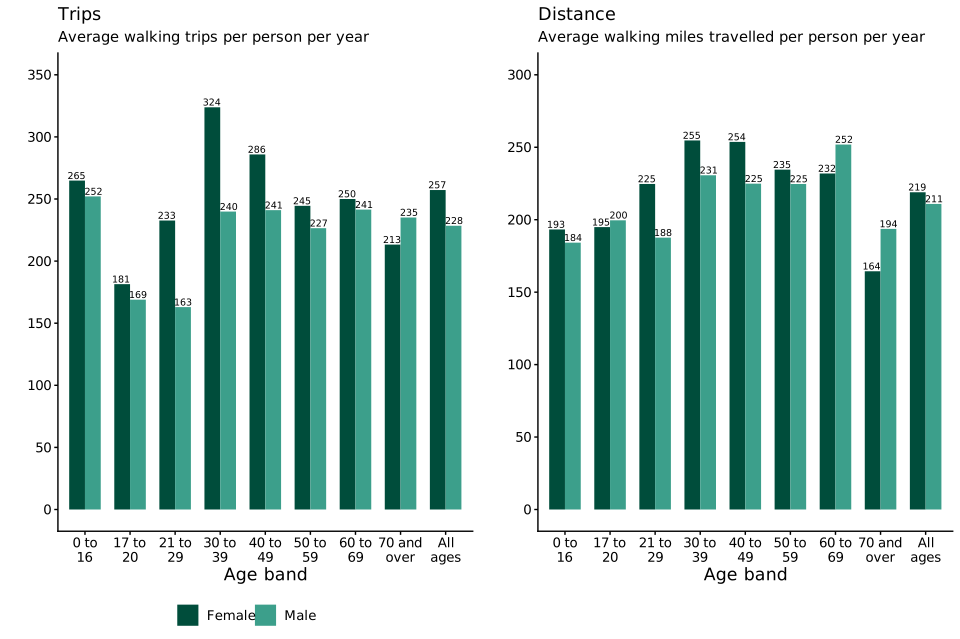
Chart 5.6: Average walking trips and miles travelled, by age and sex: England, 2025 (NTS0601)
Walking trips and distance travelled by age and sex
- In 2025, females of all ages apart from those aged 70 and over made more walking trips on average.
- Females walked a longer distance than males for age groups 0 to 16 and 21 to 59. Males walking longer distances than females for age groups 17 to 20 and 60 and over.
- On average, females made 257 walking trips and travelled 219 miles compared to males who made 228 trips and travelled 211 miles.
- Females aged 30 to 39 made the most walking trips amongst their sex with 324 walking trips per person, and walked the longest distance with 255 miles per person.
- Males aged 0 to 16 made the most walking trips amongst their sex with 252 walking trips per person and males and 60 to 69 walked the longest distance with 252 miles per person.
Barriers and encouragements to walking and cycling
Chart 5.7: All barriers to walking more by sex: England, 2025 (NTS0811)
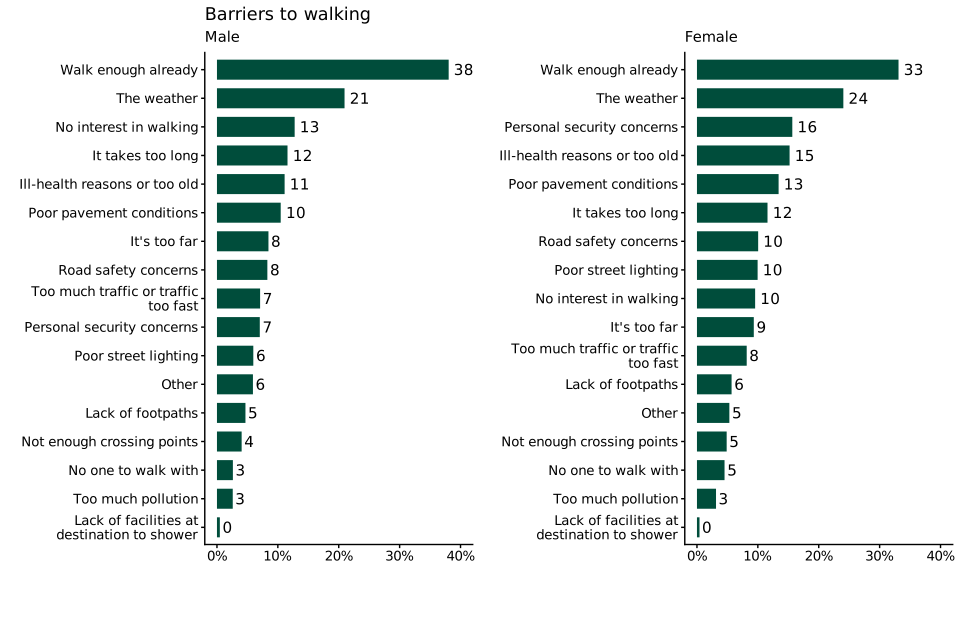
Barriers to walking
- In 2025, both males and females report that they walk enough already as the most selected reason for not walking more with 38% and 33% respectively. This was also the main reason [footnote 2] to not walking more with 35% by males and 30% by females.
- For males, the weather (21%) and no interest in walking (13%) were in the top 3 reasons for not walking more.
- For females, the weather (24%) and personal safety concerns (16%) were in the top 3 reasons for not walking more. [footnote 3]
Chart 5.8: All encouragements to walking by sex: England, 2025 (NTS0811)
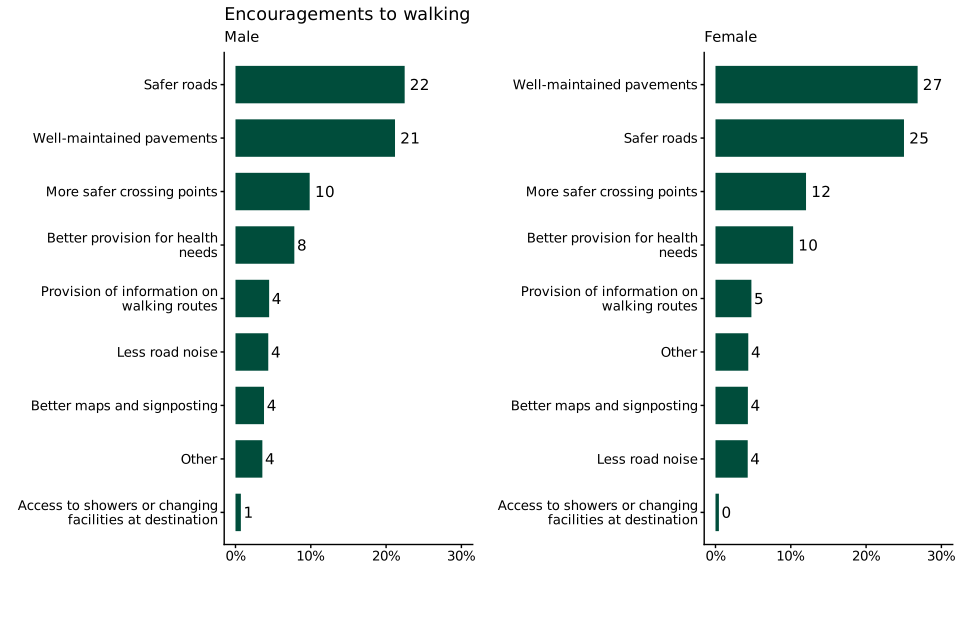
Encouragements to walking
- In 2025, when asked which factors would encourage respondents to walk more, the most common response was safer roads (for example slower driving speeds, less traffic, or more considerate driving) (22%) by males and well-maintained pavements (even, clean, uncluttered, well-lit) (27%) by females.
- Both males and females reported safer roads as the main factor to encourage more walking, 18% by males and 19% by females. [footnote 2]
- For males, well-maintained pavements (21%) and more safer crossing points (10%) were in the top 3 factors that would encourage respondents to walk more.
- For females, safer roads (25%) and more safer crossing points (12%) were in the top 3 factors that would encourage respondents to walk more. [footnote 3]
Chart 5.9: All barriers to cycling by sex: England, 2024 (NTS0810)

Barriers to cycling
- In 2024, both males and females reported that they have no interest in cycling as the most selected reason for not cycling more with 29% and 33% respectively. This was also the main reason [footnote 2] to not cycling more with 25% by males and 27% by females.
- For both males and females, road safety concerns (25% and 30% respectively) and the weather (22% and 20% respectively) were in the top 3 reasons for not cycling more. [footnote 4]
Chart 5.10: All encouragements to cycling by sex: England, 2024 (NTS0810)

Encouragements to cycling
- In 2024, when asked what would encourage all respondents to cycle more, for both males and females, the top 3 factors included safer roads (for example slower driving speeds, less traffic, or more considerate driving) (30% and 31% respectively), safe cycle lanes (22% and 23% respectively) and off-road and segregated cycle paths (21% and 22% respectively). [footnote 4]
- Safer roads was also the main reported factor that would encourage respondents to cycle more, 21% by males and 22% by females. [footnote 2]
NTS modernisation – we want your feedback
From autumn 2026, the NTS is launching a modernisation programme, which aims to review the survey’s methodology, data collection and outputs. The intention is to make the survey more flexible and scalable, reduce burden on respondents, and utilise modern technologies where appropriate.
The first stages involve capturing the views of our users and stakeholders on their use of, and need for, NTS data and statistics. We are contacting a number of known stakeholders directly, however we are keen to gather views from as wide a range of users as possible.
We want to ensure that the survey meets the needs of users, and any feedback provided will help inform the future design and development of the survey. If you have any feedback or wish to discuss this with the team, please email National Travel Survey statistics.
Background information
The 2025 National Travel Survey (NTS) is the latest in a series of household surveys of personal travel by residents of England travelling within Great Britain, from data collected via interviews and a seven-day travel diary. The NTS is part of a continuous survey that began in 1988, following ad-hoc surveys from the 1960s, which enables analysis of patterns and trends.
Some key uses of the data include describing patterns, for example how different groups of people travel, monitoring trends in travel, including sustainable modes; assessing the potential equality impacts of different groups; and contributing to the evaluation of policies.
These official statistics were independently reviewed by the Office for Statistics Regulation in September 2018. They comply with the standards of trustworthiness, quality and value in the Code of Practice for Statistics and are labelled ‘Accredited Official Statistics’.
Further information is available, including:
Instructions for printing and saving
Depending on which browser you use and the type of device you use (such as a mobile or laptop) these instructions may vary.
You will find your print and save options in your browser’s menu. You may also have other options available on your device. Tablets and mobile device instructions will be specific to the make and model of the device.
How to search
Select Ctrl and F on a Windows laptop or Command and F on a Mac.
This will open a search box in the top right-hand corner of the page. Type the word you are looking for in the search bar and press enter.
Your browser will highlight the word, usually in yellow, wherever it appears on the page. Press enter to move to the next place it appears.
Contact details
National Travel Survey statistics
To hear more about DfT statistical publications as they are released, follow us on X at DfTstats.
-
Traffic statistics are collected by automatic and roadside manual traffic counts which estimate the number of vehicle miles travelled by pedal cycles within Great Britain. This differs from the NTS which is a survey of a sample population of England residents travelling within Great Britain whereby individuals record information about their pedal cycle trips within a 7-day travel diary. Differences between traffic statistics and the NTS mean that care should be taken not to make direct comparisons between the two datasets. Further information on these differences can be found within walking and cycling statistics. ↩
-
Respondents are allowed to select multiple options when presented with the list of barriers and encouragements. If more than one option is selected they are asked to select one as the main reason. ↩ ↩2 ↩3 ↩4