Background information and methodology 2018 to 2019
Published 29 October 2020
Applies to England, Scotland and Wales

© Crown copyright 2020
This publication is licensed under the terms of the Open Government Licence v3.0 except where otherwise stated. To view this licence, visit nationalarchives.gov.uk/doc/open-government-licence/version/3 or write to the Information Policy Team, The National Archives, Kew, London TW9 4DU, or email: psi@nationalarchives.gov.uk.
Where we have identified any third party copyright information you will need to obtain permission from the copyright holders concerned.
This publication is available at https://www.gov.uk/government/statistics/income-related-benefits-estimates-of-take-up-financial-year-2018-to-2019/background-information-and-methodology-2018-to-2019
1. Purpose of the statistics
These statistics are designed to give an estimate of the take-up of benefits within the entitled population. They aim to provide an indication of whether and to what extent the different benefits are taken up by different groups.
They can be used to increase awareness of take-up for particular benefits, inform government policies, and measure the effect of take-up initiatives. More details of how the statistics are commonly used can be found in a customer feedback report covering responses received from December 2010 to May 2011.
2. Strengths and limitations of the statistics
Methodology
The strength of the methodology introduced for the FYE 2014 analysis (and also retrospectively applied to FYE 2010 and FYE 2013) is that it makes more use of existing administrative data alongside data from the FRS and Policy Simulation Model (PSM) to estimate take-up. The strength of the methodology introduced for the FYE 2018 analysis (and also retrospectively applied to FYE 2017) is that it provides an improved approach to estimating eligibility of caseload and expenditure take-up.
The FRS is data linked with Department for Work and Pensions (DWP) administrative data and where a match is made for a record, its reported amount of receipt for a benefit on the FRS is overwritten with the amount in receipt as recorded on the administrative data. This helps address some of the benefit undercount on the FRS. The data linking approach has continued to develop resulting in increasing match rates and more use of admin data over time.
Although they are based on DWP administrative data, the numbers in receipt and expenditure are not identical to official DWP statistics. This is because they are averaged across the whole year and other adjustments are made to enable consistency with the other non-administrative sources used, such as the FRS (see methodology section for a full discussion).
Although all estimates are subject to some analytical assumptions, the methodology minimises these. As a result of the changes more accurate estimates can be produced.
There is general uncertainty in estimates, especially in those of entitled non-recipients (ENRs) of benefits, given the complexity of estimation. The FRS, used in the estimation of ENRs, is not designed specifically to measure entitlement criteria to the same extent as an application for a specific benefit. It is a multi-purpose household survey.
The estimates of ENRs are also based on PSM data, which is modelled survey data, and are therefore subject to sampling variation and other forms of error associated with a sample survey. These include reporting errors, under-reporting, systematic bias and random sampling error. See the FRS Background note for more details.
Furthermore, it is not possible to perfectly model ESA eligibility because there are no data available for the PSM to use on the outcomes of individual Work Capability Assessments or doctors’ certificates that people would have if they applied to claim ESA. As well as this, new claims for income-related ESA are no longer available due to the introduction of Universal Credit.
Reasons for non-take-up
Trying to explain the reasons for non-take-up is difficult and we do not have the data in our modelling to do this. But in helping put results into context, it is useful to outline some of the broad factors that have been found to have an effect. Take-up may be affected by factors such as the size or other attractiveness of the benefit, lack of awareness of the benefit or application procedure, lack of awareness of their entitlement, the perceived stigma of receiving a benefit, or other factors.
A working paper reviewed the literature available on issues relating to take-up of benefits.
Limitations of statistics
Due to restrictions in modelling and available data, certain populations are excluded from our analysis.
As such the results do not include:
- those living in non-private households
- estimates for Northern Ireland (only figures for Great Britain are reported) due to the differences in benefit systems
3. Context of the statistics
The 4 benefits covered in the publication are:
- Pension Credit (PC)
- Housing Benefit (HB)
- Income Support (IS)
- Income-related Employment and Support Allowance (ESA (IR)) IS and ESA(IR) are combined in the take-up publication
Pension Credit
Background
Pension Credit (PC) is an income-related benefit which was introduced on 6 October 2003 and replaced the Minimum Income Guarantee (MIG).
Overview
There are 2 parts to PC: Guarantee Credit (GC) and Savings Credit (SC).
Claimants may qualify for either or both parts of PC.
GC tops up the claimant’s income up to a guaranteed level (a higher guaranteed level applies for couples). The level may increase if the claimant is a carer, severely disabled, responsible for a child or young person, or has certain housing costs.
To qualify:
- a claimant must live in Great Britain
- the claimant must have reached PC qualifying age
SC is an extra amount for people aged 65 or over who have made provision for their retirement above the SC threshold (such as savings or a second pension).
Most people who reached State Pension age on or after 6 April 2016 will not be eligible for SC.
But some people may continue to get SC if they are both:
- in a couple and one of them reached State Pension age before 6 April 2016
- receiving SC up to 6 April 2016
If a claimant who is a member of a couple in the circumstances above stops being allowed to claim SC for any reason, they will not be able to claim it again.
Read more information on current PC entitlement rules.
Benefit rates
The Standard Minimum Guarantee (SMG) is the minimum level of income that is guaranteed through GC. This is uprated each year by at least the level of the increase in earnings.
The Savings Credit Threshold (SCT) determines the level of income at which someone becomes eligible for SC, while the SC Maximum (SC max) is the maximum amount of SC that can be awarded. In recent years the rate of the increase of the SCT has had the effect of reducing the SC max.
| Singles | FYE 2019 rates per week |
|---|---|
| Standard Minimum Guarantee | £163 |
| Savings Credit Threshold | £140.67 |
| Savings Credit Maximum | £13.40 |
| Couples | FYE 2019 rates per week |
|---|---|
| Standard Minimum Guarantee | £248.80 |
| Savings Credit Threshold | £223.82 |
| Savings Credit Maximum | £14.99 |
The qualifying age
Between April 2016 and November 2018, the PC qualifying age for men and women rose to 65 in line with the increase in State Pension age for women. It will then increase in line with further increases in State Pension age for both men and women, so will rise to 66 by October 2020 and to 67 by 2028. More information can be found in the following table:
| Date | Qualifying Age for Women | Qualifying Age for Men |
|---|---|---|
| April 2009 | 60 years | 65 years |
| April 2010 | 60 years | 65 years |
| April 2011 | Between 60 years 5 months and 60 years 7 months | 65 years |
| April 2012 | Between 60 years 11 months and 61 years 1 month | 65 years |
| April 2013 | Between 61 years 5 months and 61 years 7 months | 65 years |
| April 2014 | Between 61 years 11 months and 62 years 1 month | 65 years |
| April 2015 | Between 62 years 5 months and 62 years 7 months | 65 years |
| April 2016 | Between 62 years 11 months and 63 years 3months | 65 years |
| April 2017 | Between 63 years 8 months and 64 years | 65 years |
| April 2018 | Between 64 years 5 months and 64 years 9 months | 65 years |
| March 2019 | 65 years | 65 years |
Changes to Pension Credit rules
Capital disregards are amounts that the claimant has, but that are not taken into account when considering entitlement or calculating any assumed yield income. From November 2009, the level of the capital disregard increased to £10,000 (up from £6,000). Previously, only those who lived permanently in a care home had a £10,000 capital disregard.
Interaction with other income-related benefits
Until November 2018, men aged between State Pension age for women and 65 were able to claim one of PC, ESA (IR), Jobseeker’s Allowance (JSA) (income-based (IB)) or, in certain areas, UC. From November 2018 men could only claim PC when PC qualifying age for men was reached. This choice also existed for ‘mixed-age’ couples until May 2019 where one member was aged above the PC qualifying age, and the other was aged below.
For the purposes of estimating take-up, we model that men aged over the PC qualifying age, but under 65, would have claimed PC rather than ESA (IR). This can be explained as follows. It is assumed that a working-age person can only claim a working-age benefit, such as ESA (IR). Men aged over the PC qualifying age but under 65 have a choice over what they can claim – PC or a working-age benefit. Most men would opt for PC because the amount of benefit received would normally be greater than the working-age benefits. Additionally, with PC there aren’t the conditionality requirements (the working-age benefits need a justification as to why you are not working). Similarly, mixed-age couples are assumed to claim PC.
PC could be paid in conjunction with HB but not with Universal Credit (UC), JSA (IB), IS or ESA (IR).
Housing Benefit
Background
Housing Benefit (HB) helps tenants who are on a low income to pay their rent. HB is administered by local authorities who decide whether a claimant is eligible for HB, and how much they qualify for. Tenants can apply for HB irrespective of whether they are in work, or out-of-work. It may be paid alongside other income related benefits, non income related benefits, or on its own. Since December 2018 due to Universal Credit rollout new claims for Housing Benefit can only be made in certain circumstances.
Overview
Subject to having an eligible rent liability, the vast majority of those on the Guarantee Credit part of PC, IS or ESA (IR) are automatically eligible for maximum HB.
Claimants not in receipt of one of the benefits listed above may have their HB reduced if they have capital or income in excess of certain thresholds. If their capital or income is too high they may not qualify for HB at all.
The amount awarded can also vary based on the numbers, age and disabilities of members of the household. For many claimants in the private rented sector, the level of their eligible rent is also limited by the Local Housing Allowance (LHA) rates which apply to where they live. The size and composition of the claimant’s household determines the size of the accommodation which they might reasonably need. In turn the specific LHA rate used to assess entitlement to HB. The benefit cap may also apply.
There are some exceptions. Those that do not qualify for HB include:
- those who live in the home of a close relative
- any full-time students – unless they are disabled or have children
- asylum seekers or those sponsored to be in the UK
From December 2018 new claims for Housing Benefit can only be made if:
- a claimant has reached State Pension age
- a claimant lives in supported, sheltered or temporary housing
From January 2019 new claims for Housing Benefit can also be made if:
- a claimant receives the severe disability premium or is entitled to it
- a claimant who received or was entitled to the severe disability premium within the last month and is still eligible for it
Read more information on current HB entitlement rules.
Benefit rates
There is no set rate of HB that a claimant will receive, but the thresholds used for the means-test side of the HB assessment are aligned to rates of other benefits, and claimants in the private rented sector are usually restricted to the LHA rate for their family size and postcode. Most benefit rates and LHA rates were frozen (between FYE 2017 and FYE 2020).
Changes to Housing Benefit rules
Since 2010 there have been a number of changes to the structure of HB.
LHA changes
Phased in from April 2011:
- LHA rates are calculated based on the 30th percentile of rents in the area-previously, they were based on the 50th percentile (or median of rents)
- claimants are no longer entitled to keep any excess between their rent and the LHA rate (previously, this was up to £15 a week)
- LHA rates are capped to overall maximum weekly levels (affecting the most expensive areas such as inner London)
- claimants can no longer get the 5-bedroom rate
Phased in from January 2012:
- the age threshold for the shared accommodation rate (SAR) (previously under 25) was extended to include single people aged under 35
Phased in from April 2016, the National Living Wage was introduced and HB family premium began to be phased out. This will tend to have reduced HB entitlement and floated people with very small entitlements under the FYE 2016 system off benefit altogether.
Removal of the Spare Room Subsidy
The removal of the spare room subsidy was introduced nationally on 1 April 2013. It applies the size criteria test that pre-existed in the LHA to determine the number of bedrooms needed by working-age HB claimants living in the social rented sector. Where claimants are found to be under-occupying, their eligible rent is reduced by 14% if they have one extra bedroom and by 25% if they have 2 or more. Pensioners are exempt from the policy, with easements for certain groups (for example claimants with overnight carers).
Non-dependent deductions
A 3-year staged increase in the rates of non-dependant deductions (NDDs) in HB was introduced from April 2011. By April 2013, these increases brought the NDD rates to the level they would have been had they been increased each year since 2001, to broadly reflect growth in rents.
Interaction with other income-related benefits
HB is worked out on the basis of an ‘applicable amount’ intended to cover basic weekly living expenses. The amount of benefit is worked out by comparing a person’s income with their applicable amount which is intended to cover day-to-day living expenses, taking account of the size and make-up of the household.
If the net income is equal to or is less than the applicable amount or they are in receipt of an income-related benefit, they will receive 100% of the rent for which benefit can be paid less any non-dependent deductions. This would be subject to any deductions for non-dependents who live with them, and help with rent would not exceed the LHA rate which applies to their household. If the net income is more than the applicable amount, they will receive reduced HB. For each pound of extra income over the applicable amount, after disregards, 65 pence will be deducted.
The HB payment may also be reduced to ensure that the household’s total benefit income does not exceed the benefit cap.
Income Support and Income-related Employment and Support Allowance
Background
Income Support (IS) is paid to people below PC qualifying age who are on low incomes and are not in full-time work. Employment and Support Allowance (ESA) is paid to people below State Pension age who have an illness or a disability. This report combines take-up estimates of IS and income-related ESA (ESA (IR)) as it is not practically possible to distinguish between IS and ESA (IR) eligible cases in our modelling. Since December 2018 new claims can only be made for IS in certain circumstances.
Overview
To qualify for IS a claimant must meet the relevant conditions of entitlement. They must:
- be between 16 and PC qualifying age
- be pregnant, or a carer, or a lone parent with the youngest child under a specific age or, in some cases, unable to work because they are ill or disabled
- have either no income or a low income
- be working less than 16 hours a week (and a partner working no more than 24 hours a week)
- be in Great Britain (different rules apply in Northern Ireland)
- have savings below £16,000 (exceptions apply)
- not need permission to enter the UK (exceptions apply)
- not get ESA (IR) (exceptions apply)
- not be a young person being looked after by a local authority (exceptions apply)
From January 2019 new claims can only be made for IS in one of the following circumstances:
- a claimant who gets the severe disability premium, or is entitled to it
- a claimant who got or was entitled to the severe disability premium in the last month, and is still eligible for it
Claimants who have paid sufficient National Insurance contributions, are not getting Statutory Sick Pay and from January 2019 are not entitled to or getting the severe disability premium or received or was entitled to the severe disability premium and in the last month who are still eligible for it receive contribution-based ESA (ESA (C)). Those who have not paid sufficient National Insurance contributions and from January 2019
- get the severe disability premium, or is entitled to it
- got or was entitled to the severe disability premium in the last month, and is still eligible for it may qualify for ESA (IR).
To qualify for ESA (IR), the claimant’s illness or disability has to affect their capability to work, and they must:
- be under State Pension age
- not be getting Statutory Sick Pay or Statutory Maternity Pay and not gone back to work
- not have an income over a certain threshold - this includes the claimant and any partner’s (if applicable) income
- not have savings greater than £16,000 (exceptions apply)
While this report presents take-up estimates for ESA (IR), those receiving both ESA (C) and ESA (IR) together are included in the receipt estimates. For those who qualify for but don’t receive ESA (IR), the estimates only include those modelled to qualify for ESA (IR) only.
Read more information on current IS and ESA entitlement rules:
Benefit rates
The weekly amount paid is based on the difference between the benefit unit’s applicable amount and income. The applicable amount is calculated from the personal allowance, premiums and certain housing costs relevant to the benefit unit. For ESA (IR), while a work capability assessment is being carried out, the benefit unit receives the ‘assessment phase’ personal allowance. Once assessed, the benefit unit receives the ‘main phase’ personal allowance, along with either the relevant support component or work-related activity component. As a result, IS and ESA (IR) payments will differ for each benefit unit due to their different circumstances. See the rates on the following table.
| Personal Allowances | FYE 2019 rates each week | |
|---|---|---|
| Single | Under 25 (ESA assessment phase and IS) | £57.90 |
| Single | Under 25 (ESA main phase) | £73.10 |
| Single | 25 or over | £73.10 |
| Lone Parent | Under 18 (ESA assessment phase and IS) | £57.90 |
| Lone Parent | Under 18 (ESA main phase) | £73.10 |
| Lone Parent | 18 or over | £73.10 |
| Couple | Both under 18 (ESA assessment phase and IS) – lower rate | £57.90 |
| Couple | Both under 18 (ESA main phase) – lower rate | £73.10 |
| Couple | Both under 18 (ESA assessment phase and IS) – higher rate | £87.50 |
| Couple | Both under 18 (ESA main phase) – higher rate | £114.85 |
| Couple | Both over 18 | £114.85 |
| Couple | One 18-24 (ESA assessment phase and IS) – lower rate | £57.90 |
| Couple | One 18-24 (ESA main phase) – lower rate | £73.10 |
| Couple | One 18 or over – higher rate | £114.85 |
| Couple | One 25 or over – lower rate | £73.10 |
| Premiums | Personal Allowances | FYE 2019 rates each week |
|---|---|---|
| Disability | Single | £33.55 |
| Disability | Couple | £47.80 |
| Severe Disability | Single or couple (one qualifies) | £64.30 |
| Severe Disability | Couple (both qualify) | £128.60 |
| Carer | £36 | |
| Enhanced Disability | Single | £16.40 |
| Enhanced Disability | Couple | £23.55 |
| ESA (IR) Components | FYE 2019 rates each week |
|---|---|
| Work-related component | £29.05 |
| Support component | £37.65 |
The ‘Disability’ premium is not available to ESA (IR) recipients. ESA (IR) has other components designed to meet the needs of people with different levels of disabilities.
Changes to IS and ESA rules
From 24 October 2009, the upper age limit of the youngest child allowing a lone parent to qualify for IS reduced progressively each year from 12 in FYE 2010 to 5 years old in FYE 2013. Lone parents with the youngest child aged 5 and over, able to work and with no caring responsibilities could apply for JSA and would need to look for work. Those with a disability or health condition were expected to claim ESA (IR). This resulted in a reduction in the number of lone parents receiving IS and an increase in the number of lone parents receiving JSA.
ESA was introduced on 27 October 2008, replacing Incapacity Benefit (IB) and Severe Disablement Allowance (SDA) for new claimants. Since April 2011, existing claimants of IB or SDA are gradually being assessed for eligibility for ESA. Therefore, the number of benefit units receiving ESA (IR) increased between FYE 2010 and FYE 2016, as those receiving IB and SDA started receiving ESA (IR) instead.
From 1 May 2012, ESA (C) has been restricted to 365 days for those in the work related activity group. This will have led more people becoming eligible for ESA (IR).
Interaction with other income-related benefits
IS and ESA (IR) can be paid in conjunction with HB but not with each other or JSA (IB).
Universal Credit
Universal Credit (UC) was introduced in April 2013 in certain pathfinder areas of north-west England. By the end of December 2018, it was available to all types of eligible claimants, across Great Britain and Northern Ireland.
As UC is being rolled out it will affect the take-up estimates in the future as eligibility for current benefits changes.
There are specific challenges in creating a UC take-up measure and interpreting and communicating its results within the scope of the Code of Practice for Statistics.
The challenges include:
- the roll out schedule – different types of claimants at different times and geographical coverage
- the new administrative data systems and admin data availability
- the number of UC cases being picked up in the Family Resources Survey, the data source of this publication
- identifying UC eligibility, as noted below it is currently difficult to assess eligibility, this is likely to continue for some time
- time lags in the data for analysis
Whilst there is an increasing amount of UC administrative data becoming available for use in the department, as a result of the finished nationwide rollout of UC full service to new claims there are now several hundred households in the Family Resources Survey (FRS) which reported that they received UC. At this point in the UC rollout schedule, there is no practical way to distinguish between Jobseeker’s Allowance (JSA) and UC at entitlement level for the purposes of estimating take-up statistics. Therefore, the JSA data are not of a suitable quality to be published. JSA data was published for the last time in FYE 2016. We are also unable to estimate UC take-up rates at present.
We are monitoring the situation and will make changes in the future as needed.
Read more information on UC.
Read statistics on UC.
Read the latest release of UC statistics.
4. Other points relevant to the statistics
HMRC publishes estimates of the take-up of tax credits.
The FYE 2018 publication of tax credit take-up rates were the last in the series of publications due to UC-related data issues from FYE 2019 onwards.
A working paper. reviewed the literature available on issues relating to take-up of benefits including the availability of take-up analysis in other European countries.
Given the adjustments and coverage of the take-up methodology, receipt and expenditure estimates here will not be the same as the official statistics published by DWP. DWP publishes a wide range of statistics on receipt of benefits and benefit expenditure.
Read the benefit expenditure and caseload tables.
Stat-Xplore is a DWP tool that provides users with access to data. Users can download and analyse statistics on a range of different benefits, programmes, and other information collected and stored by the department. Pensioners’ Incomes (PI) and Households Below Average Income (HBAI) are currently available from Stat-Xplore.
Official Statistics are produced in accordance with Statistics and Registration Service Act 2007). We are also committed to complying with the Code of Practice for Statistics.
5. Source of the statistics
Figures in this analysis are based on DWP administrative data, Local Authority administrative data, and data from the FRS. The survey data from the FRS are modelled using a static micro simulation model known as the PSM - more details are in the methodology section.
6. Definitions and terminology within the statistics
Take-up refers to the receipt of benefits that a family is entitled to. Such a family is referred to as an entitled recipient (ER). There are also families who are entitled to benefits, but not in receipt of them. Such a family is referred to as an entitled non-recipient (ENR).
Take-up is estimated in two ways – by caseload and by expenditure:
- caseload take-up compares the number of benefit recipients, averaged over the year, with the estimated number that would be receiving if everyone took up their entitlement for the full period of their entitlement
- expenditure take-up compares the total amount of benefit received, in the course of a year, with the estimated total amount that would be received if everyone took up their entitlement for the full period of their entitlement
More definitions can be found in the glossary.
7. Revisions to the statistics
Income-Related Benefits: Estimates of Take-up uses a complex methodology that uses numerous data sources. Each year the team checks all of the contributing codes and processes for any potential improvements that could be made to improve the accuracy of the take-up estimates produced.
Linking Permission Mechanism
The FRS tested a new approach to obtaining agreement to link respondents’ data to administrative data from January 2017 to April 2017. The new approach replaces an explicit Yes and No question in the FRS questionnaire with an up-front statement that DWP will link respondents’ information to administrative records held by the department. A randomised control trial ran from January 2017 to April 2017, with the FRS sample split 50:50 between those receiving the new enhanced fair processing statement and the existing explicit data linking question. The trial was a success and the new method was implemented from May 2017 onwards. This change means that the number of cases available for data linking has increased in FYE 2018. The take-up methodology already uses linked survey-administrative data to improve the quality of the estimates by replacing survey responses, which are subject to reporting error, with accurate administrative data on benefit receipt. Therefore, this methodological change means that more administrative data can be used in the production of the estimates, improving their accuracy. An increased amount of linked data completes our understanding as to the number of entitled non-recipients for a benefit where benefit under-reporting has occurred in the FRS. This would have an effect on the mean and median amounts unclaimed. The actual effect on the take-up estimates will depend on the observed data for each survey year.
The data linking approach itself has continued to develop and in FYE 2019 we are able to link 89% of FRS cases used in the take-up estimates compared to 80% in the previous publication.
Methodological refinements applied from FYE 2017 onwards
Changes to the methodology
There were 4 methodological changes applied from FYE 2017 onwards. Comparisons to earlier years should be treated with caution.
The changes are:
- improvement to the modelling of State Pension receipt, by making use of more information from respondents, this prevents any assumption of no State Pension being made by the model
- that PC calculations now take into account mixed-age couples (where one member is aged above PC qualifying age, and the other is aged below PC qualifying age) working-age benefits (IS and ESA and JSA), this involves removing the calculated IS and ESA and JSA amount from PC
- that additional savings information is now taken into account in capital calculations
- that Support for Mortgage Interest (SMI) entitlement is removed from estimated IS and PC entitlement amounts, Support for Mortgage Interest used to be paid within PC, Support for Mortgage Interest is now paid out separately as a loan and Support for Mortgage Interest and has therefore been removed from PC calculations
These changes provide an improved approach to estimating eligibility of caseload and expenditure take-up which:
- reduce the estimated number of Entitled Non Recipients (ENRs)
- reduce the estimated unclaimed amount
For example, for FYE 2018, it is estimated that these changes affect the estimated PC take-up rate by approximately 2 percentage points (increase) for caseload and 4 percentage points (increase) for expenditure. Changes to HB and IS and ESA are more minimal (increase is less than 1 percentage point) for both caseload and expenditure. The exact scale of the effect could vary between years.
Policy changes
With effect from April 2016, the partial abolishment of Savings Credit took place. This meant that new claims of Savings Credit were disallowed on the grounds of age. In FYE 2018 this methodological fix to Savings Credit increased the estimates of Pension Credit by 0.8 percentage points, accounting for over half of the overall 1.5 percentage points increase that resulted from methodological fixes.
For methodological refinements made in previous years please see the previous publication’s background information and methodology FYE 2018.
It is the statistics that are used in this FYE 2019 publication which should take precedence over all previously published results for all years.
The department’s policy statement. describes how DWP will handle revisions.
8. Status of the statistics
Official statistics
Income-related Benefits: Estimates of Take-up is classified as an Official Statistic. In developing these statistics, DWP has acted in accordance with the Code of Practice for Statistics and supporting principles.
Read further information about official statistics.
Quality statement
The take-up estimates are based on a number of data sources all of which have their own processes in place to ensure their quality. When producing the take-up estimates, all content has been independently quality assured by different members of the team to ensure the methodology is strong. All commentary in the publication is reviewed by the team and analysts from the relevant policy areas to ensure the information presented is accurate and meets user needs.
9. Feedback
We welcome feedback
If you have any comments or questions, please contact:
Neil Sorensen,
Take-up Team Leader, Surveys Branch,
Department for Work and Pensions,
Benton Park View,
Benton Park Road,
Newcastle Upon Tyne,
NE98 1YX
Email: irb.takeup@dwp.gov.uk
Direct line: 0191 216 2320
10. Acknowledgements
Publication Lead: Neil Sorensen
Take-up Team: Narayan Jayaram and Jonathan Howard
11. Useful links
This document, the statistics release and supporting tables, along with previous releases, can be found in the collection of statistics page.
The ONS has published a guide for users of official statistics on earnings and income. This guide compares the main sources of data available and outlines which sources will best meet user needs.
Other useful information on income and earnings.
12. Methodology introduction
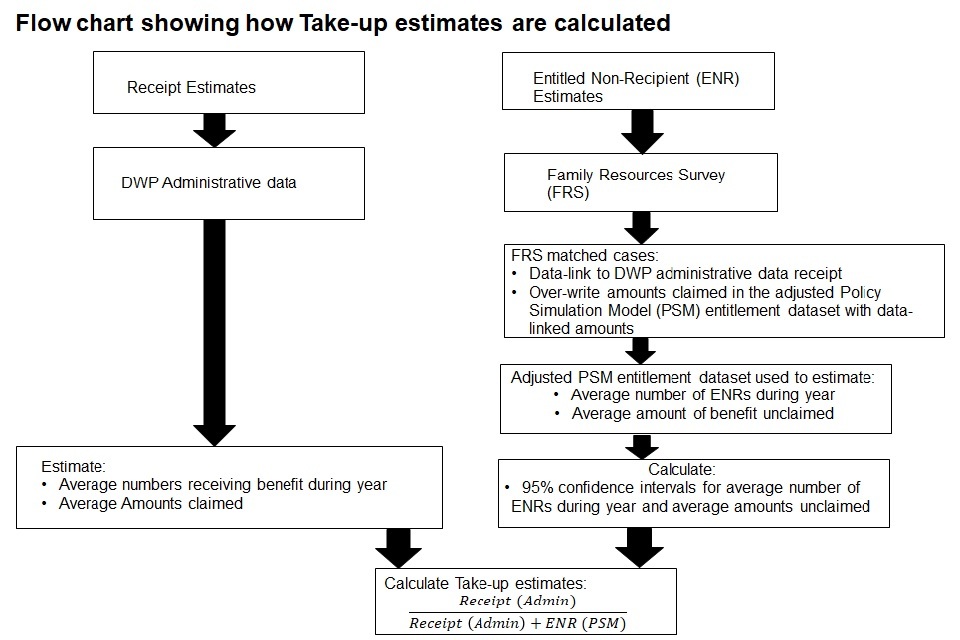
To produce the take-up estimates, information can be taken from DWP administrative data sources to present the average number of those in receipt of the benefit along with the average amount claimed. However, because administrative benefit entitlement data sets do not exist, survey-based estimates of the population and unclaimed amounts of those who are entitled but not receiving (ENRs) are needed. These survey-based estimates come from the adjusted PSM entitlement data set. The adjusted PSM entitlement data set is created by firstly working out the FRS matched cases. This involves data linking from FRS data to DWP administrative data records and then overwriting the amounts claimed in the adjusted PSM entitlement data sets with the data linked amounts. 95% confidence intervals are also calculated for the average number of ENRs during the year and the average amounts unclaimed. Finally, the take-up estimates are calculated by taking the number of people in receipt of benefits from the administrative data and dividing this by the total number of people in receipt from the administration data and the number of ENRs from the adjusted PSM.
The methodology used aims to provide the best estimate based on the evidence available, using the FRS. At the same time, there are limitations with the methodology as there are known data issues in the FRS. This is also due to the inability to link to administrative data for around 11% of the FRS population.
This report presents the methodology which is strongly focused on using what evidence is available from administrative sources and the FRS, to produce the take-up estimates.
13. Data Sources
Overview
The take-up estimates are derived using information taken directly from a number of data sources. A small number of evidence-based adjustments are introduced where necessary.
The Work and Pensions Longitudinal Study (WPLS) is the main data source for estimating receipt of PC, IS and ESA (IR), used alongside the Quarterly Statistical Enquiry (QSE).
The Single Housing Benefit Extract (SHBE) is the main data source used for HB receipt.
ENR estimates are for private households only. For consistency, the QSE is also used to adjust the receipt estimates for PC and IS and ESA (IR) to exclude any non-private households.
For ENR estimates, a combination of an adjusted entitlement dataset from the PSM and reported receipt from the FRS are used. In the production of the adjusted PSM entitlement dataset, certain benefit units are linked to their administrative records on the WPLS for estimating ENRs of PC and IS and ESA (IR) and SHBE for HB to use actual amounts paid rather than reported FRS amounts.
Work and Pensions Longitudinal Study (WPLS)
The WPLS links DWP benefit and programme data on claimants with their employment records from Her Majesty’s Revenue and Customs (HMRC).
The WPLS is used to produce receipt estimates for PC and IS and ESA (IR) as it provides 100% DWP administrative records for all those receiving the benefits. The data sets are available quarterly.
Read more information on the WPLS.
Quarterly Statistical Enquiry (QSE)
The QSE is a quarterly electronic scan of 5% of DWP administrative records.
The use of the QSE data is to identify the proportion of benefit units that are private households in the receipt estimates for PC and IS and ESA (IR). It is applied to the initial average numbers receiving each benefit. This adjustment ensures the estimate of the average numbers receiving each benefit is consistent with the estimate of the average number of ENRs, which are for private households only.
Read more information on DWP benefits statistics.
Single Housing Benefit Extract (SHBE)
SHBE is a monthly electronic scan taken directly from local authority computer systems and provided to DWP for analysis.
The data are used as they provide 100% administrative records for all those receiving HB. As predominantly only private households can receive HB, no adjustment is made to remove non-private households for the receipt estimates. SHBE is also used to data link with FRS matched cases for the ENR estimates.
Read more information on Caseload statistics.
Family Resources Survey (FRS)
The FRS is an annual survey, collecting information on around 20,000 private households in the United Kingdom (UK), although only Great Britain (GB) information is used in this analysis. The primary function is to collect information on household income claimed from all sources, including wages and salaries, state benefits, payable tax credits, private (occupational and personal) pension schemes, and investments. The information allows analysis at an individual level, benefit unit level and household level. The survey is sponsored by the DWP.
As well as being the main data source for the PSM, information is taken directly from the FRS to identify reported receipt of the income-related benefits, where data linking was not possible.
Read more information on the Family Resources Survey.
Policy Simulation Model (PSM)
DWP’s PSM is a static micro simulation model of the UK tax and benefit system. It takes reported information from the FRS on benefit units and then simulates (or models) what the benefit unit might be entitled to or earn based on the tax and benefit rules in the FRS year. The model estimates what a similar benefit unit, with those same characteristics, might be entitled to or earn for future financial years, accounting for the tax and benefit rules in that future year. The PSM is used extensively by DWP analysts for policy evaluation and costing of policy options.
The PSM is used in the derivation of the ENR estimates, as it provides a modelled entitlement dataset for the income-related benefits presented in this report. Some important adjustments are made to the entitlement dataset to provide more precise initial estimates of ENRs and their average weekly amounts unclaimed.
14. Estimating receipt
Overview
Receipt estimates of PC and IS and ESA (IR) are taken from their data sources and adjusted to represent private households only. Since HB is predominantly only available to private households, HB receipt is taken directly from the data source. Estimates of average amounts claimed are not adjusted as private households account for around 95% of all households receiving PC and IS and ESA (IR). It is assumed that the average amounts claimed remain representative of private households.
Pension Credit
The WPLS is used to estimate the average number of those receiving PC and average amounts claimed for the financial year, using data taken at the end of each quarter. Estimates are produced for the type of PC claimed (whether Guarantee Credit and or Savings Credit) and by family type.
The estimated average number of those receiving PC is then adjusted using the proportion of private households of all households. This removes around 5% of those in receipt of PC from the estimate.
Housing Benefit
SHBE data sets from each month of the financial year are combined and a 12-month average is estimated for the number of those receiving HB and average amounts of HB claimed. HB is predominantly only available to people living in private households.
Income Support and Income-related Employment and Support Allowance
This publication presents combined IS and ESA (IR) take-up estimates. However, IS and ESA (IR) are recorded separately on the WPLS. To obtain estimates for the overall average number of those receiving IS or ESA (IR) and the overall average amount of IS or ESA (IR) claimed, data are taken at the end of each quarter of the financial year for each benefit. The overall receipt estimates for IS and ESA (IR) are then produced by adding the average numbers for each benefit together.
Overall average number of benefit units receiving IS and ESA (IR):
Equation
Average number of benefit units receiving IS in the year + Average number of benefit units receiving ESA (IR) in the year
The proportion of private households of all households receiving IS is then applied to the overall average number of those receiving IS and ESA (IR). It is assumed that the proportion is the same as for ESA (IR). This adjustment removes around 1% of families receiving IS and ESA (IR).
To produce the estimate of overall average amounts claimed for IS and ESA (IR), the average total weekly expenditure for IS and for ESA (IR) are added together and then divided by the overall average numbers of families receiving IS or ESA (IR):
Equation
(Average number of benefit units receiving IS in the year × Average amount of IS claimed) + (Average number of benefit units receiving ESA (IR) in the year × Average amount of ESA (IR)) ÷ Average number of benefit units receiving IS and ESA (IR) in the year
The average amounts estimated are not adjusted as it is assumed that these amounts remain representative of private households, which account for 99% of all households in receipt of IS and ESA (IR).
Comparisons with published DWP estimates
As the take-up receipt estimates for PC and IS and ESA (IR) focus on private households only, these are lower than published DWP estimates, which include all households. For HB, the take-up receipt estimates for FYE 2013 onwards are similar to published DWP estimates. However, for FYE 2010, the take-up receipt estimates are slightly lower. For FYE 2010, bespoke SHBE data sets were produced for months April 2009 to November 2009 to capture the necessary information for breakdowns by family type, tenure type and employment status. These bespoke data sets were combined with the December 2009 to March 2010 data sets and a 12-month average number of those receiving HB and average amounts of HB claimed were estimated.
15. Data Linking
The approach to data linking used in the production of the take-up statistics has evolved over time. For FYE 2010 results we were able to match 81% of cases while now in FYE 2019 we have been able to match 89% of cases to improve the take-up estimates. See below for details of the linking approach used in FYE 2019.
Before January 2017, FRS respondents were explicitly asked for agreement to link their records to DWP administrative data. A randomised control trial was run between January 2017 and April 2017. Here the sample was split 50:50 between those asked the explicit linking permission question and those receiving a statement in advance of their interview stating that their information will be linked on completion of the questionnaire. The trial was a success, so from May 2017 onwards the statement in advance of interview method was used.
Data linking is only applied where it was possible to match an individual’s record to administrative data.
To use administrative data to determine an FRS respondent’s true benefit status, we need their National Insurance Number (NINo), which is the unique identifier that DWP uses to record a person’s information. This presents a problem because NINos are not directly recorded on the FRS and therefore we have to “fuzzy-match” the personally identifiable information (PII) that is recorded on the FRS to that held on the department’s customer information system (CIS). This process is confounded by inconsistencies in the way that PII is captured, for example alternate name spellings, pseudonyms and incorrect keying of date of birth (DOB) information. For example, a human reviewer may understand that a record labelled: “Robert Smith, born 12-12-2012” corresponds to the record: “Bob Smith, born 12th December ‘12” but there is not a general, reproducible algorithmic equivalent. As it is not feasible to manually compare the 30 thousand yearly FRS records with the 100 million CIS records, a three step automated approach is instead employed.
Stage 1 – Deterministic Matching
For each record on the FRS, CIS is searched for a customer record with a surname, forename, postcode and date-of-birth (DOB) that exactly corresponds. If a single such record is found, this is selected as a perfect match and assigned a match-key of 0. This is justified because the combination of forename, surname, postcode and DOB is 100% unique on CIS, meaning that no two records share common values for all four variables. Approximately 60% of FRS records are assigned a NINo in this way with the remaining 40% not matching for a variety of reasons including:
- missing information on the FRS record, for example no DOB recorded
- misspelling of a name, for example Graham recorded as Graeme
- use of a nickname, for example Bob recorded instead of
- postcode disagreement, for example because the individual moved since the interview date
- in the last case, where the survey respondent changed address between the interview date and point of analysis, there is an extra step we can take to find a match and this forms stage 2 of the process
Table 1 Examples of some (fictitious) deterministic matches
| FRS_ID | FRS_Fname | FRS_Sur | FRS_DOB | FRS_Pcode | NINo | CIS_Fname | CIS_Sur | CIS_DOB | CIS_Pcde |
|---|---|---|---|---|---|---|---|---|---|
| 00001 | Alice | Smith | 01Jan1999 | AA1 1AA | AA000001 | Alice | Smith | 01Jan1999 | AA1 1AA |
| 00002 | Robert | Jones | 10May2001 | AB2 6BD | BB000002 | Robert | Jones | 10May2001 | AB2 6BD |
| 00003 | Eve | Green | 11Nov1923 | AC3 7NM | CC000003 | Eve | Green | 11Nov1923 | AC3 7NM |
Stage 2 – Historic Matching
Here we use the historic CIS information that is available and attach to each record on CIS the data that we have available regarding a person’s previous addresses. We create a transverse data-set (that means a data set where each person is mapped uniquely to a row), as shown in Table 2 and associate a higher number with an older postcode so that, for example “PCde2” corresponds to the third from most-recent address DWP has recorded for the individual. We then simply repeat the process of Stage 1 but search for an exact match on forename, surname, DOB and any one of a person’s past postcodes. In the case where we find a single such record, we give the FRS record a match status and assign a match-key based on the postcode number where the match occurred. If the CIS and FRS records agree when we take a person’s fourth recorded postcode on CIS, the assigned match key would be 3.
Table 2 Examples of some (fictitious) historic postcode information
| NINo | CIS_Fname | CIS_Sur | CIS_DOB | CIS_Pcde | CIS_Pcde1 | CIS_Pcde2 | … | CIS_Pcde10 |
|---|---|---|---|---|---|---|---|---|
| AA000001 | Alice | Smith | 01Jan1999 | AA1 1AA | AB2 6BD | AC3 7NM | BL2 1SD | |
| BB000002 | Robert | Jones | 10May2001 | AB2 6BD | AC3 7NM | AA1 1AA | CD2 9LM | |
| CC000003 | Eve | Green | 11Nov1923 | AC3 7NM | AA1 1AA | AB2 6BD | EF9 0LZ |
Stage 3 – Probabilistic Matching
Following the historic matching process, we find that 66% of FRS records link to a CIS record, which leaves 10,000 unmatched records for each year of data. These records may have individually not matched for any number of reasons and we therefore implement a general probabilistic algorithm as described in, for example Sayers, Adrian, Ben-Shlomo, Yoav, Blom, Ashley W. and Steele, Fiona (2015) Probabilistic record linkage. International Journal of Epidemiology. ISSN 03005771.
At the heart of any probabilistic technique lies the “agreement pattern,” Γ, which measures the similarity of two records. For example, if the only variables on a record were forename, the records “Tim” and “Tom” could be assigned Γ=0.66 because they differ by one letter from three. If we calculate the agreement pattern for a pair of records we can calculate the “likelihood ratio”
Equation 1
R=(P(Γ given event M)) ÷ (P(Γ given event U))
This is the ratio of the probability of observing the agreement pattern given the records are a true match to the probability given they are not a match. It is this quantity that we use to score potential links between the FRS and CIS.
We refer the interested reader to the above paper for all the technical details but the essence of the procedure we employ is as follows:
- for each unmatched FRS record, calculate the agreement pattern with each CIS record
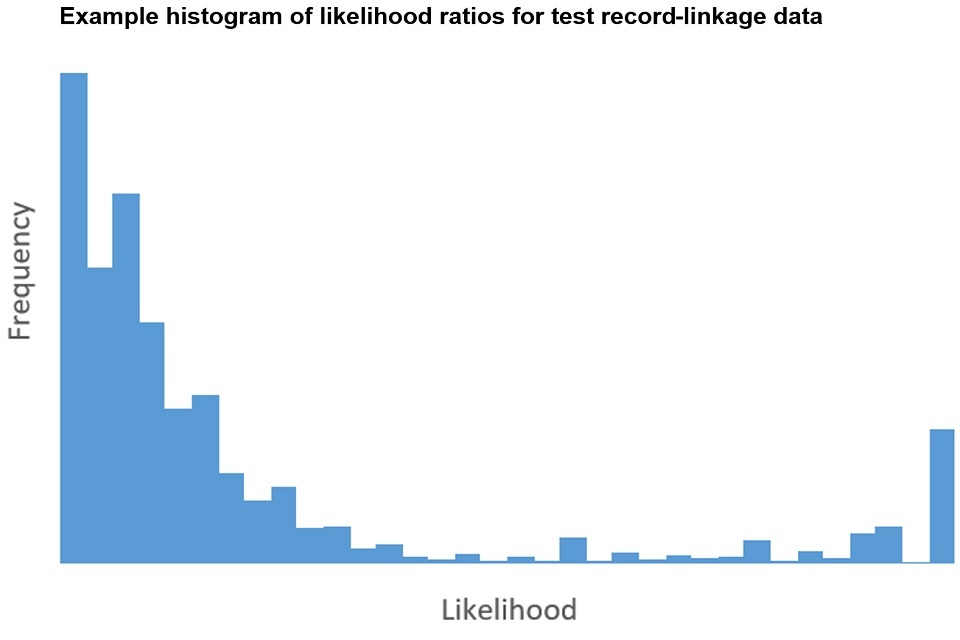
- compute the likelihood ratio from this agreement pattern and the above equation, plot these on a histogram
- select a value of the likelihood ratio that eliminates the majority of non-matches (the left-hand portion of the distribution), while keeping matches (the right-hand portion)
- check that all matches are unique, that means there are no duplicated FRS-identifiers or NINos, any duplicate records are removed from the set of matches
- the remaining records are designated as matches and we assign to each a “match weight” equal to the likelihood ratio
The match weight indicates the confidence we have in the quality of the match, with a higher weight indicating stronger agreement. We can see this intuitively from Equation 1, which shows that the likelihood ratio increases as the probability of the observed agreement pattern, given a true match, becomes larger. Similarly, as the probability of the observed agreement pattern, given a non-match, falls we see that the match-weight also increases.
Following the implementation of the above steps, 89% of FRS records were matched uniquely to a CIS record. An extensive manual review process was undertaken, where a sample of linked records from each step above were analysed visually to assess the link quality. See GUILD: Guidance for Information about Linking Data sets for more information.
Benefit units in this group were categorised as FRS matched cases and the remaining benefit units were categorised as FRS unmatched cases in the PSM entitlement data set
For FRS matched cases, benefit units were data linked to SHBE data for HB and WPLS data for:
- State Pension (SP)
- Pension Credit (PC)
- Disability Living Allowance care component (DLA (Care))
- Attendance Allowance (AA)
- Income Support (IS)
- Income-related Employment and Support Allowance (ESA (IR))
- Income-based Jobseeker’s Allowance (JSA (IB))
While an imperfect assumption, information from administrative sources is always given precedence over survey data with the amount from administrative data overwriting the amount in the PSM entitlement data set for each data linked benefit. This gives a more precise amount of benefit receipt and entitlement for the income-related benefits for estimating the numbers of ENRs.
Note, in addition to PC, data linking to SP was carried out as these two payments are commonly confused by pensioners. By having a more accurate amount for SP, the PSM can then model entitlement to PC more accurately. Data linking to DLA (Care) and AA were carried out as amounts for these benefits are commonly under-reported in the FRS. Accurate amounts for these benefits helps to improve the accuracy of the PC entitlement modelling as receipt of these benefits can indicate that an additional amount should be added to the appropriate minimum guarantee level in PC.
Statistical tests were carried out to determine whether characteristics of FRS matched cases had changed when the methodology was originally developed in FYE 2013. It was concluded that the characteristics (family type, rental sector and employment status) were not statistically different across the years. Therefore, any changes seen in the number of ENRs between FYE 2010 and FYE 2013 could not be attributed to changes in the characteristics of the proportion of FRS matched cases of all the benefit units.
Similar tests were carried out on the non-FRS cases or unmatched group at the same time, when the methodology was being developed. It was concluded that applying any assumptions to the non-FRS cases or unmatched group based on information seen in the FRS matched cases group would not be statistically valid and would increase uncertainty surrounding the ENR estimates.
16. Estimating Entitled Non-Recipients (ENRs)
Overview
The DWP administrative data sources do not record information on those entitled to a benefit but not receiving it (ENRs). Therefore, a combination of an adjusted entitlement data set from the DWP’s PSM, which includes some linking to WPLS administrative data, and reported receipt data from the FRS are used to produce the average number of ENRs and average amounts unclaimed.
To produce the ENR estimates, some bespoke adjustments are made to the PSM entitlement data set.
FRS matched cases are families where it was possible from the data provided to accurately match to administrative data.
For benefit units that aren’t FRS cases or were not able to be data linked, modelled PSM entitlement for the benefit is compared to FRS reported receipt of the benefit.
Each benefit unit is categorised into one of the following groups. They are:
- entitled not receiving (ENRs)
- entitled receiving (ERs)
- not entitled, not receiving (NENRs)
From this, the average numbers of ENRs and the average amounts unclaimed are estimated, along with 95% confidence intervals to reflect uncertainty. These estimates are combined with the receipt estimates to produce the lower bound, central and upper bound take-up estimates.
It should be noted that, if existing, any ‘non-entitled recipients’ are assumed to be entitled to the benefits they get.
The PSM entitlement dataset
For each financial year, the PSM produces a UK-based entitlement data set. Characteristics are taken from the FRS and the PSM models entitlement to each of the income-related benefits by applying the tax and benefit system rules to each benefit unit. The data set retains reported FRS characteristics such as family type, age, marital status, tenure type and employment status, but the modelled entitlement amount of income-related benefit is used and this may differ from the reported FRS amount.
The PSM models UC entitlement by using internal DWP forecasts to move a proportion of those entitled to other benefits onto UC. Those modelled as being entitled to UC are not included in the ENRs for any of the benefits.
Where a benefit unit has a member aged over the PC qualifying age but under State Pension age, or one member is above PC qualifying age and one member below (a mixed age couple), the PSM models entitlement to PC only. This is a simplification of the benefit rules, as these benefit units can choose to claim PC or one of IS or ESA (IR). However, analysis of DWP administrative data shows that the vast majority of these benefit units would choose to claim PC. Figures from February 2010 (at which point the qualifying age for PC was 60), show that there were 432,000 recipients of PC aged 60 to 64, compared with 25,000 recipients of ESA (figures were derived from the DWP Tabtool which has since been replaced by Stat-Xplore).
Adjusting the PSM entitlement dataset
The bespoke adjustments made to the PSM entitlement dataset are:
- exclusion of Northern Ireland benefit units
- removal of National Minimum Wage (NMW) or National Living Wage (NLW) adjustment
- grossing-up to Great Britain control totals
- data linking to DWP administrative receipt records for FRS matched cases
- inclusion of FRS reported receipt and awaiting the outcome of claim information for each income-related benefit
a) Exclusion of Northern Ireland benefit units
The take-up estimates are only provided for Great Britain. Therefore, the UK- based PSM entitlement data set is adjusted to remove any Northern Ireland benefit units, so that the average number of ENRs and average amounts unclaimed are on the same basis as the receipt estimates.
b) Removal of NMW and NLW adjustment
The PSM includes an adjustment for the NMW or NLW. This adjustment was not included in the PSM entitlement data sets used for the take-up statistics, that is, no adjustment is made to the earnings data reported in the FRS.
c) Grossing-up to Great Britain control totals
Grossing-up is the term usually given to the process of applying factors to sample data so that they yield estimates for the overall population. The simplest grossing system would be a single factor for example the number of households in the population divided by the number in the achieved sample of a survey. However, surveys are normally grossed by a more complex set of grossing factors that attempt to correct for differential non-response at the same time as they scale up sample estimates.
The bespoke grossing control variables, in addition to population grossing control variables, along with their breakdowns and data sources used to gross up the PSM entitlement data set to the GB population are:
| Grossing Control Variable | Breakdowns Used | Data Source |
|---|---|---|
| Household numbers | Country and region | Housing statistics – Ministry of Housing, Communities and Local Government (MHCLG) |
| Housing tenure (household level) | None – GB level only | Housing statistics – MHCLG |
| Council Tax bands (household level) | None – GB level only | Council Tax statistics – MHCLG, Scottish Government and Welsh Government |
| Employment (individual level) | Age and gender | Employment caseloads – Office for Budget Responsibility (OBR) using Labour Force Survey data |
| Caseloads for non-income related benefits (individual or benefit unit level) | Age and gender | Administrative data for Attendance Allowance (AA), Disability Living Allowance (DLA) and Personal Independence Payment (PIP), IB and SDA and Contributory ESA – DWP |
There are issues unique to using the PSM as a model to estimate entitlement that go beyond standard sample to grossing caveats. The PSM grosses to benefit totals, based on numbers actually receiving benefits. It is not possible to gross to entitlement figures because it is not known what these are. This is why we use a model to estimate them. It is known that benefit recipients are typically under-represented in the FRS, so these tend to have larger grossing factors. It is possible that entitled non-recipients are over or under-represented by large amounts and grossing cannot correct for this. This is an unknown, but the implicit assumption is that after grossing ENRs are accurately represented.
Grossing to a total for chosen variables can also distort sub-population variables that are not grossed. It is possible that ENR totals are subject to this kind of distortion.
d) Data linking to DWP administrative receipt records for FRS matched cases
There is a known issue of under-reporting benefit receipt in the FRS. Therefore, to improve the accuracy of identifying the number of ENRs estimated in the PSM entitlement data set, data linking allows recorded benefit amounts in DWP administrative data to replace reported FRS receipt or modelled PSM entitlement in the PSM entitlement data set.
e) Inclusion of FRS reported receipt and awaiting the outcome of a claim information for each income-related benefit
The final adjustment made to the PSM entitlement dataset is to include some more information from the FRS:
- where there is reported receipt of benefit, this information will be used along with PSM modelled entitlement to identify which benefit units are modelled to be entitled but not receiving
- when awaiting an outcome of a claim, if at the point of the FRS interview, a benefit unit is awaiting an outcome of claim, the PSM models them to be an ENR as they are not reporting receipt
- any subsequent receipt of the benefit following the outcome that could be picked up if the benefit unit is a FRS matched case and they would be modelled as an entitled recipient – however for non-FRS cases or unmatched cases, they could remain an ENR
- it is assumed that if the benefit unit reports they are awaiting an outcome of a claim and the PSM models them as entitled, it is likely that they would have gone on to receive the benefit and are categorised as entitled recipients
Estimating ENRs
Following the adjustments to the PSM data set, each benefit unit is categorised into one of the following groups. They are:
- entitled not receiving (ENRs)
- entitled receiving (ERs)
- not entitled, not receiving (NENRs)
FRS matched cases who are shown to be receiving benefit according to the data linking to administrative data are automatically allocated to the ER group. FRS matched cases who are not receiving benefit according to the data linking to administrative data are classed as either ENRs or NENRs depending on whether they are modelled as entitled according to the PSM.
For benefit units that are non-FRS cases or unmatched, modelled PSM entitlement to the benefit is compared to FRS reported receipt of the benefit to determine whether they are an ER, ENR or NENR. If the benefit unit reports they are awaiting an outcome of a claim and the PSM models them as entitled to the benefit, it is assumed that the benefit unit is an ER.
Finally, the average numbers of ENRs and the average amounts unclaimed are estimated by specific types and breakdowns for each income-related benefit. Due to small sample sizes for certain characteristics, further detailed breakdowns are not possible.
Uncertainty in the receipt and ENR Estimates
Overview
The receipt and ENR estimates are fully reliant on the accuracy of the data used and any subsequent adjustments, evidence-based assumptions and modelling. Any errors in the data or these processes will affect uncertainty around the estimates.
Uncertainty in the receipt estimates is assumed to be marginal due to the processes in place to produce accurate DWP administrative data for publication as statistics.
For the ENR estimates, the level of uncertainty is higher as they are reliant on reported information from FRS sample data and the subsequent modelling of entitlement in the PSM. Therefore, the estimates are affected by known areas of uncertainty surrounding survey results and using a model to estimate ENRs. While processes are in place to limit this uncertainty, such as the data cleaning of FRS responses to produce the published FRS data set and continuous development of the PSM methodology, confidence intervals are used to present the uncertainty in the final take-up estimates. Note that confidence intervals only estimate the sampling error, the difference between the sample and population values, and do not include other forms of uncertainty.
Areas of uncertainty
a) Use of administrative data
It is assumed that DWP administrative data are an accurate record of benefit receipt. In particular, we accept all benefit recipients as being entitled with any ‘non-entitled recipients’ ignored for the purpose of this publication. However, the data are subject to error at all stages of the process of data collection: from recipients giving inaccurate information, to input error, to data cleaning and analysis.
Adjusting the PC and IS and ESA (IR) receipt estimates to remove any non-private households introduces a small amount of uncertainty. This is because it is assumed that the proportions of private households of all households for the 5% scan of the benefit recipients are representative of all the benefit recipients.
b) Use of survey data
The size of the FRS sample and the way in which the sample is selected are carefully designed to ensure that it is representative of the UK as a whole, whilst bearing in mind practical considerations like time and cost constraints.
Survey results are always estimates, not precise figures. This means that they are subject to a level of uncertainty which can affect how changes, especially over the short term, should be interpreted.
The FRS is subject to the nuances of using a survey, including:
- the sampling error: 2 different random samples from one population are unlikely to give exactly the same survey results, which are likely to differ again from the results if the whole population was surveyed- this level of sampling error varies to a greater or lesser extent depending on the level of breakdowns at which results are presented
- the non-response error: The FRS response rate in FYE 2019 was 50% – in an attempt to correct for differential non-response, estimates are weighted using population totals
- the survey coverage: The FRS covers private households in the United Kingdom, therefore, individuals in nursing or retirement homes, for example, will not be included - this means that figures relating to the most elderly individuals may not be representative of the United Kingdom population, as many of those at this age will have moved into homes where they can receive more frequent help
- the survey design: The FRS uses a clustered sample design to produce strong estimates at region level – the FRS is therefore not suitable for analysis below this level
- the sample size: The FRS has a relatively large sample size for a household survey, from April 2011, the target achieved GB sample size for the FRS was reduced by 5,000 households, resulting in an overall achieved sample size for the UK of around 20,000 households for FYE 2012 onwards
c) Under-reporting receipt and benefit confusion in the FRS
There is a known issue of benefit under-reporting in the FRS. Sometimes the FRS respondents confuse which benefit they are receiving. For example, there is often confusion over State Pension (SP) and PC payments. A benefit unit may not realise they are receiving PC and report the overall payment they receive as SP. Therefore, there is an over-reporting of the SP amount paid and under-reporting of the PC amount paid. Processes are in place for the FRS interviewer to check these responses against other questions, if there is a discrepancy. Further data-cleaning is carried out once the survey is filled in to check whether responses from the benefit unit taken across the questionnaire are consistent. However, even with these processes in place, there remains scope for uncertainty and remaining under-reporting of benefit receipt.
As a result, it is possible that the PSM categorises a benefit unit into the wrong group. In the example above, the benefit unit could be modelled as an ENR, despite receiving PC as they did not report receipt or give an amount in the FRS interview. In other situations, the benefit unit might not report important information which is used to identify which group they should be allocated to, such as receiving Attendance Allowance for the estimation of PC and HB entitlement.
To reduce under-reporting and benefit confusion, data linking allows recorded benefit amounts in DWP administrative data to replace reported FRS receipt or modelled PSM receipt in the PSM entitlement data set. This was possible for 89% of FRS respondents in FYE 2019.
d) Data linking for FRS matched cases only
As noted above 89% of benefit units are data linked in the PSM entitlement data set. As a result, this adjustment partially corrects for under-reporting and confusion of benefit receipt in the FRS.
Where a benefit unit might have been modelled as an ENR but data linking indicated that they were receiving a payment, the benefit unit would be categorised as an entitled recipient (ER) and as a result the average numbers of ENRs would reduce. However, where benefit units are non-matched cases, it is possible for it to remain an ENR but actually receive the benefit.
Additionally, there is not enough information on the FRS to identify whether the family is being sanctioned while receiving ESA (IR). In this instance, a family could report zero payment of ESA (IR) but the PSM model them as entitled, resulting in them being categorised as an ENR. Data linking would overcome this if the family was a FRS matched case, as the recorded benefit payment would be used and the family would be categorised as an ER. However, if the family was in the non-FRS cases or unmatched group, they would remain as an ENR.
e) Imperfect modelling of entitlement
Imperfect modelling of the tax and benefit system rules in the PSM could result in:
- over-statement of entitlement – this is where the benefit unit is incorrectly modelled to be entitled and or the modelled amount is too high
- under-statement of entitlement – this is where the benefit is incorrectly modelled to not be entitled and or the modelled amount is too low
Processes are in place to regularly review and develop the modelling to ensure the PSM accurately represents the tax and benefit system rules for each year. However, as it is heavily reliant on reported information in the FRS, the PSM inherits the areas of uncertainty of the FRS.
Furthermore, it is not possible to perfectly model ESA eligibility because there are no data available for the PSM to use on the outcomes of individual Work Capability Assessments or doctors’ certificates that people would have if they applied to claim ESA
f) Inaccurate grossing-up to the GB population
The PSM grossing method uses a number of control variables to ensure that various characteristics of the benefit units are considered in deriving the grossing factors. But it is another potential source of uncertainty as it does assume that many of the characteristics of the ENR sample are representative of all GB benefit units.
Confidence intervals for the ENR Estimates
Overview
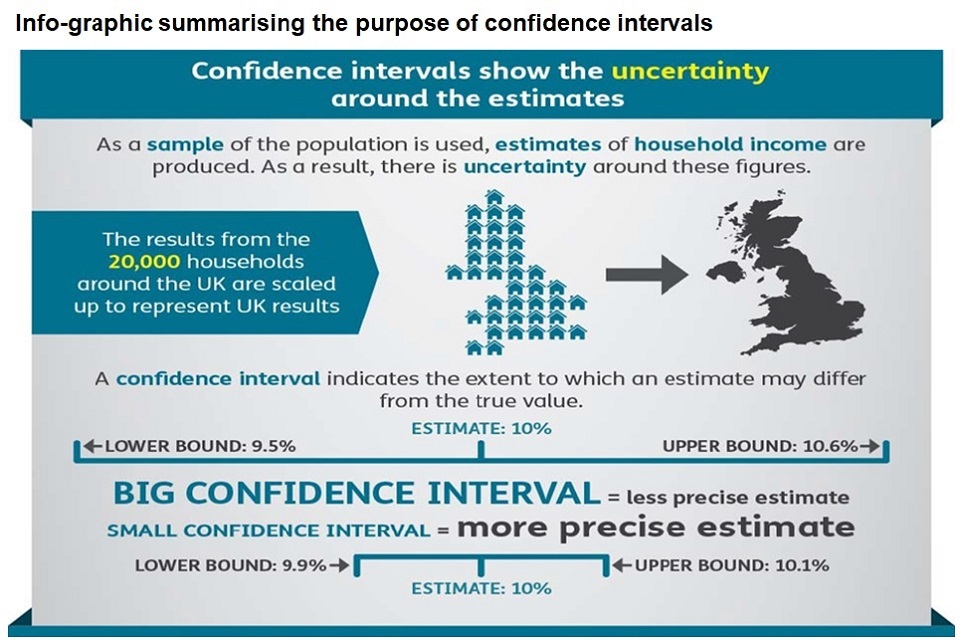
As the ENR estimates are heavily reliant on the FRS sample, the level of uncertainty can be estimated by exploring how that estimate would change if many survey samples were drawn for the same time period instead of just one. From this, a range around the estimate can be defined, known as a confidence interval. This indicates how likely it is that the real value that the survey is trying to measure lies within that range. Confidence intervals are typically set up to be 95% certain that the true value lies within the range. This is known as a 95% confidence interval.
Estimates for the entire UK population are calculated using a small sample of 20,000 households which are then scaled up. This leads to uncertainty in the figures. Confidence intervals are then used to show how much the estimate may differ from the true value. Bigger confidence intervals show less precise estimates and smaller confidence intervals show more precise estimates.
Method
The ‘variance estimation based on sample design’ method was used to produce confidence intervals for the take-up estimates as:
- the sampling frame of the FRS is taken into consideration in this method
- it is appropriate when calculating the prevalence of a characteristic in a population, such as those entitled and not receiving
The ENR estimates are derived from the adjusted PSM entitlement data set rather than the published FRS data set. However, this should not affect the sampling error, as this occurs at the stage of the sampling, and therefore any modelling of FRS sample benefit units in the PSM should not affect the confidence intervals. The confidence intervals provide a lower and upper bound for the average number of ENRs and the average amount unclaimed. These estimates, along with the central estimates are incorporated into the take-up formulae.
17. Estimating take-up rates
Overview
The take-up rates are based on the following definition:
(In Receipt) ÷ (In Receipt + Entitled Not in Receipt)
Where the take-up rate is defined as the proportion receiving the benefit of all those entitled (that is those receiving the benefit and those who are entitled but not receiving the benefit).
Caseload and expenditure take-up rates are estimated using 95% confidence intervals. A central estimate for take-up is calculated using the central estimate of those not in receipt. The lower and upper take-up bounds are calculated using the upper and lower bound estimates of those not in receipt.
Caseload formulae
The formulae for lower bound, central estimate and upper bound are as follow.
| Caseload formula | |
|---|---|
| Lower Bound | Average number of benefit units receiving benefit ÷ (Average number of benefit units receiving benefit + Upper average number of ENR benefit units) |
| Central Estimate | Average number of benefit units receiving benefit ÷ (Average number of benefit units receiving benefit + Central average number of ENR benefit units) |
| Upper Bound | Average number of benefit units receiving benefit ÷ (Average number of benefit units receiving benefit + Lower average number of ENR benefit units) |
Expenditure formulae
For the expenditure formulae, the average weekly amounts claimed (received) and unclaimed (not received) are converted to yearly amounts.
The expenditure take-up formulae are as follow.
| Expenditure formula | |
|---|---|
| Lower Bound | Total amount of benefit received ÷ (Total amount of benefit received + Upper total amount of benefit not received) |
| Central Estimate | Total amount of benefit received ÷ (Total amount of benefit received + Central total amount of benefit not received) |
| Upper Bound | Total amount of benefit received ÷ (Total amount of benefit received + Lower total amount of benefit not received) |
The formulae for the total amount of benefit received and not received are as follow.
| Total amount of benefit received formula | Total amount of benefit not received formula | |
|---|---|---|
| Lower Bound | Average number of benefit units receiving benefit × Average amount of benefit received × Week to Year Factor | Upper total = Upper average number of benefit units ENRs × Upper average amount not received × Week to Year Factor |
| Central Estimate | Average number of benefit units receiving benefit × Average amount of benefit received × Week to Year Factor | Central total = Central average number of benefit unit ENRs × Central average amount not received × Week to Year Factor |
| Upper Bound | Average number of benefit units receiving benefit × Average amount of benefit received × Week to Year Factor | Lower total = Lower average number of benefit units + ENRs × Lower average amount not received × Week to Year Factor |
18. Glossary
This glossary gives a brief explanation for each of the key terms used in the Take-up publication. Further details on these definitions, are available on request from the DWP Take-up team at irb.takeup@dwp.gov.uk
A link to the income and earnings Glossary produced by the ONS is here: Glossary.
Glossary of terms used in this publication
Average
See Mean
Benefit
Financial support from the government. Most of these benefits are administered by DWP. The major exceptions are Housing Benefit and Council Tax Reduction, which are administered by local authorities. Child Benefit is administered by HMRC.
Benefit Cap
A limit on the total amount of benefit a household can get. The benefit cap does not apply to those above State Pension age.
Benefit unit
A single adult or married or cohabiting couple, and any dependent children. Examples of Benefit Units:
- pensioner couple: Benefit units headed by a couple where the head of the benefit unit is over State Pension age – this differs from definitions used in the Households Below Average Income, Income Dynamics and Pensioners’ Incomes Series reports, which define a benefit unit as a pensioner couple if either the head of the benefit unit or their partner is over State Pension age
- single male pensioner: Benefit units headed by a single male adult over State Pension age
- single female pensioner: Benefit units headed by a single female adult over State Pension age
- couple with children: Benefit units containing two adults, headed by a non-pensioner, with dependent children
- couple without children: Benefit units containing two adults, headed by a non-pensioner, with no dependent children
- single with children: Benefit units containing a single adult (male or female), headed by a non-pensioner, with dependent children
- single without children: Benefit units containing a single adult (male or female), headed by a non-pensioner, with no dependent children
Confidence interval
A measure of sampling error. A confidence interval is a range around an estimate which states how likely it is that the real value that the survey is trying to measure lies within that range. A wider confidence interval indicates a greater uncertainty around the estimate. Generally, a smaller sample size will lead to estimates that have a wider confidence interval than estimates from larger sample sizes. This is because a smaller sample is less likely to reflect the characteristics of the total population and therefore there will be more uncertainty around the estimate derived from the sample. Note that a confidence interval ignores any systematic errors that may be present in the survey and analysis processes.
Claimant
A person making a claim for a benefit.
Entitled
A family is said to be entitled to receive a benefit if they satisfy the qualifying conditions for that benefit.
Entitlement
Entitlement is the amount an entitled family is estimated to be paid in benefit, according to modelling.
Entitled Non-Recipient (ENR)
A family that is modelled to be entitled to a benefit but is not receiving it is said to be an ENR.
Entitled Recipient (ER)
A family that is modelled to be entitled to a benefit and is receiving it is said to be an ER.
Non-Entitled Non-Recipient (NENR)
A family that is modelled to be not entitled to a benefit and is not receiving it is said to be an NENR.
Family
See Benefit Unit
Household
One person living alone or a group of people (not necessarily related) living at the same address who share cooking facilities and share a living room or sitting room or dining area. A household consists of one or more benefit units.
Income-related Benefit
Benefits where a potential claimant’s income is taken into account when deciding whether they are entitled to the benefit.
Jobseekers Allowance
A working age benefit that is paid to help people while they look for work.
Local Housing Allowance
Used to calculate Housing Benefit for tenants in the private rented sector.
Mean
The mean weekly amount claimed or unclaimed is the average, found by adding up the amount for each benefit unit in a population and dividing the result by the total number of benefit units.
Means tested Benefits
Median
The median weekly unclaimed amount is the value that divides the population of entitled non-recipients, when ranked by their modelled entitlements, into two equal-sized groups. In other words, the median is the exact middle point where half the entitled non-recipients have larger unclaimed amounts and half have smaller unclaimed amounts.
Minimum Income Guarantee
A system of social welfare provision that guarantees that all citizens or families have an income sufficient to live on, provided they meet certain conditions.
Mixed age couple
A couple where one member is above State Pension age and the other is below.
National Living Wage
The minimum wage for workers aged 25 and over.
National Minimum Wage
The minimum wage for workers ages 16 to 24.
Non Dependant Deductions
A reduction in Housing Benefit when an adult friend or family member lives with the claimant.
Non-Means tested benefits
Benefits where a potential claimant’s income is not taken into account when deciding whether they are entitled to the benefit.
Percentile
A measure indicating the value below which a given percentage of observations in a group of observations falls.
Private Rented Sector
Properties being rented which are owned by a landlord.
Sampling error
The uncertainty in the estimates which arises from taking a random sample of the household population. The likely size of this error for a particular statistic can be identified and expressed as a confidence interval.
Social Rented Sector
Properties being rented which are owned by the local council or a housing association (not-for-profit organisations that own, let and manage rented housing).
Spare Room Subsidy
A reduction in Housing Benefit when the recipient lives in a property in the social rented sector that is deemed to have at least one spare bedroom.
State Pension
The State Pension is a payment made to qualifying individuals who have reached the State Pension age.
State Pension age
State Pension age is the earliest age you can start receiving your State Pension.
Statistical significance
This is a technical concept that says whether a reported change is likely to have arisen only by chance due to variations in the sampling.
Support for Mortgage Interest
A loan to provide help on paying interest on mortgages or interest on other loans for home purchase, repair and improvements. To qualify for a Support for Mortgage Interest loan one of the following benefits must be received:
- Income Support
- Income-based Jobseeker’s Allowance (JSA)
- Income-related Employment and Support Allowance (ESA)
- Universal Credit
- Pension Credit
Tax Credits
Working tax credits and Child tax credits are paid by HMRC. Tax credits are being phased out, as they are replaced by Universal Credit.
Tenant
A person who rents a property in the social rented sector or private rented sector.
Work Capability Assessment
An assessment to determine whether a health condition or disability affects an individual’s ability to work and if so to determine whether any extra amount of Universal Credit and ESA should be paid.
Working age benefit
A benefit paid to a working age person.
Working age person
A person aged between 16 and State Pension age.
Universal Credit
A working age benefit for those in or out of work. This benefit is replacing the following six benefits
- Housing Benefit
- Child Tax Credit
- Income Support
- Working Tax Credit
- Income-based Jobseeker’s Allowance
- Income-related Employment and Support Allowance