Statistical release: July to September 2021 (quarter 2, financial year 2021 to 2022)
Updated 27 July 2022
Applies to England, Scotland and Wales

© Crown copyright 2022
This publication is licensed under the terms of the Open Government Licence v3.0 except where otherwise stated. To view this licence, visit nationalarchives.gov.uk/doc/open-government-licence/version/3 or write to the Information Policy Team, The National Archives, Kew, London TW9 4DU, or email: psi@nationalarchives.gov.uk.
Where we have identified any third party copyright information you will need to obtain permission from the copyright holders concerned.
This publication is available at https://www.gov.uk/government/statistics/housing-benefit-statistics-on-speed-of-processing-for-2021-to-2022/statistical-release-july-to-september-2021-quarter-2-financial-year-2021-to-2022
Housing Benefit (HB) is an income related benefit that is intended to help meet housing costs for rented accommodation.
This summary contains statistics on the average time taken (speed of processing) to process new HB claims and change of circumstances to existing HB claims for Great Britain. The average used is the mean and is measured in calendar days, rounded to the nearest day.
Annual data (covering the year up to each point) is included to illustrate the trend over time. This data is then averaged over a rolling 12-month period. Throughout this summary, this will be referred to as year-end figures. For example, at quarter 2 2021 to 2022, the year-end figures would be calculated using data from the period quarter 3 2020 to 2021 to quarter 2 2021 to 2022, as this covers a full one year. These figures smooth the seasonality so that the overall trend can be seen. For year-end speed of processing figures, these are measured in calendar days, rounded to the nearest day.
1. Main stories
The main stories are:
-
the average speed of processing for new HB claims has remained stable at 20 calendar days since the previous quarter, however overall year-end figures show an upward trend over the last year. Historically year-end figures for change of circumstances to an existing HB claim show a gradual downward trend, however the latest quarter is 8 calendar days, one day higher than the previous quarter and two days higher than the same quarter a year earlier
-
the rolling average year-end volume of change of circumstances to existing HB claims has continued to decrease when compared to the same quarter a year earlier, and the year-end volume of new HB claims has remained stable when compared to the same quarter a year earlier
-
at the Local Authority (LA) level for the latest quarter, LAs had an average speed of processing between 4 and 78 calendar days for new HB claims and an average speed of processing between 1 and 35 calendar days for change of circumstances to existing HB claims
2. Volumes of new HB claims and change of circumstances to existing HB claims
On average, LAs process a greater number of change of circumstances to existing HB claims than new HB claims. In quarter 2 2021 to 2022, 7% of claims processed in Great Britain (GB) were new HB claims and the remaining 93% were change of circumstances to existing HB claims.
Volume of HB Claims in GB, quarter 2 2021 to 2022
| Type of Claim | Number of Claims processed |
|---|---|
| New HB Claims | 86,000 |
| Change of Circumstances to existing HB Claims | 1,100,000 |
During quarter 2 2021 to 2022, there were 86,000 new HB claims and 1.1 million change of circumstances to existing HB claims processed in GB.
For new HB claims, volumes have remained stable since last quarter, and there has been a decrease of 5,200 (6%) when compared to the same quarter a year earlier (quarter 2 2020 to 2021).
For change of circumstances to existing HB claims, there has been a decrease of 500,000 (31%) since last quarter and a decrease of 92,000 (7%) when compared to the same quarter a year earlier.
Year-end figures of change of circumstances to existing HB claims show volumes are continuing to decrease
Average number of change of circumstances to existing HB claims processed (quarterly and year-end volumes) quarter 1 2012 to 2013 to quarter 2 2021 to 2022
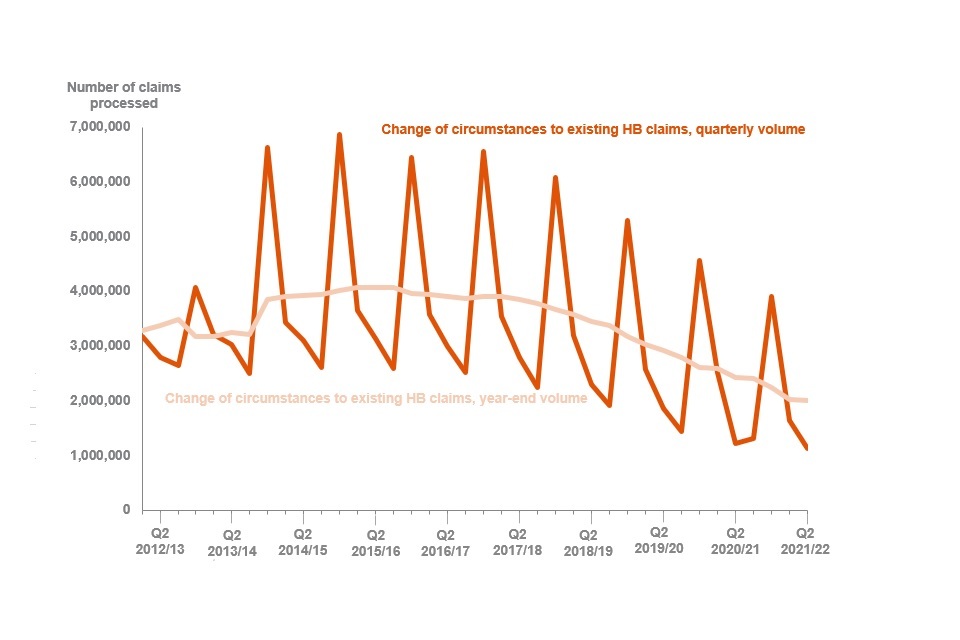
Initially, rolling average year-end figures (hereafter referred to as ‘year-end’) showed an increase in the volume of change of circumstances to existing HB claims, however, since quarter 2 2015 to 2016 (4.1 million), this volume has continued a downward trend to 2.0 million in quarter 2 2021 to 2022.
The volume of change of circumstances to existing HB claims decreased from 3.2 million in quarter 1 2012 to 2013 to 1.1 million in quarter 2 2021 to 2022.
In quarter 4 each year, the volume of change of circumstances to existing HB claims increases sharply, due to the end of the financial year before the uprating of rent. In the following quarter (quarter 1) there is a dip, and then a less marked dip from quarter 1 to quarter 2. Quarter 2 2021 continues that trend showing a 31% (500,000) decrease in the volume of change of circumstances to existing HB claims compared to the previous quarter.
The volume of new HB claims has remained stable in recent quarters
Average number of new HB claims processed (quarterly and year-end volumes) quarter 1 2012 to 2013 to quarter 2 2021 to 2022
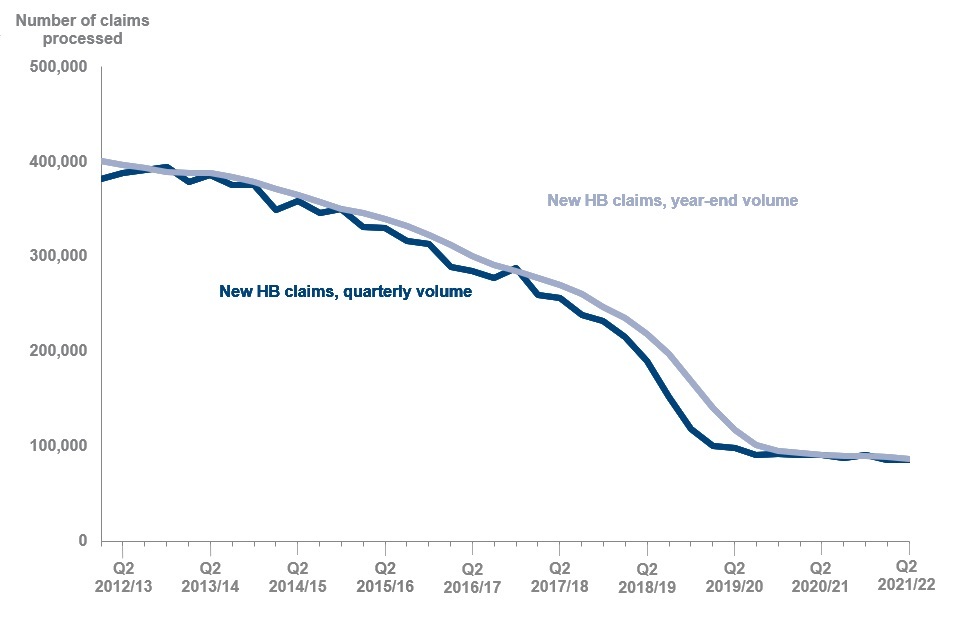
The volume of new HB claims stood at 390,000 in quarter 4 2012 to 2013 and then decreased to 86,000 in quarter 2 2021 to 2022. This decreasing trend is also reflected in the year-end figures for new HB claims from 400,000 in quarter 1 2012 to 2013 to 88,000 in quarter 2 2021 to 2022. Since quarter 3 2019 to 2020, the volume of quarterly new HB claims has been stable.
The changes in volume of both new HB claims and change of circumstances to existing HB claims are due to the impact of the UC roll-out, which has also affected figures reported at the LA level. Both volumes are decreasing, however, at different rates, because of the change in the types of claims being processed. For example, changes to a claimant’s circumstances may lead to the claimant being moved to UC, however, there are a small number of people that are still able to apply for HB, including pensioners, whom have fewer changes to declare. Read about who can get Housing Benefit. It should be noted that care should be exercised when interpreting data at a LA level in the accompanying data tables.
At quarter 2 2021 to 2022:
- 93% of all HB claims processed in GB were change of circumstances to existing HB claims, which is the same as in the same quarter a year earlier
- 7% of all HB claims processed in GB were new HB claims, also the same as the same quarter a year earlier
The proportion of new HB claims, compared to change of circumstances to existing HB claims, continues to remain stable
Percentage of claims processed by type (year-end figures) quarter 1 2012 to 2013 to quarter 2 2021 to 2022
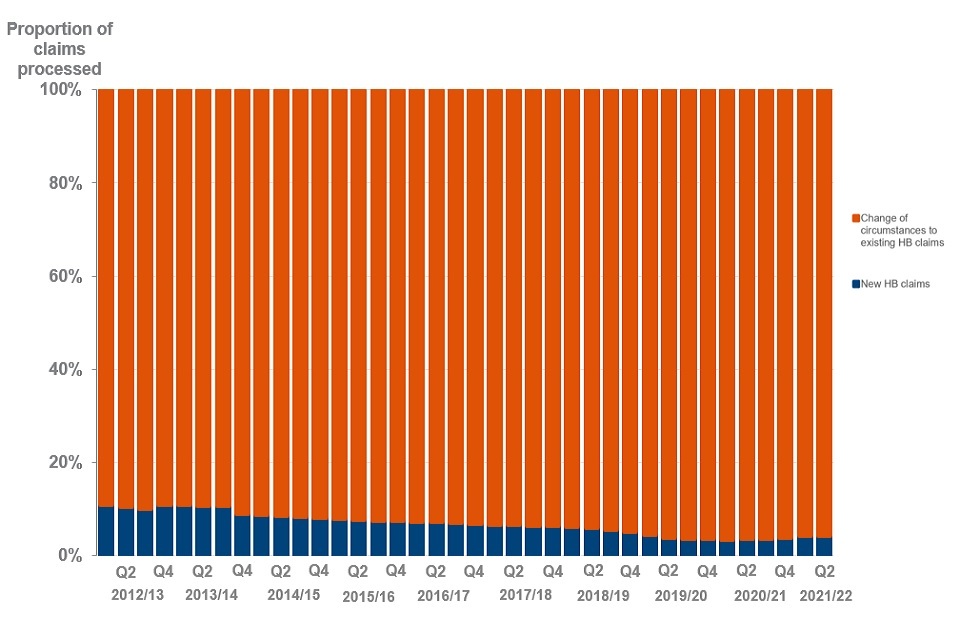
Note: Figures based on year-end data which are calculated using a quarterly rolling average over each annual period. Corrections have been made to the year-end methodology for the quarter 2 2021 to 2022 publication. See section 6 for more information about this.
A greater number of change of circumstances to existing HB claims have been processed, compared with new HB claims in GB since 2012 to 2013 to the latest quarter. Using year-end figures to illustrate the trend over time, the proportion of change of circumstances to existing HB claims has continued to gradually increase from 89% in quarter 1 2012 to 2013 to 93% in quarter 2 2021 to 2022. The proportion of new HB claims has gradually decreased from 11% in quarter 1 2012 to 2013 to 7% in quarter 2 2021 to 2022.
For both change of circumstances to existing HB claims and new HB claims since quarter 2 2020 to 2021, the quarterly year-end averages have remained static since the previous quarter at 96% and 4% respectively. This change in trend is driven by stability in the average volume of year-end figures for new HB claims and the overall decreasing volume of year-end figures for change of circumstances to existing HB claims.
3. Average speed of processing
Year-end figures show an increasing trend in the average speed of processing for new HB claims
Average speed of processing data at GB level by claim type (quarterly and year-end figures) for quarter 1 2012 to 2013 to quarter 2 2021 to 2022
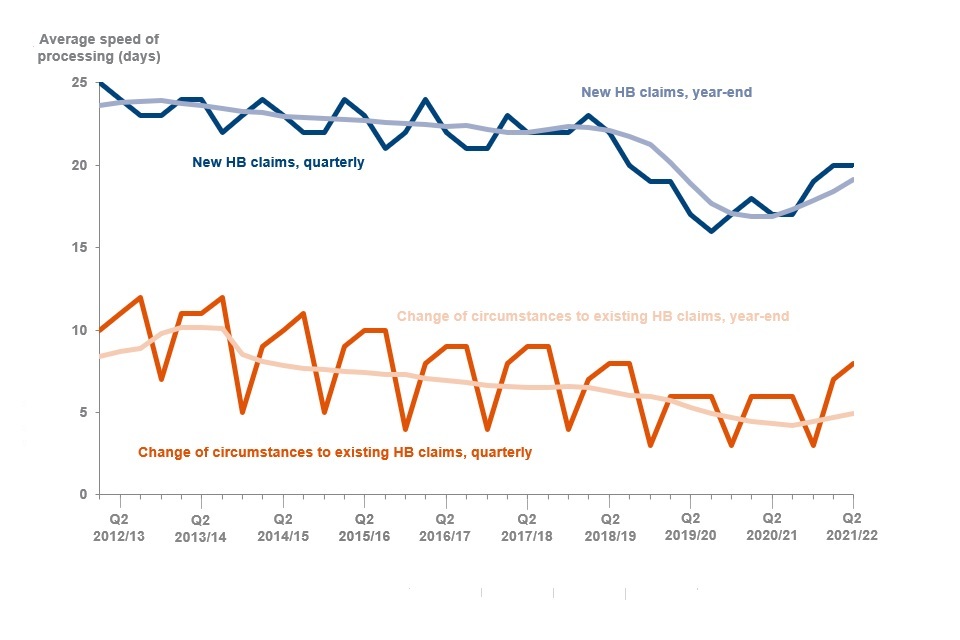
Note: year-end data are calculated using a quarterly rolling average over each annual period. Corrections have been made to the year-end methodology for the quarter 2 2021 to 2022 publication. See section 6 for more information about this.
The average time taken to process a new HB claim during the latest quarter was 20 calendar days. This is three days higher than the same quarter a year earlier and the same as quarter 1 2021 to 2022.
The average number of days taken to process a change of circumstance to an existing HB claim during the latest quarter was 8 calendar days. This is two days higher than the same quarter a year earlier and one day higher than quarter 1 2021 to 2022.
In quarter 4 each year, the volume of change of circumstances to existing HB claims increases, due to the end of the financial year before the uprating of rent. However, the average number of days to process those claims decreases because LAs tend to allocate extra resource to process these changes. In the other quarters, the volume of change of circumstances to existing HB claims decrease and have a higher average speed of processing.
No such seasonal pattern can be seen in the average number of days to process new HB claims.
Average year-end figures stood at an average of 24 calendar days to process new HB claims in quarter 1 2012 to 2013. This decreased to an average of 17 calendar days to process a new HB claim in quarter 4 2019 to 2020, where it remained to quarter 3 2020 to 2021. However, since quarter 4 2020 to 2021, the average speed of processing for new HB claims at year-end has continued to increase to stand at 19 calendar days in the latest quarter.
This is due to the impact of the roll out of UC, as fewer people are now able to open a new HB claim. Read about who can get Housing Benefit.
Average year-end figures for change of circumstances to existing HB claims peaked in quarter 1 2013 to 2014 with an average of 10 days to process. This has steadily continued to decrease to an average of 5 days at year-end in the latest quarter.
Monthly year-end figures show a slight increase over the last year in the average number of days to process new HB claims
Average speed of processing data at GB level by claim type (monthly and year-end) from April 2012 to September 2021
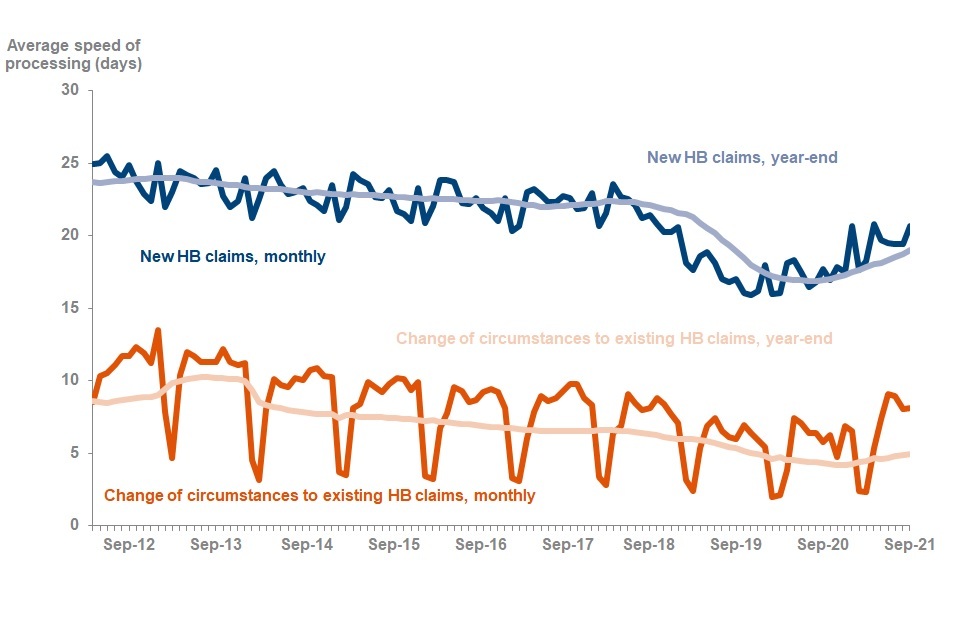
Note: year-end data are calculated using a monthly rolling average over each annual period. Corrections have been made to the year-end methodology for the quarter 2 2021 to 2022 publication. See section 6 for more information about this.
Focusing on monthly average processing times allows us to view trends over shorter time periods. In the latest quarter, the monthly average number of calendar days to process new HB claims was:
- 19 calendar days for July
- 19 calendar days for August and
- 21 calendar days for September
The peak in the monthly average number of calendar days to process new HB claims was 26 calendar days in June 2012. The average number of calendar days to process new HB claims ranged between 16 and 26 days from the period April 2012 to September 2021.
Average year-end figures for the monthly average number of calendar days to process new HB claims decreased steadily from an average of 24 calendar days to process a new HB claim in March 2013, to an average of 20 calendar days to process a new HB claim in July 2019. Since then, the monthly average processing time decreased more quickly to its lowest point at an average of 17 calendar days to process a new HB claim in July 2020. Since August 2020, this figure has continued to increase to 19 calendar days at September 2021.
In the latest quarter, the monthly average number of calendar days to process change of circumstances to existing HB claims was:
- 9 calendar days for July
- 8 calendar days for August and
- 8 calendar days for September
The peak in the monthly average number of calendar days to process change of circumstances to existing HB claims was 13 calendar days in January 2013. The average number of calendar days to process change of circumstances to existing HB claims ranged between 2 and 13 calendar days between April 2012 and September 2021. The lowest monthly average number of calendar days to process change of circumstances to existing HB claims was 2 calendar days, seen for the first time in March 2019, then in February and March of 2020 and 2021. This is at the end of the financial year before the uprating of rent, when LAs tend to allocate extra resources to process change of circumstances to existing HB claims from tenants.
Average year-end figures for the monthly average number of calendar days to process change of circumstances to existing HB claims have decreased gradually over time. In July 2013, the year-end figure for the average time to process change of circumstances to existing HB claims was 10 calendar days, compared with its lowest in November 2020 when it was 4 calendar days. Since December 2020, the year-end figure has continued to increase to 5 calendar days at September 2021.
4. Average speed of processing by Local Authority
Quarterly average number of days to process new HB claims and change of circumstances to existing HB claims can be illustrated at the LA level for GB, for a more detailed breakdown see table 1 of the accompanying data tables.
The average number of days to process change of circumstances to existing HB claims varies by Local Authority
Average speed of processing at local authority level for change of circumstances to existing HB claims for quarter 2, 2021 to 2022
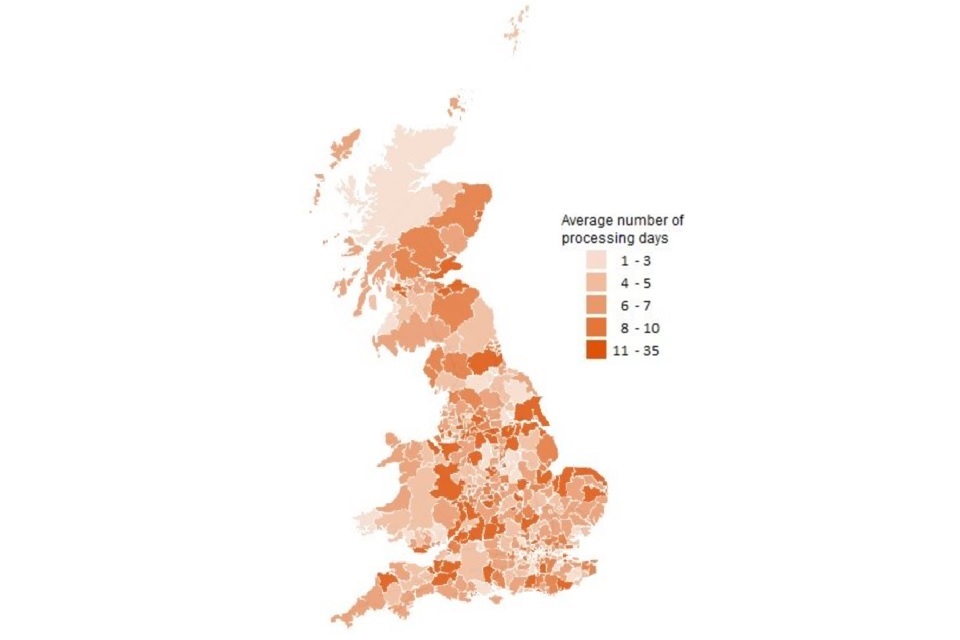
The quarterly average number of days to process change of circumstances to existing HB claims at the LA level ranged from 1 to 35 calendar days during quarter 2 2021 to 2022. 79% (296) of LAs had a quarterly average number of 1 to 10 calendar days while the remaining 21% (80) of LAs took on average between 11 and 35 calendar days to process change of circumstances to existing HB claims during the latest quarter.
The average number of days to process new HB claims varies by Local Authority
Average speed of processing at local authority level for new HB claims for quarter 2, 2021 to 2022
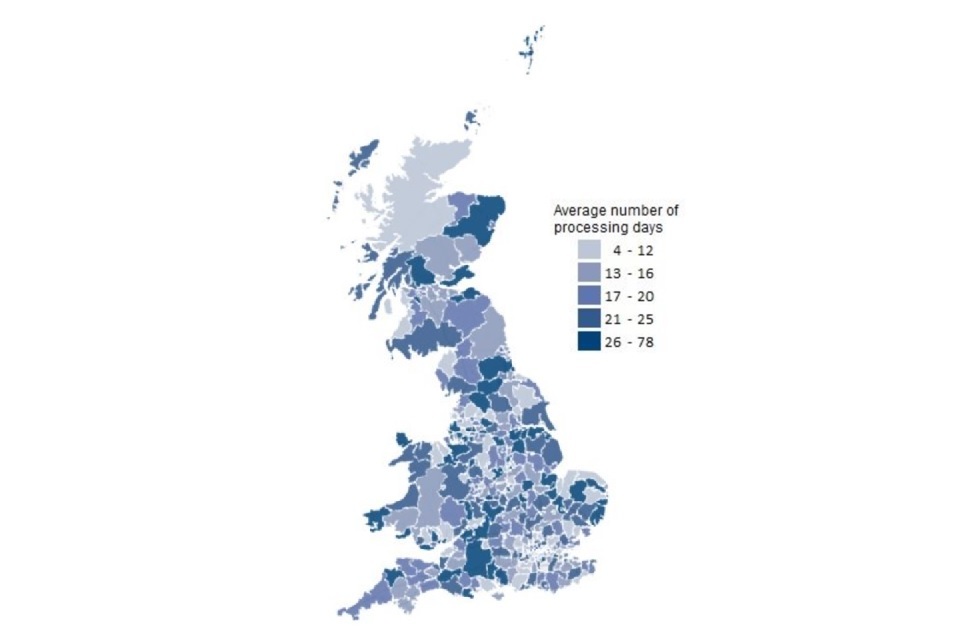
On average a new HB claim takes longer to process than a change of circumstance to an existing HB claim. Detailed figures in the accompanying data tables show greater variability for new HB claims in comparison to change of circumstances to existing HB claims.
The quarterly average number of days to process new HB claims at the LA level ranged from 4 to 78 calendar days during quarter 2 2021 to 2022. 80% (300) of LAs had a quarterly average of 4 to 25 calendar days while almost the remaining 20% (71) of LAs took on average between 26 and 50 calendar days to process new HB claims during the latest quarter. A further three LAs had an average speed of processing between 63 and 78 calendar days to process new HB claims. This was due to technical issues processing new claims, COVID-19 resourcing pressures, an increase in staff absences, and staff training requirements which caused large backlogs. DWP Local Authority Partnership, Engagement and Delivery (LA-PED) colleagues continue to support these LAs.
Variations between the average number of days that each LA takes to process a new HB claim or a change of circumstance to an existing HB claim should be seen in context with changes to operational processes, including reallocating resource due to the ongoing impacts of the COVID-19 pandemic.
5. COVID-19
This summary contains statistics on the number of new HB claims, and change of circumstances to existing HB claims, for the period from July 2021 to September 2021.
The data in this release should be seen in context with operational emergency measures, policy changes and easements due to the COVID-19 pandemic:
Local Housing Allowance
Local Housing Allowance (LHA) rates determine the financial support renters in the private sector are entitled to. LHA rates were increased in response to COVID-19. In April 2020 they were set at the 30th percentile of rents within the local area for each bedroom size up to a maximum of 4 bedrooms. From April 2021 rates have been maintained at their increased levels in cash terms.
Working Tax Credit
The Additional Earnings Disregard (AED) for HB increased by £20 per week in the 2020 to 2021 tax year in response to the COVID-19 pandemic. Working Tax Credit (WTC) entitlement has changed for the 2021 to 2022 tax year and the AED increase of £20 is no longer in effect.
A one-off lump sum payment of £500 has been paid to WTC recipients in the 2021 to 2022 tax year. This was disregarded for HB claimants.
Easements
Easements have been put in place to support LAs during the COVID-19 pandemic in order for them to continue effective delivery of HB services.
6. What you need to know
National, Official and Experimental Statistics are produced in accordance with the Statistics and Registration Service Act 2007 and the Code of Practice for Statistics. This release contains Official Statistics on speed of processing of HB claims for quarter 2, 2021 to 2022. They are compiled following the standards of trustworthiness, quality and public value set out within the Code.
The statistics are released quarterly in April, July, October and January and are sourced from data originally collected via administrative systems, the Single Housing Benefit Extract.
The statistics show speed of processing of new HB claims and change of circumstances to existing HB claims. The volume of new HB claims and change of circumstances to existing HB claims are also included here for context. The total days to process are included in supporting detailed tables that can be viewed in the HB: Statistics on speed of processing collection page including a breakdown at LA level.
Genuine variations between months can occur at a LA level. For example, some of these are caused by time limited issues or localised changes in operational policy. Hence, figures for individual LAs should be interpreted with care.
Quarterly and annual totals may not be entirely consistent with monthly figures. This is because any LAs that do not have data for every month of the quarter or year are not included in the quarterly or annual breakdowns. Average year-end figures include data over the previous 12 months, but there may be inconsistencies where LAs do not have available data for the period.
From April 2013, UC was introduced. Read more about UC. The process began with single claimants and was expanded to other claimant types via the UC Full Service (UCFS). The UCFS rollout was completed in December 2018 and it is now available in every Jobcentre across the UK. Read the rollout schedule for Full Service. UCFS implementation dates for each LA are provided in the accompanying data tables for this release.
The methodology for calculating rolling year-end volumes and averages for the statistical bulletin has been reviewed and revised. Previously we have calculated averages using proportions and averages but are now using actual figures. This has not changed the overall story or trend but there are very slight differences when comparing some graphs with those in previous releases. This change in methodology does not affect the data tables.
Specific Local Authority data issues
HB speed of processing statistics do not include figures for Hackney LA from October 2020, because of a cyber-attack suffered by the LA impacting data provision and, more recently, data quality. Therefore, Speed of Processing figures for Hackney will be omitted in line with our standard approach for handling missing data or data with quality concerns. Analysis for Hackney using historical data shows that this is likely to affect volumes of HB claims by 1% at GB level and around 5% at regional (London) level. The GB and regional level Speed of Processing figures are not impacted by the omission of Hackney data.
HB speed of processing statistics do not include new claims data for Tandridge for September 2021 and Oxford for August and September 2021. These LAs had IT system upgrades and this impacted data provision and data quality. The omission of this data is in line with our standard approach for handling missing data and data with concerns around quality.
7. Where to find out more
Historical data
The historical Housing Benefit and Council Tax Benefit Claims Administration Quarterly Performance Data which is available from 2007 to 2008 are based on clerical returns made by individual LAs. Breakdowns of New HB Claims and Change of Circumstances to existing HB Claims Speed of Processing are available historically, and the New HB Claims Speed of Processing are broadly comparable over time. However, a change in definition for Change of Circumstances to existing HB Claims between 2007 to 2008 and 2009 to 2010 means that direct comparison of this element with Speed of Processing statistics is not meaningful.
Read the background information and frequently asked questions on statistics for the average time taken to process HB (previously right time indicator statistics) on statistics for the average time taken to process HB Claims (previously right time indicator).
Read the DWP statistical summary policies and statements for information about policies and procedures on DWP National and Official Statistics, including a Quality Guideline, Confidentiality and Access Policy Statement, Pre-release Access arrangements and Statement of Administrative Sources.
Other National and Official Statistics
DWP also publish HB Caseload National Statistics. The statistics are published quarterly showing monthly caseload figures which are measured on a claimant basis. Full statistics on HB caseload since August 2013 are available from Stat-Xplore and excel.
Read details of other National and Official Statistics produced by DWP.
Feedback
DWP welcomes feedback on all the statistical publications as it ensures that publications remain relevant to the users. Please use the HB Speed of Processing questionnaire to send us any specific feedback that you may have on this publication. DWP will use the information to:
- target future consultations at interested users
- shape the future direction of statistics development to address user needs; help ensure value for money, whilst giving users a structured way of expressing their views
Completed questionnaires can be returned by e-mail to cbm.stats@dwp.gov.uk. Users can also join the Stats UserNet “Welfare and Benefit Statistics” community. DWP announces items of interest to users via this forum, as well as replying to users’ questions.
Press enquiries should be directed to the DWP Press Office, telephone: 0203 267 5144.
Other enquiries about these statistics should be directed by email to:
Producer of this release: Michael Hatton cbm.stats@dwp.gov.uk
Lead statistician: James Gray james.gray9@dwp.gov.uk
ISBN: 978-1-78659-344-3