Household below average income series: quality and methodology information report FYE 2020
Published 25 March 2021

© Crown copyright 2021
This publication is licensed under the terms of the Open Government Licence v3.0 except where otherwise stated. To view this licence, visit nationalarchives.gov.uk/doc/open-government-licence/version/3 or write to the Information Policy Team, The National Archives, Kew, London TW9 4DU, or email: psi@nationalarchives.gov.uk.
Where we have identified any third party copyright information you will need to obtain permission from the copyright holders concerned.
This publication is available at https://www.gov.uk/government/statistics/households-below-average-income-for-financial-years-ending-1995-to-2020/household-below-average-income-series-quality-and-methodology-information-report-fye-2020
Introduction
The Households Below Average Income (HBAI) report presents information on living standards in the United Kingdom and is the foremost source for data and information about household income, and inequality in the UK. It provides annual estimates on the number and percentage of people living in low-income households. Figures are also provided for children, pensioners, working-age adults and individuals living in a family where someone is disabled.
HBAI statistics incorporate widely-used, international standard measures of low income and inequality. They provide a range of measures of low income, income inequality, and material deprivation to capture different aspects of changes to living standards. The current series started in Financial Year Ending (FYE) 1995 and so allows for comparisons over time, as well as between different groups of the population.
The statistics are based on the Family Resources Survey (FRS), whose focus is capturing information on incomes, and as such captures more detail on different income sources compared to other household surveys. The FRS captures a lot of contextual information on the household and individual circumstances, such as employment, education level and disability. This is therefore a very comprehensive data source allowing for a lot of different analysis.
This report provides detailed information on key quality and methodological issues relating to HBAI data. Information on the FRS methodology is available in the FRS Background Note and methodology.
Comparing official statistics across the UK
All official statistics from the HBAI for the UK and constituent countries in this publication are considered by the Department for Work and Pensions (DWP) as “Fully Comparable at level A” of the UK Countries Comparability Scale (With the exception of measures estimated on a before housing cost (BHC) basis for Northern Ireland, due to differing treatment of water rates).
National Statistics
The regulatory arm of the UK Statistics Authority, the Office for Statistics Regulation, has designated the Family Resources Survey as National Statistics, in accordance with the Statistics and Registration Service Act 2007 and signifying compliance with the Code of Practice for Statistics (the Code).
National Statistics status means that official statistics meet the highest standards of trustworthiness, quality and public value and comply with all aspects of the Code. The Office for Statistics Regulation has undertaken this assessment to consider whether the statistics meet the required standard.
It is DWP’s responsibility to maintain compliance with the standards expected of National Statistics. If DWP becomes concerned about whether these statistics are still meeting the appropriate standards, we will discuss any concerns with the Office for Statistics Regulation. National Statistics status can be removed at any point when the highest standards are not maintained, and reinstated when standards are restored.
Further information about National Statistics can be found on the Statistics Authority website.
Acknowledgements
As in previous years, the DWP would like to thank the Institute for Fiscal Studies (IFS) for the substantial assistance that they have provided in checking and verifying the income data and grossing factors underlying the main results in this edition.
We are also grateful to HM Revenue and Customs (HMRC) for the provision of aggregated data from the Survey of Personal Incomes.
Users and uses
HBAI is a key source for data and information about household income and inequality, and is used for the analysis of low income by researchers and the Government. Users include: policy and analytical teams within the DWP, the Devolved Administrations, other Government departments, local authorities, Parliament, academics, journalists, and the voluntary sector.
The Department for Work and Pensions’ responsibilities include understanding and dealing with the causes of poverty rather than its symptoms, encouraging people to work and making work pay, encouraging disabled people and those with ill health to work and be independent, and providing a decent income for people of pension age and promoting saving for retirement. Progress towards these responsibilities will affect these results.
The key uses of the published statistics and datasets are:
-
to provide detail on the overall household income distribution and low income indicators for different groups in the population
-
for international comparisons, both within the EU and for OECD countries
-
for parliamentary, academic, voluntary sector and lobby group analysis. Examples include using the HBAI data to examine income inequality, the distributional impacts of fiscal policies and understanding the income profile of vulnerable groups
The following describes how HBAI statistics are included in the Welfare Reform and Work Act 2016.
The first three of the four income-related measures included in the Welfare Reform and Work Act 2016 are reported in HBAI.
The four measures cover the percentage of children in the United Kingdom:
a) who live in households whose equivalised net income for the relevant financial year is less than 60% of median equivalised net household income for that financial year.
b) who live in households whose equivalised net income for the relevant financial year is less than 70% of median equivalised net household income for that financial year, and who experience material deprivation.
c) who live in households whose equivalised net income for the relevant financial year is less than 60% of median equivalised net household income for the financial year beginning 1 April 2010, adjusted to take account of changes in the value of money since that financial year.
d) who live in households whose equivalised net income has been less than 60% of median equivalised net household income in at least 3 of the last 4 survey periods.
Definitions for relevant key terms in the Act are consistent with those given in the Glossary; Income Definition; Equivalisation; and Low income and material deprivation for children sections of this document.
Data for reporting against the fourth measure will be released via the Income Dynamics publication.
Further details of the uses of HBAI statistics are given in Annex 3
What do you think?
We are constantly aiming to improve this report and its associated commentary. In particular, this issue we have focussed on improving the data we deposit at the UK Data Service. We would welcome any feedback you might have, and would also be particularly interested in knowing how you make use of these data to inform your work. Please contact us by email: team.hbai@dwp.gov.uk.
New for this publication
Household Food Security Tables
This year’s HBAI statistics include new tables showing the level of household food security for individuals living in low income households (see tables 9.1 to 9.8).
Questions are asked of the person in the household who knows the most about buying and preparing food. In common with the rest of the FRS, the focus is on the period of 30 days leading up to interview. The questions are comparable to those used by other public bodies in the UK, and also internationally. From the questions, a ten-point household score is generated, and the household is given a food security status:
-
High food security (score = 0): The household has no problem, or anxiety about, consistently accessing adequate food
-
Marginal food security (score = 1 or 2): The household had problems at times, or anxiety about, accessing adequate food, but the quality, variety, and quantity of their food intake were not substantially reduced
-
Low food security (score = 3 to 5): The household reduced the quality, variety, and desirability of their diets, but the quantity of food intake and normal eating patterns were not substantially disrupted
-
Very low food security (score = 6 to 10): At times during the last 30 days, eating patterns of one or more household members were disrupted and food intake reduced because the household lacked money and other resources for food.
Households with high or marginal food security are “food secure”. Food secure households are considered to have sufficient, varied food to facilitate an active and healthy lifestyle. Households with low or very low food security are “food insecure”. The banner of food insecurity covers a wide range of circumstances; where there is risk of, or lack of access to, sufficient, varied food.
The individual level data in these tables are presented using the household food security status. This means that one household food security status is used across all individuals within a household. Experiences of food insecurity can vary within a household. This data should not be presented using the phrasing “individuals are food insecure”, but as “individuals living in food insecure households”.
The definition of a household used in the Family Resources Survey (FRS) is ‘one person living alone or a group of people (not necessarily related) living at the same address who share cooking facilities and share a living room, sitting room, or dining area’. So, for example, a group of students with a shared living room would be counted as a single household even if they did not eat together, but a group of bed-sits at the same address would not be counted as a single household. A household may consist of one or more benefit units, which in turn will consist of one or more people (adults and children).
It should be noted that the food security section of this publication excludes shared households (see definition below), such as a house shared by a group of professionals. These respondents may not have insight into the food security status of others in their household and may not regularly share financial information.
Revision to full Time Series due to treatment of Income from Child Maintenance
A minor methodological revision has been made to include within HBAI all income from child maintenance. In previous HBAI publications, child maintenance arranged directly between the parents or by court order was included, but child maintenance arranged via the Child Maintenance Service (or its predecessors) was not. From this year’s publication, child maintenance arranged via the Child Maintenance Service (or its predecessors) is now also included. This results in more income from child maintenance being included, in turn slightly increasing some household incomes and so tending to slightly reduce low income rates for families with children. The full back series (back to FYE 1995) has been revised – child maintenance arranged via the Child Maintenance Service or its predecessors added - so that all income from child maintenance income is included and comparisons over time are on a consistent basis across the full time series. This also means that figures for FYE 1995 to FYE 2019 in this year’s publication (FYE 2020 statistics) may be slightly different to the equivalent figures in previous publications. Please refer to the HBAI Quality & Methodology Report for more information.
Regarding the impact of the revision on levels of low income, the percentage of children in low income in FYE 2019 (previous publication) has been revised downwards by around 0.4 percentage points on an AHC basis and 0.2 percentage points on a BHC basis. Revisions in previous years are similar or slightly less and in most cases are unchanged rounded to the nearest percentage point. However, please note that the revisions are greater for family types with children who are more likely to receive income from child maintenance, in particular lone parent families. For example, the percentage of children in low income in lone parent families in FYE 2019 (previous publication) has been revised downwards by between 0.7 percentage points on an absolute BHC basis and 1.8 percentage points on an absolute AHC basis (the relative BHC and relative AHC downward revisions are 1.2 and 1.6 percentage points respectively).
Conversely, the impact on low income rates for families without children is far less than the 0.2 and 0.4 percentage point figures quoted above. Please note, however, that low income rates may have been revised by a very small amount even for some groups that do not have children receiving income from child maintenance e.g. pensioner households. Such revisions can happen because the low income line (60% of the median) will change if the median changes i.e. some other households receive extra income which raises the median and hence the low income line. Therefore, a very small number of household groups whose incomes are unchanged (they do not have child maintenance income via the Child Maintenance Service) may fall below the low income line because that low income line has increased slightly. As well as the relative low income lines, this also applies to the absolute low income lines (60% of the FYE 2011 medians BHC and AHC) because the revision has been applied to the full back series of data including FYE 2011. In summary, this means that, whilst low income rates have generally been revised slightly downwards for most groups with children, for groups without children (or specifically any group without child maintenance income via the Child Maintenance Service) it is possible that low income rates may have been revised very slightly upwards.
The impact of the revision on low income trends is even less than the impact on low income levels because the revision each year is in the same direction – more income for some households with children – and broadly similar in scale over time.
Reporting of Benefits in the FRS
As with all survey data, the source FRS data used in HBAI undergoes various quality assurance and editing processes each year to ensure its fitness for purpose. As a national statistic, and in line with the Code of Practice for Statistics (Value V4.1) DWP looks to improve the FRS, year on year.
In particular, benefit amounts are edited using a combination of manual and automated processes. We have previously advised users of our intention to match those taking part in the survey to their benefit records (across the range of administrative datasets available to DWP, for many different state benefits, and at the time of interview). This would enable a check on the accuracy of pound amounts reported during the interview, as well as the respondent’s eligibility for the various elements of state support.
For the current survey year (FYE 2020), the process to edit benefit amounts has involved the more-automated use of administrative data to edit FRS-reported Universal Credit (UC) amounts. This is necessary because:
-
It is generally more complicated to check UC amounts than for other benefits, owing to the number of different components of the UC calculation
-
The time taken to manually edit UC amounts is therefore greater than for other benefits
-
The range of possible amounts values is wider than any other state benefit, running from nil to several hundred pounds per week; and
-
There has been a substantial increase in the number of UC observations since the previous survey year (FYE 2019), more than doubling since then
Given the above factors, editing reported UC amounts data was a more challenging task than in previous surveys. Given the legal deadline to publish HBAI data by the end of March it is important to be efficient in survey processing. The process looked at instances where people stated that they were receiving some form of state support; and where the amount reported was in some way questionable. The information then retrieved included respondents’ (true) amounts of benefit received, which allowed a closer editing of benefit rates than would otherwise have been the case.
This more-automated UC amounts editing process has a minimal affect overall on household incomes. There is, however, likely to be a small impact on the income distribution, particularly in the bottom quintile where a greater proportion of income comes from income-related benefits.
The level of benefit caseload undercount varies by benefit and across survey years. The extent of this is shown clearly in the FRS Methodology tables, especially Table M.6a: Receipt of state support, FRS data and administrative data. Compared with FYE 2019, the main changes are increasing levels of undercount for Personal Independence Payment (PIP) and Housing Benefit (HB). The PIP undercount has increased from approximately 360 thousand to 690 thousand cases. For HB, a small over count (60 thousand) in FYE 2019 has become an undercount of 690 thousand in FYE 2020. However, some of this is due to the increased editing of UC cases noted above e.g. where an FRS respondent reported receipt of both UC and HB and the benefit editing showed that they were receiving their housing support within UC. Regarding the UC caseload undercount, the UC caseload itself approximately doubled between FYE 2019 and FYE 2020. Therefore, although the UC caseload undercount increased from 470 thousand to 660 thousand this was actually a slight decrease in relative terms (a decrease in caseload undercount from 39% to 32% compared with administrative data).
The impact on the income distribution of an increase in benefit caseload undercount is not possible to establish precisely: it depends on the reason for the increased undercount. If the cause of the undercount is that benefit recipients are responding to the survey but not reporting some or all of their benefits, then household incomes for these respondents, who tend to be in the bottom half of the income distribution, would be under-estimated. However, if the cause of the undercount is that a higher proportion of benefit recipients are not responding at all to the survey, then benefit recipients would be under-represented in the FRS sample and households not receiving benefits over-represented. Since households not receiving benefits tend to have higher incomes, this would mean household incomes overall would tend to be over-estimated.
Development of processes linking FRS data to administrative data will continue through 2021, in support of next year’s publication, and beyond. For more details please see the FRS Background Information and Methodology report.
Using and Interpreting HBAI Results
Guide to published tables
All the publication tables previously available within the report are available as ODS spreadsheets on the HBAI on GOV.UK. Data and tables are also available via Stat-Xplore.
In the summary tables, estimates of the percentage and number in low income that are statistically significant from the previous year are shown with an asterisk. Changes marked by an asterisk are unlikely to have occurred as a result of chance.
The series started in FYE 1995 and so allows for comparisons over time, as well as between different groups of the population.
What do we mean by average?
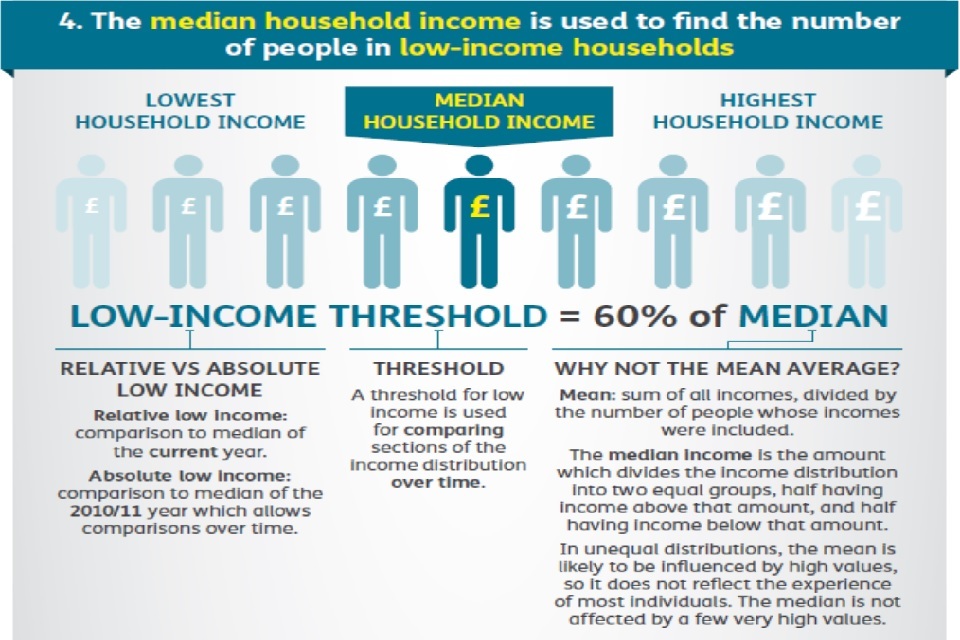
In HBAI, the term ‘average’ is used to describe the median. This divides the population of individuals, when ranked by income, into two equal-sized groups, and unlike the mean is not affected by extreme values.
HBAI measures
There are a range of measures of low income, income inequality, and material deprivation to capture different aspects of changes to living standards:
Relative low income
Relative low income measures the number and proportion of individuals who have household incomes below a certain proportion of the average in that year - and is used to look at how changes in income for the lowest income households compare to changes in incomes near the ‘average’. In the HBAI report we concentrate on those with household incomes below 60 per cent of the average. Information on those with household incomes below 50 and 70 per cent of the average is available in the detailed tables published on the HBAI web-pages.
Absolute low income
Absolute low income measures the proportion of individuals who have household incomes a certain proportion below the average in FYE 2011, adjusted for inflation. It is used to look at how changes in income for the lowest income households compare to changes in the cost of living. In the HBAI report we concentrate on those with household incomes below 60 per cent of the average FYE 2011 income. Information on those with household incomes below 50 and 70 per cent of the average is available in the detailed tables published on the HBAI web-pages.
Rounding
Due to rounding, the estimates of change in percentages or numbers of individuals in low income or material deprivation may not equal the difference between the total percentage or number of individuals for any pair of years.
The publication and tables follow the following conventions:
| Symbol | Description |
|---|---|
| .. | not available due to small sample sizes (less than 100) |
| - | the estimate is less than 50,000 or the percentage is less than 0.5 per cent |
-
Population estimates are rounded to the nearest 100,000
-
Percentages are rounded to the nearest 1 per cent
Key Terminology
Income
This is measured as total weekly household income from all sources after tax (including child income), national insurance and other deductions. An adjustment called ‘equivalisation’ is made to income to make it comparable across households of different size and composition.
Median
Median household income divides the population, when ranked by equivalised household income, into two equal-sized groups. The median is the value at the very middle of the distribution.
Deciles and Quintiles
These are income values which divide the whole population, when ranked by household income, into equal-sized groups. This helps to compare different groups of the population.
Decile and quintile are often used as a standard shorthand term for decile/quintile group.
Decile groups are ten equal-sized groups - the lowest decile describes individuals with incomes in the bottom 10 per cent of the income distribution.
Quintile groups are five equal-sized groups – the lowest quintile describes individuals with incomes in the bottom 20 per cent of the income distribution.
Income distribution
The spread of incomes across the population.
Equivalisation
Equivalisation adjusts incomes for household size and composition, taking an adult couple with no children as the reference point. For example, the process of equivalisation would adjust the income of a single person upwards, so their income can be compared directly to the standard of living for a couple.
Housing costs
Housing costs include rent, water rates, mortgage interest payments, buildings insurance payments and ground rent and service charges. A full list can be found in the glossary at the end of this document.
Benefit unit and households
HBAI presents information on an individual’s household income by various household and benefit unit (family) characteristics. There are important differences between households and benefit units.
Household
One person living alone or a group of people (not necessarily related) living at the same address who share cooking facilities and share a living room, sitting room or dining area. A household will consist of one or more benefit units.
Family or Benefit Unit
A single adult of couple living as married and any dependent children.
For example, a group of students with a shared living room would be counted as a single household even if they did not eat together, but a group of bed-sits at the same address would not be counted as a single household because they do not share living space or eat together.
A couple living with their young children and an elderly parent would be one household but two benefit units. The couple and their children would constitute one benefit unit, and the elderly parent would constitute another. It should be noted that the term ‘benefit unit’ is used as a description of groups of individuals regardless of whether they are in receipt of any benefits or tax credits.
A household will consist of one or more benefit units, which in turn will consist of one or more individuals (adults and children).
Other Terms
For more information on these and other terms used throughout the report, see the glossary at the bottom of this document, and the infographics explaining key terms.
Issues to consider
The following issues need to be considered when using the HBAI:
Lowest incomes
Comparisons of household income and expenditure suggest that those households reporting the lowest incomes may not have the lowest living standards. The bottom 10 per cent of the income distribution should not, therefore, be interpreted as having the bottom 10 per cent of living standards. Results for the bottom 10 per cent are also particularly vulnerable to sampling errors and income measurement problems. For HBAI tables, this will have a relatively greater effect on results where incomes are compared against low thresholds of median income. For this reason, compositional and percentage tables using the 50 per cent of median thresholds have been italicised to highlight the greater uncertainty. We have also presented money value quintile medians in Table 2.3ts on three-year averages to reflect this uncertainty.
Adjustment for inflation
As advised in a Statistical Notice published in May 2016, from FYE 2015 HBAI has made a methodological change to use variants of CPI when adjusting for inflation. Prior to the FYE 2015 HBAI publication variants of RPI were used to adjust for inflation.
This change follows advice from the UK National Statistician that use of RPI should be discontinued in statistical publications.
Full details on the likely impact on this methodological change, together with estimates for trends in income and absolute low income under both the old and new methodologies, are presented in Annex 4 to the FYE 2015 HBAI Quality and Methodology Report.
Benefit receipt
Relative to administrative records, the FRS is known to under-report benefit receipt. However, the FRS is considered to be the best source for looking at benefit and tax credit receipt by characteristics not captured on administrative sources, and for looking at total benefit receipt on a benefit unit or household basis. It is often inappropriate to look at benefit receipt on an individual basis because means-tested benefits are paid on behalf of the benefit unit. DWP published research (Working Paper 115) which explores the reasons for benefit under-reporting with the aim of improving the benefits questions included within the FRS. Table M.6a of the FRS publication presents a comparison of receipt of state support between FRS and administrative data. Methodology Table M.6b has been produced for the first time this year and compares the average weekly receipt of state support in the FRS FYE 2019 data, with the average weekly receipt of state support from the administrative data sources. Some benefit types have not been included in this analysis because no directly comparable administrative data source is available.
Self-employed
All analyses in the HBAI publication include the self-employed. A proportion of this group are believed to report incomes that do not reflect their living standards and there are also recognised difficulties in obtaining timely and accurate income information from this group. This may lead to an understatement of total income for some groups for whom this is a major income component, although this is likely to be more important for those at the top of the income distribution. There is little difference in the overall picture of proportions in low-income households when analysis is performed either including or excluding the self-employed.
Savings and investment
The data relating to investments and savings should be treated with caution. Questions relating to investments are a sensitive section of the questionnaire and have a low response rate. A high proportion of respondents do not know the interest received on their investments. It is likely that there is some under-reporting of capital by respondents, in terms of both the actual values of the savings and the investment income. This may lead to an understatement of total income for some groups for whom this is a major income component, such as pensioners, although this is likely to be more important for those at the top of the income distribution.
Methodological change for FYE 2020 (FRS savings and investments variable used in HBAI): The level of savings and investments, for some families (benefit units) and households has been estimated using a slightly different methodology in FYE 2020 than in previous years. The new method more accurately estimates savings in current accounts and basic bank accounts.
For current and basic bank accounts only, the new method avoids imputation of the account balance from interest paid, instead basing account balances on the figure given by the respondent. Approximately a third of all accounts are covered by this new methodology. Benefit unit respondents with reported savings and investments below £1,500 and above £20,000 are not asked to estimate the value of any of their accounts, other than current and basic bank accounts, so it is not possible to apply the new methodology to any other accounts.
This change has caused a large shift in the division of families (benefit units) and households between the two categories of (i) those with no savings at all to (ii) those with less than £1,500 in savings. This has produced estimates of savings in the relevant categories which are closer to those of other related surveys, but it should be noted that savings and investments breakdowns for FYE 2020 are not directly comparable with those for previous years.
Comparisons with National Accounts
Table 2.1tr shows comparisons between growth in Real Household Disposable Income and real growth in HBAI mean BHC unequivalised income. For some years, income growth in the HBAI-based series appears lower than the National Accounts estimates. The implication of this is that absolute real income growth could be understated in the HBAI series. Comparisons over a longer time period are believed to be more robust.
High incomes
Comparisons with Her Majesty’s Revenue and Customs’ Survey of Personal Incomes (SPI), which is drawn from tax records, suggest that the FRS under-reports the number of individuals with very high incomes and also understates the level of their incomes. There is also some volatility in the number of high income households surveyed. Since any estimate of mean income is very sensitive to fluctuations in incomes at the top of the distribution, an adjustment to correct for this is made to ‘very rich’ households in FRS-based results using SPI data. The median-based low-income statistics are not affected.
Working status
DWP and ONS have jointly investigated the reasons for the FRS consistently giving higher estimates than the Labour Force Survey (LFS) of the percentage of children in workless households. A report on this investigation found that the main reasons for the divergence were:
-
FRS unweighted data identifying a higher proportion of children in lone parent families, who have a much higher worklessness rate, than does LFS
-
FRS unweighted data showing a higher worklessness rate, in both lone parent and couple with-children families, than LFS
-
LFS employing a grossing regime which substantially reduces the proportion of children in lone parent households, and thereby in workless households; whereas the FRS grossing regime has less of an effect in reducing these proportions
-
the LFS grossing regime also reduces the worklessness rate in lone parent families; whereas the FRS grossing regime has less clear-cut effects
Gender analysis
The HBAI assumes that both partners in a couple benefit equally from the household’s income, and will therefore appear at the same position in the income distribution. Research has suggested that, particularly in low income households, the assumption with regard to income sharing is not always valid as men sometimes benefit at the expense of women from shared household income (see, for instance, Goode, J., Callender, C. and Lister, R. (1998) Purse or Wallet? Gender Inequalities and the Distribution of Income in Families on Benefits. JRF/Policy Studies Institute). This means is means that it is possible that HBAI results broken down by gender could understate differences between the two groups.
Students
Students Information for students should be treated with some caution because they are often dependent on irregular flows of income. Only student loans are counted as income in HBAI (with both the maintenance and tuition parts of the loan included), any other loans taken out are not. The figures are also not necessarily representative of all students because HBAI only covers private households and this excludes halls of residence.
Elderly
The effect of the exclusion of the elderly who live in residential homes is likely to be small overall except for results specific to those aged 80 and above.
Ethnicity analysis
Smaller ethnic minority groups exhibit year-on-year variation which limits comparisons over time. For this reason, analysis by ethnicity is presented as three-year averages.
Disability analysis
No adjustment is made to disposable household income to take into account any additional costs that may be incurred due to the illness or disability in question. This means that using income as a proxy for living standards for these groups, as shown here, may be somewhat upwardly biased. Analysis excluding Disability Living Allowance and Attendance Allowance from the calculation of income has been published as part of the suite of online HBAI ODS tables.
Regional analysis
Disaggregation by geographical regions (Regional information is at NUTS1 level) is presented as three-year averages. This presentation has been used as single-year regional estimates are considered too volatile. This issue was discussed in Appendix 5 of the FYE 2005 HBAI publication, where regional time series using three-year averages were presented. Although the FRS sample is large enough to allow some analysis to be performed at a regional level, it should be noted that no adjustment has been made for regional cost of living differences. It is therefore assumed that there is no difference in the cost of living between regions, although the AHC measure will partly take into account differences in housing costs.
Analysis at geographies below the regional level is not available from this data. Please see the Children in Low-Income Families publication for local level geographies.
Changes to deflators
Since the HBAI FYE 2018 publication, the Office for National Statistics (ONS) have made some very minor revisions to the bespoke Consumer Price Index (CPI) series we use to make real-terms income comparisons within and between survey years. However, because the effect of these revisions on low income measures is negligible no revisions have been made to the deflators used in HBAI. See the following ONS update for more details.
Survey Data
Most of the figures in the HBAI report come from the Family Resources Survey (FRS), a representative survey of over 19,000 households in the United Kingdom. The focus of the FRS is on capturing information on incomes and, as such, is the foremost source of income data and provides more detail on different income sources than other household surveys. It also captures a lot of contextual information on the household and individual circumstances, such as employment, education level and disability. This is therefore a very comprehensive data source allowing for a lot of different analysis.
Surveys gather information from a sample rather than from the whole population. The sample is designed carefully to allow for this, and to be as accurate as possible given practical limitations such as time and cost constraints. Results from sample surveys are always estimates, not precise figures. This means that they are subject to a margin of error which can affect how changes in the numbers should be interpreted, especially in the short-term. The latest estimates should be considered alongside medium and long-term patterns.
In addition to sampling errors, consideration should also be given to non-sampling errors. Non-sampling errors arise from the introduction of some systematic errors in the sample as compared to the population it is supposed to represent. As well as response bias, such errors include inappropriate definition of the population, misleading questions, data input errors or data handling problems – in fact any factor that might lead to the survey results systematically misrepresenting the population. There is no simple control or measurement for such non-sampling errors, although the risk can be minimised through careful application of the appropriate survey techniques from the questionnaire and sample design stages through to analysis of results.
HBAI is based on data from a household survey and so subject to the nuances of using a survey, including:
-
Sampling error: results from surveys are estimates and not precise figures. Confidence intervals help to interpret the certainty of these estimates, by showing the range of values around the estimate that the true result is likely to be within. In general terms the smaller the sample size, the larger the uncertainty. Statistical significance is an attempt to indicate whether a reported change within the population of interest is due to chance. It is important to bear in mind that confidence intervals are only a guide for the size of sampling error
-
non-response error: the FRS response rate each year is around 50 per cent. In an attempt to correct for differential non-response, estimates are weighted using population totals
-
Survey coverage: the FRS covers private households in the United Kingdom. Therefore, individuals in nursing or retirement homes, for example, will not be included. This means that figures relating to the most elderly individuals may not be representative of the United Kingdom population, as many of those at this age will have moved into homes where they can receive more frequent help
-
Survey design: the FRS uses a clustered sample designed to produce robust estimates at former government office region (GOR) level. The FRS is therefore not suitable for analysis below this level
-
Sample size: although the FRS has a relatively large sample size for a household survey, small sample sizes for some more detailed analyses may require several years of data to be combined in order to generate reliable estimates. From April 2011, the target achieved GB sample size for the FRS was reduced by 5,000 households, resulting in an overall achieved sample size for the UK of around 20,000 households for FYE 2012. We previously published an assessment concluding that this still allows core outputs from the FRS to be produced, though with slightly wider confidence intervals or ranges
-
Measurement error: the FRS is known to under-report certain income streams, especially benefit receipt. More detail can be found in Table M.6a and M.6b of the FRS report
Further methodological details relating to the FRS are given in the FRS Background Note and methodology.
Reporting Uncertainty
As above, survey results are always estimates, not precise figures and so subject to a level of uncertainty. Two different random samples from one population, for example the UK, are unlikely to give exactly the same survey results, which are likely to differ again from the results that would be obtained if the whole population was surveyed. The level of uncertainty around a survey estimate can be calculated and is commonly referred to as sampling error.
We can calculate the level of uncertainty around a survey estimate by exploring how that estimate would change if we were to draw many survey samples for the same time period instead of just one. This allows us to define a range around the estimate (known as a “confidence interval”) and to state how likely it is that the real value that the survey is trying to measure lies within that range. Confidence intervals are typically set up so that we can be 95% sure that the true value lies within the range – in which case this range is referred to as a “95% confidence interval”. Annex 4 of this document provides further details on the Bootstrapping methodology used to estimate confidence intervals in HBAI, alongside estimates of the sampling error.
Population
The analyses in the HBAI report are primarily based on the FRS. Households in Northern Ireland (NI) were surveyed for the first time in the FYE 2003 survey year. A detailed analysis of observed trends, together with results for NI and the UK for the first three years of NI data can be found in Appendix 3 of the FYE 2005 publication.
The FRS time series in this publication are presented with discontinuities in the years where there is a change from GB to UK. Prior to FYE 2015, for some tables, estimates for NI were imputed for the years FYE 1999 to FYE 2002. This allowed for changes since FYE 1999 to be measured at the UK level. For further details, see Appendix 4 of the HBAI FYE 2005 publication. This imputation is no longer carried out from the FYE 2015 publication.
The survey covers the private household sector. All the results therefore exclude people living in institutions, e.g. nursing homes, halls of residence, barracks or prisons, and homeless people living rough or in bed and breakfast accommodation. The area of Scotland north of the Caledonian Canal was included in the FRS for the first time in the FYE 2002 survey year and, from the FYE 2003 survey year, the FRS was extended to include a 100 per cent boost of the Scottish sample. This has increased the sample size available for analysis at the Scottish level.
A further adjustment is that households containing a married adult whose spouse is temporarily absent, whilst within the scope of the FRS, are excluded from HBAI. Similarly, prior to the FYE 1997 data, households containing a self-employed adult who had been full-time self-employed for less than two months were excluded. This exclusion is no longer made because of the improvements in the self-employment questions in the FRS.
Grossing
The published HBAI analysis presents tabulations where the percentages refer to sample estimates grossed-up to apply to the whole population.
Grossing-up is the term usually given to the process of applying factors to sample data so that they yield estimates for the overall population. The simplest grossing system would be a single factor, e.g. the number of households in the population divided by the number in the achieved sample. However, surveys are normally grossed by a more complex set of grossing factors that attempt to correct for differential non-response at the same time as they scale up sample estimates.
The system used to calculate grossing factors for HBAI mirrors that of FRS grossing with two differences described below.
The system used to calculate grossing factors for the FRS divides the sample into different groups. The groups are designed to reflect differences in response rates among different types of households . They have also been chosen with the aims of DWP analyses in mind. The population estimates for these groups, obtained from official data sources, provide control variables. The grossing factors are then calculated by a process which ensures the FRS produces population estimates that are the same as the control variables.
As an example, the grossed number of men aged 35-39 would be consistent with the Office for National Statistics (ONS) estimate (see Table 1). Some adjustments are made to the original control total data sources so that definitions match those in the FRS, e.g. an adjustment is made to the demographic data to exclude people not resident in private households. It is also the case that some totals have to be adjusted to correspond to the FRS survey year.
A software package called CALMAR, provided by the French National Statistics Institute, is used to reconcile control variables at different levels and estimate their joint population. This software makes the final weighted sample distributions match the population distributions through a process known as calibration weighting. It should be noted that if a few cases are associated with very small or very large grossing factors, grossed estimates will have relatively wide confidence intervals. There were some of these such cases in the FYE 2018 data, we have added footnotes to some tables where these large weights affect the results.
As stated above, the system used to calculate grossing factors for HBAI mirrors that of FRS grossing with two differences. The first difference with FRS grossing is that the sample of households is smaller for HBAI purposes because households with spouses living away from home are excluded (see Population section above). The second difference is that separate control totals are introduced for ‘very rich’ households, so that the top end of the income distribution is more accurately reflected, which is particularly important for estimates of mean income or inequality as measured by the Gini coefficient.
As with the FRS, the grossing regime for HBAI currently uses population and household estimates based on the results of the 2011 Census. Prior to FYE 2013, 2001 census based estimates were used. In addition, a review of FRS grossing was carried out on behalf of DWP by the ONS Methodological Advisory Service. In implementing the review recommendations, a number of relatively minor methodological improvements were implemented from FYE 2013.
The main changes implemented were as follows:
-
improvements to the categorisation of tenure control totals
-
a full breakdown of the total number of households into each of the English regions (in addition breakdowns for Scotland, Wales and Northern Ireland)
-
a new adjustment to account for the different rates of sampling in England and Wales, Scotland, and Northern Ireland
A back-series of grossing factors calculated using the new methodology was created for each year back to FYE 2003, and are used in the HBAI publication tables from FYE 2013 onwards. Further details and analysis of the impact of these methodological changes are published in the grossing methodology review.
In developing the grossing regime, careful consideration has been given to the combination of control totals and the way age ranges, Council Tax bands and so on, have been grouped together. The aim has been to strike a balance so that the grossing system will provide, where possible, accurate estimates in different dimensions without significantly increasing variances.
There are some differences between the methods used to gross the Northern Ireland sample as compared with the Great Britain sample:
-
local taxes in Northern Ireland are collected through the rates system, so Council Tax Band as a control variable is not applicable
-
Northern Ireland housing data are based largely on small sample surveys. It is not desirable to introduce the variance of one survey into another by using it to compute control totals; therefore, tenure type has not been used as a control variable
Details of the grossing regime for Northern Ireland are shown in Table 2.
Table 1: HBAI grossing regime for Great Britain
| Control totals for Great Britain | Groupings | Original Source | Adjustments made by DWP |
|---|---|---|---|
| Private household population by region, age, and sex | Regions: North East, North West, Yorkshire and the Humber, East Midland, West Midlands, East of England, London, South East, South West, Wales, Scotland. Sex and Age: Males aged 0-9, 10-19 dependents, 16-24 non-dependents, 25-29, 30-34, 35-39, 40-44, 45-49, 50-59, 60-64, 65-74, 75-79, 80+; Females aged 0-9, 10-19 dependents, 16-24 non-dependents, 25-29, 30-34, 35-39, 40-44, 45-49, 50-59, 60-69, 70-74, 75-79, 80+ | Mid-year population estimates. Office of National Statistics | ONS total population figures are adjusted for private household estimates using data supplied by ONS directly to DWP. 16-19-year-old dependents and non-dependents are split using data supplied by HMRC directly to DWP. |
| Benefit Units with children | Region: England and Wales, Scotland | Families in receipt of child benefit. HM Revenue and Customs | |
| Lone parents | Sex: Males, Females | Lone parent estimates. Labour Force Survey | Adjusted for FRS survey year (April-March) |
| Households by region | Region: North East, North West, Yorkshire and the Humber, East Midlands, West Midlands, East of England, London, South East, South West, Wales, Scotland | Households by region. Office for National Statistics (England) / Welsh Government (Wales) / Scottish Government (Scotland) | Adjusted for FRS survey year (April-March) |
| Households by tenure type | Tenure (Social Renters, Private Renters, Owner Occupied) | Dwellings by tenure type. Ministry of Housing, Communities and Local Government | Household control totals are calculated using dwellings data published by MHCLG, Welsh Government, Scottish Government. Adjusted for FRS survey year (April-March) |
| Households by council tax band | Council Tax Band (NVS and A, B, C and D, E to H) | Dwellings by council tax band published by Valuations Office Agency. Dwellings by council tax band. Published by the Scottish Government | Household control totals are calculated using dwellings data published by VOA / Scottish Government, adjusted for FRS survey year (April-March). Estimates for properties not-valued-separately (NVS) based on FRS sample proportions. |
| Households containing ‘Very Rich’ people | Pensioners, Non-pensioners | HMRC Survey of Personal Incomes (SPI) |
Table 2: HBAI grossing regime for Northern Ireland
| Control Totals for Northern Ireland | Groupings | Original Source | Adjustments made by DWP |
|---|---|---|---|
| Private household population by age and sex | Sex and Age: Males aged 0-9, 10-19 dependents,16-24 non-dependents, 25-29, 30-34, 35-39, 40-44, 45-49, 50-59, 60-64, 65-74,75-79, 80+; Females aged 0-9, 10-19 dependents, 16-24 non-dependents, 25-29,30-34, 35-39, 40-44, 45-49, 50-59, 60-69, 70-74, 75-79, 80+ | Private household estimates. Department for Social Development in Northern Ireland. | |
| Households | Household estimates. Department for Social Development in Northern Ireland | ||
| Lone Parents | Lone Parent Estimates. Department for Social Development in Northern Ireland. | ||
| Households containing ‘Very Rich’ people | Pensioners, Non-pensioners | HMRC Survey of Personal Incomes (SPI) |
Adjustment for individuals with very high incomes
An adjustment is made to sample cases at the top of the income distribution to correct for volatility in the highest incomes captured in the survey. This adjustment uses data kindly supplied by HM Revenue and Customs’ statisticians from HM Revenue and Customs’ Survey of Personal Incomes (SPI) to control the numbers and income levels of the ‘very rich’ while retaining the FRS data on the characteristics of their households. The methodology defines a household as ‘very rich’ if it contains a ‘very rich’ individual and it adjusts pensioners and non-pensioners separately. Thresholds have been set at the level above which, for each group, the FRS data is considered to be volatile due to small numbers of cases.
From the FYE 2010 publication, the SPI adjustment methodology was changed to be based on adjusting a fixed fraction of the population rather than on adjusting the incomes of all those individuals with incomes above a fixed cash terms level. This is intended to prevent an increasing fraction of the dataset being adjusted. The adjustment fraction was set at the same level as the fraction adjusted in FYE 2009. There was also a movement to basing all SPI adjustment decisions on gross rather than a mixture of gross and net incomes. These changes only have a very small effect on the results as presented.
The numbers of ‘very rich’ pensioners and non-pensioners in survey estimates are matched to SPI estimates by the introduction of two extra control totals into the grossing regime. One is for the total number of pensioners above the pensioner threshold and the other for the number of non-pensioners above the non-pensioner threshold. The grossing factors for individual cases are only marginally changed as a result of this adjustment. In addition, each ‘very rich’ individual in the FRS is assigned an income level derived from the SPI, as the latter gives a more accurate indication of the level of high incomes than the FRS. Again this adjustment is carried out separately for pensioners and non-pensioners.
The latest SPI data available when we carried out our analysis was the FYE 2018 SPI, which was projected forward to cover the FYE 2020 Family Resources Survey year.
Equivalisation
HBAI uses net disposable weekly household income, after adjusting for the household size and composition, as an assessment for material living standards - the level of consumption of goods and services that people could attain given the net income of the household in which they live. In order to allow comparisons of the living standards of different types of households, income is adjusted to take into account variations in the size and composition of the households in a process known as equivalisation. HBAI assumes that all individuals in the household benefit equally from the combined income of the household. Thus, all members of any one household will appear at the same point in the income distribution.
The unit of analysis is the individual, so the populations and percentages in the tables are numbers and percentages of individuals – both adults and children.
Equivalence scales conventionally take an adult couple without children as the reference point, with an equivalence value of one. The process then increases relatively the income of single person households (since their incomes are divided by a value of less than one) and reduces relatively the incomes of households with three or more persons, which have an equivalence value of greater than one. The infographic below illustrates the process of equivalisation, Before Housing Costs.
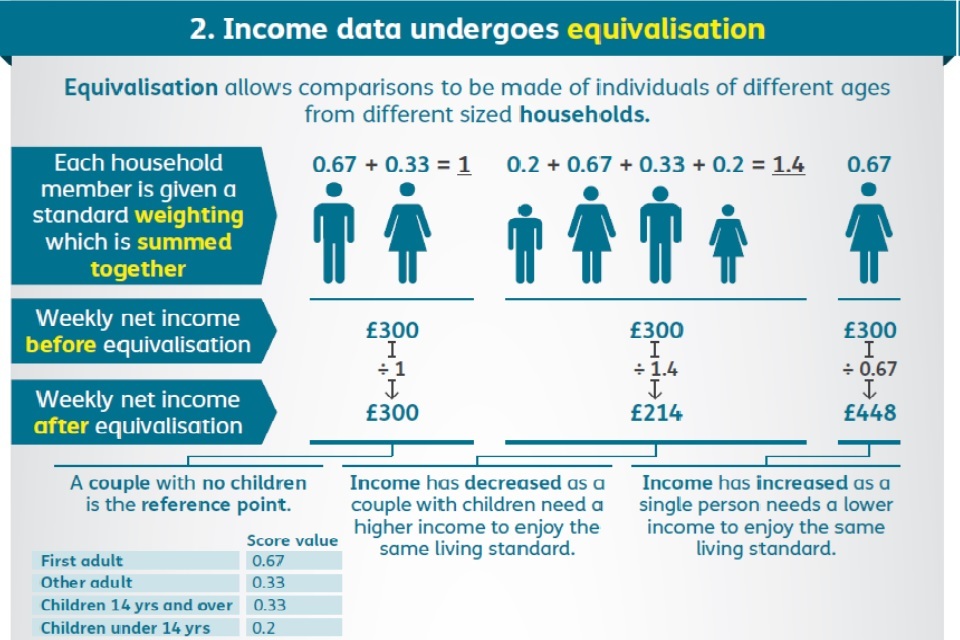
Consider a single person, a couple with no children, and a couple with two children aged twelve and ten, all having unadjusted weekly household incomes of £300 (BHC). The process of equivalisation, as conducted in HBAI, gives an equivalised income of £448 to the single person, £300 to the couple with no children, but only £214 to the couple with children.
The main equivalence scales now used in HBAI are the modified OECD scales, which take the values shown in Table 3. The equivalent values used by the McClements equivalence scales are also shown for comparison alongside modified OECD values. The McClements scales were used by HBAI to adjust income up to the FYE 2005 HBAI publication.
In the modified OECD and McClements versions, two separate scales are used, one for income BHC and one for income AHC. The construction of household equivalence values from these scales is quite straightforward. For example, the BHC equivalence value for a household containing a couple with a fourteen-year-old and a ten-year-old child together with one other adult would be 1.86 from the sum of the scale values:
0.67 + 0.33 + 0.33 + 0.33 + 0.20 = 1.86
This is made up of 0.67 for the first adult, 0.33 for their spouse, the other adult and the fourteen-year-old child and 0.20 for the ten-year-old child. The total income for the household would then be divided by 1.86 in order to arrive at the measure of equivalised household income used in HBAI analysis.
Table 3: Comparison of modified OECD and McClements equivalence scales
| OECD rescaled to couple without Children=1 | OECD ‘Companion’ Scale to equivalise AHC results | McClements BHC | McClements AHC | |
|---|---|---|---|---|
| First Adult | 0.67 | 0.58 | 0.61 | 0.55 |
| Spouse | 0.33 | 0.42 | 0.39 | 0.45 |
| Other Second Adult | 0.33 | 0.42 | 0.46 | 0.45 |
| Third Adult | 0.33 | 0.42 | 0.42 | 0.45 |
| Subsequent Adults | 0.33 | 0.42 | 0.36 | 0.40 |
| Children aged under 14 years | 0.20 | 0.20 | 0.20 | 0.20 |
| Children aged 14 years and over | 0.33 | 0.42 | 0.32 | 0.34 |
Notes:
-
all scales presented to two decimal places
-
for the McClements scale, the weight for ‘Other second adult’ is used in place of the weight for ‘Spouse’ when two adults living in a household are sharing accommodation, but are not living as a couple. ‘Third adult and ‘Subsequent adult’ weights are used for the remaining adults in the household as appropriate. In contrast to the McClements scales, apart from for the first adult, the OECD scales do not differentiate for subsequent adults
-
The McClements scale varies by age for children; appropriate averages are shown in the table
Income Definition
The income measure used in HBAI is weekly net (disposable) equivalised household income. This comprises total income from all sources of all household members including dependants.
Income is adjusted for household size and composition by means of equivalence scales, which reflect the extent to which households of different size and composition require a different level of income to achieve the same standard of living. This adjusted income is referred to as equivalised income.
In detail, income includes:
-
usual net earnings from employment
-
profit or loss from self-employment (losses are treated as a negative income)
-
state support - all benefits and tax credits
-
income from occupational and private pensions
-
investment income
-
maintenance payments
-
income from educational grants and scholarships (including, for students, student loans and parental contributions)
-
the cash value of certain forms of income in kind (free school meals, free school breakfast, free school milk, free school fruit and vegetables, Healthy Start vouchers and free TV licence for those aged 75 and over)
Income is net of the following items:
-
income tax payments
-
National Insurance contributions
-
domestic rates / council tax
-
contributions to occupational pension schemes (including all additional voluntary contributions (AVCs) to occupational pension schemes, and any contributions to stakeholder and personal pensions)
-
all maintenance and child support payments, which are deducted from the income of the person making the payment
-
parental contributions to students living away from home
-
student loan repayments
Housing costs
Income After Housing Costs (AHC) is derived by deducting a measure of housing costs from the above income measure.
Housing costs include the following:
-
rent (gross of housing benefit)
-
water rates, community water charges and council water charges
-
mortgage interest payments
-
structural insurance premiums (for owner occupiers)
-
ground rent and service charges
For Northern Ireland households, water provision is funded from taxation and there are no direct water charges. Therefore, it is already taken into account in the Before Housing Costs measure.
In the FYE 1996 and subsequent datasets, a refinement was made to the calculation of mortgage interest payments to disregard additional loans which had been taken out for purposes other than house purchase.
Negative incomes
Negative incomes BHC are reset to zero, but negative AHC incomes calculated from the adjusted BHC incomes are possible. Where incomes have been adjusted to zero BHC, income AHC is derived from the adjusted BHC income.
State support
The Government pays money to individuals in order to support them financially under various circumstances. Most of these benefits are administered by DWP. The exceptions are Housing Benefit and Council Tax Reduction, which are administered by local authorities. Tax Credits are not treated as benefits, but both Tax Credits and benefits are included in the term State Support.
Income-related benefits for United Kingdom include:
-
Council Tax Reduction
-
Employment and Support Allowance (income-related element)
-
Extended Payments (Council Tax Reduction and Housing Benefit)
-
Housing Benefit
-
Income Support
-
Jobseeker’s Allowance (income-based element)
-
Pension Credit
-
Social Fund – Funeral Grant
-
Social Fund – Sure Start Maternity Grant
-
Universal Credit
Non-Income-related benefits for United Kingdom include:
-
Armed Forces Compensation Scheme
-
Attendance Allowance
-
Bereavement or Widowed Parent’s Allowance
-
Bereavement Support Payment
-
Carer’s Allowance
-
Child Benefit
-
Disability Living Allowance (both mobility and care components)
-
Employment and Support Allowance (contributory element)
-
Guardian’s Allowance
-
Incapacity Benefit
-
Industrial Injuries Disablement Benefit
-
Jobseeker’s Allowance (contributory element)
-
Maternity Allowance
-
Personal Independence Payment (Daily Living and Mobility components)
-
Severe Disablement Allowance
-
State Pension
-
Statutory Maternity/Paternity/Adoption Pay
-
Statutory Sick Pay
-
Winter Fuel Payments
Income-related benefits for Northern Ireland include:
-
Northern Ireland Other Rate Rebate
-
Northern Ireland Rate Rebate through energy efficient homes
-
Northern Ireland Rate Relief
-
Rates Rebate
Non-Income related benefits for Northern Ireland include:
-
Northern Ireland Disability Rate Rebate
-
Northern Ireland Lone Pensioner Rate Rebate
Interpreting low income measures
Relative low income
Relative low income sets the threshold as a proportion of the average income, and moves each year as average income moves. It is used to measure the number and proportion of individuals who have incomes a certain proportion below the average.
The percentage of individuals in relative low income will increase if:
-
the average income stays the same, or rises, and individuals with the lowest incomes see their income fall, or rise less, than average income; or
-
the average income falls and individuals with the lowest incomes see their income fall more than the average income
The percentage of individuals in relative low income will decrease if:
-
the average income stays the same, or rises, and individuals with the lowest incomes see their income rise more than average income; or
-
the average income falls and individuals with the lowest incomes see their income rise, or fall less, than average income, or see no change in their income
Absolute low income
Absolute low income sets the low income line in a given year, then adjusts it each year with inflation as measured by variants of the CPI. This measures the proportion of individuals who are below a certain standard of living in the UK (as measured by income).
The percentage of individuals in absolute low income will increase if individuals with the lowest incomes see their income fall or rise less than inflation.
The percentage of individuals in absolute low income will decrease if individuals with the lowest incomes see their incomes rise more than inflation.
Income inequality
Income inequality, measured by the Gini Coefficient, shows how incomes are distributed across all individuals, and provides an indicator of how high and low-income individuals compare to one another. It ranges from zero (when everybody has identical incomes) to 100 per cent (when all income goes to only one person). The 90:10 ratio is the average (median) income of the top 20 per cent (quintile 5) divided by the average income of the bottom 20 per cent (quintile 1). The higher the number, the greater the gap between those with the highest incomes and those with the lowest incomes.
Before Housing Costs (BHC)
Before Housing Costs (BHC) measures allow an assessment of the relative standard of living of those individuals who were actually benefiting from a better quality of housing by paying more for better accommodation, and income growth over time incorporates improvements in living standards where higher costs reflected improvements in the quality of housing.
After Housing Costs (AHC)
After Housing Costs (AHC) measures allow an assessment of living standards of individuals whose housing costs are high relative to the quality of their accommodation. Income growth over time may also overstate improvements in living standards for low-income groups, as a rise in Housing Benefit to offset higher rents (for a given quality of accommodation) would be counted as an income rise.
Therefore, HBAI presents analyses of disposable income on both a BHC and AHC basis. This is principally to take into account variations in housing costs that themselves do not correspond to comparable variations in the quality of housing.
Low income and material deprivation for children
Material deprivation is an additional way of measuring living standards and refers to the self-reported inability of individuals or households to afford particular goods and activities that are typical in society at a given point in time, irrespective of whether they would choose to have these items, even if they could afford them.
A suite of questions designed to capture the material deprivation experienced by families with children has been included in the FRS since FYE 2005. Respondents are asked whether they have 21 goods and services, including child, adult and household items. Together, these questions form the best discriminator between those families that are deprived and those that are not. If they do not have a good or service, they are asked whether this is because they do not want them or because they cannot afford them.
The original list of items was identified by independent academic analysis. See McKay, S. and Collard, S. (2004). Developing deprivation questions for the Family Resources Survey, Department for Work and Pensions Working Paper Number 13. The questions are kept under review and for the FYE 2011 Family Resources Survey, information on four additional material deprivation goods and services was collected and from FYE 2012 four questions from the original suite were removed.
The trends table 4.5tr available on the Children web page shows figures using the original suite of questions up to and including FYE 2011, and the new suite of questions from FYE 2011 onwards. FYE 2011 data is presented on both bases as figures from the old and new suite of questions are not comparable.
See Appendix 3 of the FYE 2011 HBAI publication for a discussion of the implications of changing the items.
A prevalence weighted approach has been used, in combination with a relative low-income or severe relative low-income threshold. Prevalence weighting is a technique of scoring deprivation in which more weight in the deprivation measure is given to families lacking those items that most families already have. This means a greater importance, when an item is lacked, is assigned to those items that are more commonly owned in the population.
For each question a score of 1 indicates where an item is lacked because it cannot be afforded. If the family has the item, the item is not needed or wanted, or the question does not apply then a score of 0 is given. This score is multiplied by the relevant prevalence weight. The scores on each item are summed and then divided by the total maximum score; this results in a continuous distribution of scores ranging from 0 to 1. The scores are multiplied by 100 to make them easier to interpret. The final scores, therefore, range from 0 to 100, with any families lacking all items which other families had access to scoring 100.
A child is considered to be in low income and material deprivation if they live in a family that has a final score of 25 or more and an equivalised household income below 70 per cent of contemporary median income, Before Housing Costs.
A child is considered to be in severe low income and material deprivation if they live in a family that has a final score of 25 or more and an equivalised household income below 50 per cent of contemporary median income, Before Housing Costs. A technical note giving further background to this measure is available.
From the FYE 2009 edition of the HBAI publication, we moved to using the prevalence weights relative to the survey year in question, rather than fixed FYE 2005 weights, which were used in previous publications. The prevalence weights are shown in Table 5 below.
Table 5: Material deprivation scores used for children in FYE 2019
| Material deprivation questions | Weights | Final Scores | |||||||||
|---|---|---|---|---|---|---|---|---|---|---|---|
| For children | |||||||||||
| Outdoor space or facilities nearby to play safely | 0.936 | 5.61 | |||||||||
| Enough bedrooms for every child of 10 or over of a different sex to have their own bedroom | 0.846 | 5.07 | |||||||||
| Celebrations on special occasions such as birthdays, Christmas or other religious festivals | 0.965 | 5.79 | |||||||||
| Leisure equipment such as sports equipment or a bicycle | 0.887 | 5.32 | |||||||||
| A family holiday away from home for at least one week a year | 0.684 | 4.10 | |||||||||
| A hobby or leisure activity | 0.760 | 4.56 | |||||||||
| Friends around for tea or a snack once a fortnight | 0.667 | 4.00 | |||||||||
| Go on school trips | 0.889 | 5.33 | |||||||||
| Toddler group/nursery/playgroup at least once a week | 0.719 | 4.31 | |||||||||
| Attends organised activity outside school each week | 0.709 | 4.25 | |||||||||
| Fresh fruit and vegetables eaten by children every day | 0.931 | 5.58 | |||||||||
| Warm winter coat for each child | 0.986 | 5.91 | |||||||||
| For adults | |||||||||||
| Enough money to keep home in a decent state of decoration | 0.800 | 4.79 | |||||||||
| A holiday away from home for at least one week a year, whilst not staying with relatives at their home | 0.614 | 3.68 | |||||||||
| Household contents insurance | 0.665 | 3.99 | |||||||||
| Regular savings of £10 a month or more for rainy days or retirement | 0.667 | 4.00 | |||||||||
| Replace any worn out furniture | 0.639 | 3.82 | |||||||||
| Replace or repair major electrical goods such as a refrigerator or a washing machine, when broken | 0.725 | 4.32 | |||||||||
| A small amount of money to spend each week on yourself, not on your family | 0.719 | 4.40 | |||||||||
| In winter, able to keep accommodation warm enough | 0.925 | 5.61 | |||||||||
| Keep up with bills and regular debt payments | 0.919 | 5.57 | |||||||||
| Sum of all weights | 16.679 | 100 |
Material deprivation for pensioners
A suite of questions designed to capture the material deprivation experienced by pensioner families has been included in the Family Resources Survey since May 2008. Respondents are asked whether they have access to 15 goods and services. The list of items was identified by independent academic analysis. See Legard, R., Gray, M. and Blake, M. (2008), Cognitive testing: older people and the FRS material deprivation questions, Department for Work and Pensions Working Paper Number 55 and McKay, S. (2008), Measuring material deprivation among older people: Methodological study to revise the Family Resources Survey questions, Department for Work and Pensions Working Paper Number 54. Together, these questions form the best discriminator between those pensioner families that are deprived and those that are not. Note that this measure is only available for pensioners aged 65 or over.
Where they do not have a good or service, they are asked whether this is because:
-
they do not have the money for this
-
it is not a priority on their current income
-
their health or disability prevents them
-
it is too much trouble or tiring
-
they have no one to do this with or help them
-
it is not something they want; it is not relevant to them
-
other
A pensioner is counted as being deprived of an item where they lack it for one of the following reasons:
-
they do not have the money for this
-
it is not a priority on their current income
-
their health or disability prevents them
-
it is too much trouble or tiring
-
they have no one to do this with or help them
-
other
The exception to this is for the unexpected expense question, where the follow up question was asked to explore how those who responded ‘yes’ would pay. Options were:
-
use own income but cut back on essentials
-
use own income but not need to cut back on essentials
-
use savings
-
use a form of credit
-
get money from friends or family
-
other
Pensioners are counted as materially deprived for this item if and only if they responded ‘no’ to the initial question.
The same prevalence weighted approach has been used to that for children, in determining a deprivation score. Prevalence weighting is a technique of scoring deprivation in which more weight in the deprivation measure is given to families lacking those items that most pensioner families already have. This means a greater importance, when an item is lacked, is assigned to those items that are more commonly owned in the pensioner population.
For each question a score of 1 indicates where an item is lacked because of the reasons outlined on the previous page. If the pensioner family has the item, the item is not needed or wanted, or the question does not apply then a score of 0 is given. This score is then multiplied by the relevant prevalence weight. The scores on each item are summed and divided by the total maximum score; this results in a continuous distribution of scores ranging from 0 to 1. The scores are multiplied by 100 to make them easier to interpret. The final scores, therefore, range from 0 to 100, with any families lacking all items which other families had access to scoring 100. The prevalence weights are shown in Table 6 below.
Table 6: Material deprivation scores used for pensioners in FYE 2019
| Material deprivation questions | Weights | Final Scores | |||||
|---|---|---|---|---|---|---|---|
| For pensioners aged 65 and over | |||||||
| At least one filling meal a day | 0.987 | 7.14 | |||||
| Go out socially at least once a month | 0.813 | 5.88 | |||||
| See friends or family at least once a month | 0.952 | 6.89 | |||||
| Take a holiday away from home | 0.612 | 4.42 | |||||
| Able to replace cooker if it broke down | 0.920 | 6.65 | |||||
| Home kept in a good state of repair | 0.968 | 7.00 | |||||
| Heating, electrics, plumbing and drains working | 0.984 | 7.12 | |||||
| Have a damp-free home | 0.952 | 6.88 | |||||
| Home kept adequately warm | 0.976 | 7.06 | |||||
| Able to pay regular bills | 0.982 | 7.10 | |||||
| Have a telephone to use, whenever needed | 0.954 | 6.90 | |||||
| Have access to a car or taxi, whenever needed | 0.915 | 6.62 | |||||
| Have hair done or cut regularly | 0.918 | 6.64 | |||||
| Have a warm waterproof coat | 0.991 | 7.17 | |||||
| Able to pay an unexpected expense of £200 | 0.904 | 6.54 | |||||
| Sum of all weights | 13.826 | 100 |
A pensioner is considered to be in material deprivation if they live in a family that has a final score of 20 or more. For children, material deprivation is presented as an indicator in combination with a low-income threshold. However, for pensioners, the concept of material deprivation is broad and very different from low income, therefore it is appropriate to present it as a separate measure.
A technical note giving a full explanation of the pensioner material deprivation measure is available.
Material deprivation weighting methodology
We currently recalculate the prevalence weights each year based on the question responses from that year. The maximum possible material deprivation score for each year is then rescaled to 100 for ease of interpretation, and children in a family with a score of at least 25, or pensioners with a score of 20 or more, are classed as being materially deprived. If over time more families can afford a certain item, then a family lacking such a good will see an increasing overall deprivation score, and will be considered as becoming more materially deprived.
A concern which has been raised with the current method is that if there is a general increase in access to items, this should imply that a family lacking a particular number of items is now suffering from greater relative deprivation than before. However, because of the rescaling of scores to 100, each item lacked still counts the same amount towards the overall material deprivation score and a family is still required to lack the same number of items to reach a score of 25 and be declared materially deprived.
The HBAI Technical Advisory Group considered this issue. The Group agreed that this is a complex issue and recommended that any changes made should be implemented following a considered and evidence based exploration of options. As a result, the Group agreed that the recommendation should be to continue to use the current methodology for material deprivation until such time as a thorough exploration of this issue can be conducted.
Ethnic categories
The ethnicity questions used in the FRS adopt the UK harmonised standards for use in major Government social surveys; that is, they adopt the standard way of collecting information on the ways in which people describe their ethnic identity. The latest harmonised standards were published in August 2011 and cover the ethnic group question in England, Wales, Scotland and Northern Ireland. They also cover harmonised data presentation for ethnic group outputs. The standards were updated in February 2013 detailing how Gypsy, Traveller and Irish Traveller should be recorded in the outputs, due to differences across the UK.
The FRS adopted these latest harmonised standards for England, Wales and Northern Ireland for the FYE 2012 survey questionnaire, and the standards for Scotland were adopted for the FYE 2013 survey questionnaire. The FYE 2012 publication therefore adopted the latest harmonised output standards for ethnic groups for the UK. The most significant changes to previous publications are that the ‘Chinese’ category has moved from the ‘Chinese or other ethnic group’ section to the ‘Asian/Asian British’ section; and ‘Irish Traveller’ is included under ‘Other ethnic group’ for respondents in Northern Ireland and ‘Gypsy or Irish Traveller’ is included under the ‘White’ section for respondents in Great Britain, therefore UK figures have been allocated accordingly.
Disability definition
The means of identifying people with a disability has changed over time. Data are not available for FYE 1995. Up until FYE 2002 all those who reported having a long-standing limiting illness were identified as having a disability. From FYE 2003, statistics are based on responses to questions about difficulties across a number of areas of life. Figures for FYE 2003 and FYE 2004 are based on those reporting substantial difficulties across eight areas of life and figures from FYE 2005 to FYE 2012 are based on those reporting substantial difficulties across nine areas of life. From FYE 2013 the FRS disability questions were revised to reflect new harmonised standards. Disabled people are identified as those who report any physical or mental health condition(s) or illness(es) that last or are expected to last 12 months or more, and which limit their ability to carry out day-to-day activities a little, or a lot.
FRS questions FYE 2005 to FYE 2012
The FRS/HBAI definition for an adult with a disability is if they answered yes to the ‘Health’ question and yes to any of the difficulties listed in ‘DisDif’.
Health
Do you have any long-standing illness, disability or infirmity? By ‘long-standing’ I mean anything that has troubled you over a period of at least 12 months or that is likely to affect you over a period of at least 12 months.
If ‘yes’ to Health.
HProb
Does this physical or mental illness or disability (Do any of these physical or mental illnesses or disabilities) limit your activities in any way?
If ‘yes’ to Health.
DisDif
Does this/Do these health problem(s) or disability(ies) mean that you have substantial difficulties with any of these areas of your life?
- Mobility (moving about)
- Lifting, carrying or moving objects
- Manual dexterity (using your hands to carry out everyday tasks)
- Continence (bladder and bowel control)
- Communication (speech, hearing or eyesight)
- Memory or ability to concentrate, learn or understand
- Recognising when you are in physical danger
- Your physical co-ordination (e.g.: balance)
- Other health problem or disability
- None of these
FRS questions FYE 2013 onwards
The FRS/HBAI definition for an adult with a disability is if they answered yes to the ‘Health1’ and yes, a lot or yes, a little to the ‘Condition’ question.
Health1
Do you have any physical or mental health conditions or illnesses lasting or expected to last for 12 months or more?
- Yes
- No
- Don’t know (spontaneous)
- Refusal (spontaneous)
If ‘yes’ to Health1.
Dis1
Do any of these conditions or illnesses affect you in any of the following areas?
- Vision (for example blindness or partial sight)
- Hearing (for example deafness or partial hearing)
- Mobility (for example walking short distances or climbing stairs)
- Dexterity (for example lifting and carrying objects, using a keyboard)
- Learning or understanding or concentrating
- Memory
- Mental Health
- Stamina or breathing or fatigue
- Socially or behaviourally (for example associated with autism, attention deficit disorder or Asperger’s syndrome)
- Other
- Refusal (spontaneous)
Ask if Health1=Yes
Condition
Does your condition or illness/do any of your conditions or illnesses reduce your ability to carry-out day-to-day activities?
- Yes, a lot
- Yes, a little
- Not at all
Comparisons over time
Compared to FYE 2012 the number of individuals in disabled families went up by 0.2m in FYE 2013 (similar to those in non-disabled families).
However, while the number of pensioners in non-disabled families increased by 0.4m, the number in disabled families decreased by 0.3m.
The reverse was true for the number of children in disabled families, which increased by 0.3m, while those in non-disabled families fell by 0.2m.
These figures could be affected by the change in the disability questions. Individuals might have different interpretations of particular health conditions or question wording meaning that changes to the disability question may have had a different effect on certain groups. Therefore, comparisons over time should be made with caution, as they may be affected by the change in the definition of disability.
Comparison with EU low-income statistics
The UK’s 2017 cross-Europe-comparable low-income statistics are now being derived from the Survey of Living Conditions, a different survey source than the HBAI, meaning that there will be some differences due to the different data source. In addition to this, the figures will differ for a number of further reasons:
Time period: The figures are presented on different timescales. The HBAI figures are presented for the financial year, while the EU comparable figures are presented for the calendar year.
Population groups: The European low-income statistics are presented in different age groups than the HBAI figures:
-
children: the EU figures relate to those under 18 – HBAI figures are based on individuals aged under 16, in addition a person will also be defined as a child if they are 16 to 19-years old and they are not married nor in a Civil Partnership nor living with a partner; are living with parents; and are in full-time non-advanced education or in unwaged government training
-
pensioners: EU figures relate to the 65+ population – In April 2018, the State Pension age was over 64 years 5 months for women and 65 years for men. On 6 March 2019, the State Pension age for both men and women increased to over 65 years 2 months
Preferred measures: The European low-income estimates are usually presented on a Before Housing Costs basis, while this is consistent with the most commonly used measure for working-age adults and children, we choose to look at pensioners’ incomes after deducting housing costs as this better reflects pensioner living standards compared to others and over time.
Income derivation: The definition of income in the European figures differs from the official UK figures:
-
Pension contributions are not deducted from income in the European comparable methodology
-
The European definition of income includes the value of non-cash employee income from company cars as employee income, which will raise the average income of people in work
High income adjustment: For the HBAI figures an adjustment is made to sample cases at the top of the income distribution to correct for volatility in the highest incomes captured in the survey. This adjustment is not applied to the European figures.
In year deflation: The HBAI estimates make an in year adjustment to individuals incomes to ensure that respondents income collected across the financial year are comparable. This adjustment is not applied to the European figures.
Sample cases: The HBAI figures exclude cases containing a married adult whose spouse is temporarily absent whereas these are included in the European figures, however this has a minimal effect on the figures.
Income tax and national insurance: The European income tax and national insurance figures are calculated using a model of taxation, whilst the HBAI estimates are mostly calculated on the amount of tax and national insurance reported as being paid.
A description of how levels of low income in the UK compare with other EU countries is available from Eurostat.
Glossary
Adult
All those individuals who are aged 16 and over, unless defined as a dependent child (see Child); all adults in the household are interviewed as part of the Family Resources Survey (FRS).
Benefit units or Family
A single adult or a married or cohabiting couple and any dependent children; since January 2006 same-sex partners (civil partners and cohabitees) have been included in the same benefit unit. Where a total value for a benefit unit is presented, such as total benefit unit income, this includes both income from adults and income from children.
Bills in arrears
The number of bills in arrears is presented at a benefit unit level. Bills considered are: electricity, gas, other fuel, Council Tax, insurance, telephone, television / video rental, hire purchase, water rates, rent, mortgage payments and other loans. From Financial Year Ending (FYE) 2013 onwards, the analysis of income by whether people are behind with household bills has been extended to include rent, mortgage payments and other loans, so the figures are not comparable with those presented in previous reports.
Child
A dependent child is defined as an individual aged under 16. A person will also be defined as a child if they are 16 to 19-years old and they are:
-
not married nor in a civil partnership nor living with a partner; and
-
living with parents/a responsible adult; and
-
in full-time non-advanced education or in unwaged government training
Confidence interval
A measure of sampling error. A confidence interval is a range around an estimate which states how likely it is that the real value that the survey is trying to measure lies within that range. A wider confidence interval indicates a greater uncertainty around the estimate. Generally, a smaller sample size will lead to estimates that have a wider confidence interval than estimates from larger sample sizes. This is because a smaller sample is less likely than a larger sample to reflect the characteristics of the total population and therefore there will be more uncertainty around the estimate derived from the sample. Note that a confidence interval ignores any systematic errors which may be present in the survey and analysis processes.
Contemporary median income
The average income for the period covered by the survey. Household incomes are adjusted from the date of interview to an average of survey-year prices.
Deciles and Quintiles
These are income values which divide the whole population, when ranked by household income, into equal-sized groups. This helps to compare different groups of the population.
Decile and quintile are often used as a standard shorthand term for decile/quintile group.
Deciles groups are ten equal-sized groups - the lowest decile describes individuals with incomes in the bottom 10 per cent of the income distribution.
Quintiles groups are five equal-sized groups - the lowest quintile describes individuals with incomes in the bottom 20 per cent of the income distribution.
Disability
From FYE 2013 onwards, the definition of disability used is consistent with the core definition of disability under the Equality Act 2010. A person is considered to have a disability if they “have a physical or mental impairment that has a ‘substantial’ and ‘long-term’ negative effect on their ability to do normal daily activities”. Where by ‘substantial’ is meant by more than minor or trivial, and long-term is meant by 12 months or more. However, some individuals classified as disabled and having rights under the Equality Act 2010 are not captured by this definition:
-
people with a long-standing illness or disability who would experience substantial difficulties without medication or treatment
-
people who have been diagnosed with cancer, HIV infection or multiple sclerosis and who are not currently experiencing difficulties with their day to day activities
-
people with progressive conditions, where the effect of the impairment does not yet impede their lives
People who were disabled in the past and are no longer limited in their daily lives are still covered by the Act
Economic status of the family
The economic status of the family classification is in line with the International Labour Organisation economic status classification. This means that no economic status data is available for FYE 1995 and FYE 1996 as the relevant information was not collected in the Family Resources Survey for these years. This also means the economic status of the family and economic status of the household classifications are aligned.
The ‘Workless, other inactive’ group consists of families in which all adults are economically inactive (i.e. where no adult is in work or unemployed). This includes working-age adults in receipt of sickness and disability benefits, who may have living standards lower than those implied by the results presented because of additional costs associated with their disability (for which no adjustment has been made here).
Families are allocated to the first applicable category:
-
One or more full-time self-employed – Benefit units where at least one adult usually works as self-employed in their main job where the respondent regards themselves as working full-time. Those respondents not working in the last seven days but doing unpaid work in their own business are considered as full-time self-employed
-
Single or couple, all in full-time work – Benefit units where all adults regard themselves as working full-time. Those respondents not working in the last seven days doing unpaid work in a business that a relative owns are considered as in full-time work, as are those in training
-
Couple, one in full-time work, one in part-time work – Benefit units headed by a couple where one partner considers themselves to be working full-time and the other partner considers themselves to be working part-time. Those respondents not working in the last seven days but doing an odd job are considered as working part-time
-
Couple, one in full-time work, one not working – Benefit units headed by a couple, where one partner considers themselves to be working full-time and the other partner does not work
-
No-one in full-time work, one or more in part-time work – Benefit units where at least one adult works, but considers themselves to be working part-time
-
Workless, one or more aged 60 or over – Benefit units where at least one adult is aged 60 or over
-
Workless, one or more unemployed – Benefit units where at least one adult is unemployed
-
Workless, other inactive – Benefit units not classified above (this group includes the long-term sick, disabled people and non-working single parents)
Economic status groups for children
The tables that show estimates for dependent children use an amended economic status classification closely related to the definitions used above. Children are grouped according to family type and the economic status of their parent(s) as defined in the previous section. As with the main economic status groups, individuals are allocated to the first category that applies in the following order:
Lone parent:
-
in full-time work (includes full-time self-employed)
-
in part-time work; and
-
not working (unemployed or inactive)
Couple with children
-
one or more full-time self-employed
-
both in full-time work
-
one in full-time work, one in part-time work
-
one in full-time work, one not working
-
neither in full-time work, one or more in part-time work; and
-
both workless (unemployed or inactive)
Economic status of household
For the analysis of working and workless households, households are classified according to whether they contain a working-age adult or pensioner who works, but the status of non-working pensioners is not considered, except in the case of those households where children live only with pensioners, in which case the status of all adults is included.
Individuals are assigned to one of three categories:
-
All adults in work – A household where all working-age adults are in employment or are self-employed, or if there are no working-age adults in the household, at least one working pensioner
-
At least one, but not all adults in work – A household where at least one working-age adult is in employment or is self-employed, or where a pensioner is in work if none of the working-age adults in the household are in work
-
Workless household – A household where no adult members are in employment or are self-employed. Within households, pensioners are excluded from the classifications if they are not working, and are included if they are working. So for example, a household with a pensioner in work, but a working-age person not in work, would be in the ‘At least one adult in work, but not all’ category. A household with all working-age adults in work and a pensioner not in work would be categorised as ‘All adults in work’
Educational Attainment
This looks at the highest level of educational attainment for each working-age adult. Information for students should be treated with some caution because they are often dependent on irregular flows of income. Only student loans are counted as income in HBAI, any other loans taken out are not. The figures are also not necessarily representative of all students because HBAI only covers private households and this excludes halls of residence.
Comparisons between the numbers with no qualifications in the FRS, LFS and the Census indicate that the FRS figures overstate the numbers of working-age adults with no qualifications.
Equivalisation
Income measures used in HBAI take into account variations in the size and composition of the households in which people live. This process is called equivalisation.
Equivalisation reflects the fact that a family of several people needs a higher income than a single individual in order for them to enjoy a comparable standard of living.
Equivalence scales conventionally take a couple with no children as the reference point. Consider a single person, a couple with no children, and a couple with two children aged twelve and ten, all having unadjusted weekly household incomes of £300 (BHC). The process of equivalisation, as conducted in HBAI, gives an equivalised income of £448 to the single person, £300 to the couple with no children, but only £214 to the couple with children.
Ethnicity
The ethnicity figures in the HBAI publication reflect the harmonised standards included from the FYE 2012 publication onwards. The harmonised standards for Scotland were adopted in the FYE 2013 FRS questionnaire; however, there has been no change to the HBAI outputs as the harmonised output standards were previously adopted.
Individuals have been classified according to the ethnic group of the household reference person (see Household reference person) which means that information about households of multiple ethnicities is lost.
Smaller ethnic minority groups exhibit year-on-year variation which limits comparisons over time. For this reason, analysis by ethnicity is presented as three-year averages.
Families and family unit
The terms ‘families’ and ‘family units’ are used interchangeably with benefit units. See Benefit unit definition.
Family type
For some analyses, individuals are classified into family type or economic status groups. Individuals are classified according to the status of the benefit unit in which they live. All individuals in a benefit unit (adults and children) will therefore be given the same classification. The classifications are defined below:
-
Pensioner couple – a couple where one or more of the adults are State Pension age or over. However, in the HBAI tables relating specifically to pensioners results for individuals who are in pensioner couples do not count anyone who is not a pensioner
-
Single male pensioner – single male adult of State Pension age or over
-
Single female pensioner – single female adult of State Pension age or over
-
Couple with children – a non-pensioner couple with dependent children
-
Single with children – a non-pensioner single adult with dependent children
-
Couple without children – a non-pensioner couple with no dependent children
-
Single male without children – a non-pensioner single adult male with no dependent children
-
Single female without children – a non-pensioner single adult female with no dependent children
Full-time work
The respondent regards themselves as working full-time, either as an employee or self-employed.
Gender
In any analysis of gender, it must be remembered that HBAI attempts to measure the living standards of an individual as determined by household income. This assumes that both partners in a couple benefit equally from the household’s income, and will therefore appear at the same position in the income distribution. Any difference in figures can only be driven by gender differences for single adults, which will themselves be diluted by the figures for couples. The lower level gender disaggregation in the family type classification is therefore likely to be more informative.
Research (See, for instance, Goode, J., Callender, C. and Lister, R. (1998) Purse or Wallet? Gender Inequalities and the Distribution of Income in Families on Benefits. JRF/Policy Studies Institute.) has suggested that, particularly in low-income households, the above assumption with regard to income sharing is not always valid as men sometimes benefit at the expense of women from shared household income. This means that it is possible that HBAI results broken down by gender could understate differences between the two groups.
Gini coefficient
A widely-used, international standard summary measure of inequality. It can take values from zero to 100, where a value of zero would indicate total equality, with each household having an equal share of income, while higher values indicate greater inequality.
Head of benefit unit
The head of the first benefit unit will be the same as the household reference person. For second and subsequent benefit units, the head will be the first adult to be interviewed.
High Income
Results for the top 10 per cent are particularly susceptible to sampling errors and income measurement problems.
Household
One person living alone or a group of people (not necessarily related) living at the same address who share cooking facilities and share a living room or sitting room or dining area. A household will consist of one or more benefit units. Where a total value for a household is presented, such as total household income, this includes both income from adults and income from children.
Household reference person (used from FYE 2002 onwards)
This is classified as the Highest Income Householder (HIH); without regard to gender.
In a single adult household the HIH is the sole householder (i.e. the person in whose name the accommodation is owned or rented).
If there are two or more householders the HIH is the householder with the highest personal income from all sources.
If there are two or more householders who have the same income the HIH is the eldest householder
Housing costs
Housing costs are made up of: rent (gross of housing benefit); water rates, community water charges and council water charges; mortgage interest payments (net of tax relief); structural insurance premiums (for owner occupiers); and ground rent and service charges.
Income
The income measure used in HBAI is weekly net (disposable) equivalised household income. This comprises total income from all sources of all household members including dependants. For BHC, housing costs are not deducted from income, while for AHC they are.
Households receive income from a variety of sources. The main ones are earnings, self-employment, state support (i.e. benefits and tax credits), interest on investments and occupational pensions.
In detail, income includes:
-
usual net earnings from employment
-
profit or loss from self-employment (losses are treated as a negative income)
-
state support – all benefits and tax credits
-
income from occupational and private pensions
-
investment income
-
maintenance payments
-
income from educational grants and scholarships (including, for students, student loans and parental contributions)
-
the cash value of certain forms of income in kind (free school meals, free school breakfast, free school milk, free school fruit and vegetables, Healthy Start vouchers and free TV licence for people 75 and over)
Income is net of the following items:
-
income tax payments
-
National Insurance contributions
-
domestic rates and council tax
-
contributions to occupational pension schemes (including all additional voluntary contributions (AVCs) to occupational pension schemes, and any contributions to stakeholder and personal pensions)
-
all maintenance and child support payments, which are deducted from the income of the person making the payment
-
parental contributions to students living away from home
-
student loan repayments
Income distribution
The spread of incomes across the population.
Income growth in real terms
For some years, income growth in the HBAI-based series appears slightly lower than the National Accounts estimates. The implication of this is that absolute real income growth could be understated in the HBAI series. Comparisons over a longer time period are believed to be more robust.
Income inequality
The extent of disparity between high income and low-income households, commonly measured using either the Gini coefficient or 90:10 ratio. The Gini coefficient is a widely-used, international standard summary measure of inequality. It can take values from zero to 100, where a value of zero would indicate total equality, with each household having an equal share of income, while higher values indicate greater inequality. The 90:10 ratio is the average (median) income of the top 20 per cent (quintile 5), divided by the average income of the bottom 20 per cent (quintile 1). The higher the number, the greater the gap between those with the highest incomes and those with the lowest incomes.
Low income
‘Low income’ is defined using thresholds derived from percentages of median income for the whole population. Households reporting the lowest incomes may not have the lowest living standards. The bottom 10 per cent of the income distribution should not, therefore, be interpreted as having the bottom 10 per cent of living standards. Results for the bottom 10 per cent are also particularly vulnerable to sampling errors and income measurement problems.
Individuals are said to be in relative low income if they live in a household with an equivalised income below a percentage of contemporary median income BHC or AHC. Relative low-income statistics fall if income growth at the lower end of the income distribution is greater than overall income growth.
Individuals are said to be in absolute low income if they live in a household with an equivalised income below a threshold of median income (for example 60 per cent of median income) in a specific year adjusted for inflation BHC or AHC. The FYE 2011 median is used in this report, in order to measure absolute low income as referenced in the Welfare Reform and Work Act 2016, and to keep the absolute measure more in line with contemporary living standards. Absolute low-income statistics fall if low-income households are seeing their incomes rise faster than inflation.
Material deprivation for children
A suite of questions designed to capture the material deprivation experienced by families with children has been included in the FRS since FYE 2005. Respondents are asked whether they have 21 goods and services, including child, adult and household items. If they do not have them, they are asked whether this is because they do not want them or because they cannot afford them. These questions are used as an additional way of measuring living standards for children and their families. A prevalence weighted approach has been used in combination with a relative low-income or severe relative low-income threshold.
Combined low income and material deprivation
A child is considered to be in low income and material deprivation if they live in a family that has a final material deprivation score of 25 or more and an equivalised household income below 70 per cent of median income BHC.
Severe low income and material deprivation
A child is considered to be in severe low income and material deprivation if they live in a family that has a final material deprivation score of 25 or more and an equivalised household income below 50 per cent of median income BHC.
Material deprivation for pensioners
A suite of questions designed to capture the material deprivation experienced by pensioners aged 65 or over has been included in the Family Resources Survey since May 2008. These questions are used as an additional way of measuring living standards for pensioners. Respondents are asked whether they have access to 15 goods, services and experiences. Where a pensioner lacks one of the material deprivation items for one of the following reasons they are counted as being deprived for that item:
-
they do not have the money for this
-
it is not a priority on their current income
-
their health or disability prevents them
-
it is too much trouble or tiring
-
they have no one to do this with or help them
-
other
The exception to this is for the unexpected expense question, where pensioners are counted as materially deprived for this item if and only if they responded ‘no’ to the initial question.
A prevalence weighted approach has been used.
Mean
Mean equivalised household income of individuals is found by adding up equivalised household incomes for each individual in a population and dividing the result by the number of people.
Median
Median household income divides the population, when ranked by equivalised household income, into two equal-sized groups. Contemporary median income refers to the median income in the survey year being considered.
Part-time work
The respondent regards themselves as working part-time, either as an employee or self-employed.
Pensioner
Pensioners are defined as all those adults above State Pension age (SPa).
For women born on or before 5th April 1950, SPa is 60. Since 6 April 2010, the State Pension age for women has been gradually increasing. In April 2018, the State Pension age was over 64 years 5 months for women and 65 years for men. On 6 March 2019, the State Pension age for both men and women increased to over 65 years 2 months. The State Pension age for both men and women will continue to increase at the same rate, reaching 66 by October 2020.
State pension age timetables on GOV.UK.
Pensioner classifications
In HBAI tables relating to ‘all individuals’, the classification pensioner couple includes individuals in a family unit where one member is above State Pension age, and one is below. This differs from results in HBAI tables relating specifically to ‘pensioners’, where only individuals above State Pension age are included. Thus, if a pensioner above State Pension age has a working-age partner, they will both be included under results for pensioner couple in ‘all individuals’ tables, but in ‘pensioner’ tables the working-age partner will be excluded as they will appear in the ‘working-age population’ tables.
Prevalence weighted
Prevalence weighting is a technique of scoring deprivation, in which more weight in the deprivation measure is given to families lacking those items that most families already have. This means a greater importance, when an item is lacked, is assigned to those items that are more commonly owned in the population.
Region and country
Regional classifications (information is at NUTS1 level ) are based on the standard statistical geography of the former Government Office Regions: nine in England, and a single region for each of Scotland, Wales and Northern Ireland. These regions are built up of complete counties or unitary authorities. Tables also include statistics for England as a whole, and detailed breakdown tables split London into Inner and Outer London to aid comparison with other Family Resources Survey-based publications. For more information on National Statistics geography see ONS’s webpage on UK Geographies.
Disaggregation by geographical regions is presented as three-year averages. This presentation has been used as single-year regional estimates are considered too volatile. Estimates for the UK, however, are shown as single-year estimates for the latest available year.
Although the FRS sample is large enough to allow some analysis to be performed at a regional level, it should be noted that no adjustment has been made for regional cost of living differences, as the necessary data are not available. In the analysis here it is therefore assumed that there is no difference in the cost of living between regions, although the AHC measure will partly take into account differences in housing costs.
Sampling error
The uncertainty in the estimates which arises from taking a random sample of the household population. The likely size of this error for a particular statistic can be identified and expressed as a confidence interval.
Savings and investments
The total value of all liquid assets, including fixed term investments. Figures are taken from responses to questions on the value of assets or estimated from the interest on the savings when these questions are not asked. Note that banded savings do not include assets held by children in the benefit unit/household. The derivation of total savings used in the tables means that “no savings” specifically relates to cases where the respondent said that they had no accounts/investments, refused to answer, didn’t know, or some accounts/investments were recorded but none of them yielded any interest/dividends.
The data relating to investments and savings should be treated with caution. Questions relating to investments are a sensitive section of the questionnaire and have a low response rate. A high proportion of respondents do not know the interest received on their investments. It is likely that there is some under-reporting of capital by respondents, in terms of both the actual values of the savings and the investment income.
Skewness
Skewness measures the degree to which a statistical distribution is asymmetrical or lopsided. A perfectly symmetrical distribution is not skewed. A distribution with a long tail to the right, such as the UK income distribution, is positively skewed.
Sources of income
Households receive income from a variety of sources. The main ones are earnings, self-employment, state support (i.e. benefits and tax credits), interest on investments and occupational pensions.
It should be noted that comparisons with National Accounts data would suggest that surveys such as the FRS understate investment income. It is also the case that the FRS underestimates receipt of most types of State Support.
State support
The Government pays money to individuals in order to support them financially under various circumstances. Most of these benefits are administered by DWP. The exceptions are Housing Benefit and Council Tax Reduction, which are administered by local authorities. Tax Credits are not treated as benefits, but both Tax Credits and benefits are included in the term State Support.
Income-related benefits for the United Kingdom:
-
Council Tax Reduction
-
Employment and Support Allowance (income-related element)
-
Extended Payments (Council Tax Reduction and Housing Benefit)
-
Housing Benefit
-
Income Support
-
Jobseeker’s Allowance (income-based element)
-
Pension Credit
-
Social Fund – Funeral Grant
-
Social Fund – Sure Start Maternity Grant
-
Universal Credit
Non-Income-related benefits for the United Kingdom
-
Armed Forces Compensation Scheme
-
Attendance Allowance
-
Bereavement or Widowed Parent’s Allowance
-
Bereavement Support Payment
-
Carer’s Allowance
-
Child Benefit
-
Disability Living Allowance (both mobility and care components)
-
Employment and Support Allowance (contributory element)
-
Guardian’s Allowance
-
Incapacity Benefit
-
Industrial Injuries Disablement Benefit
-
Jobseeker’s Allowance (contributory element)
-
Maternity Allowance
-
Personal Independence Payment (Daily Living and Mobility components)
-
Severe Disablement Allowance
-
State Pension
-
Statutory Maternity/Paternity/Adoption Pay
-
Statutory Sick Pay
-
Winter Fuel Payments
Income-related benefits for Northern Ireland:
-
Northern Ireland Other Rate Rebate
-
Northern Ireland Rate Rebate through energy efficient homes
-
Northern Ireland Rate Relief
-
Rates Rebate
Non-Income related benefits for Northern Ireland:
-
Northern Ireland Disability Rate Rebate
-
Northern Ireland Lone Pensioner Rate Rebate
Threshold
An equivalised income value used for comparing sections of an income distribution over time or for comparing proportions of groups over time, for example: fractions of FYE 2011 median income or fractions of contemporary medians. A relative threshold is relative to the contemporary median for each year’s survey. A fixed threshold uses the median from an ‘anchor’ year which is then up-rated for inflation as appropriate. For example, the absolute threshold ‘60 per cent of the FYE 2011 median income’ in FYE 2011 is the same as the relative threshold, but the corresponding value in the latest survey year has been up-rated by inflation from the FYE 2011 level over the intervening period.
Working-age
Working-age adults are defined as all adults below State Pension age.
Annexes
Annex 1: Benefit and tax reform in FYE 2020
This Annex summarises some of the major benefit and tax reforms which came into effect in FYE 2019. It is not intended to represent an exhaustive list.
Council Tax
In England, the Ministry of Housing, Communities and Local Government estimated that the average Band D council tax set by local authorities in FYE 2020 represented an increase of 4.7 per cent on FYE 2019 levels.
In Wales, the average Band D council tax in FYE 2020 also represented an increase of 6.6 per cent on FYE 2020 levels.
In Scotland, the average Band D council tax in FYE 2020 represented an increase of 3.6% per cent on FYE 2020 levels.
In Northern Ireland, the Regional Rate for FYE 2020 increased by 4.8 per cent on 2019 levels.
Housing Benefit
In 2019 to 2020, most Local Housing Allowance (LHA) rates remained frozen at 2015-16 cash values. Rates in the least affordable areas were given Targeted Affordability Fund (TAF), which amounts to a three per cent increase.
The majority of Housing Benefit rates for 2019 to 2020 remained unchanged.
Income Tax
In FYE 2019, the income tax personal allowance increased by £350 to £11,850. The threshold for the 40 per cent rate of income tax increased from £45,000 to £46,350.
National Living Wage
In April 2019, the National Living Wage was increased to £8.21 per hour for employees aged 25 years and over. Employees under the age of 25 continue to get the National Minimum Wage, which increased from April 2019 to £7.70 for those aged 21 to 24 years and £6.15 for those aged 18 to 20 years.
Pension Participation
Automatic enrolment completed its roll-out in 2018.
From April 2019, the minimum contribution increased by three percentage points to eight per cent with at least three per cent from the employer.
Pension Credit
From May 2019, couples where only one person is over State Pension Age, will no longer be able to claim Pension Credit. Instead, mixed age couples will be able to claim Universal Credit until both parties reach State Pension Age.
Personal Independence Payment
PIP was introduced from April 2013 for new claimants and from October 2013 DWP began inviting claimants in receipt of DLA who were aged between 16 and 64 on 8 April 2013, or reached age 16 after that date to claim PIP.
In March 2016, there were just over 750,000 PIP claims in payment, rising to approximately 2.2 million by April 2019.
State Pension
The new single-tier State Pension launched on 6 April 2016 for people who reach pension age on or after April 2016, to replace the basic State Pension and additional State Pension. This consolidated the basic State Pension and additional State Pension into one single amount. The amount paid to individuals may be less, depending on recipients’ National Insurance contributions.
From 6 April 2010, the State Pension age has been increasing gradually for both men and women. The data in this report were collected throughout FYE 2020, during which the State Pension age for both men and women increased from 65 years 2 months to 65 years 8 months.
From April 2019, the basic State Pension increased from £125.95 to £129.30 per week. The new State Pension rose from £164.35 to £168.60 per week.
Support for Mortgage Interest
In April 2018 the Support for Mortgage Interest Loans (SMIL) scheme was introduced to provide support for mortgage interest through a loan instead of benefits. In tandem with this change, Mortgage Payment Protection Insurance (MPPI) payments are fully disregarded in all means tested benefits if the claimants would be entitled to a SMIL and all MPPI is disregarded in the calculation of Universal Credit.
Universal Credit
Since April 2013, Universal Credit has been replacing income-based Jobseeker’s Allowance, income-based Employment and Support Allowance, Income Support, Working Tax Credit, Child Tax Credit and Housing Benefit.
National roll-out of Universal Credit, for all new relevant claims, completed in December 2018. Existing exceptions within the two child policy for kinship carers and adopters were extended to apply to any eligible children in a household from November 2018.
Existing claimants on legacy benefits without a change in circumstance can currently remain on their legacy benefit(s) until there is a change in circumstance.
A Severe Disablement Premium (SDP) was introduced in January 2019, meaning that SDP recipients stay on legacy benefits if they experience a change of circumstances that would normally prompt a move to Universal Credit.
In July 2019, The Universal Credit (Managed Migration Pilot and Miscellaneous Amendments) Regulations 2019 were introduced. These provided for the removal of the Severe Disability Premium (SDP) Gateway from 27 January 2021, meaning that from this date, SDP recipients will be able to make a new claim to Universal Credit.
The regulations also introduced the SDP transitional payments to those claimants who were previously entitled to the SDP as part of their legacy benefit and had moved to Universal Credit before the SDP Gateway came into effect on 16 January 2019. The SDP transitional payments consisted of:
• an ongoing monthly amount of either £120, £285 or £405 depending on a person’s circumstances; and
• an additional lump-sum payment to cover the period since they moved onto UC
UC is being rolled out over a number of years and this process is not expected to be completed until September 2024: as a result, the composition of the UC caseload at the current time will not necessarily be the same as when UC is fully rolled-out.
Up-rating
From FYE 2017 to FYE 2020 certain working-age benefits were frozen at their FYE 2016 cash values. See gov.uk for benefit and pension rates for FYE 2020.
Working-age benefits, including the main rates of Jobseeker’s Allowance, Income Support, Universal Credit, Employment Support Allowance and Housing Benefit remained frozen at FYE 2016 cash values.
Child Benefit, along with some elements of tax credits, was frozen at FYE 2016 cash values. Family and childcare elements of tax credit were frozen in cash terms.
Benefits excluded from the freeze included:
-
Disability Living Allowance
-
Personal Independence Payment
-
Employment and Support Allowance Support Group component
-
UC Limited Capability for Work and Work-Related Activity Element
-
Premiums paid to disabled people receiving working-age benefits, where they, their partner and/or their children are disabled
-
Carer benefits
-
Pension benefits
-
Attendance Allowance
-
Maternity Allowance
-
Statutory Sick Pay
-
Statutory Maternity Pay
-
Statutory Paternity Pay
-
Statutory Shared Parental Pay
-
Statutory Adoption Pay
In April 2019:
-
The State Pension was up-rated by 2.6 per cent (CPI) in line with the triple lock, which ensures that it increases by the highest of the increase in earnings, price inflation (as measured by the CPI) or 2.5 per cent.
-
For FYE 2020, the Standard Minimum Guarantee in Pension Credit was increased by earnings resulting in a 2.6 per cent increase for a single person from £163.00 a week to £167.25, a cash increase of £4.25. For couples, the Standard Minimum Guarantee in Pension Credit was increased by earnings resulting in a 2.6 per cent increase from £248.80 a week to £255.25, a cash increase of £6.45
-
Universal Credit work allowances were increased by £1,000 per year
COVID-19
Some policy changes were implemented from March 2020 as a result of COVID-19. These will not be reflected in the data collected during the survey year FYE 2020 as interviews were suspended with the announcement of the first national lockdown, mid-March 2020.
Annex 2: Other relevant statistics
The HBAI report and statistics are released alongside a number of other statistics focused on income and low-income statistics across Government.
In February 2015 the United Kingdom Statistics Authority (UKSA) published a report on the outcome of a monitoring review into the Coherence and Accessibility of Official Statistics on Income and Earnings. A progress report was published in January 2016, with a further update in December 2018.
This review considers the way in which official statistics about income and earnings across Government are presented and includes summary details of the official statistics within the Review’s scope; discussion of the conceptual issues faced by users and advice needed when attempting to analyse official statistics; and makes recommendations around potential solutions to concerns identified and for the longer term development of income and earnings statistics.
The statistics highlighted below represent a number of statistical releases which might be considered alongside results from HBAI in order to give a more complete picture. This is not intended to be an exhaustive list and should be considered alongside details from the UKSA review highlighted, as well as ONS guidance on sources of data on earnings and income, with additional details at on important questions also available.
Poverty and income inequality in Scotland
In-depth analysis of HBAI data for Scotland can be found on the gov.scot website
Poverty statistics for Wales
In-depth analysis of relative income poverty in Wales can be found on the relative income poverty page of the Welsh Government website, which has links to material deprivation and persistent poverty analysis.
Households Below Average Income Report for Northern Ireland
In-depth analysis of HBAI data for Northern Ireland can be found on the communities-ni.gov website.
EU comparisons
A description of how levels of low income in the UK compare with other EU countries is available on the ec.europe.eu website.
Details of the differences between the EU and HBAI methodology are given in the main body of this report.
OECD international comparisons
The OECD income distribution database provides international comparisons on trends and levels in Gini coefficients before and after taxes and transfers, average household disposable incomes, relative poverty rates and poverty gaps, before and after taxes and transfers.
The effects of taxes and benefits on household income.
The article provides estimates of income, taxes and benefits (in cash and in kind) in decile groups ranked by equivalised disposable income.
See ONS website for further information.
Pensioners’ Incomes series.
Pensioners’ Income (PI) gives more a more detailed analysis of pensioners’ incomes.
Family Resources Survey
Family Resources Survey (FRS) publication gives some further results of FRS data analysis.
Income Dynamics
Income Dynamics (ID) is a publication based on longitudinal data, containing analysis of income movements and the persistence of low income for various population groups.
It supersedes Low-Income Dynamics, which was last published in September 2010.
Personal Incomes statistics
Personal Incomes statistics gives summary information about UK taxpayers, their income and the Income Tax to which they are liable.
Wealth in Great Britain
The Wealth and Assets Survey (WAS) is a large scale longitudinal survey with six waves currently published. The latest Wave (2016-2018) had a sample of 18,000 private households in Great Britain. It is conducted by the Office for National Statistics (ONS). The WAS dataset holds information about the economic status of households and individuals including their physical and financial assets, debts, and pension provision. The latest Wave of WAS can be found on the ons.gov website.
Measuring National Well-being
Drawing on social and economic data (including household income and expenditure) from government and other organisations; painting a picture of UK society and how it changes.
Estimates of income and low-income levels for small areas
HBAI data cannot be broken down below the level of region, due to sample size and coverage issues. However, there are some data sources that present information at smaller geographies:
Children in Low-Income Families Local Area Statistics
Alongside the release of this HBAI publication the DWP are also releasing a new set of experimental statistics for children in low-income families at a local level. These statistics will provide estimates of the number and proportion of children living in relative and absolute before housing costs low income by local area across Great Britain.
These new statistics replace earlier Official Statistics previously published by DWP (Children in out-of-work benefit households) and HMRC (Children in low-income families local measure). In December 2018, DWP and HMRC published their respective releases and announced a commitment to combine releases going forward.
With the rollout of Universal Credit and the Higher Income Child Benefit charge, neither previous measure offered an accurate view of children in low income families at a local level, and both Departments announced that a new set of statistics would be developed and published in order to better meet users’ needs.
The methodology underpinning these new statistics addresses three of the key limitations of the previous official statistics:
-
inclusion of Universal Credit and Tax Credits
-
calibration to HBAI estimates at regional level and by work-status
-
calculation of rates using ONS population estimates rather than Child Benefit claims which no longer provide a useable proxy given the Higher Income Child Benefit charge
Data are available on the GOV.UK website
Small area model-based income estimates for England and Wales
ONS produce model-based estimates of income at Middle Layer Super Output Area (MSOA) level for FYE 2018. This is available on the ons.gov website.
Admin-based income statistics, England and Wales
ONS also produce experimental estimates of gross and net income based on data from the Pay As You Earn and benefits systems
English Indices of Deprivation
The English Indices of Deprivation, produced by the Ministry of Housing, Communities and Local Government is a measure of relative levels of deprivation in small areas of England called Lower Layer Super Output Areas and is available at:
Welsh Index of Multiple Deprivation
The Welsh Index of Multiple Deprivation (WIMD is the official 2014 measure of deprivation in small areas in Wales. It is a relative measure of concentrations of deprivation at the small area level.
Scottish Index of Multiple Deprivation
The Scottish Index of Multiple Deprivation (SIMD) is the Scottish Government’s official tool for identifying those places in Scotland suffering from deprivation.
Northern Ireland Multiple Deprivation Measure
The Northern Ireland Multiple Deprivation Measure (NIMDM) is the official measure of spatial deprivation in Northern Ireland.
Annex 3
Uses and Users of HBAI statistics
HBAI is a key source for data and information about household income. Users include: policy and analytical teams within the DWP, the Devolved Administrations and other government departments, local authorities, parliament, academics, journalists, and the voluntary sector.
Researchers and analysts outside government use the statistics and data (available at the UK data service website) to examine topics such as income inequality, the distributional impacts of fiscal policies and understanding the income profile of vulnerable groups. Examples of published reports using HBAI data include:
-
“Living standards, poverty and inequality in the UK: 2020”: Bourquin, Joyce, Norris Keiller, Institute for Fiscal Studies, 2020
-
“UK Poverty 2020/21”: Barry, Bennett, Collingwood, Drake, Embleton, Leese, Matejic, Schwendel, Wenham, Wincup, Joseph Rowntree Foundation, 2021
-
“The Living Standards Audit 2020”: Brewer, Corlett, Handscomb, McCurdy, Tomlinson, Resolution Foundation, 2020
-
“Falling Behind, Getting Ahead: The Changing Structure of Inequality in the UK, 2007-2013”: Hills, Cunliffe, Obolenskaya and Karagiannaki, Centre for Analysis of Social Exclusion, 2015
Within government the statistics and data are used:
-
to inform policy development and monitoring, and for international comparisons
-
for three of the four income-related measures in the Welfare Reform and Work Act 2016. The HBAI report presents data for the income-related measures related to relative low income, combined low income and material deprivation, and absolute low income
-
to inform on progress against the DWP single departmental plan indicators related to the percentage of disabled people and the percentage of pensioners with a low income
-
in the DWP’s Policy Simulation Model (PSM - used extensively by analysts in DWP and the Department for Communities in Northern Ireland, for policy evaluation and costing of policy options) and HM Treasury’s Inter-Governmental Tax Benefit Model (IGOTM - used to model possible tax and benefit changes before policy changes are decided and announced)
-
to provide further equality information in compliance with the specific duties under the Equality Act 2010, as well as to the Ethnicity Facts and Figures (formerly the Race Disparity Audit)
The Scottish Government uses the HBAI data:
-
to support users to understand the issues and inequalities of concern in Scotland
-
to help to inform policy action, and to measure and evaluate the impact of changes or interventions
-
for three of the four income-related measures in the Child Poverty (Scotland) Act 2017
-
supporting the independent Poverty and Inequality Commission
-
as evidence for the Scottish Government’s National Performance Framework, specifically for the National Performance indicators on relative low income, income inequality and children in combined low income and material deprivation
-
to inform the Scottish Government’s Equality Evidence Strategy
The Welsh Government uses the HBAI data:
-
to support users to understand issues relating to poverty in Wales, and to help inform policy in this area
-
to measure progress on the National Indicators for Wales
-
to monitor progress of the Welsh Government’s Child Poverty Strategy (2015)
The Department for Communities in Northern Ireland uses HBAI data to:
-
to monitor progress of the Northern Ireland Child Poverty Strategy
-
to monitor progress against proposed indicators in the Northern Ireland Executive’s Programme for Government 2016-21. The Programme for Government is currently in draft form
Annex 4
Communicating uncertainty
Introduction
The figures in this publication come from the Family Resources Survey. This is a survey of over 19,000 households across the UK. Like all surveys, it gathers information from a sample rather than from the whole population. The size of the sample and the way in which the sample is selected are both carefully designed to ensure that it is representative of the UK as whole, whilst bearing in mind practical considerations such as time and cost constraints. Survey results are always estimates, not precise figures. This means that they are subject to a level of uncertainty which can affect how changes, especially over the short term, should be interpreted.
Estimating and reporting uncertainty
Two different random samples from one population, for example the UK, are unlikely to give exactly the same survey results and are likely to differ again from the results that would be obtained if the whole population was surveyed. The level of uncertainty around a survey estimate can be calculated and is commonly referred to as sampling error. In addition to sampling error the HBAI estimates can also be affected by non-sampling error such as non-response and a tendency to under-report benefit receipt.
We can calculate the level of uncertainty around a survey estimate by exploring how that estimate would change if we were to draw many survey samples for the same time period instead of just one. This allows us to define a range around the estimate (known as a “confidence interval”) and to state how likely it is that the real value that the survey is trying to measure lies within that range. Confidence intervals are typically set up so that we can be 95% sure that the true value lies within the range – in which case this range is referred to as a “95% confidence interval”.
Measuring the size of sampling error
Accuracy of the statistics
Confidence intervals are used as a guide to the size of sampling error. A confidence interval is a range around an estimate which states how likely it is that the real value the survey is trying to measure lies within that range. A wider confidence interval indicates a greater uncertainty around the estimate. Generally, a smaller sample size will lead to estimates that have a wider confidence interval than estimates from larger sample sizes. This is because a smaller sample is less likely than a larger sample to reflect the characteristics of the total population and therefore there will be more uncertainty around the estimate derived from the sample.
Statistical significance
Some changes in estimates from one year to the next will be the result of different samples being chosen, whilst other changes will reflect underlying changes in income across the population. Confidence intervals can be used to identify changes in the data that are statistically significant; that is, they are unlikely to have occurred by chance due to a particular sample being chosen.
Confidence intervals can give a range around the difference in a result from one year to the next. If the range does not include zero it indicates this change is unlikely to be the result of chance. Below gives more detail on how confidence intervals can be interpreted.
In the commentary report, results that are statistically significant are shown with an asterisk. Any results not marked by an asterisk are likely to have occurred as a result of chance. The HBAI estimates that are presented are the best estimate of the real value that the survey is trying to measure.
In the summary tables presented in this report, estimates of the percentage in low income that are statistically significant from the previous year are shown with an asterisk, with further information in the Uncertainty and Commentary Tables pages. Estimates of the number in low income that are statistically significant from the previous year are also shown with an asterisk. Changes marked by an asterisk are unlikely to have occurred as a result of chance. The HBAI estimates that are presented are the best estimate of the real value that the survey is trying to measure.
Non-sampling error
In addition to sampling error, non-sampling error is another area of uncertainty and is present in all surveys as well as in censuses. Non-sampling error encompasses all error other than sampling error. Types of non-sampling error include: coverage error, non-response error, measurement error and processing error. These errors are minimised in this survey by rigorous procedures; however, it is not possible to eliminate it completely and it cannot be quantified. It is important to bear in mind that confidence intervals are only a guide for the size of sampling error and cannot tell us anything about non-sampling error.
Working with uncertain estimates
Some changes between years will be small in relation to sampling variation and other sources of error and may not be statistically significant. This is relevant for particular sub-groups, as these will have smaller sample sizes than the overall survey sample size. For these sub-groups it is important to look at long-term trends.
Calculating uncertainty in the HBAI report
As the FRS is a sample from the UK population, any statistics derived from it are only estimates of the true numbers for the overall population. Prior to the FYE 2013 publication, confidence intervals for HBAI estimates were calculated using an estimating function approach. Since then, DWP has used bootstrapping techniques to measure how different a HBAI estimate might have looked if different FRS samples had been drawn.
The bootstrapping methodology used for the FYE 2013, FYE 2014 and FYE 2015 publications applied the original HBAI grossing factors to simple random resamples of the HBAI dataset to calculate confidence intervals for HBAI estimates.
The Institute for Fiscal Studies (IFS) were commissioned to develop the DWP methodology further to account as fully as possible for the specific features of the FRS sampling design for Great Britain (GB) and Northern Ireland (NI) and HBAI grossing process.
The new methodology, introduced from the FYE 2016 publication onwards, produces:
-
GB resamples simulating the FRS stratified, cluster sampling of GB households
-
NI resamples simulating the FRS stratified sampling of NI households
-
a unique set of grossing factors for each GB and NI resample, replicating the original HBAI grossing process, to produce lower and upper confidence intervals
accounting for:
-
Cluster sampling – this widens confidence intervals for most estimates, reflecting that this feature makes survey estimates less precise;
-
Post-sample grossing to population totals – this narrows confidence intervals for estimates sensitive to incomes towards the very top of the income distribution, as specific control totals are set for high income individuals.
Further details on methodological work undertaken by IFS, together with illustrative details of the impact of different aspects of the new methodology on key HBAI estimates for FYE 2014, are available in the published IFS report .
The following diagrams present:
- Summary of the New Bootstrapping Methodology
- GB FRS Sampling and Bootstrapping Resampling Process
- NI FRS Sampling and Bootstrapping Resampling Process
- HBAI Grossing and Bootstrapping Grossing Process
Summary of the New Bootstrapping Methodology
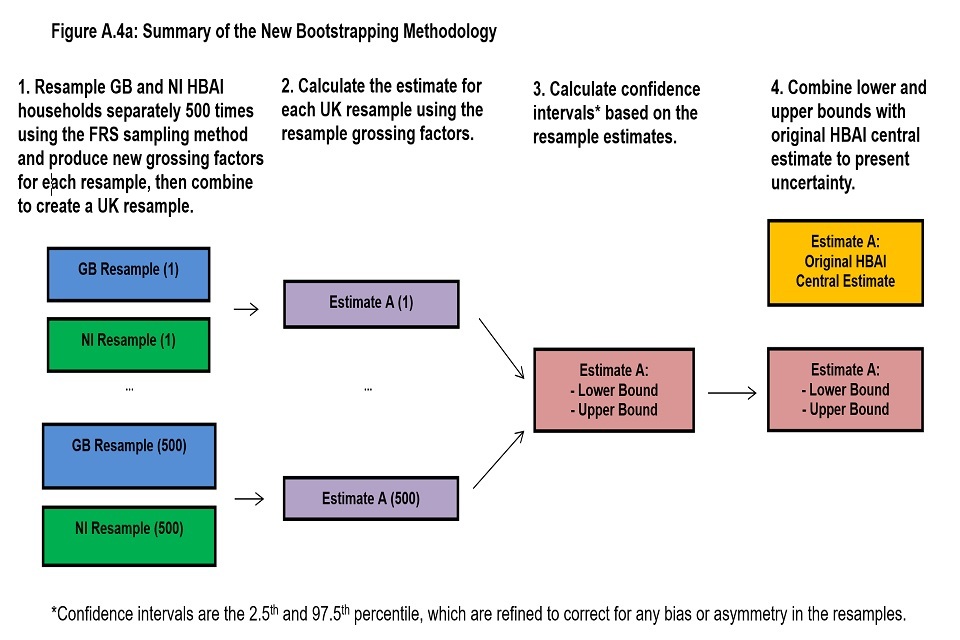
GB FRS Sampling and Bootstrapping Resampling Process
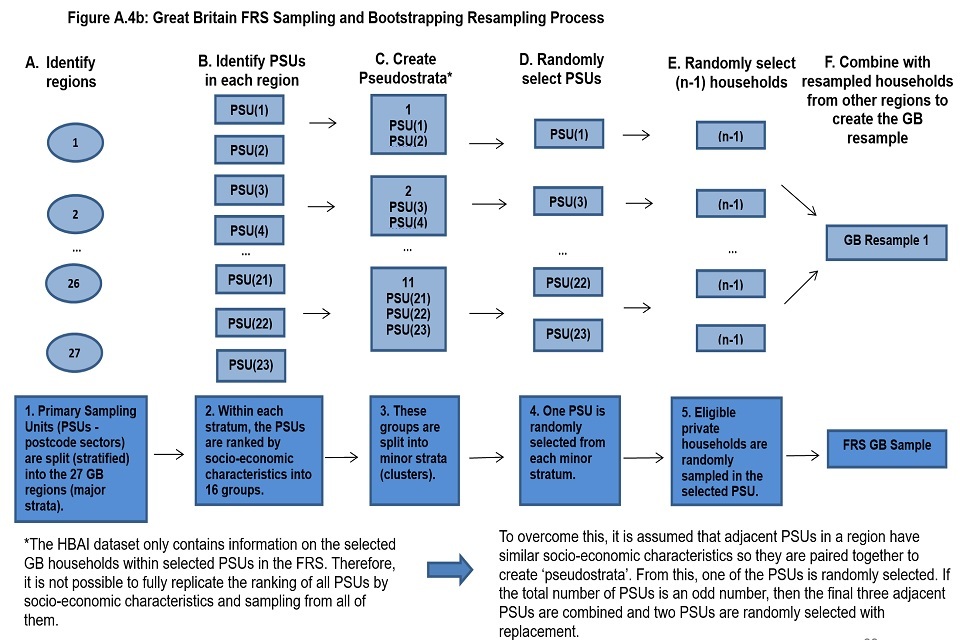
NI FRS Sampling and Bootstrapping Resampling Process
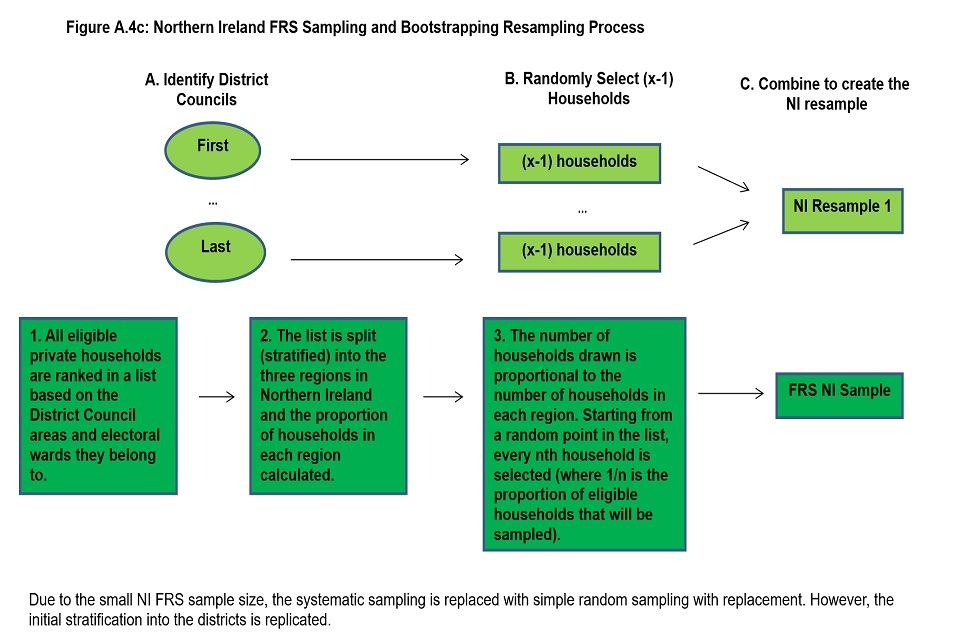
HBAI Grossing and Bootstrapping Grossing Process
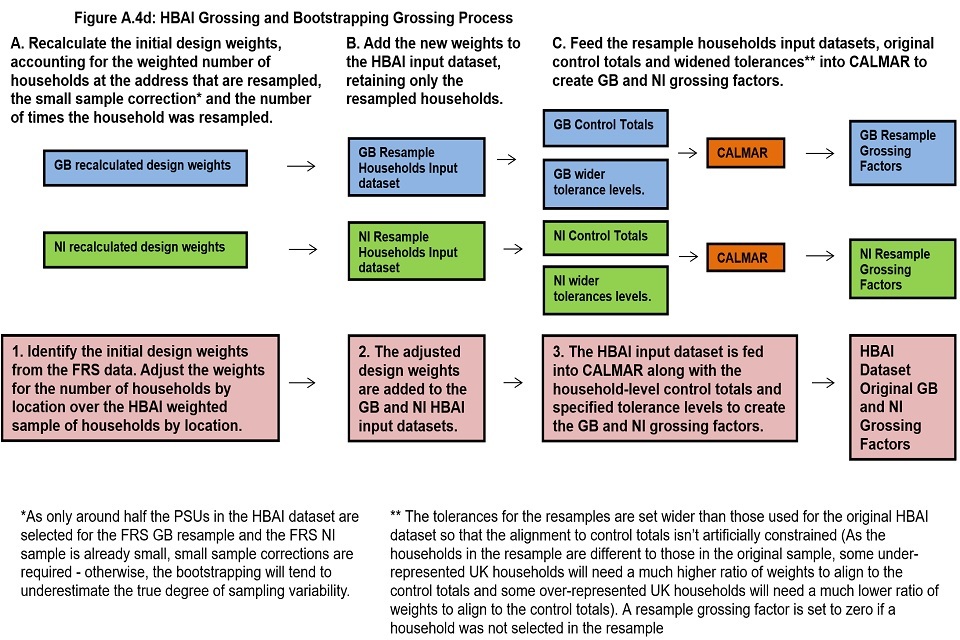
Further development work has been carried out on the derivation of the confidence intervals for HBAI estimates in the FYE 2017 publication, meaning results published in reports before this date may have changed slightly. The resample grossing factor datasets from FYE 1995 to the latest published year have been deposited at the UK Data Archive, along with user guidance on creating confidence intervals.
95 per cent confidence intervals
Confidence intervals are typically set up so that we can be 95 per cent sure that the true value lies within a certain range – in which case this range is referred to as a “95 per cent confidence interval”.
Example 1: Interpreting confidence intervals
17.9 per cent of individuals are estimated to be living in relative low income BHC. This figure has a stated confidence interval of 16.9 to 19.0 per cent (Table 8b). This means that we can be 95 per cent sure that between 16.9 and 19.0 per cent of individuals are in relative low income. Our best estimate is 17.9 per cent of individuals.
As well as calculating confidence intervals around the results obtained from one year of the survey, confidence intervals can also be calculated for the changes in results across survey years.
Example 2: Statistical significance
The estimated change in the percentage of individuals living in relative low income BHC from FYE 2019 to FYE 2020 is an increase of 1.1 percentage points (Table 8b). The confidence interval around this figure is -0.2 to 2.9 percentage points. This means that we can be 95 per cent sure that the actual change in the percentage of people living in relative low income is between a decrease of 0.2 percentage points and an increase of 2.9 percentage points, with the best estimate being a increase of 1.1 percentage points. As the confidence interval includes zero this change is not statistically significant, which indicates that there is at least a 5 per cent probability that the change in the percentage of individuals in relative low income is the result of chance.
If the confidence interval did not include zero we would conclude that the change is statistically significant i.e. the change is unlikely to be the result of chance.