The Gender Pensions Gap in Private Pensions: 2018 to 2020
Updated 22 July 2025
Applies to England, Scotland and Wales

© Crown copyright 2025
This publication is licensed under the terms of the Open Government Licence v3.0 except where otherwise stated. To view this licence, visit nationalarchives.gov.uk/doc/open-government-licence/version/3 or write to the Information Policy Team, The National Archives, Kew, London TW9 4DU, or email: psi@nationalarchives.gov.uk.
Where we have identified any third party copyright information you will need to obtain permission from the copyright holders concerned.
This publication is available at https://www.gov.uk/government/statistics/gender-pensions-gap-in-private-pensions/the-gender-pensions-gap-in-private-pensions
This ad-hoc statistical release defines, measures, and contextualises the Gender Pensions Gap in private pensions across Great Britain.
Workplace pension saving enables individuals to build up greater financial resilience in retirement. To support this, Automatic Enrolment (AE) into workplace pensions was introduced in 2012 to help address a decline in private pension saving and to make long-term saving the norm. Since then, an almost equal percentage of women and men save into a workplace pension. However, private pension wealth is not equally distributed, and women have less private pension wealth on average.
This publication defines and estimates the gap between the median male and female private pension wealth, which we call the Gender Pensions Gap (GPeG). We consider a five-year age band that includes normal minimum pension age (NMPA), the earliest you can access your pension savings. We only include uncrystallised private pension wealth, which is pension wealth that is not in payment, e.g., active or preserved. This is a complex issue, and important contextual information is also provided.
Pension provision in Great Britain is split between the State Pension (and supporting pensioner benefits, e.g., Pension Credit) and private pensions. Private pensions include both workplace pensions (occupational pensions) and personal pensions. This release is not considering State Pension provision. The introduction of the flat-rate new State Pension in 2016 has reduced the gap in State Pension payments men and women receive. Read more information on the State Pension.
Section 3 describes the Gender Pensions Gap and includes:
-
the percentage difference in median non-zero uncrystallised private pension wealth for men and women around NMPA
-
the percentage difference in median non-zero uncrystallised private pension wealth for men and women around NMPA, for those eligible to be automatically enrolled in a workplace pension scheme
-
the percentage difference in median non-zero uncrystallised private pension wealth for men and women who hold wealth in Defined Benefit schemes only, Defined Contribution schemes only, and Defined Benefit and Defined Contribution schemes
-
the Gender Pensions Gap metric over time, since 2006
Section 4 includes additional statistics to explore the Gender Pensions Gap.
The Wealth and Assets Survey is the main data source used in this publication and the key source of information on wealth in Great Britain. This publication also uses the Annual Survey of Hours and Earnings, the main source for workplace pension participation and contributions.
See the Background Information and Methodology Note accompanying this release for full definitions.
1. Main Stories
1.1 What is the Gender Pensions Gap?
The Gender Pensions Gap (GPeG) broadly describes inequality between male and female pension provision and can be defined in a variety of ways. The Department for Work and Pensions (DWP) has worked across government departments and welcomed suggestions from external organisations to create a new definition. This publication defines the GPeG in private pensions as the percentage difference between female and male uncrystallised median private pension wealth around normal minimum pension age for those individuals with private pension wealth. Uncrystallised private pension wealth includes that which is active or preserved, therefore not in payment.
-
the most recent data (2018to 2020) shows a GPeG of 35%
-
for employees eligible for AE, their GPeG is 32%
1.2 What context is important to understand the Gender Pensions Gap?
This publication provides context on participation and contribution rates by gender and sector. The GPeG needs to be seen in the light of the overall UK pension system, the labour market, as well as personal choices and circumstances.
-
the participation rate for AE eligible female and male employees across the whole economy in 2021 was 89% and 87%, giving an AE participation gap of minus 2ppts.
-
among adults aged 16 to 64, the male employment rate in 2022 was 79% and the female employment rate was 72%.
-
the total annual contribution into workplace pensions for AE eligible female and male employees in 2021 was £52.0 billion and £62.6 billion, giving a contribution gap of 17%. This means the percentage difference between the total annual contribution into workplace pensions for AE eligible men and women is bigger than the percentage difference in the employment rates.
2. What you need to know
The Gender Pensions Gap in private pensions is defined in this publication as the percentage difference in uncrystallised non-zero median private pension wealth between men and women around the normal minimum pension age (currently 55). This excludes other forms of wealth and State Pension or other benefits. There are many ways in which the Gender Pensions Gap can be defined such as amount saved, wealth accumulated, or income in retirement. This measure fluctuates with age adding to the complexity of the topic. There are a range of measures used by organisations which we have considered when creating this definition, for example:
-
the median private pension wealth in people’s early sixties as used by Pensions Policy Institute
-
the average size of male and female pension pots as used by Legal and General
-
the percentage difference in average female pension income including old age benefits, survivor’s benefits, and individual private pensions as developed by Eurostat
-
the percentage difference in average gross pension income for women receiving the state pension compared to the average gross pension income for men receiving state pension as used by Prospect
-
the Institute for Fiscal Studies uses 2 measures:
- the first is the gap in average private and state pension incomes between men and women who are already over state pension age
- the second is the gap in average pension saving between working-age men and women
The definition in this publication uses:
-
private pension wealth to reflect the outcome of private pension accumulation, irrespective of the different ways and timings to draw down pensions under pension freedoms
-
the age band around NMPA to capture pension wealth before it has been accessed, allowing a large enough sample size in the data source
This definition has been agreed by a cross-government steering group of analysts and policymakers.
2.1 Data Sources
The analysis is based on responses to the Wealth and Assets Survey (WAS). As a nationally representative survey this data source allows us to infer an estimation of pension wealth across Great Britain. This analysis uses the latest round of the Wealth and Assets Survey with data collected between 2018 to 2020. We aim to report annually on these figures and include them in the Workplace Pensions Participation and Savings publication. Since the latest round of data has been collected the country has experienced the global Covid-19 pandemic, and inflation has risen higher than at any previous point in the time series. The historical data uses previous rounds and waves of WAS going back to 2006. The contextual analysis is based on the Annual Survey of Hours and Earnings (ASHE) which was published in 2022, and refers to data collected in 2021.
2.2 What we report on
Throughout the release we refer to a headline metric, considering the entire population with private pension wealth around the normal minimum pension age. We also report on a subgroup focussing only on those with private pension wealth who are eligible for AE at the time of data collection. AE eligibility is currently defined as being aged between 22 and State Pension age, being employed, and earning over £10,000 per year. Employees aged 18 to 74 who earn at least £6,240 a year are entitled to join their workplace pension scheme and benefit from employer contributions under AE. Details on eligibility criteria for AE can be found in the Background Information and Methodology Note.
2.3 What we do not report on
This publication considers private pension wealth and does not consider pension incomes from private pension wealth in retirement. Pension incomes, including pension incomes from private pension wealth are already published in DWP’s Pensioner Income Series Official Statistics. Instead, this publication aims to build on DWP’s Workplace Pensions Participation and Savings Trends Official Statistics to provide more information on how workplace and private pension saving helps individual men and women to build pension wealth.
We do not include individuals who have fully crystallised all their private pension wealth into an income. This could affect the GPeG compared to the definition used here.
The analysis excludes participants below the age of 16 and those aged between 16 and 18 in full-time education as they are in no position to accrue private pension wealth. Full-time education and economic inactivity are examples of why an individual might not have any private pension wealth. Therefore, the metric excludes those who have no active or preserved private pension wealth, while focussing on those that have been encouraged under AE to increase private pension saving.
There are more women around NMPA who have no uncrystallised private pension wealth. If the metric included those without any private pension wealth, the GPeG would be larger than the definition used here.
Where private pension wealth has been partially accessed, the retained rights are still included in this analysis. The private pension wealth of those individuals will be a lower value than before their access. This might also affect the GPeG.
2.4 Valuing pension wealth
Estimating individual pension wealth, and the Gender Pension Gap, relies on calculating the value of defined benefit pensions. This introduces additional complexity into the value of an individual’s pension wealth, as defined benefit pensions do not exist as a pot of money (unlike Defined Contribution pensions) and the value must instead be estimated. We discuss this further in Section 5.
2.5 Statistical notes
Numbers have been suppressed where the sample size is small. We welcome feedback on the material provided to improve future releases. We are consulting on including this information in the future releases of the annual publication on Workplace Pension Participation and Savings Trends.
All the information presented in the charts and figures are included in the accompanying tables. For data presented in section 4 please see the accompanying tables of the Workplace pension participation and savings trends publication and Ten years of Automatic Enrolment in Workplace Pensions: statistics and analysis publication.
See the Background Information and Methodology Note for more detailed information.
3. The Gender Pensions Gap
According to the most recent data (2018 to 2020) the Gender Pensions Gap in private pensions stands at 35%. When considering only those who are eligible for Automatic Enrolment, the gap is smaller and stands at 32%. The Gender Pensions Gap varies for different age bands and is lowest for people in their thirties.
3.1 All savers
The Gender Pensions Gap is defined as the percentage difference between female and male non-zero uncrystallised median pension wealth around normal minimum pension age. The most recent data (2018 to 2020) shows:
A 35% gap between uncrystallised non-zero median private pension wealth between men and women around NMPA.
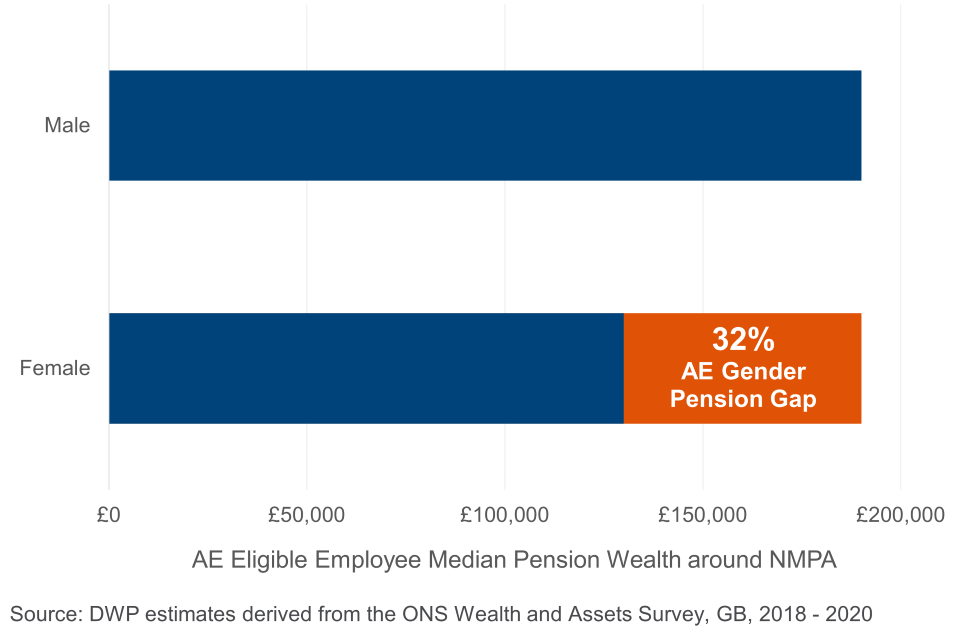
The Gender Pensions Gap is smaller among a subgroup of employees who are eligible to be automatically enrolled into their workplace pension scheme. The Gender Pensions Gap stands at 32% among this subgroup.
Figure 1: There is a 35% gap between male and female uncrystallised non-zero median pension wealth around normal minimum pension age (NMPA) in 2018 to 2020
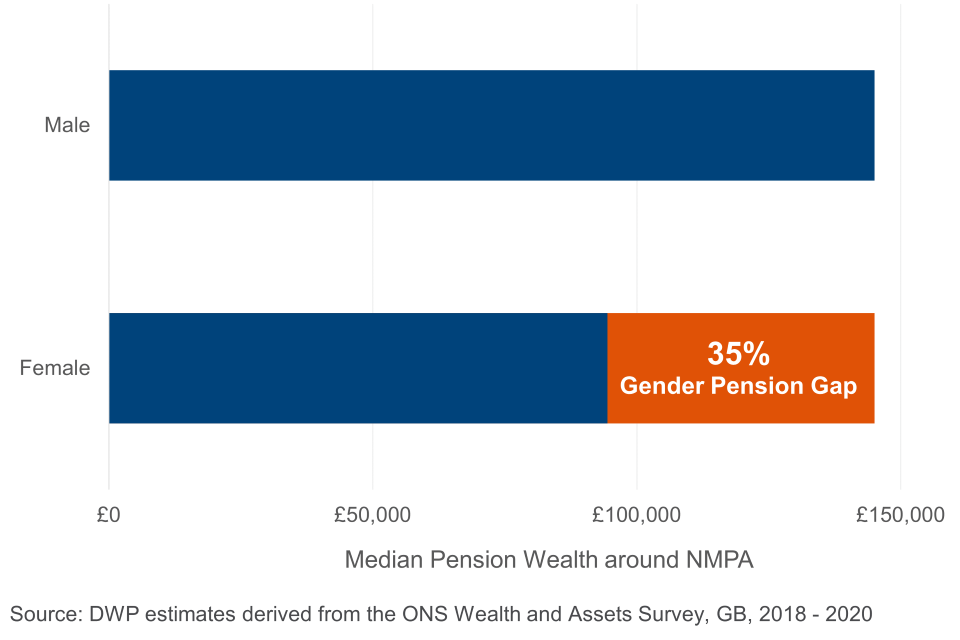
Figure 2: There is a 32% gap between male and female uncrystallised non-zero median pension wealth around normal minimum pension age (NMPA) for those eligible for AE in 2018 to 2020
The size of the GPeG varies according to age bands. The GPeG is smallest for those aged 35-39 (10%) and then increases to 47% for those aged 45-49. The GPeG then decreases again in the later years of working life. This pattern is similar to the trajectory of the Gender Pay Gap which shows a relatively small gap until the age of 40 when it approximately triples due to different labour market trajectories of men and women.
For those eligible for AE, the gap is smaller compared to the population-wide metric throughout all age bands. For the age bands 30-34 and 35-39, when the GPeG of all savers is smallest, the pension wealth of female savers eligible to be automatically enrolled is higher than male savers, reversing the gap. This means that women in those age bands have accrued more private pension wealth than men and is in line with high participation rates of female employees when eligible for AE (see Section 4.1). Similar to the trend observed for all savers, from the age of 40, women return to a lower median pension wealth compared to men, with women aged 40-44 having saved 33% less pension wealth than men.
When considering the age bands, it is important to note the impact AE has had on private pension saving. For example, a respondent in the age band 30-34 in 2020 might have benefitted from being automatically enrolled since 2012, and therefore for most of their working life. A respondent in their fifties in 2020 might have worked until their forties without the opportunity to be automatically enrolled. Therefore, they might have begun their private pension saving later in life, increasing the GPeG compared to younger age groups. AE continues to see more individuals save into a workplace pension, with more saved in real terms each year.
3.2 The Gender Pensions Gap by pension scheme type
The Gender Pension Gap is smallest when considering private pension wealth held by individuals with both Defined Benefit (DB) and Defined Contribution (DC) pension wealth, compared to individuals with only DC wealth or only DB wealth.
Some individuals may have pension wealth only in defined benefit (DB) schemes, others only in defined contribution (DC) schemes, and some in both DB and DC schemes.
In a DC scheme, pension wealth is accumulated through contributions to a pot of money that can be accessed when retiring. DC schemes can be set up by employers or individuals. The value of this pot can vary depending on how the money within the pot is invested by the pension provider.
In a DB scheme, pension wealth depends on the salary when retiring or career average and the duration of scheme membership. DB schemes guarantee an income for life that some schemes adjust to account for inflation. As with DC workplace pensions, both employers and employees can pay into this pension scheme. DB schemes are more common for large employers and in the public sector. The valuation of pension wealth in DB schemes is discussed further in Section 5.
The Gender Pensions Gap is smaller for those who hold some DB pension wealth, and largest for those holding only DC pension wealth.
Figure 3: The gap between male and female uncrystallised non-zero median pension wealth around normal minimum pension age (NMPA) is highest for those with DC only savings and lowest for those with DB and DC savings, in 2018 to 2020
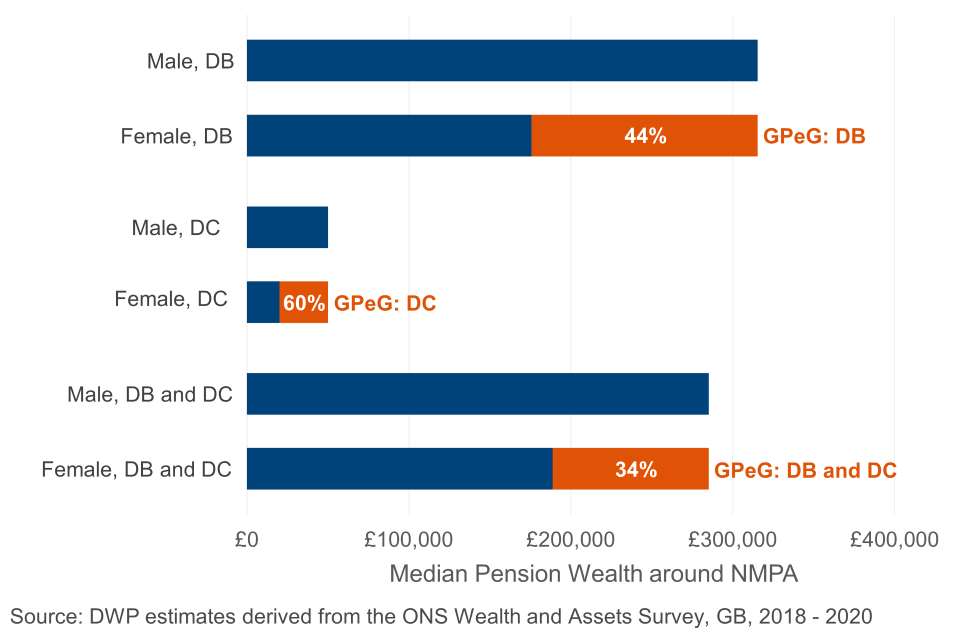
Non-zero median uncrystallised private pension wealth around NMPA is lowest for those who only have DC pension wealth. This is the group with the highest GPeG of 60% and is largest in size with 792,000 men and 575,000 women. The second most common type of pension wealth is DB only with 423,000 men and 589,000 women. This group has a GPeG of 44%. The smallest GPeG of 34% is within the group of those that have DB and DC pension wealth. This is also the smallest group in size with 414,000 men and 321,000 women.
3.3 The Gender Pensions Gap over time
The size of the Gender Pensions Gap has fluctuated and has decreased in 2018-2020 compared to 2016-2018.
Since the inception of this data collection in 2006, many changes to the private pension landscape have taken place, all potentially impacting the Gender Pensions Gap. One notable change is the phased introduction of AE and subsequent contribution level increases (2012 to 2019). Other changes include the decrease in Defined Benefit Pension Schemes and simultaneous increase in Defined Contribution Pension Schemes in the private sector.
It is important to note so called legacy effects when assessing the trajectory of metrics. Those effects describe the impact of past circumstances on current measurements. For example, individuals aged 55 in this analysis will have begun their career and pension saving under different legislation, labour market, and economic circumstances than individuals aged 35 in this analysis.
Figure 4: The Gender Pensions Gap fell from a maximum of 42% in 2006-2008 and most recently stood at 35% in 2018 to 2020
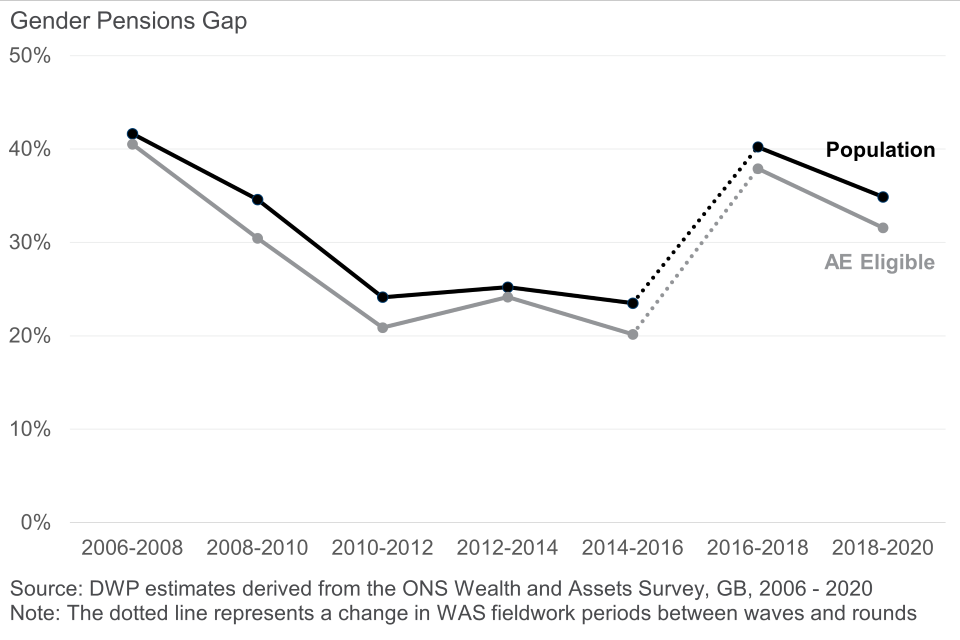
Female private pension wealth around NMPA is lower compared to male private pension wealth during the entire observation period. The gap was at a maximum of 42% in 2006-2008 and is currently at 35% at population level and 32% for those eligible to be automatically enrolled.
Throughout, when considering the AE eligible population only, the Gender Pensions Gap is smaller, compared to the population level estimation.
From 2006-2008 to 2010-2012, female uncrystallised private pension wealth at NMPA increased at a higher rate compared to equivalent male pension wealth. Therefore, the GPeG decreased across this period.
AE increased the number of lower paid workers paying into workplace pension schemes as it was phased in for different sizes of employers between 2012 and 2017. In 2021, 4.8 million more men and 4.4 million more women paid into a workplace pension compared to 2012. Of those, 1.0 million men earned between £10,000 and £20,000 per year in real terms compared to 1.8 million women. This demonstrates that AE has brought more low-earning women into pension saving than low-earning men.
Increasing the number of low-earning people who save into a pension increases the number of people with a small amount of pension wealth. When there are more people with a small amount of pension wealth, the position of the median saver can be somebody with lower wealth. The higher number of low-earning female employees brought into pension saving by AE could lead to the female median moving to a lower position relative to the male median. This means the GPeG can increase even while female savers are increasing their private pension wealth.
Data shows an increase from 1.18 million to 1.36 million female pension savers with uncrystallised private pension wealth around NMPA between 2014/16 and 2016/18. This increase of 180,000 women compares to an increase of 65,000 equivalent men in the equivalent time frame. When looking at real terms value of pension wealth this shows in the median male pension wealth remaining largely unchanged while median female pension wealth has moved to a female saver with lower pension wealth.
Figure 5: Both male and female real terms (2019 earnings) uncrystallised non-zero median pension wealth around NMPA has increased since 2006 to 2008
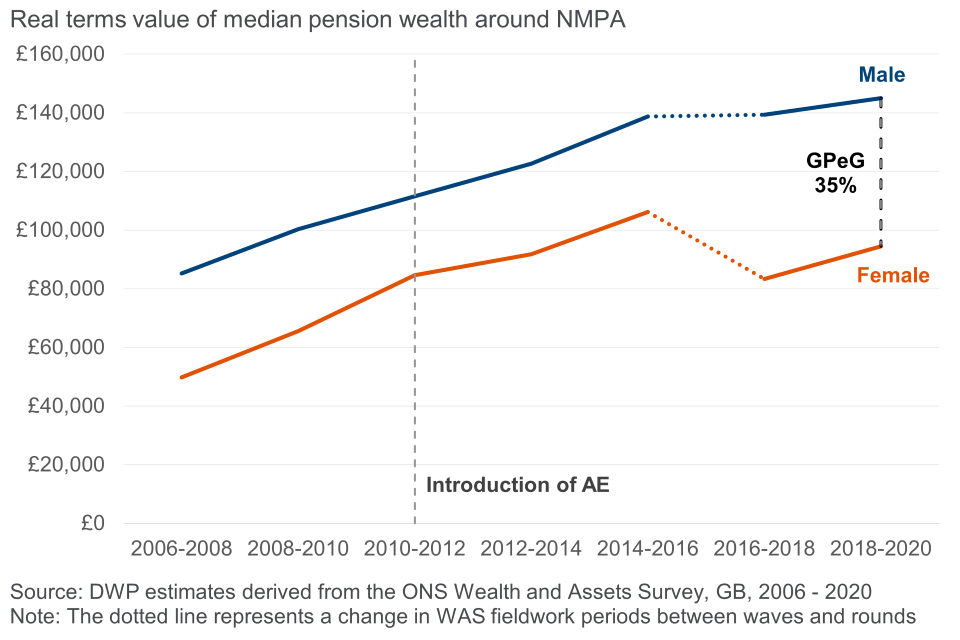
While the Gender Pensions Gap has fluctuated, median female pension wealth around NMPA has increased in real terms since 2006 to 2008.
In 2006 to 2008, the median female had £50,000 of real terms uncrystallised private pension wealth at age 50 to 54 (NMPA was 50 at the time, 2019 earnings). The equivalent median male had £85,000.
By 2018 to 2020 this had increased to £94,000 for the median female and £145,000 for the median male at age 55 to 59. This is a real terms increase of 90% for the median female compared to an increase of 70% for the median male.
4. Pension participation and saving
The Gender Pensions Gap is a complex phenomenon within the context of the pension system, labour market design and personal circumstances. The following section provides some of these additional statistics about differences between the genders in the private pension system.
4.1 Participation by gender and working pattern
Table 1: Participation rates (AE eligible) by gender and working pattern (2021)
| Full-time employees | Part-time employees | Overall | |
|---|---|---|---|
| Public Sector Male | 94% | 80% | 93% |
| Public Sector Female | 95% | 92% | 94% |
| Private Sector Male | 87% | 73% | 86% |
| Private Sector Female | 88% | 83% | 87% |
| Overall Male | 89% | 74% | 87% |
| Overall Female | 91% | 86% | 89% |
The participation rate is the proportion of workers that pay into a workplace pension. The participation rate for AE eligible employees is now higher for female employees than male. This is true for all AE eligible employees, for those who work in the public sector, for those who work in the private sector, and for those who work full time and part time in both the public and private sector. Across all AE eligible full-time employees in 2021, 91% of female employees and 89% of male employees participated in a workplace pension. Similarly, among AE eligible part-time employees 86% of females participate compared to 74% of males.
In the private sector participation rates for female and male AE eligible employees were 87% and 86% respectively in 2021. In 2021 the participation rate for female full-time employees (88%) was slightly higher than for male full-time employees (87%). Among part-time employees the participation rate has remained persistently higher for female than male employees (83% and 73% respectively in 2021), and the rates for both genders have increased greatly since the introduction of AE in 2012.
In the public sector overall participation rates for both female and male eligible employees have remained stable and were 94% and 93% respectively in 2021. Among full-time employees in the public sector, there was only a 1 percentage point difference between female and male employees (95% vs 94%), while among part-time employees, the participation rate has remained consistently higher for female than male employees (92% and 80% respectively in 2021).
There are more female employees in the public sector, where participation is higher than for equivalent working patterns in the private sector. This means that participation for all AE eligible female employees is higher than all AE eligible male employees despite the differences in working patterns.
Amongst AE eligible employees with similar working patterns, female employees are more likely to participate in workplace pensions than male employees. However, some part time workers earn less than the earnings trigger and may not be automatically enrolled into a workplace pension. These employees are therefore not included in the AE eligible population. Amongst all employees in the UK, 79% of female employees and 80% of male employees participated in a workplace pension in 2021, giving a participation gap of all employees of 2 percentage points. As a result of the different employment rates between men and women, the UK population wide participation gap in 2021 to 2022 is 3 percentage points as 55% of men and 52% of women participate in a workplace pension scheme.
4.2. Contributions by gender
Amongst AE eligible employees, the median female employee saves £270 a year more into their workplace pension than the median male employee. However, within the private sector the median female AE eligible employee saves £510 a year less than equivalent male employee. Similarly, for AE eligible employees in the public sector, the median female contributes £2,160 less than the median male. Since the introduction of AE, the real terms increase in total female pension saving is over £4 billion higher than the real terms increase in male pension saving.
Figure 6: The median female eligible employee saves less into a workplace pension than the equivalent male in both the private and public sector (2021)
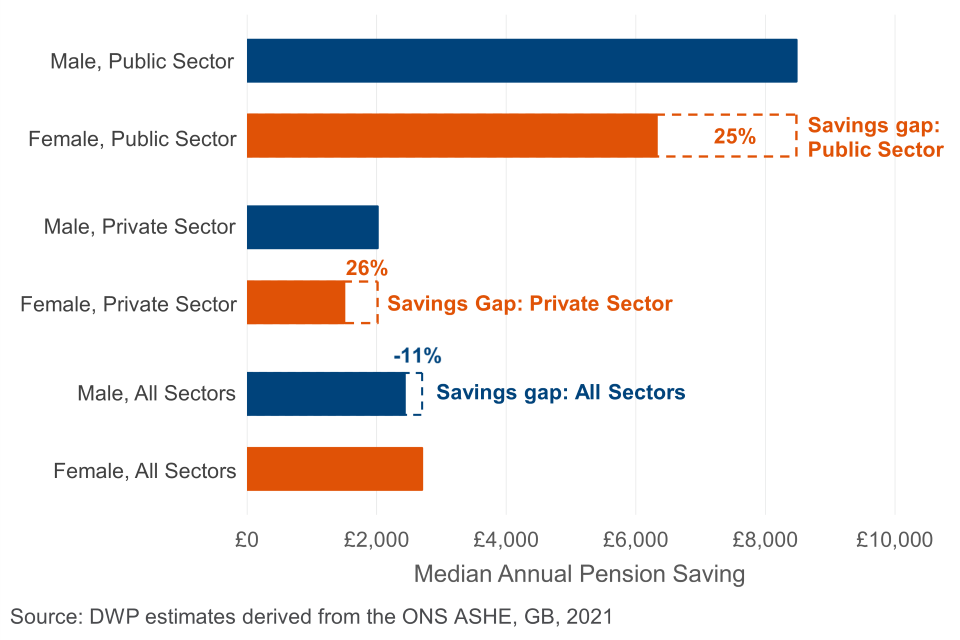
Amongst all AE eligible employees in 2021, the median male employee saved £2,430 into their workplace pension compared to £2,700 for female employees.
However, amongst the public sector, AE eligible male employees saved £8,480 compared to £6,320 for female employees. In the private sector the median contribution per employee is lower, but male AE eligible employees still contribute more than eligible female employees (£2,010 compared to £1,500).
It is the higher representation of female employees amongst the higher saving public sector employee roles that explains why the overall median AE eligible female employee has a higher pension saving than the median male. This is while the median female employee saves less in both the public and private sector. This is illustrated by Table 2 showing the mean average contribution per eligible employee alongside the median, demonstrating the mean male in all sectors saving more than the mean female.
Table 2: Total contributions (AE eligible) by gender and working pattern (2021)
| Eligible employees, thousands | Total saved pa, £ billions | Mean average saved pa, £ | Median average saved pa, £ | |
|---|---|---|---|---|
| Public Sector Male | 2,100 | 22.3 | 10,430 | 8,480 |
| Public Sector Female | 3,800 | 30.0 | 7,830 | 6,320 |
| Private Sector Male | 9,800 | 40.2 | 4,110 | 2,010 |
| Private Sector Female | 6,900 | 22.0 | 3,220 | 1,500 |
| Overall Male | 11,900 | 62.6 | 5,240 | 2,430 |
| Overall Female | 10,700 | 52.0 | 4,870 | 2,700 |
Pension saving has increased in real terms for both men and women since the introduction of AE. In 2012 AE eligible male employees saved £48.5 billion into workplace pensions, compared to £33.2 billion for female employees (both figures in 2021 earnings terms).
By 2021 this had increased to £62.6 billion and £52.0 billion respectively, a real terms increase of £14.1 billion for male employees and £18.8 billion for female employees. Therefore, since the introduction of AE, eligible female employees have increased their pension saving by more than male employees in both absolute and relative terms.
Despite this, the total contribution gap for all female employees compared to all male employees is 17%. Note that figures for annual amounts saved are derived by converting actual amounts saved during a single pay period in April of the corresponding year to an annual equivalent.
5. Valuing Defined Benefit (DB) pension wealth
Defined Benefit (DB) pension wealth represents a large proportion of all the pension wealth for individuals in Great Britain. The valuation of DB pension wealth is therefore important to the Gender Pension Gap. This calculation is complex and relies on several economic assumptions, meaning that future calculations of the Gender Pensions Gap may vary based on the latest economic assumptions applied.
Unlike Defined Contribution (DC) schemes which is a pot of money that members can directly report, DB schemes instead provide an income in retirement. This makes the valuation and reporting of DB pension wealth more complex than reporting DC pension wealth.
To determine the pension income from DB schemes a formula is used. This formula often includes considerations such as salary, length of service, and age at retirement, among various other factors. As a result, the value of the pension received in retirement depends on a variety of factors and economic assumptions such as pre-retirement wage of the scheme members, as well as the discount rates used in valuing the retirement income.
Furthermore, to make DB pension wealth comparable to DC pension wealth, it is necessary to include only the wealth associated with DB pension rights accrued at a members current age. Finally, it is necessary to value this wealth in real terms, so that a future DB pension income is reported in today’s prices rather than higher future prices.
To help understand the impact of different assumptions and calculation methods, we have considered alternative ways of calculating DB pension wealth, including different approaches to applying discount rates. These different approaches produce small changes in the value of the Gender Pensions Gap. However, they do not change the overall result that the uncrystallised pension wealth accrued by the median female saver around NMPA is lower than the median male saver. The impact of different valuation approaches is smaller around NMPA than at younger ages. This is because many male and female savers at this age have some DB pension wealth and have fewer years until their age at retirement where discount rates can change the value of their DB pension wealth.
The approach in this release is in line with ONS methodology. We will continue to monitor the best available advice regarding the valuation of DB pension wealth and will report future measures of the Gender Pensions Gap appropriately.
6. About these statistics
The main data source for this publication is the Wealth and Assets Survey (WAS), analysis of participation and contribution to workplace pensions has been conducted using the Annual Survey of Hours and Earnings (ASHE).
Full details of the data sources, their key assumptions, limitations, and definitions are available in the Background Information and Methodology Note.
7. Statement of application with the Code of Practice for Statistics
The Code of Practice for Statistics is built around 3 main concepts, or pillars:
-
trustworthiness – is about having confidence in the people and organisations that publish statistics
-
quality – is about using data and methods that produce statistics
-
value – is about publishing statistics that support society’s needs
The following explains how we have applied the pillars of the code in a proportionate way.
1. Trustworthiness
These figures have been published to provide an estimate of the difference between median non-zero uncrystallised private pension wealth for men and women around NMPA. They are being released now to ensure equal access to the analysis.
2. Quality
This publication uses data from the Wealth and Assets Survey, a biennial longitudinal survey conducted by the Office for National Statistics (ONS). Multiple rounds of quality assurance are applied to ensure the data is as accurate and reliable as possible. The methodology and calculations in this analysis have been quality assured by DWP analysts to ensure they are robust.
3. Value
Releasing these estimates provides the public and organisations with up-to-date estimates on the size of the gap between female and male private pension wealth, as well as important contextual analysis. The estimates are also in response to the Work and Pension Select Committee report “Protecting pension savers – five years on from the pension freedoms: Saving for later life” published in September 2022. Making this information accessible helps reduce the administrative burden of answering Parliamentary Questions, Freedom of Information requests and ad hoc queries about the Gender Pensions Gap.
8. Contact Details
Author: Laura Mitzel, Pensions & Later Life Analysis, DWP
Statistical oversight: Rebecca Haynes, Pensions & Later Life Analysis, DWP
Contact us for statistical enquiries and publication feedback only, email: workplacepensions.statistics@dwp.gov.uk
Press enquiries should be directed to the DWP Press Office, telephone: 0203 267 5144
Published: 5 June 2023