Ten years of Automatic Enrolment in Workplace Pensions: statistics and analysis
Published 26 October 2022
Applies to England, Scotland and Wales

© Crown copyright 2022
This publication is licensed under the terms of the Open Government Licence v3.0 except where otherwise stated. To view this licence, visit nationalarchives.gov.uk/doc/open-government-licence/version/3 or write to the Information Policy Team, The National Archives, Kew, London TW9 4DU, or email: psi@nationalarchives.gov.uk.
Where we have identified any third party copyright information you will need to obtain permission from the copyright holders concerned.
This publication is available at https://www.gov.uk/government/statistics/ten-years-of-automatic-enrolment-in-workplace-pensions/ten-years-of-automatic-enrolment-in-workplace-pensions-statistics-and-analysis
This data and analysis examines the role Automatic Enrolment (AE) has played in supporting DWP’s priority of improving people’s quality of life, by addressing poverty through increasing financial resilience. The information reports on participation and contributions in workplace pensions in Great Britain.
This publication builds on existing publications and contains additional information in line with 10 years since the introduction of AE in 2012. Readers may also be interested in DWP’s Workplace pension participation and savings trends: 2009 to 2021.
Given participation and contributions into workplace pensions in the public sector were already strong prior to the introduction of AE, these statistics focus particularly on the change in private sector workplace pensions.
The report includes:
-
the participation rates of workers in workplace pensions up to April 2021
-
the amount saved by workers in workplace pensions up to April 2021
-
index of active members of selected private pension providers up to August 2022
-
index of pension contributions made to selected private pension providers up to August 2022
-
opt-outs from newly enrolled employees up to August 2022
-
active cessations from contributing employees up to August 2022
Data is reported over different timescales depending on the availability of the data.
1. Main stories
Pension saving in Great Britain has been transformed by the introduction of Automatic Enrolment. Automatic Enrolment (AE) began with a phased introduction starting in October 2012. Since then, data shows:
-
participation has increased among private sector eligible employees in every industry and occupation between 2012 and 2021, including those with historically low rates of employees saving into a workplace pension
-
this has been replicated in every region of GB, and in the most common private sector eligible employee jobs within each region
-
the total annual workplace pension contribution of all private sector eligible employees has increased in real terms from £41.5 billion in 2012 to £62.3 billion in 2021
-
the increases in total annual workplace pension contributions have been replicated across all industries and all occupations, except for the Energy and Water sector
-
between January 2020 and August 2022, the number of active members of 11 large private pension providers have increased. The total contributions (amount saved) to these 11 providers have also increased over this time, and were 32% higher in August 2022 than in January 2020
-
in August 2022 the proportion of newly enrolled employees with the 12 private pension providers workplace pension providers who opted-out of their workplace pension was 10.4%, compared to 7.6% in January 2020
-
the proportion of actively saving employees with these providers who stopped saving in August 2022 was 3.1%, the same proportion as in January 2020
2. What you need to know
The sources of data in this report are:
-
the Annual Survey of Hours and Earnings (ASHE)
-
provider data from selected private pension providers
Automatic Enrolment was introduced following the Pensions Act 2008. The implementation of the legislative requirement to automatically enrol eligible employees into a workplace pension began in October 2012. Eligible employees are defined as UK employees who are aged between 22 and the State Pension age (SPa) and who earn above the AE Earnings Trigger (ET). The Earnings Trigger is reviewed annually by the Secretary of State for Work and Pensions.
AE was introduced in phases. In 2012 large employers who employed more than 250 employees were required to automatically enrol all eligible employees. In 2014 medium employers who employed more than 50 employees were required to comply, followed by all employers in 2016. By 2017, all new eligible employees of all employers were required to be automatically enrolled into a workplace pension.
Pensions contributions under Automatic Enrolment must be a minimum percentage of qualifying earnings. Qualifying earnings are determined by the Lower Earnings Limit (LEL) and Upper Earnings Limit (UEL) and are reviewed annually by the Secretary of State for Work and Pensions.
Until 2018 the minimum contribution required under Automatic Enrolment was 2% of qualifying earnings, with a minimum of 1% contributed from the employer. In April 2018, this minimum increased to 5% of qualifying earnings, with a minimum of 2% from the employer. In April 2019 the phased introduction of AE was completed when the minimum contribution increased to 8% of qualifying earnings with a minimum of 3% from the employer.
Rounding policy
The following rounding policy has been applied to this statistical release. Please note that percentages shown within the release are calculated using figures prior to rounding:
-
percentages have been rounded to the nearest percentage point (ppt) unless indicated otherwise
-
amounts saved are rounded to the nearest £1 million
-
indexes are rounded to 1 decimal point
3. Participation in workplace pensions
Private sector participation in workplace pensions has increased for eligible employees in every cross section of industry and occupation since the introduction of AE.
Figure 1: Participation rates of eligible employees in 2012 and 2021 for the 10 largest industry and occupation cross-sections within the private sector
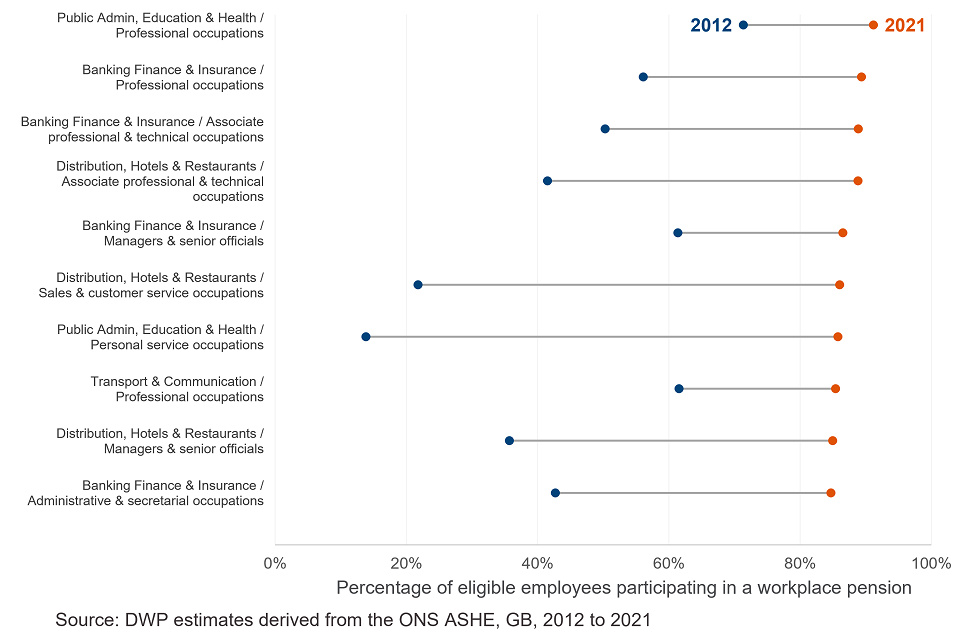
Participation rates increased for eligible employees in all industry and occupation cross-sections within the private sector.
For the industry occupation cross-section with the largest number of eligible employee jobs, namely Professional Occupations within the Banking, Finance and Insurance industry, workplace pension participation rates have risen from 56% in 2012 to 89% in 2021.
From the 10 industry and occupation cross-sections with the highest number of employee jobs, the largest increase in participation rates was seen for Personal Service Occupations within the Public Admin, Education and Health industry, where participation rose by 72 ppts from 14% to 86%. The smallest increase was seen in Professional occupations within the same industry, where participation rose by 20 ppts from 71% to 91%.
Private sector participation in workplace pensions has increased for employees in every region of GB since the introduction of AE.
Figure 2: Participation rates of eligible employees in 2012 and 2021 within the private sector for each GB region
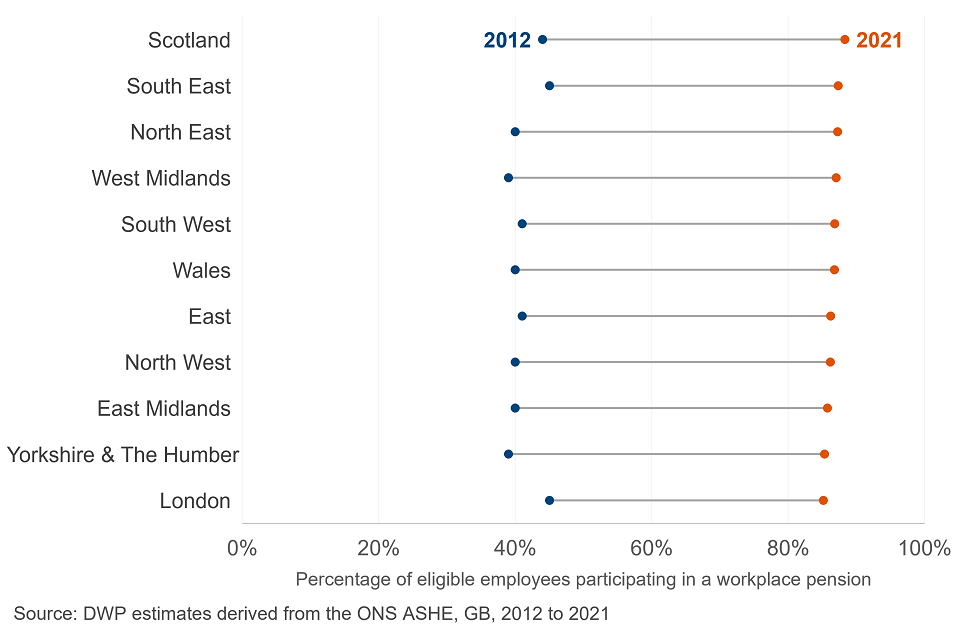
Workplace pension participation rates have increased for eligible employees in all regions of GB between 2012 and 2021.
The largest increase in participation rates was seen in the West Midlands, where participation rose by 48 ppts from 39% to 87%. London saw the smallest increase, with participation rising by 40 ppts from 45% to 85%. Although London had the highest participation rate in 2012, it is now the region with the lowest participation rate across GB. In 2021, Scotland was the region with the highest participation rate.
4. The amount saved into workplace pensions
In 2021 to 2022 prices, total annual contributions into workplace pensions have increased from £81.7 billion in 2012 to £114.6 billion in 2021.
Since 2012, there have been real terms increases in total annual contributions for eligible savers in both the public and private sectors, for both male and female employees.
Figure 3: Real terms total annual saving for eligible pension savers in 2012 and 2021, by sector and gender
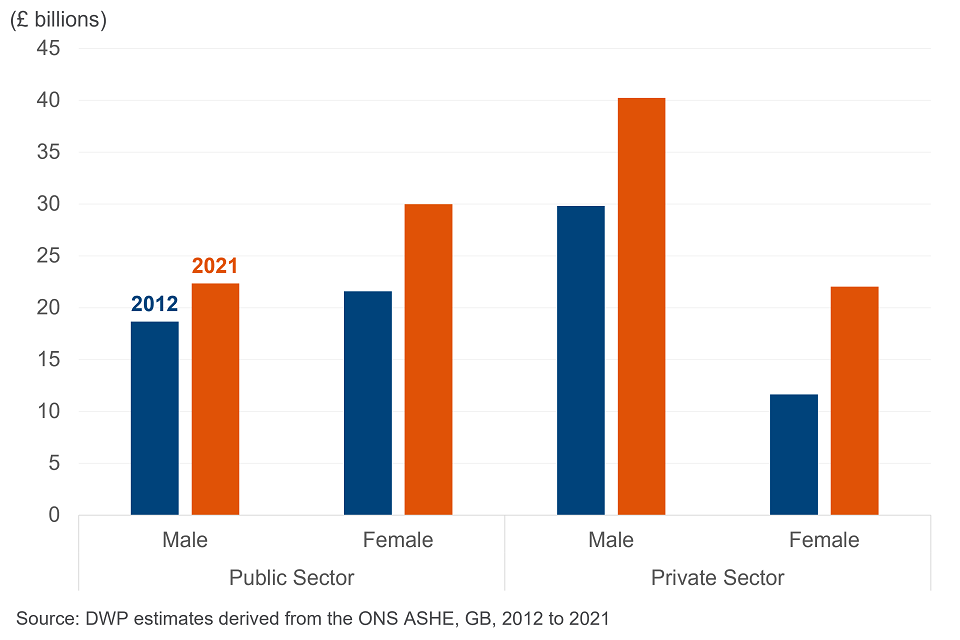
Real terms total contributions for eligible employees have increased between 2012 and 2021 across the private sector, for male as well as female employees.
Within the public sector, the total amount saved for females was greater than the total amount saved for males in both 2012 and 2021. It should be noted that there are more eligible female employees in the public sector than eligible male employees, and therefore average savings per eligible female employee may be lower than per eligible male employee. Annual savings for males within the public sector increased from £18.7bn in 2012 to £22.3bn in 2021. Annual savings for females within the public sector increased from £21.6bn in 2012 to £30.0bn in 2021.
Within the private sector, real terms total annual savings for males were greater than total annual savings for females, in both 2012 and 2021. Annual savings for males within the private sector increased from £29.8bn in 2012 to £40.2bn in 2021. Annual savings for females within the private sector increased from £11.6bn in 2012 to £22.0bn in 2021.
In real terms, total annual savings for eligible employees within the private sector increased across most industries.
Figure 4: Total annual pension savings for eligible employees within the private sector in 2012 and 2021, by industry
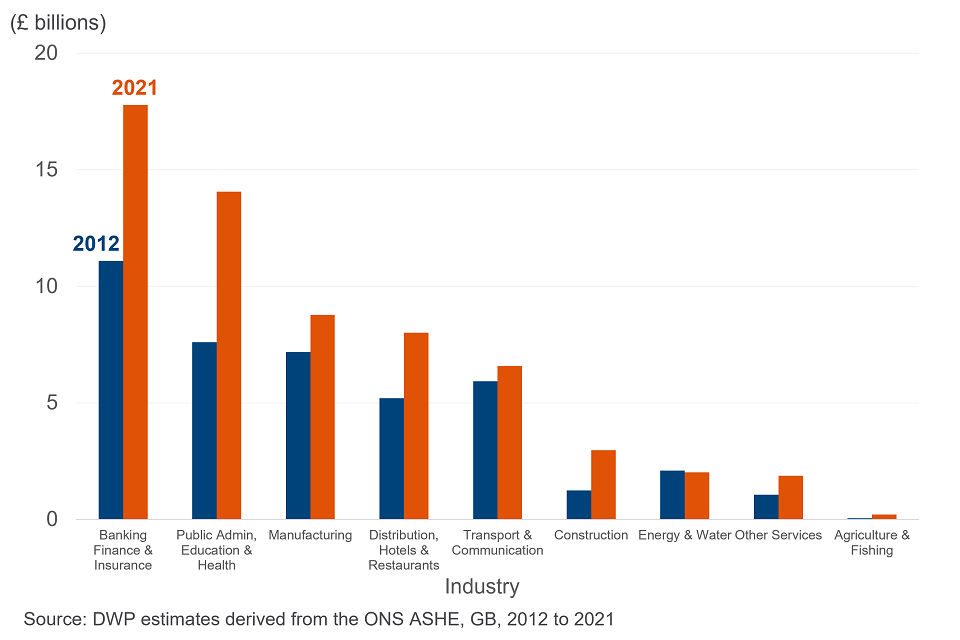
Overall, in real terms, total annual savings within the private sector increased by £20.8bn from £41.5bn to £62.3bn.
In the private sector, the largest increases in real terms were seen within the Banking, Finance and Insurance industry where savings increased by £6.7bn from £11.1bn in 2012 to £17.8bn in 2021. The largest increase in percentage terms was found in the Agriculture and Fishing industry, where savings increased by 273%, from £0.06bn in 2012 to £0.21bn in 2021.
Energy and Water was the only private sector industry where real terms total annual savings decreased. In this industry, real terms total annual savings decreased by £0.1bn from £2.1bn in 2012 to £2.0bn in 2021. There is no isolated reason for this. Changes in the amount saved are influenced by a wide range of factors including average pay, overall employment, employee composition and workplace pension scheme type.
Real terms total annual savings for eligible employees within the private sector increased across all occupations.
Figure 5: Real terms total annual saving for eligible pension savers within the private sector in 2012 and 2021, by occupation
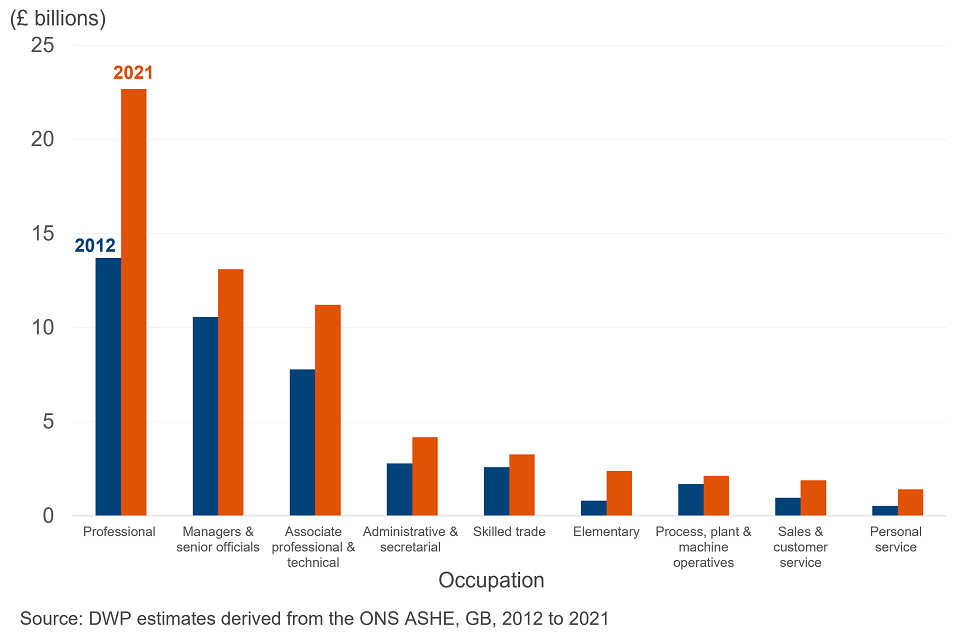
The largest increases in real terms were seen within the Professional occupations, where savings increased by £9.0bn from £13.7bn in 2012 to £22.7bn in 2021. The largest increase in percentage terms was found in elementary occupations, where savings increased by 196%, from £0.8bn in 2012 to £2.4bn in 2021.
5. The percentage of qualifying earnings contributed into workplace pensions
In 2021, 55% of eligible employees received employer contributions that were higher than the Automatic Enrolment minimum.
This section provides DWP estimates from ASHE 2021 data on the percentage of employees’ qualifying earnings that were saved into a workplace pension, known as the contribution rates. Qualifying earnings are defined as earnings between the lower earnings limit (LEL) and upper earnings limit (UEL), referred to as the qualifying earnings band (QEB). For more information, see the Automatic enrolment: review of the earnings trigger and qualifying earnings band for 2022 to 2023.
In 2021 the minimum contribution rate within the Automatic Enrolment framework was 8%, of which a minimum of 3% must be contributed by the employer. This data examines contribution rates for AE eligible employees and splits it by those contributing below the 2021 minimum, at the 2021 minimum and above the 2021 minimum.
Between 2012 and 2021 eligible employees in the private sector making real terms total contributions above the 2021 AE minimum increased by 22 ppts, and eligible employees making real terms contributions at the 2021 AE minimum increased by 23 ppts
Table 1: Change in the percentage of private sector employees with real terms employer and total contributions classified by the 2021 AE minimum, 2012 and 2021
| Total contribution rate: Not contributing | Total contribution rate: Below AE minimum | Total contribution rate: At AE minimum | Total contribution rate: Above AE minimum | Total contribution rate: Total | |
|---|---|---|---|---|---|
| Employer contribution rate: Not contributing | -44 ppts | 0 ppts | 0 ppts | 0 ppts | -44 ppts |
| Employer contribution rate: Below AE minimum | 0 ppts | 0 ppts | 0 ppts | 0 ppts | 0 ppts |
| Employer contribution rate: At AE minimum | 0 ppts | 0 ppts | +21 ppts | +1 ppts | +22 ppts |
| Employer contribution rate: Above AE minimum | 0 ppts | -1 ppts | +2 ppts | +21 ppts | +22 ppts |
| Employer contribution rate: Total | -44 ppts | -1 ppts | +23 ppts | +22 ppts | 0 ppts |
In 2021, the percentage of eligible employees in the private sector that had total pension contributions at the 2021 AE minimum was 23 ppts higher than in 2012.The percentage of eligible employees in the private sector that had total pension contributions above the 2021 AE minimum was 22 ppts higher.
In 2021, the percentage of eligible employees in the private sector that had employer pension contributions at the 2021 AE employer minimum was 22 ppts higher than in 2012. The percentage of eligible employees in the private sector that had employer pension contributions above the 2021 AE employer minimum was 22 ppts higher.
Together, in 2021, the percentage of eligible employees in the private sector that had total pension contributions above the 2021 AE minimum, including employer pension contributions above the 2021 AE employer minimum, was 21 ppts higher than in 2012.
Real terms contributions above the 2021 AE minimum by private sector eligible employees increased in across industries between 2012 and 2021.
Figure 6: Private sector eligible employees with real terms employer contribution rates above the 2021 AE minimum, by industry, 2012 to 2021
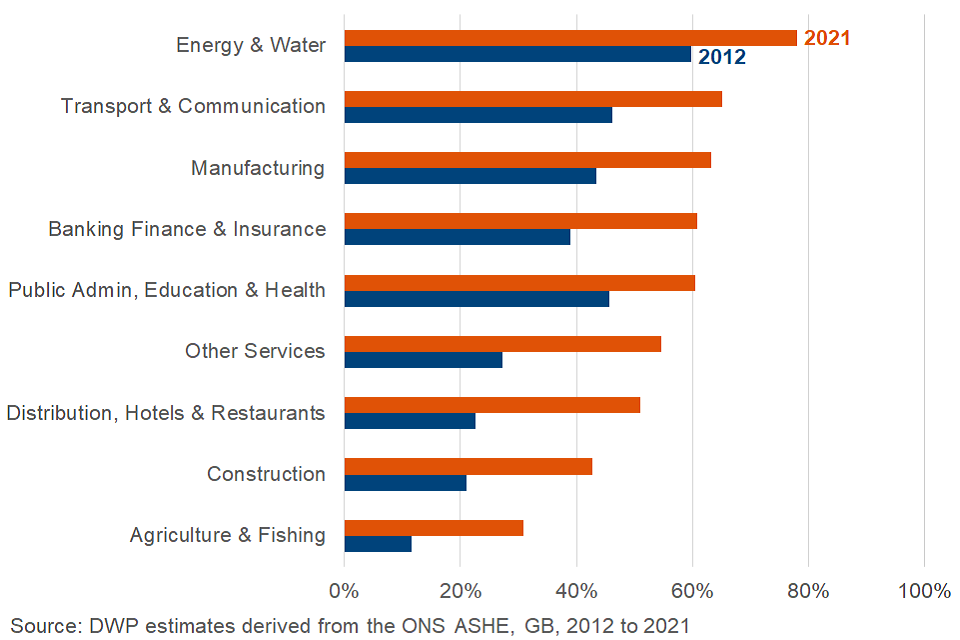
Figure 6 shows the breakdown of eligible employees with real terms employer contributions that are above the 2021 AE minimum in the private sector, split by industry. In 2012, only the Energy and Water industry had 50% or more employees with real terms employer contributions above the 2021 AE minimum. In 2021, all industries except Construction, and Agriculture and Fishing, had over 50% of eligible employees with employer contributions above the 2021 AE minimum.
Private sector eligible employees with employer contributions above the 2021 AE minimum have increased in across occupations in between 2012 and 2021.
Figure 7: Private sector eligible employee with real terms employer contribution rates above the 2021 AE minimum, by occupation, 2012 to 2021
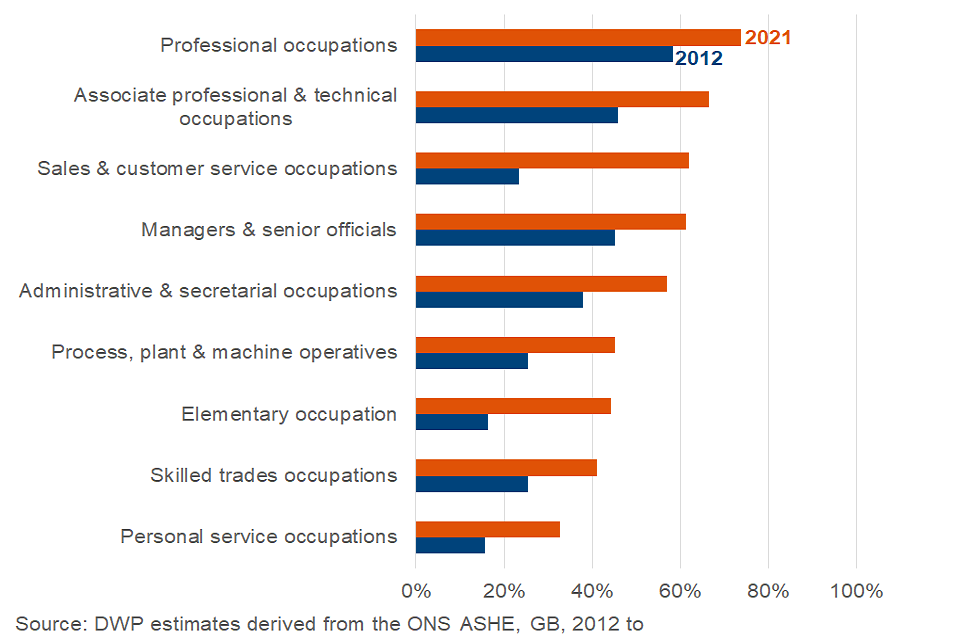
Figure 7 shows the breakdown of eligible employees with real terms employer contributions that are above the 2021 AE minimum in the private sector split by occupation. All occupations show large increases in the proportion of those with employer contributions above the minimum. Sales and customer service occupations, and elementary occupations, show the biggest percentage point increases from 2012 to 2021, with increases of 38 ppts and 28 ppts respectively.
6. Private pension provider data
The overall proportion of active members in the selected private pension providers who stop saving each month has remained stable between January 2020 and August 2022.
This section contains aggregated data from up to 12 private pension providers.
The index of active members has increased between January 2020 and August 2022.
Figure 8: Index of active members to August 2022
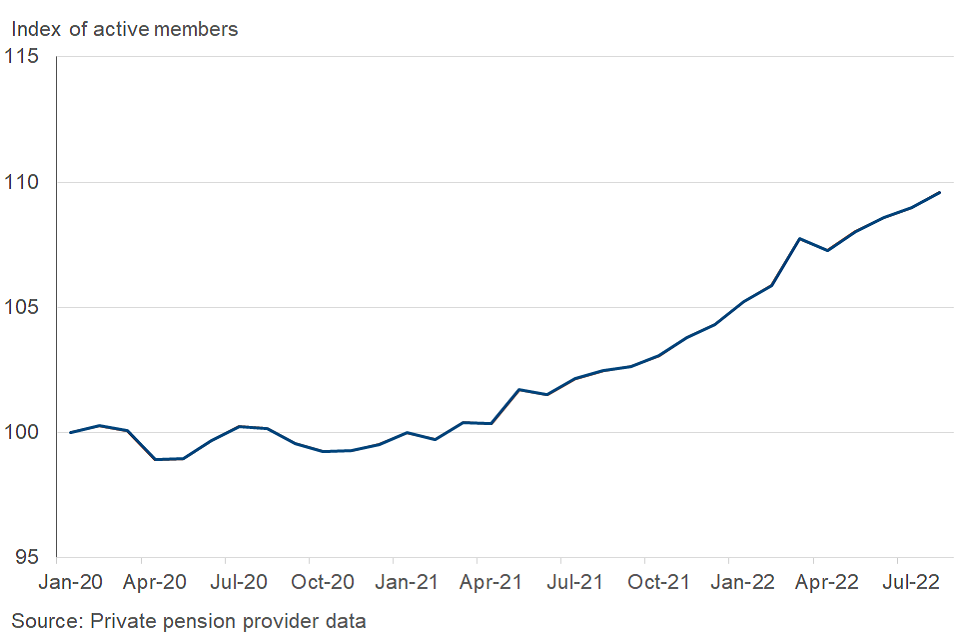
Figure 8 shows aggregated private pension provider data of indexed active members between January 2020 and August 2022. The data is indexed to January 2020. Between January 2020 and February 2021, the data fluctuated, but did not start to increase until April 2021. By August 2022, the data peaked, showing an increase in active members of 9.6%, compared with January 2020.
The index of total nominal contributions overall has increased between January 2020 and August 2022.
Figure 9: Index of total contributions to August 2022
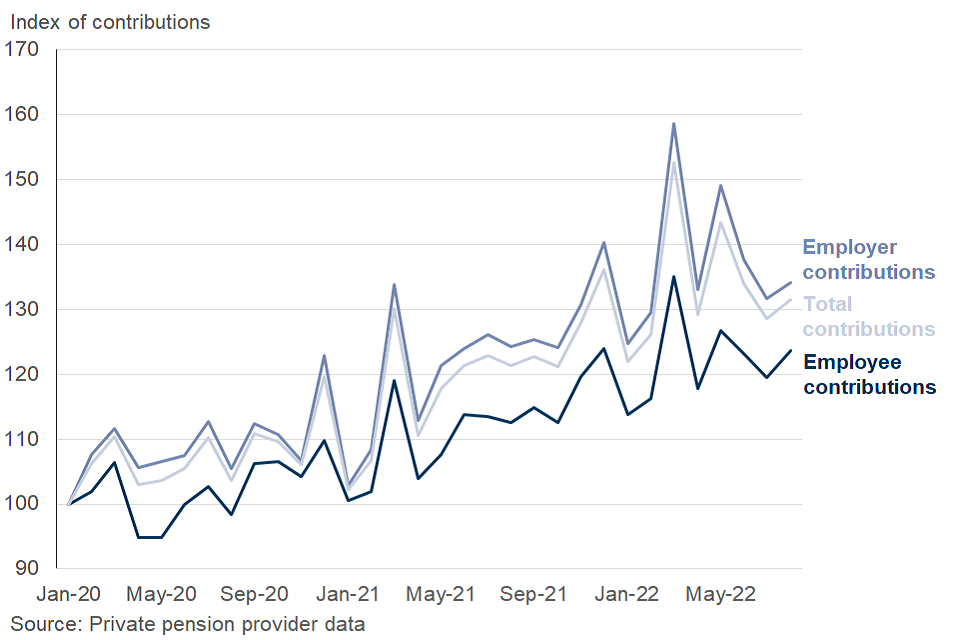
Figure 9 shows aggregated private pension provider data of indexed total, employer and employee nominal contributions between January 2020 and August 2022. The total, employer and employee data are each indexed to January 2020. The data fluctuates across the whole time period, and shows an overall increasing trend. Total, employer and employee nominal contributions all peak in March 2022, which may be a seasonal effect. By August 2022, total contributions increased by 31.5%, compared to January 2020. Employer and employee contributions increased by 34.1% and 23.6% respectively in August 2022, compared to January 2020.
Overall, stopping saving rates across members have remained stable between January 2020 and August 2022.
Figure 10: Proportion of opt outs, cessations and stopping saving to August 2022
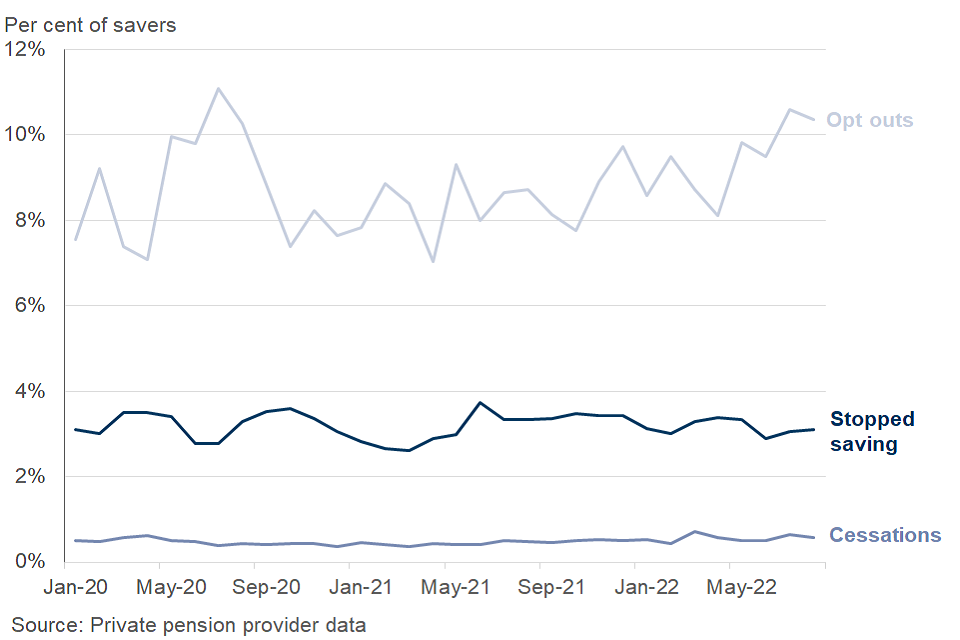
Figure 10 shows aggregated private pension provider data of opt out rates, cessation rates and stopping saving rates between January 2020 and August 2022.
An opt out rate is defined as the proportion of new member enrolments that decide to opt out of workplace pension saving. Opt outs have continuously fluctuated between January 2020 and August 2022, and show a long-term increasing trend since late 2020. There was a maximum in the opt out rate during mid-2020, coinciding with the COVID-19 lockdowns.
A cessation rate is defined as the proportion of active members that decide to cease workplace pension saving. The data shows minor fluctuations between January 2020 and August 2022, but overall has remained stable. Between January 2020 and August 2022, the cessation rate only increased by less than 0.1 percentage points, from 0.49% to 0.57%.
A stopping saving rate is defined as the proportion of active members that decide to opt out, cease saving, or leave employment. The data has consistently remained stable across the period. The stopping saving rate in both January 2020 and August 2022 was at 3.1%
7. About these statistics
Annual Survey of Hours and Earnings
The main data source for this publication is the Annual Survey of Hours and Earnings (ASHE) published by the Office for National Statistics (ONS). It is a key source of information on workplace pensions in GB as it collects information on all types of workplace pension schemes. The survey results are used widely to monitor the impacts of pension reforms.
ASHE is survey data, so is a representative sample of the population. Where there is only a small sample of data available, the tabulated figures are in brackets (fewer than 500 responses) or suppressed (fewer than 20 responses) to indicate increased uncertainty.
Real terms amounts are deflated to 2021 earnings terms using ONS Average Weekly Earnings (AWE) values. Gross annual earnings are derived using weekly pay, and no filter has been included for loss of pay in the pay period. The ONS Average Weekly Earnings Statistics, EARN015 (KAC3) series is used.
The analysis includes members of all workplace pension schemes: occupational pension schemes, group personal pensions (GPPs) and group stakeholder pensions (GSHPs).
Weekly pension contributions from ASHE have been converted into a percentage of Qualifying Earnings. Qualifying Earnings are defined as those earnings between the Lower Earnings Limit (LEL) and Upper Earnings Limit (UEL) , known as the Qualifying Earnings Band. For more information see the Automatic enrolment: review of the earnings trigger and qualifying earnings band for 2022/23.
Automatic enrolment specifies a minimum contribution required for employees, with a minimum contribution from their employer. The minimum contribution is 8% of earnings in the QEB, with at least 3% contributed from the employer.
For the contribution rate data in Section 3, the sum of the proportion of employees contributing in real terms below, at and above the 2021 AE minimum does not necessarily equal to the overall participation rate. Some participating employees may make zero contributions. This is partly because annualised weekly earnings and pension contributions. Where an individual’s gross weekly pay falls short of the lower earnings limit threshold, then they would still be classed as participating as they would remain enrolled in their workplace pension scheme, and would be classified as “not contributing”.
Private pension provider data management information
Master trusts and Group Personal Pension schemes are types of defined contribution (DC) pension scheme that several employers take part in. Master trusts are managed by a trustee that makes decisions on behalf of all the members of the scheme. A trustee is a person or organisation that holds and controls money or assets on behalf of, and for the benefit of, someone else. The master trusts included in this analysis are regulated by The Pensions Regulator (TPR)
DWP collects data from 12 private pension providers. These providers accounted for 15 million active member pensions in January 2020. DWP aggregates and anonymises the data to evaluate trends from the market. The most recent data includes data on contributions due in August 2022.
It should be noted that when comparing monthly data at different times, it would be common to compare the same month in different years to account for seasonality. However, because the data for August 2020 will be affected by the COVID-19 lockdowns, the latest data in August 2022 has been compared to the earliest data in January 2020.