Pensioners' Incomes Series: Financial year 2021 to 2022
Updated 30 August 2023

© Crown copyright 2023
This publication is licensed under the terms of the Open Government Licence v3.0 except where otherwise stated. To view this licence, visit nationalarchives.gov.uk/doc/open-government-licence/version/3 or write to the Information Policy Team, The National Archives, Kew, London TW9 4DU, or email: psi@nationalarchives.gov.uk.
Where we have identified any third party copyright information you will need to obtain permission from the copyright holders concerned.
This publication is available at https://www.gov.uk/government/statistics/pensioners-incomes-series-financial-year-2021-to-2022/pensioners-incomes-series-financial-year-2021-to-2022
Effects of the coronavirus (COVID-19) pandemic on these statistics
Fieldwork operations for the Family Resources Survey (FRS) continued to take account of the effect of government guidance relating to the coronavirus (COVID-19) pandemic and the restrictions placed on visiting others’ homes. The telephone interview approach that was adopted during financial year ending (FYE) 2021 continued throughout FYE 2022, with interviewers conducting the interview whilst working from their own homes. This affected both the size and quality of the achieved sample. More information on fieldwork can be found in the FRS background information and methodology.
While the data for FYE 2022 has undergone extensive quality assurance prior to publication, we recommend that users exercise additional caution when using the data for FYE 2022, particularly when making comparisons with previous years. This is especially recommended when interpreting larger changes observed between FYE 2021 and FYE 2022.
See the Households Below Average Income (HBAI) technical report which explains the effects of the coronavirus (COVID-19) pandemic in more detail. This should be considered alongside the interpretation of these statistics.
This report examines how much income pensioners get each week and where they get that income from. It looks at how their incomes have changed over time and variations in income between different types of pensioners.
The population age distribution has changed a lot since the start of this series in FYE 1995 and pensioners now make up a larger proportion of the overall population.
Changes in the economy and to the benefit system mean that the amount and components of pensioners’ average weekly incomes have changed over time. These statistics look at these changes.
1. Main stories
Except where otherwise stated, we use the unequivalised income of pensioners, estimated both before and after housing costs (BHC and AHC). Income AHC is derived by subtracting rent, water rates and charges, structural insurance premiums, mortgage interest payments and ground rent, and service charges from income BHC. This report uses variants of the Consumer Prices Index (CPI) to adjust for inflation, to look at how incomes change over time in real terms.
Pensioners’ incomes have increased since 1995
Average weekly income of pensioners (AHC) by family type in FYE 2022 prices (£)
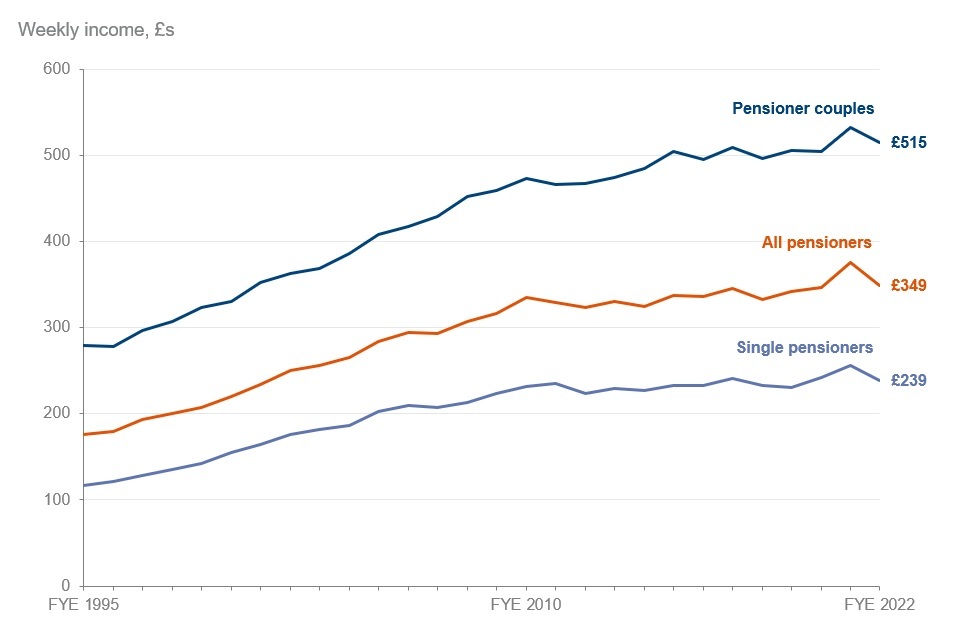
The average income increased between the start of the series in FYE 1995, when it was £176, to £335 in FYE 2010. This increase is statistically significant. In the 10 years from FYE 2010 to FYE 2020, pensioners had similar average incomes with £335 and £347 respectively. The average income increased to £376 in FYE 2021.
In FYE 2022, pensioners had an average income of £349, which was a statistically significant increase from FYE 1995. The decrease from FYE 2021 was statistically significant. This result needs to be seen in the context of the factors affecting the FYE 2021 dataset relating to the coronavirus (COVID-19) pandemic.
When preparing the FYE 2021 estimates, some evidence was found that the pensioners sampled were more affluent compared to previous time periods. They were more likely to be owner occupiers, receive an occupational or personal pension, have income from investments, and on average have access to higher levels of savings. The FYE 2022 population is more closely aligned with the pre-pandemic period on these metrics, compared to FYE 2021.
The FYE 2022 pensioner median incomes have shown larger decreases across most measures compared to FYE 2021. While some of this change is real, reflecting the context of below-inflation uprating of the State Pension in FYE 2022, the degree of change is also likely to have been somewhat affected by changes in pensioner sample composition between the two survey years. This broader context should be borne in mind when interpreting the observed changes in pensioner low-income rates.
Younger pensioners had higher average incomes than older pensioners
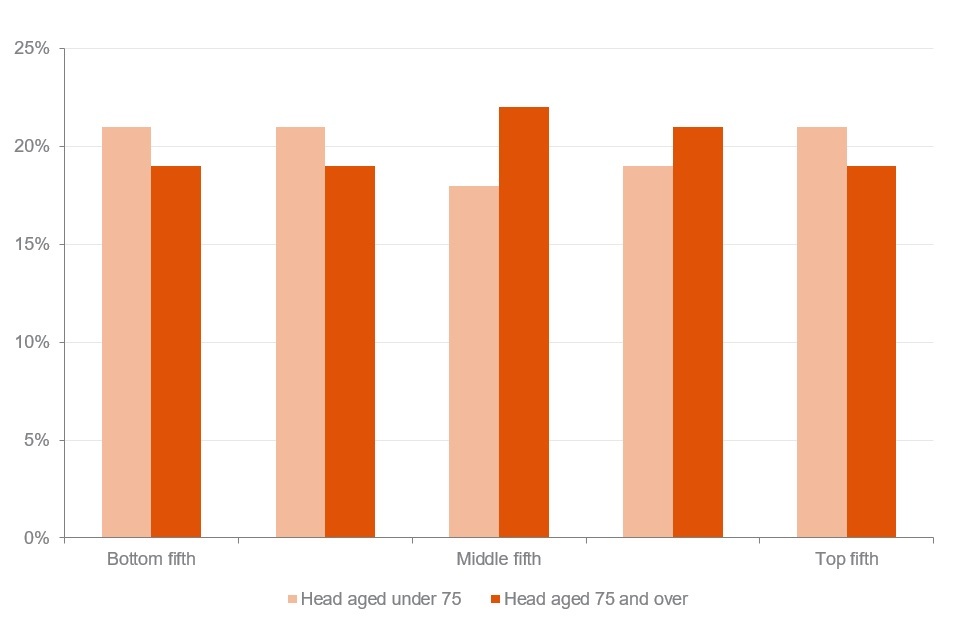
Average weekly income of pensioners (AHC) by age group in FYE 2022 prices (£)
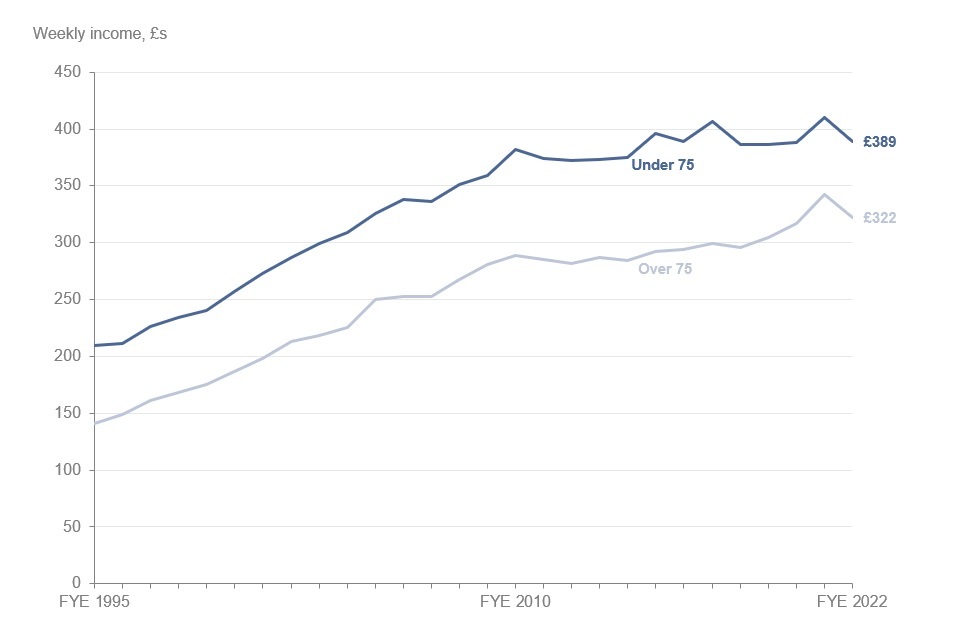
In FYE 2022, pensioners where the head was under 75 had average weekly incomes of £389. This was higher than those where the head was 75 or over, who had average weekly incomes of £322. This difference is statistically significant.
Fewer pensioners were receiving income-related benefits
Percentage of pensioners receiving income-related benefits, FYE 1995, FYE 2010 and FYE 2022
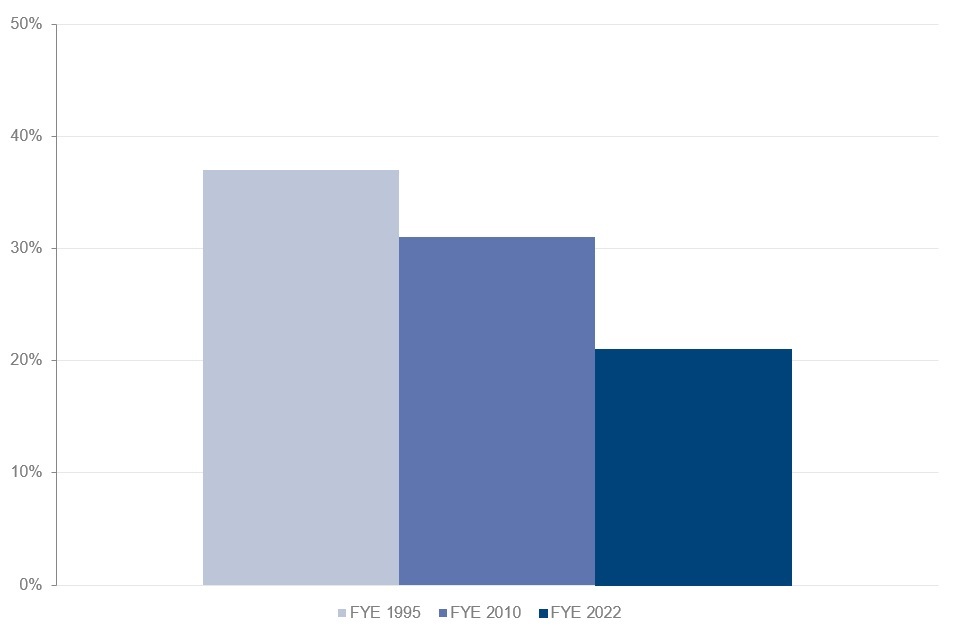
The percentage of pensioners in receipt of income-related benefits in FYE 2022 was 21%. This has been decreasing since the survey began in FYE 1995 when 37% of pensioners were in receipt of such benefits. This decrease is statistically significant.
The percentage of pensioners in receipt in FYE 2010 was 31%. The decrease between FYE 1995 and FYE 2010, and the decrease between FYE 2010 to FYE 2022 are both statistically significant.
2. What you need to know
The Pensioners’ Incomes (PI) Series contains estimates of the levels, sources, and distribution of pensioners’ incomes. It also examines the position of pensioners within the income distribution of the population as a whole. The statistics are used by government departments, local authorities, academics, journalists, and the voluntary sector to gain a deeper understanding of pensioners’ incomes. As of this release, there are 28 years of data in the time series.
In this report we measure income for pensioners. Pensioners consist of single pensioners and pensioner couples. A pensioner couple means at least one person in the couple is over State Pension age (SPa). Estimates do not reflect income from others in a household but do include income from working-age partners who are part of a pensioner couple. Therefore, if a pensioner lives with their adult children, the children’s income is not included in this analysis.
The head of a pensioner unit is the member of the household with the highest income if that person is part of the pensioner unit. Otherwise, the head is the first person named in the survey who is part of the pensioner unit.
Income measures
Except where otherwise stated, we use the unequivalised income of pensioners, estimated both before and after housing costs (BHC and AHC). Unless otherwise stated for certain income breakdowns, we use median income as our measure of average income, as the mean is often biased upwards by extremely high values. The mean is used however, when looking at the breakdown of income components. We also use AHC figures unless otherwise stated, as this is a better reflection of pensioners’ disposable incomes.
All income estimates have been adjusted for inflation. PI uses variants of the Consumer Prices Index (CPI) to adjust for inflation, to look at how incomes change over time in real terms.
See a full breakdown of how we measure income in the ‘About these statistics’ section of this publication.
Survey data
PI estimates are based on a sample of just over 6,000 pensioners in private households in the UK, taken from the Family Resources Survey (FRS).
Estimates are based on the FRS, which in FYE 2022 continued with the telephone interview approach that was adopted during FYE 2021. This resulted in a smaller achieved sample size of around 16,000 households in FYE 2022, though this was larger than the sample size in 2021 which was around 10,000. When preparing the FYE 2021 estimates, some evidence was found that the pensioners sampled were more affluent compared to previous time periods. They were more likely to be owner occupiers, receive an occupational or personal pension, have income from investments, and on average have access to higher levels of savings. The FYE 2022 population is more closely aligned with the pre-pandemic period on these metrics, compared to FYE 2021. Whilst the FRS and HBAI grossing regimes bring the age, tenure, and education profile in line with the UK population, there remains some unobservable residual bias that cannot be corrected by the grossing regime. See the Households Below Average Income (HBAI) technical report which explains the effects of the coronavirus (COVID-19) pandemic in more detail. This should be considered alongside the interpretation of the PI Series statistics.
The FRS is conducted across the full financial year, so the data in this report is broken down into financial years. The use of survey data means that the results in this report are subject to sampling variation. This affects how changes should be interpreted, especially over short time periods.
Statistical significance is a technical concept that says whether a reported change is likely to have arisen only by chance due to variations in the sampling. We calculate 95% confidence intervals around estimates in PI. This sets a standard that, where any change is reported as statistically significant, there is less than a one in 20 chance that the reported difference is due to sampling variation and there is no real underlying change. Statistically significant differences are clearly stated in the text. Other differences are not significant or have not been tested.
As shown in Table M1.2 of the Background Information & Methodology, comparisons over a single year are rarely statistically significant. Users are advised to draw conclusions from long-term trends rather than year-on-year changes.
Given the reduced sample size in FYE 2022, confidence intervals around the main estimates are wider than in years prior to the coronavirus (COVID-19) pandemic, though not as wide as FYE 2021. The increase in variation does vary across the main estimates, but on average is around 20%. Therefore, the degree of change in the estimates needed to be larger before we can be confident it is statistically significant.
Data is for the UK from FYE 2003 onwards. Data from earlier years is for Great Britain only.
Additional tables and data
A comprehensive set of reference tables breaking down headline results presented in this report are available. These tables are referenced throughout this report and show results for various demographic characteristics across the 28 years of the time series. Further breakdowns of the PI data can be created on Stat-Xplore.
Any analysis of the changes in the estimates below UK level and across a range of breakdowns should be undertaken with additional caution as the combination of smaller sample sizes and additional bias means it may not be possible to make meaningful statistical assessments of trends and changes for these breakdowns.
The PI dataset is available to download via the UK Data Service.
Considerations when interpreting average pensioner incomes’
PI finds that there are differences in average incomes between age groups as well as changes over time. There are several reasons for this which should be noted when interpreting these results:
- the ‘age’ effect: older pensioners are less likely to be in work and hence receive a smaller amount from earnings. Furthermore, they are less likely to have a partner who is in work. Any pension(s) they may be in receipt of are related to their earnings, years of scheme membership, and pension contributions (including National Insurance in the case of the State Pension) they made previously in their working lives
- the ‘cohort’ effect: the rapid rise in occupational pension coverage in the 1950s and 1960s will have been more beneficial to later cohorts. From the 1980s, coverage of high contribution defined benefit (DB) schemes started to decline with most private sector DB schemes now closed to new joiners. Only 10% of all schemes are open to new entrants. Coverage in private sector workplace pensions only started to increase from 2012 following the introduction of Automatic Enrolment (AE). However, contributions to defined contribution (DC) schemes are currently much lower than previous defined benefit schemes
- the length of time since retirement: pensions generally increase by less generous uprating measures after retirement. In addition, most annuities purchased with occupational or personal pensions are level annuities, which do not increase over time. Income in real terms is therefore decreasing for these annuities once inflation is considered
- uprating: the Basic and New State Pension increased by 2.5% in line with the ‘triple lock’. This was lower than inflation of around 4% and so was not an increase in real terms for those in receipt
- changing SPa over time: from 6 April 2010, the SPa has been increasing gradually for females, and since December 2018 has been increasing for both males and females. The FRS data contained in this report was collected throughout FYE 2022, during which the SPa for both males and females remained at 66 years. In this report, people are categorised as being above SPa based upon their reported birth date and the timetable for the legislated increases in SPa
3. Overall income trends
Pensioner incomes have increased since 1995
Average weekly income of pensioners (AHC) by family type in FYE 2022 prices (£)
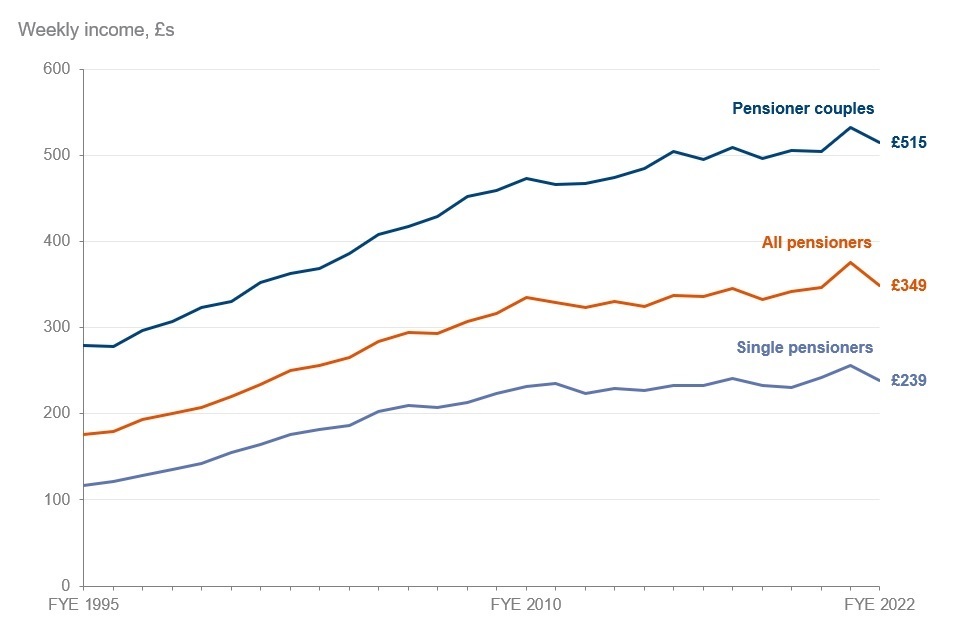
After the deduction of direct taxes, and housing costs, the average income of all pensioners in FYE 2022 was £349 per week.
There was a statistically significant increase in the average income of all pensioners from FYE 1995, when it was £176 per week, to FYE 2010, £335 per week. This change reflected growth in income from benefits, including the State Pension, as well as increased income from occupational pensions.
In FYE 2022, the average income for pensioner couples was £515 per week. This was more than twice that of single pensioners, who had an average income of £239 per week. This difference is statistically significant.
See Table 2.1 for full data.
Pensioner couples were less reliant on benefit income than single pensioners
Percentage of gross mean income from different sources by family type, FYE 2022
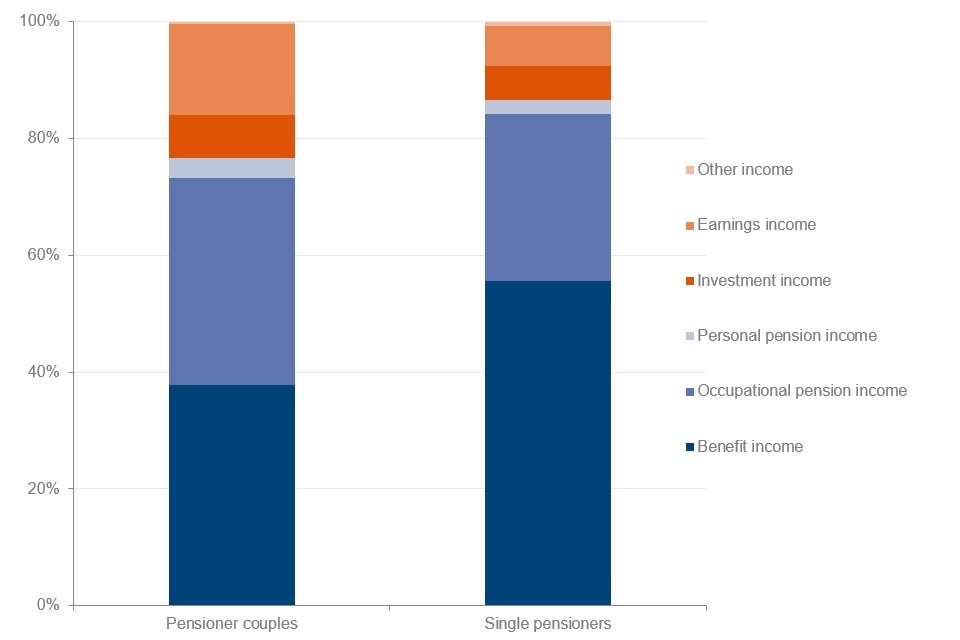
Pensioners receive income from a range of different sources. Changes in the composition of pensioners’ incomes reflect underlying economic factors.
In FYE 2022, benefit income, which includes State Pension, was the largest component of total gross income for both pensioner couples and single pensioners. This was 56% for single pensioners, while for pensioner couples it was 38%.
Income from occupational pensions was 35% of total gross income for pensioner couples and 29% for single pensioners.
Income from earnings made up seven per cent of total gross income for single pensioners. For pensioner couples, 16% of total gross income was from earnings. Couples that contained one adult below SPa made up 24% of all pensioner couples. For some of these couples, the adult below SPa contributed to the earnings income.
Earnings income made up 36% of total gross income for pensioner couples where one partner was over SPa and one was under it. For couples where both partners were over SPa, this was only eight per cent.
See Tables 2.1, 5.1 and 5.3 for full data.
Older pensioners had lower incomes than younger pensioners on average
Average weekly income of pensioners (AHC) by age group in FYE 2022 prices (£)
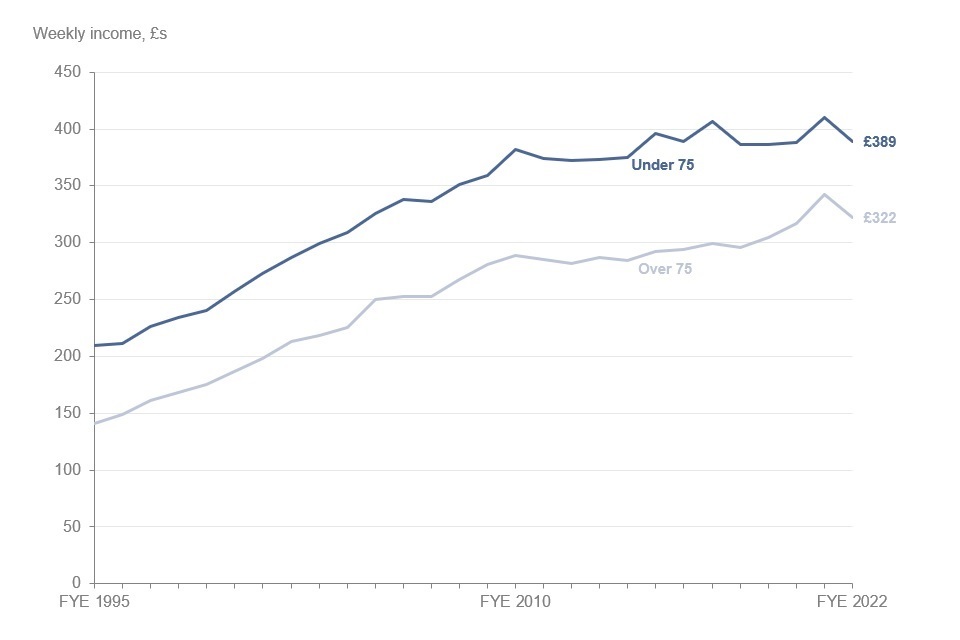
In FYE 2022, pensioners where the head was under 75 had higher average incomes than those where the head was 75 or over. Their average incomes were £389 and £322 per week, respectively. This difference is statistically significant.
In FYE 2022, 58% of pensioners where the head was 75 or over were single pensioners. On average, single pensioners had lower incomes. The average income for single pensioners aged under 75 was £234 per week. This was less than the average income for single pensioners aged 75 or over, which was £243 per week. More information about single pensioners’ incomes can be found later in this section.
See Tables 1.2, 2.6 and 2.7 for full data.
Older pensioners were more reliant on benefit income
Percentage of gross mean income from different sources by age group, FYE 2022
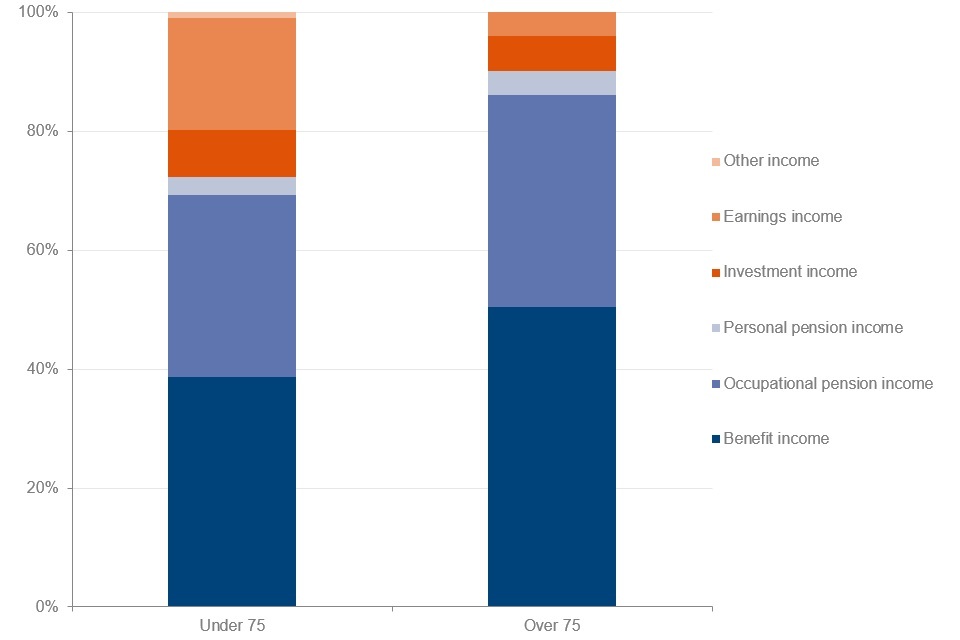
Benefit income, which includes State Pension, made up 51% of total gross income for pensioners where the head was aged 75 or over and 39% of total gross income for pensioners where the head was aged under 75.
The proportion of total gross income that was made up of occupational pension income was similar for both pensioner groups. Occupational pension income accounted for 36% of total gross income for pensioners over 75 and 31% for those under 75. While occupational pension income was higher for the younger age group, this group also had higher overall income, resulting in the percentage contribution of their occupational pension income being slightly smaller.
Earnings income accounted for 19% for pensioners where the head was under 75 and where the head was aged 75 or over, it was four per cent. Older pensioners are less likely to be in work, which may explain why on average they receive a smaller amount from earnings.
Investment income contributed towards eight per cent of total gross income for pensioners under 75. Pensioners over 75 received six per cent of their total gross income from investments.
Incomes from personal pensions were similar percentages of total gross income for both groups.
See Table 2.7 for full data.
Single male pensioners continued to have higher incomes than single female pensioners
Average weekly income of pensioners (AHC) by gender in FYE 2022 prices (£)
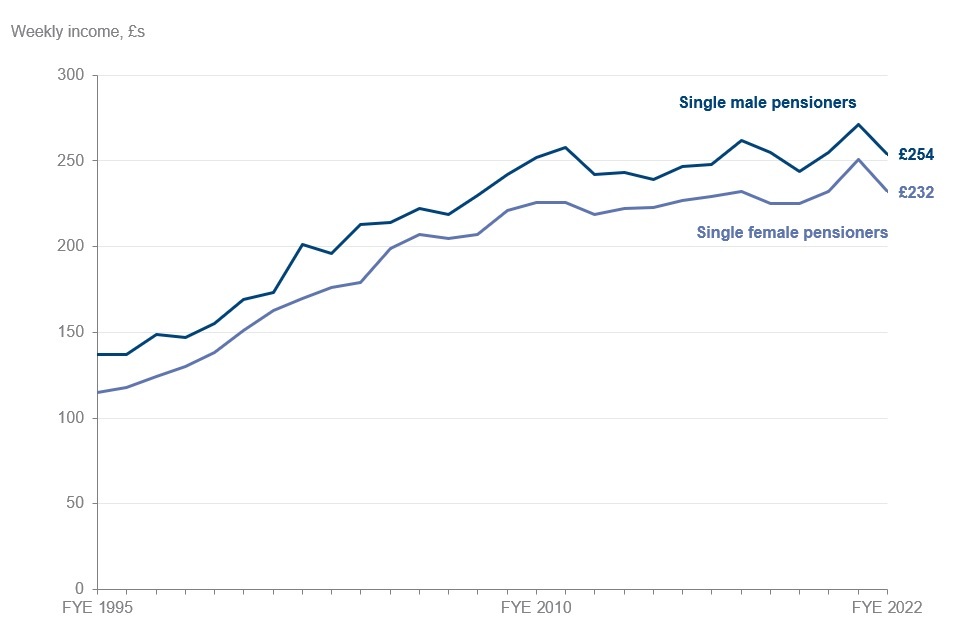
Single male pensioners had higher average incomes than single female pensioners in FYE 2022. Single males had an average weekly income of £254 and single females had an average income of £232.
See Table 2.8 for full data.
Benefit income made up 60% of total gross income for single female pensioners
Percentage of gross mean income from different sources by gender, FYE 2022
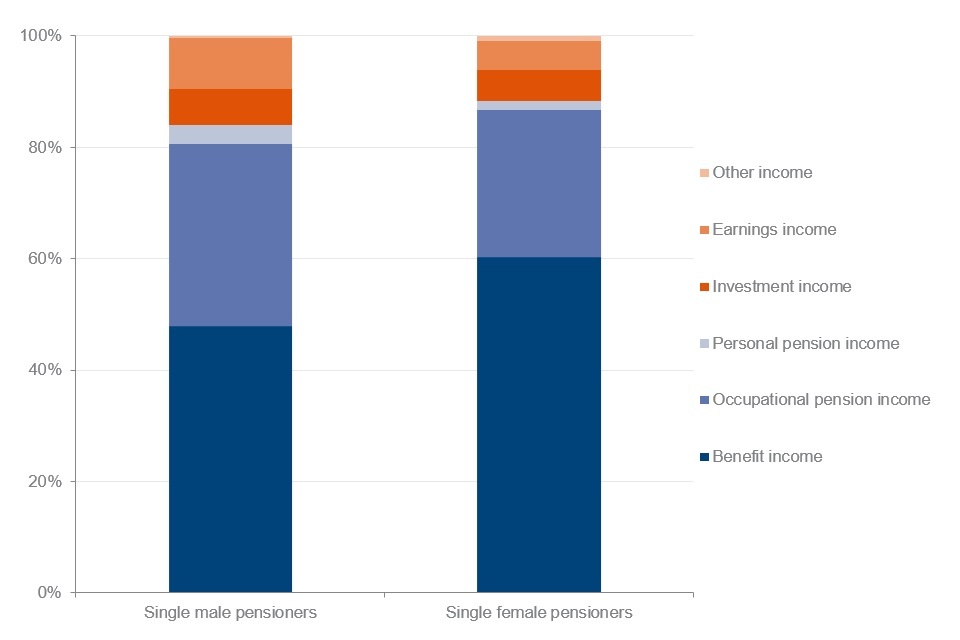
The difference in incomes between single male and single female pensioners reflects differences in the components that make up individuals’ total gross income.
In FYE 2022, benefit income, which includes State Pension, made up 60% of total gross income for single females. For single males, this value was 48%.
Occupational pension made up 33% of total gross income for single male pensioners. For female pensioners, this was 26%.
Income from earnings made up nine per cent of total gross income for single males. For single females, this was five per cent. Single female pensioners being older on average may be a contributing factor here, as they may be less likely to work.
See Table 2.8 for full data.
4. Regional differences
Pensioner incomes differed between regions and countries
When looking at regional incomes, we use the average weekly income (AHC) for each region over the three-year period FYE 2020 to FYE 2022, adjusted to FYE 2022 prices.
Average weekly income (AHC) of pensioner couples by region or country, relative to the UK average, FYE 2020 to FYE 2022
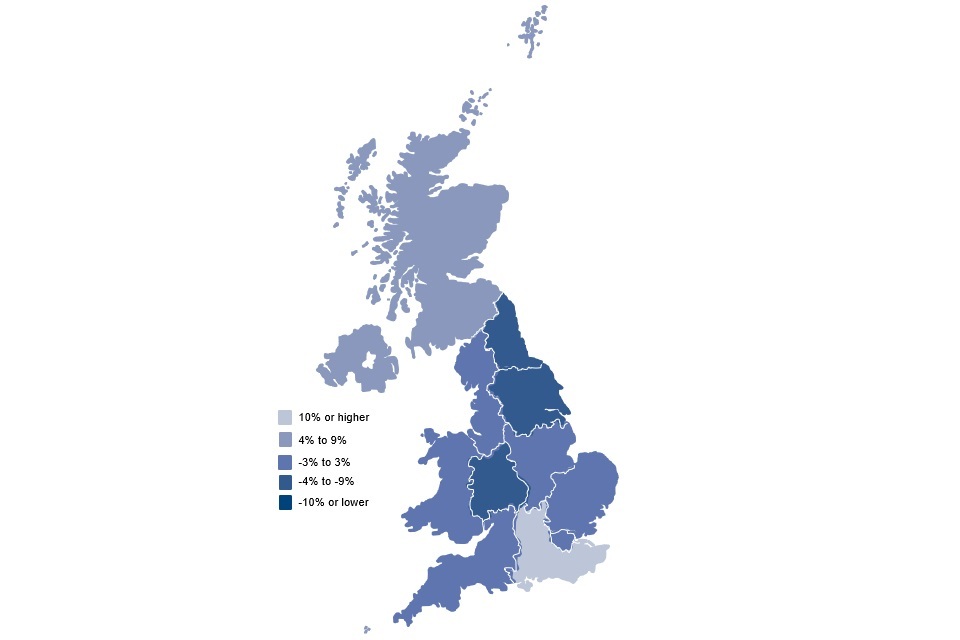
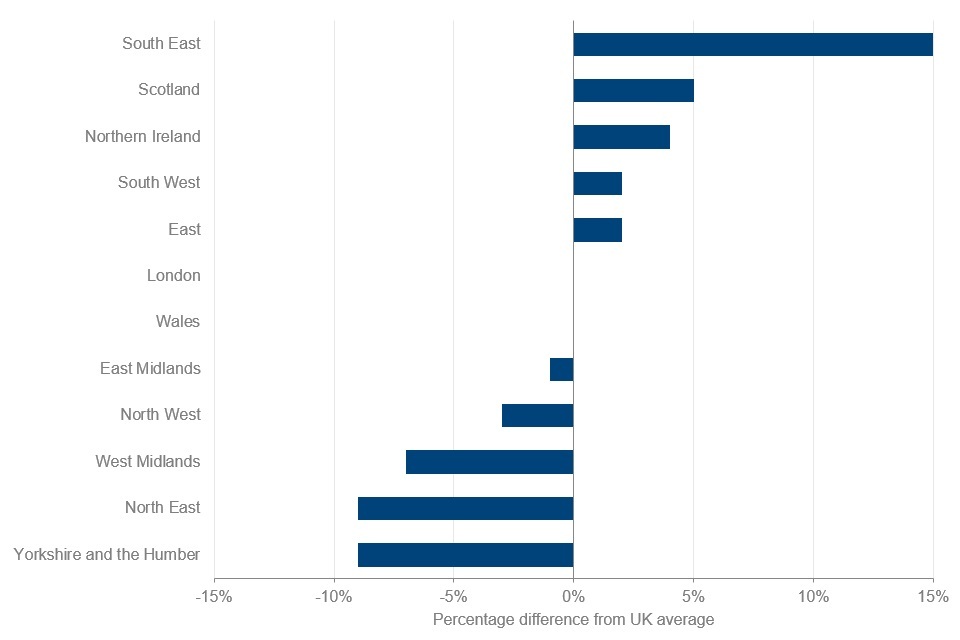
Most regions in England had average weekly incomes below the pensioner couples UK average. Two areas, London and Wales, were equal to the pensioner couples UK average.
The UK average weekly income over the period FYE 2020 to 2022 was £518 for pensioner couples.
On average, pensioner couple incomes were lowest in Yorkshire and the Humber, where incomes were nine per cent below the UK average. This difference is statistically significant. Pensioner couples in the North East also saw incomes that were nine per cent below the UK average.
Pensioner couples in the South East had the highest average income, 15% higher than the UK average. This difference is statistically significant.
Differences between regions are likely to be associated with demographic and economic variations, including housing costs.
See Table 2.4 for full data.
Average weekly income (AHC) of single pensioners by region or country, relative to the UK average, FYE 2020 to FYE 2022
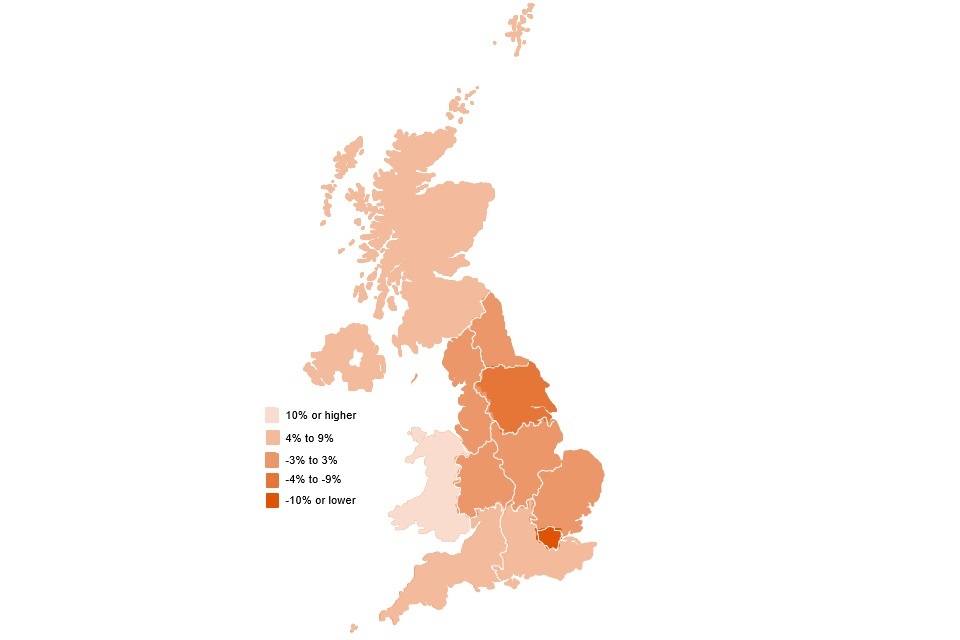
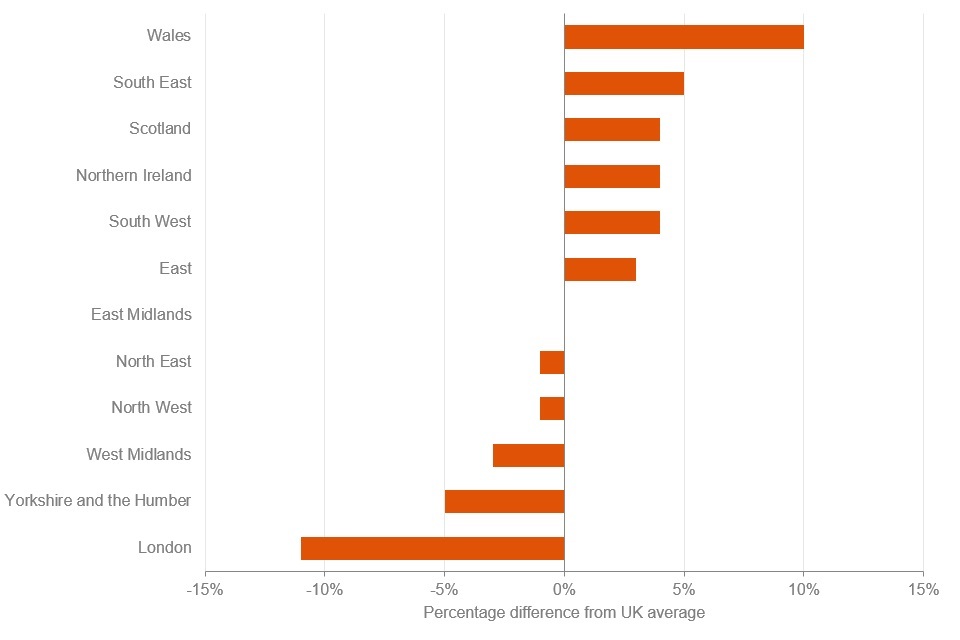
In the period FYE 2020 to 2022, single pensioners in the UK had an average income of £246 per week.
In most regions in England, single pensioners had average weekly incomes below the single pensioner UK average.
Single pensioners in London had the lowest average incomes. Their average income was 11% below the UK average.
The area with the highest average income for single pensioners was Wales, where incomes were 10% above the UK average, followed by 5% above the UK average for the South East.
Differences between regions are again likely to be associated with demographic and economic variations, including housing costs.
See Table 2.4 for full data.
5. Sources of pensioners’ incomes
Percentage of pensioners receiving income from income-related benefits decreased
Percentage of pensioners receiving each source of income, FYE 1995, FYE 2010 and FYE 2022
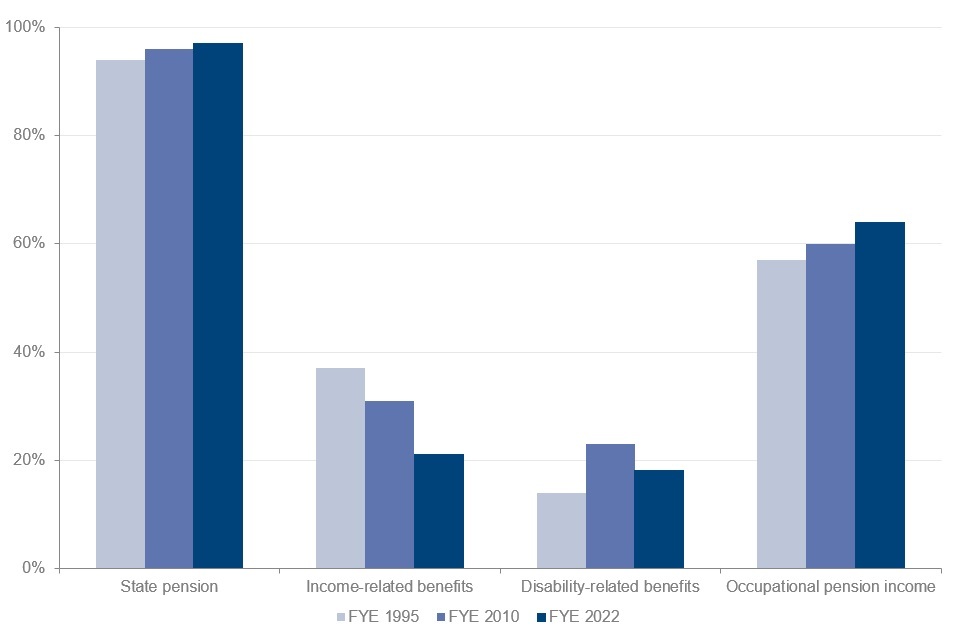
Nearly all pensioners (97%) were in receipt of the State Pension in FYE 2022. This has increased from both FYE 1995 and FYE 2010, when 94% and 96% of all pensioners were in receipt of the State Pension respectively. The increase from FYE 1995 to FYE 2022 is statistically significant.
Income-related benefits were received by 21% of all pensioners in FYE 2022. The percentage of pensioners in receipt of income-related benefits decreased from 37% in FYE 1995, and 31% in FYE 2010. The decreases from FYE 1995 to FYE 2010 and from FYE 2010 to FYE 2022 are both statistically significant. The decrease from FYE 1995 to FYE 2022 is also statistically significant. This reflects the overall increase in pensioner income from the State Pension and private pensions over time because an increase in income reduces eligibility to income-related benefits.
The percentage of pensioners in receipt of disability benefits in FYE 2022 was 18%, an increase compared to 14% in FYE 1995, though this figure was 23% in FYE 2010. The decrease from FYE 2010 to FYE 2022 is statistically significant, though the overall increase from FYE 1995 to FYE 2022 is also statistically significant.
Occupational pension income was received by 64% of pensioners in FYE 2022. FYE 1995 and FYE 2010 saw 57% and 60% respectively. The overall increase between FYE 1995 and FYE 2022 is statistically significant.
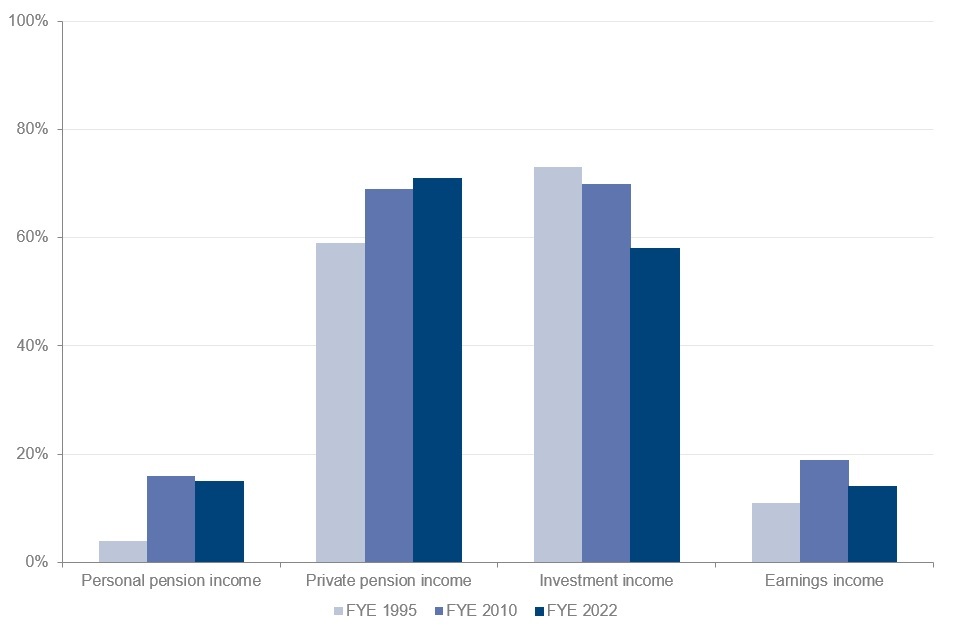
Personal pensions provided income to a smaller group of pensioners than occupational pensions. In FYE 2022, 15% of pensioners were in receipt of income from personal pensions, compared to 16% in FYE 2010 and four per cent in FYE 1995. The increase between FYE 1995 and FYE 2022 is statistically significant. Personal pensions in their current form were introduced in 1988.
Private pension income was received by 71% of pensioners in FYE 2022. FYE 1995 and FYE 2010 saw 59% and 69% respectively. The overall increase between FYE 1995 and FYE 2022 is statistically significant, as was the increase between FYE 2010 and FYE 2022.
Investment income was received by 58% of all pensioners in FYE 2022. The percentage of pensioners in receipt of investment income has decreased from 70% in FYE 2010. This figure was 73% in FYE 1995. The decreases between FYE 1995 and FYE 2022 and between FYE 2010 and FYE 2022 are both statistically significant.
Pensioners in receipt of earnings in FYE 2022 was 14%, compared to 11% in FYE 1995, though this figure was 19% in FYE 2010. The decrease between FYE 2010 and FYE 2022 is statistically significant, as is the overall increase between FYE 1995 and FYE 2022. For some pensioner couples, one adult below SPa contributed to the earnings income.
More information about the distribution of income components for those in receipt in FYE 2022 can be found below.
See Tables 3.4 – 3.11 for full data.
Distribution of income from selected income sources for all pensioners in receipt, FYE 2022 (£ per week)
State Pension
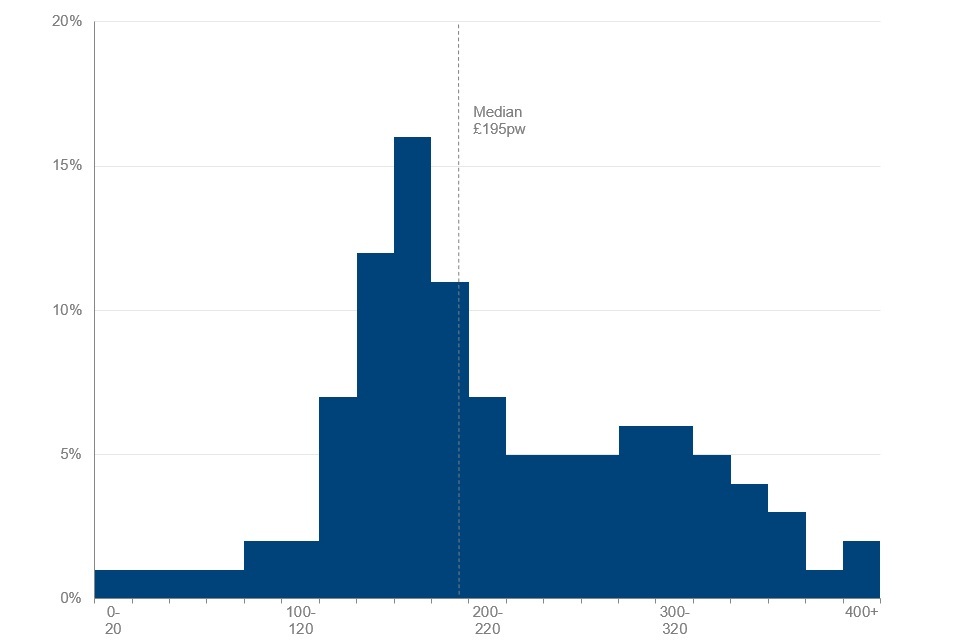
Almost all pensioners (97%) received income from State Pension, with an average amount of £195 per week. Some peaks in the distribution may be explained by the basic State Pension rate, which was £137.50 per week in FYE 2022, as well as the new State Pension full rate, which was £179.60.
See Tables 3.4 and 6.1 for full data. For more information on State Pension rates, see the benefit and pension rates for 2021 to 2022.
Income-related benefits
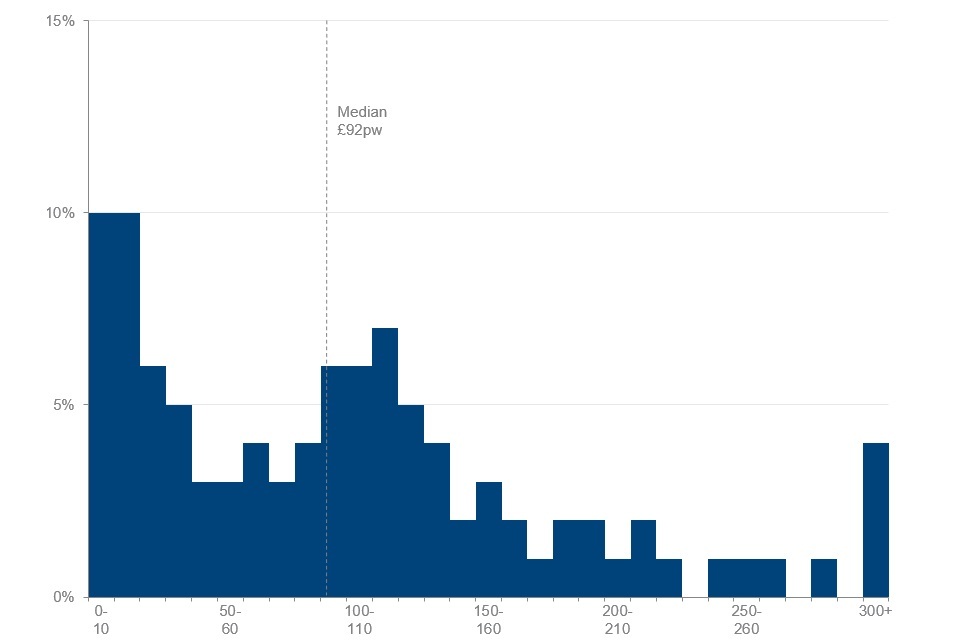
Pensioners in receipt of income-related benefits in FYE 2022 was 21%. The average income for those in receipt of income-related benefits in FYE 2022 was £92.
See Tables 3.5 and 6.2 for full data. For more information on income-related benefits, see the benefit and pension rates for 2021 to 2022.
Disability benefits
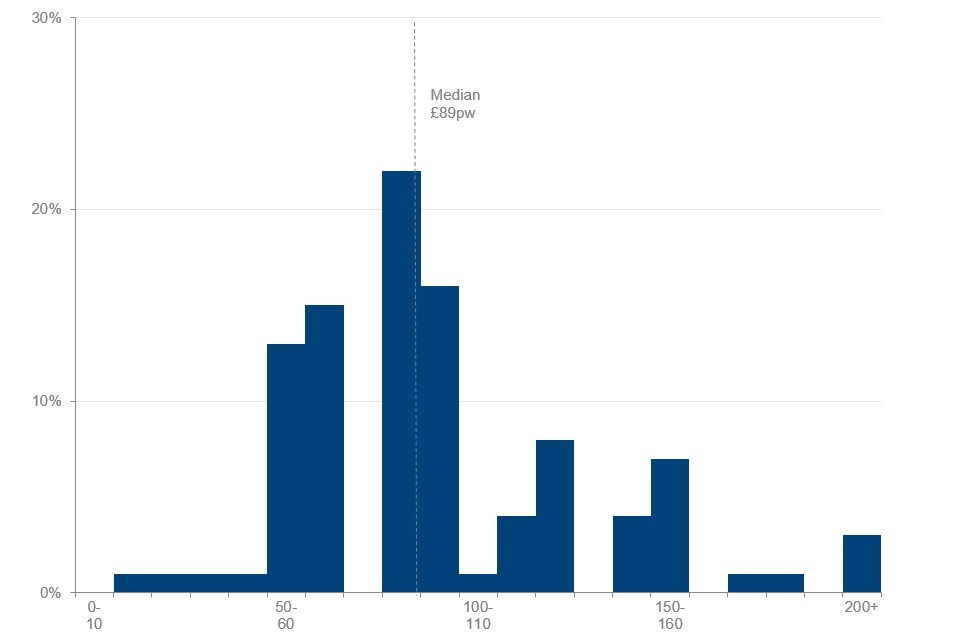
Those receiving disability benefits made up 18% of all pensioners. The average income for those in receipt was £89 per week. Some benefits have set rates, which may explain peaks in the distribution. For example, Attendance Allowance had a lower rate of £60 per week and a higher rate of £89.60 per week in FYE 2022.
See Tables 3.6 and 6.3 for full data. For more information on Attendance Allowance, see the benefit and pension rates 2021 to 2022.
Occupational pension income
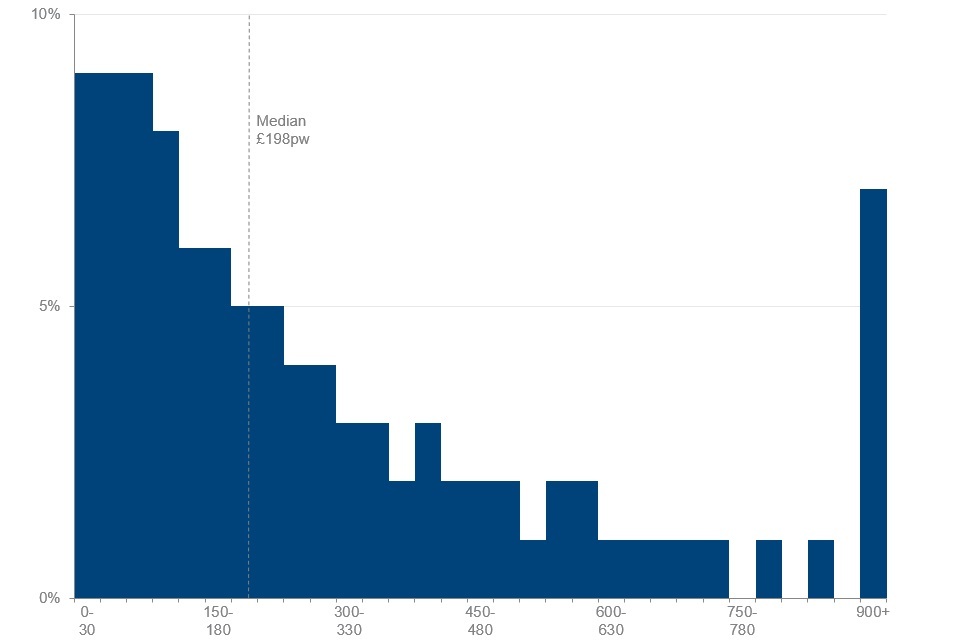
Pensioners in receipt of occupational pension income was 64%. The average amount for these pensioners was £198 per week. Of those pensioners in receipt of occupational pension income, 7% recieved £900 or more per week.
See Tables 3.7 and 6.4 for full data.
Personal pension income
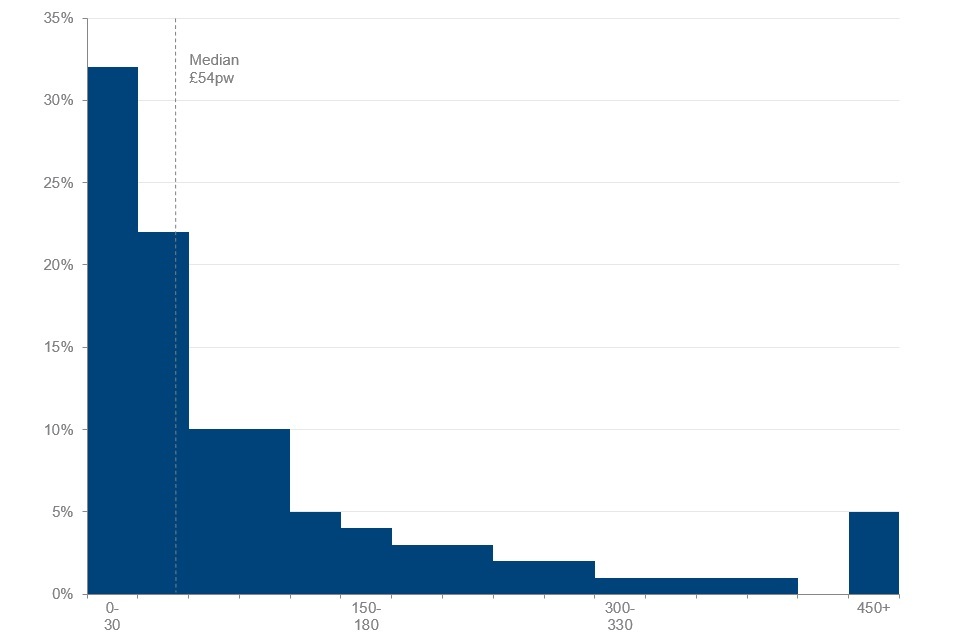
Pensioners in receipt of income from a personal pension was 15%, with an average of £54. Of those pensioners, 32% had personal pension income of less than £30 per week.
See Tables 3.8 and 6.5 for full data.
Private pension income
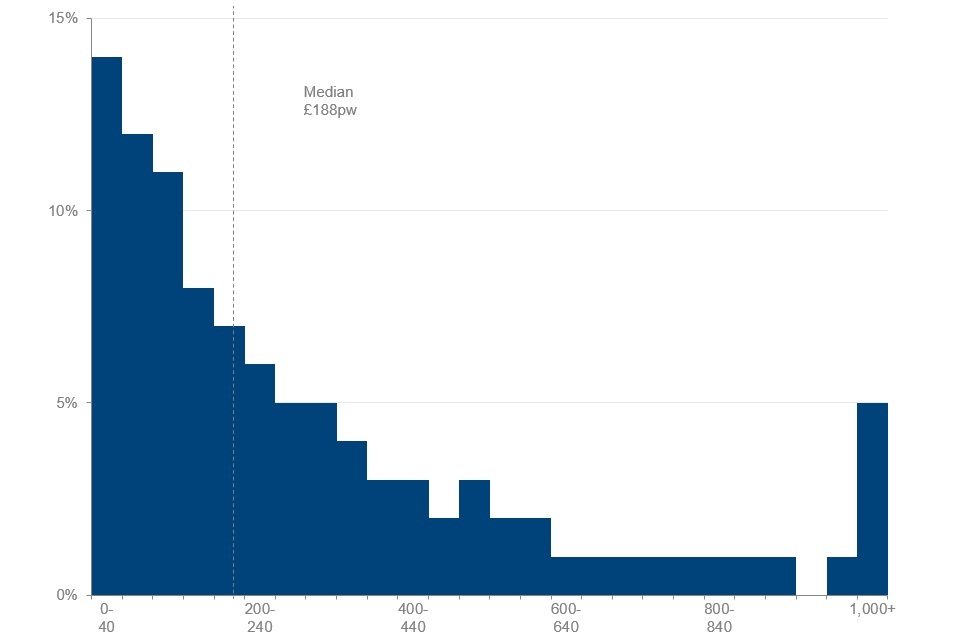
Pensioners in receipt of income from a private pension was 71%. The average amount for those in receipt was £188 per week. Of those in receipt, 5% had private pension income of £1000 or more per week.
See Tables 3.9 and 6.6 for full data.
Investment income
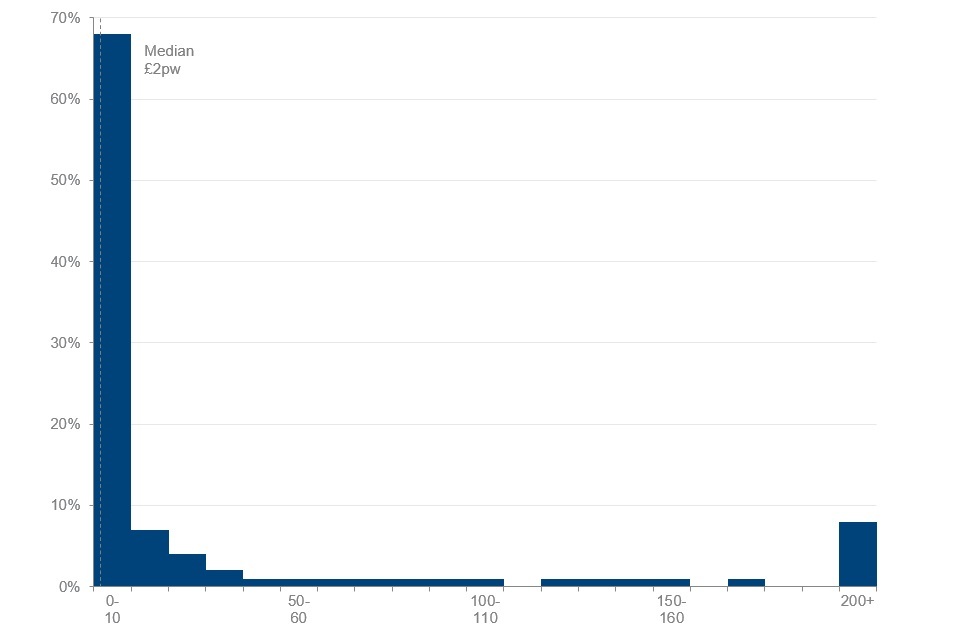
Pensioners in receipt of investment income was 58%, with an average income of £2 per week. Of pensioners in receipt, 8% had an investment income of £200 or more per week.
See Tables 3.10 and 6.7 for full data.
Earnings income
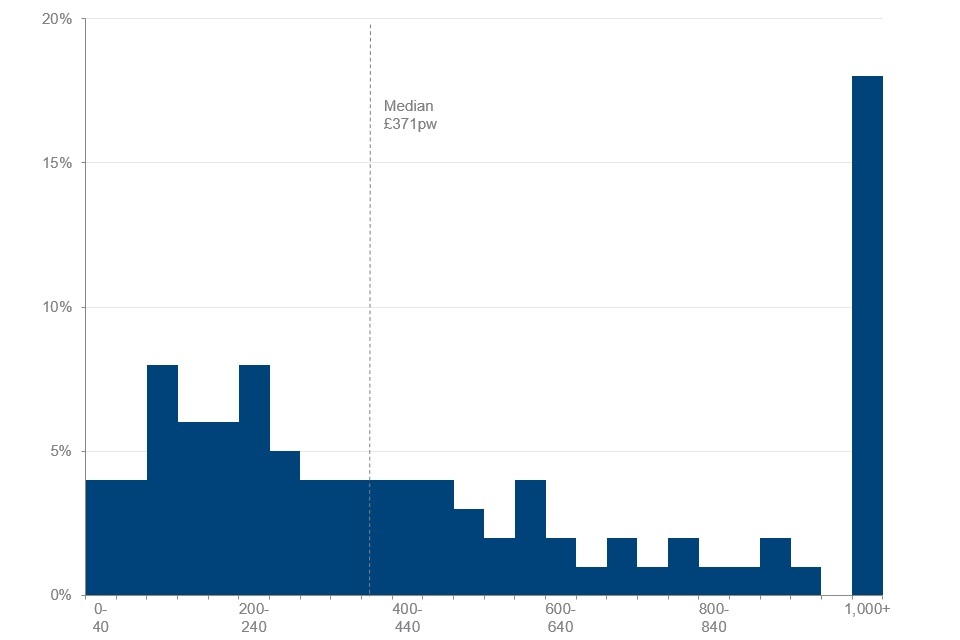
Pensioners in receipt of earnings income was 14%, with an average income of £371 per week. Of pensioners in receipt of income from earnings, 18% had income of £1,000 or more per week.
See Tables 3.11 and 6.8 for full data.
6. Distribution of pensioners’ incomes
This section looks at the distribution of pensioners’ incomes and where different groups of pensioners sit within it. To do this, pensioners’ incomes are ranked in order, and then the ranked pensioner population is divided into five equal groups of 20%. The top fifth had the highest incomes and the bottom fifth had the lowest. This is calculated separately for couples and single pensioners.
Pensioners’ position within the pensioner income distribution varied by age for couples
Percentage of pensioners, by age of head, in each fifth of the pensioner couples net income (AHC) distribution, FYE 2022
In FYE 2022, 22% of pensioner couples where the head was 75 or over were in the bottom fifth of the pensioner couples’ income distribution. Of couples where the head was under 75, 19% of couples were in the bottom fifth. The top fifth of the income distribution contained 17% of pensioner couples where the head was 75 or over. Of couples where the head was under 75, 22% of couples were in the top fifth. This difference is statistically significant.
See table 4.2 for full data
Pensioners’ position within the pensioner income distribution was similar between age groups for singles
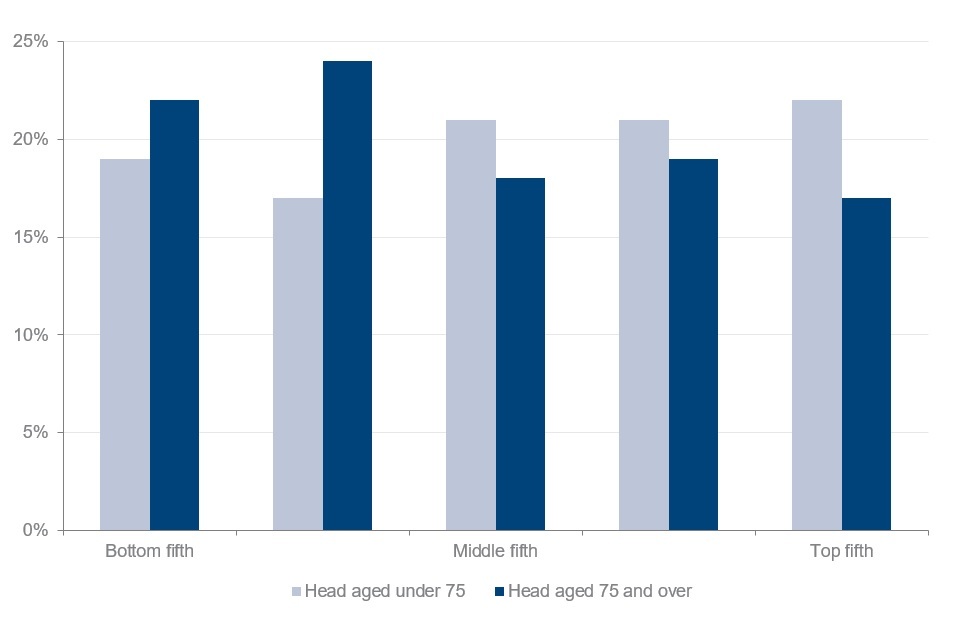
Percentage of pensioners, by age of head, in each fifth of the pensioner singles net income (AHC) distribution, FYE 2022
The bottom fifth of the pensioner singles income distribution contained 21% of single pensioners that were aged under 75. Of single pensioners that were aged 75 or over, 19% were in the bottom fifth of the pensioner singles income distribution. The top fifth of the income distribution also contained 19% of single pensioners aged under 75 and 21% of single pensioners 75 or over.
See Table 4.2 for full data.
The sources of pensioners’ incomes differed across the income distribution
Percentage of gross mean income from different sources for couples and singles in the top and bottom fifths of the pensioner couples or singles net income (AHC) distribution, FYE 2020 to 2022
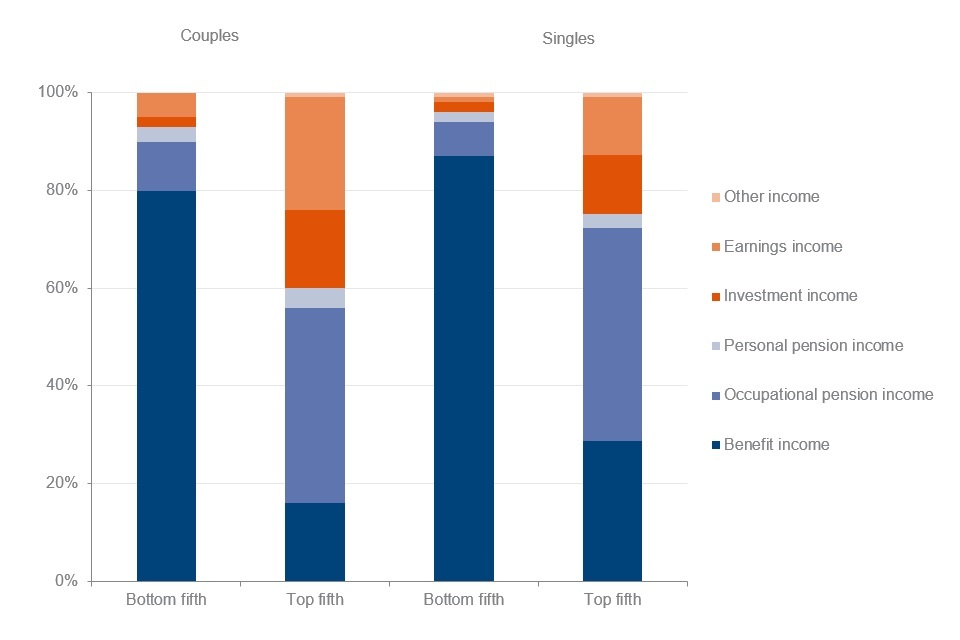
Benefit income, including State Pension income, was the largest source of income for both single pensioners and couples in the bottom fifth of the income distribution over the three-year period FYE 2020 to 2022. For pensioner couples in the bottom fifth, benefit income accounted for 79% of income, while for single pensioners this was 87%.
For the top fifth of both couples and singles, the largest source of income was occupational pension income (40% for couples and 44% for singles). For both couples and singles, the top fifth of the income distribution received a larger percentage of their income from earnings than any other quintile (23% for couples and 12% for singles).
See Table 4.4 for full data.
7. Pensioners’ incomes within the overall income distribution
When looking at the position of individuals in pensioner units within the income distribution of the overall population, we use equivalised income. This means that incomes are adjusted to take account of the size and composition of households. This is the approach used in the HBAI report, which analyses the overall household income distribution.
The percentage of pensioners in the top fifth of the overall population income distribution has increased since 1995
Percentage of pensioners in each fifth of the overall population income distribution (AHC), using equivalised income, FYE 1995, FYE 2010 and FYE 2022
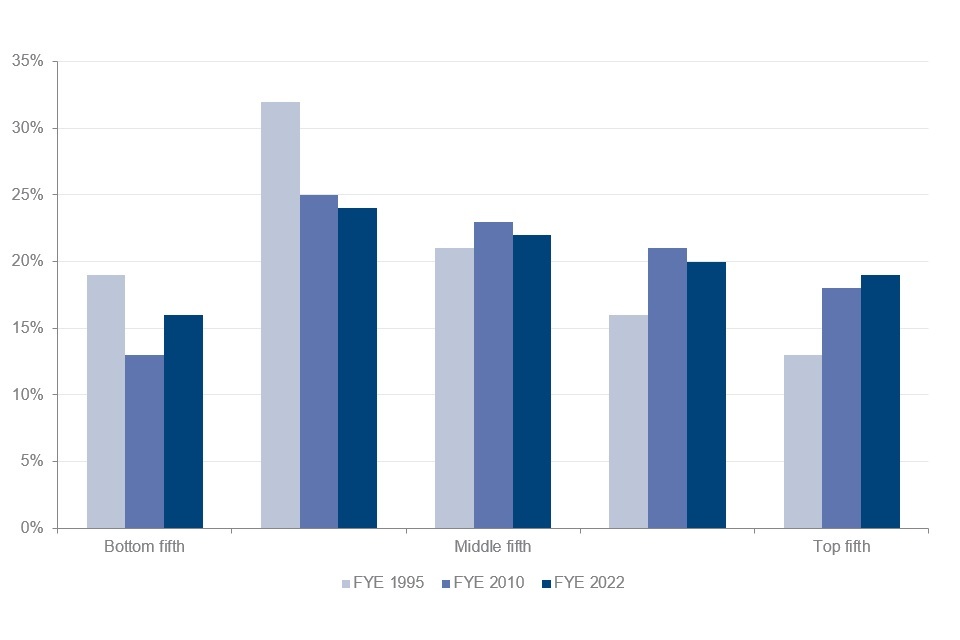
Fewer pensioners were in the bottom fifth of the overall income distribution in FYE 2022 compared to FYE 1995, and more were in the top fifth. The percentage of pensioners in the bottom fifth was 19% in FYE 1995. In FYE 2022, 16% of pensioners were in the bottom fifth. This difference is statistically significant.
In FYE 1995, 13% of pensioners were in the top fifth of the overall income distribution. This increased to 19% in FYE 2022. This difference is statistically significant.
In FYE 2022, 22% of single pensioners and 13% of pensioner couples were in the bottom fifth. This difference is statistically significant.
Just over a fifth of pensioner couples (21%) were in the top fifth in FYE 2022, compared to 13% of single pensioners. This difference is statistically significant.
See Table 4.6 for full data.
Percentage of pensioners in the top half of the overall population income distribution in FYE 2022 was 50%
Percentage of pensioners in the top half of the overall population income distribution (AHC) by family type, using equivalised income, FYE 1995 to FYE 2022
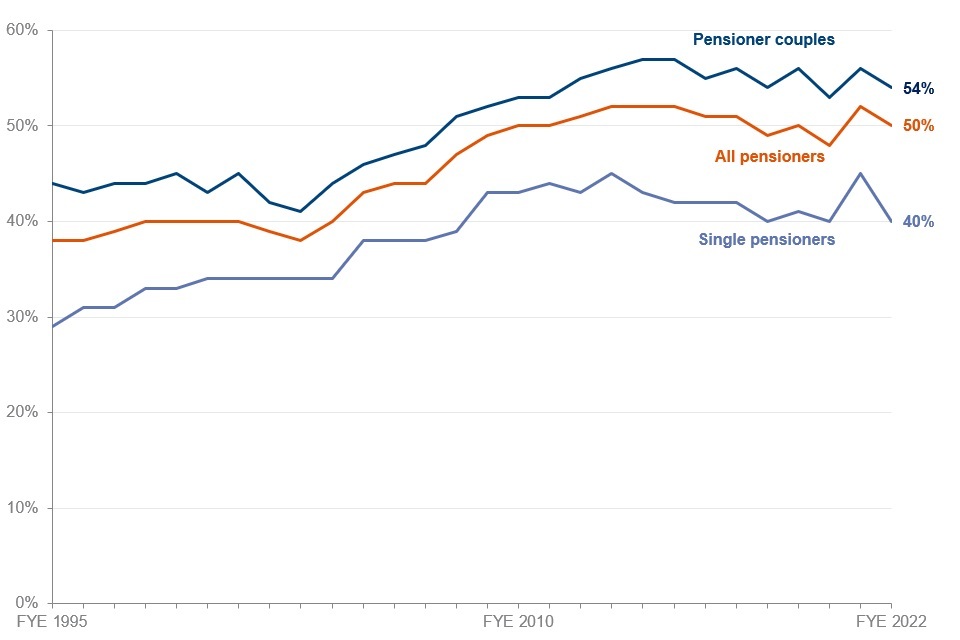
In FYE 2022, 50% of pensioners were in the top half of the overall income distribution. In FYE 1995, this percentage was 38%. This difference is statistically significant. A period of sustained increases was observed from FYE 2003 to FYE 2013, where pensioners in the top half of the overall income distribution rose from 38% to 52%.
The percentage of pensioner couples in the top half of the income distribution was 44% in FYE 1995. In FYE 2022, this was 54%. This difference is statistically significant.
The percentage of single pensioners in the top half of income distribution was 40% in FYE 2022. In FYE 1995, this was 29%. This difference is statistically significant.
It should be noted that due to the coronavirus (COVID-19) pandemic, there was a smaller achieved sample size in FYE 2021 and FYE 2022. Whilst the FRS and HBAI grossing regimes bring the age, tenure, and education profile in line with the UK population, there remains some unobservable residual bias that cannot be corrected by the grossing regime.
See Table 4.7 for full data.
8. About these statistics
How do we measure income?
The main income measure used in PI is weekly net disposable unequivalised income, calculated for both Before Housing Costs (BHC) and After Housing Costs (AHC). Estimates should therefore only be regarded as broadly indicative of pensioners’ overall living standards. BHC income comprises total income from all sources for all members of the pensioner unit.
Income is net of:
-
income tax payments and National Insurance contributions
-
domestic rates or council tax
-
contributions to pension schemes
-
all maintenance payments
-
student loan repayments
-
parental contributions to students living away from home
Income After Housing Costs (AHC) is derived by deducting a measure of housing costs from the overall income measure.
Housing costs include:
-
rent (gross of housing benefit)
-
water rates, community water charges and council water charges
-
mortgage interest payments
-
structural insurance premiums
-
ground rent and service charges
When looking at individual income components, figures are calculated from gross income.
Where to find out more
Further outputs and reference tables from PI analysis, alongside our PI Background information and methodology, which gives additional detail on how we estimate the measures reported here, are available on this year’s Pensioners’ Incomes web page for this release.
Analysis of PI data from previous years, as well as further guidance and information about the statistics, is also available on the Pensioners’ Incomes web page.
Details of other National and Official Statistics produced by DWP can be found on the DWP website:
Information on alternative sources of data on income and earnings are available on the ONS website, including a new income and earnings interactive tool where you can filter by government department and country of interest to find relevant statistics.
Further information about the statistics produced on income and earnings by government departments can also be found on the ONS website.
9. Contacts
Feedback on the content, relevance, accessibility and timeliness of these statistics and any non-media enquiries should be directed to:
Lead Statistician: Joanne Burrage
Email: pensioners-incomes@dwp.gov.uk
For media enquiries on these statistics, please contact the DWP press office.
ISBN: 978-1-78659-490-7