Fire and rescue incident statistics: England, year ending March 2021
Published 12 August 2021
Applies to England

© Crown copyright 2021
This publication is licensed under the terms of the Open Government Licence v3.0 except where otherwise stated. To view this licence, visit nationalarchives.gov.uk/doc/open-government-licence/version/3 or write to the Information Policy Team, The National Archives, Kew, London TW9 4DU, or email: psi@nationalarchives.gov.uk.
Where we have identified any third party copyright information you will need to obtain permission from the copyright holders concerned.
This publication is available at https://www.gov.uk/government/statistics/fire-and-rescue-incident-statistics-england-year-ending-march-2021/fire-and-rescue-incident-statistics-england-year-ending-march-2021
Frequency of release: Quarterly
Forthcoming releases: Home Office statistics release calendar
Home Office responsible statistician: Deborah Lader
Press enquiries: pressoffice@homeoffice.gov.uk
Telephone: 0300 123 3535
Public enquiries: firestatistics@homeoffice.gov.uk
This release contains statistics about incidents attended by fire and rescue services (FRSs) in England for year ending March 2021. The statistics are sourced from the Home Office’s online Incident Recording System (IRS) and include statistics on all incidents attended, fire-related fatalities and casualties from fires, with long term comparisons.
Also included are fuller analyses of incidents attended during COVID-19 restrictions using data from the whole of year ending March 2021 to refresh the more basic analysis contained within fire and rescue incident statistics, England, year ending June 2020.
Key results
FRSs attended 518,263 incidents in year ending March 2021. This was a seven per cent decrease compared with the previous year (558,013). Of these incidents, there were 151,086 fires. This was a two per cent decrease compared with the previous year (154,180).
The decrease in incidents attended this year compared with last year was driven by decreases in all three main incident types (fires, non-fire incidents and fire false alarms) with some elements affected by the restrictions on life imposed throughout year ending March 2021 in response to the COVID-19 pandemic.
There were 240 fire-related fatalities in year ending March 2021 compared with 245 in the previous year. 240 is the lowest financial year figure since comparable data became available in year ending March 1982 and the number of fatalities has been at historically low levels in recent years.
1. Incident summary
Incidents that FRSs attend are categorised into three main types - fires attended, non-fire incidents and fire false alarms.
Key results
In year ending March 2021:
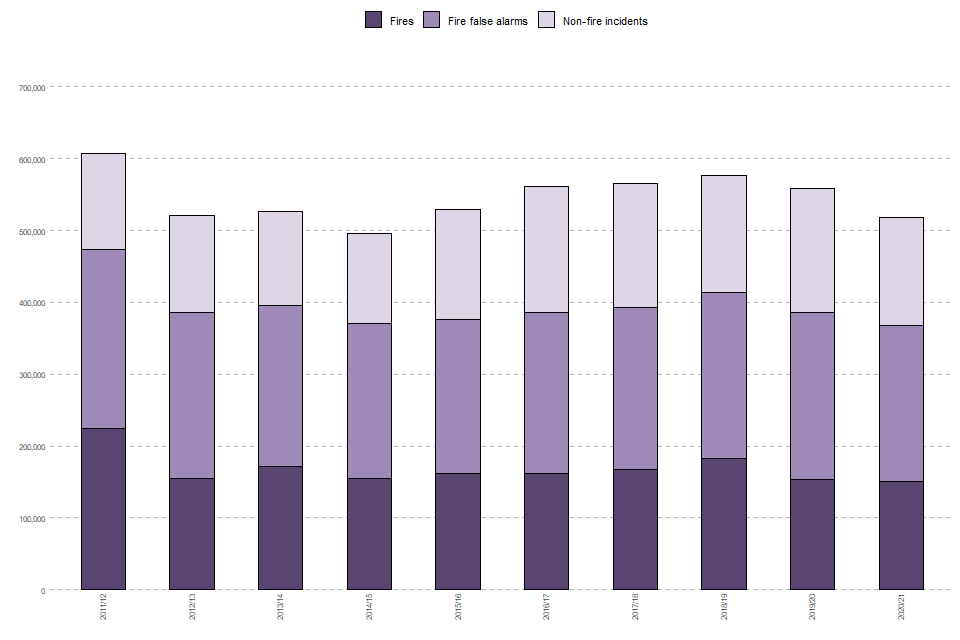
- 518,263 incidents were attended by FRSs: this was a seven per cent decrease compared with the previous year (558,013), a two per cent decrease compared with five years ago (529,674) and a 20 per cent decrease compared with ten years ago (647,362)
The decrease in incidents attended this year compared with last year was driven by decreases in all three main incident types (fires, non-fire incidents and fire false alarms) with some elements affected by the restrictions on life imposed throughout year ending March 2021 in response to the COVID-19 pandemic. Source: FIRE0102
- of all incidents attended by FRSs, fires accounted for 29 per cent, fire false alarms 42 per cent and non-fire incidents 29 per cent; this compares with fires accounting for 35 per cent, fire false alarms 42 per cent and non-fire incidents 23 per cent ten years ago Source: FIRE0102
The number of incidents attended by FRSs in England peaked in year ending March 2004, at over one million incidents. For around a decade, there was a general decline in all three categories of incidents attended and between year ending March 2013 and year ending March 2016 there were around half a million a year. From year ending March 2016 this number rose to around 577,000 incidents in year ending March 2019 then fell to around 518,000 in year ending March 2021.
This was the lowest number of incidents since year ending March 2015, although restrictions on life throughout year ending March 2021 in response to the COVID-19 pandemic was an element in this relatively low figure, as discussed throughout the release.
In contrast to the earlier decreases (caused by a reduction in fire and fire false alarm incidents), the increase in total incidents between year ending March 2015 and year ending March 2019 was driven by increases in fire and non-fire incidents.
This year’s decrease compared with year ending March 2020 was largely driven by decreases in non-fire incidents (down 12%) and fire false alarms (down 7%).
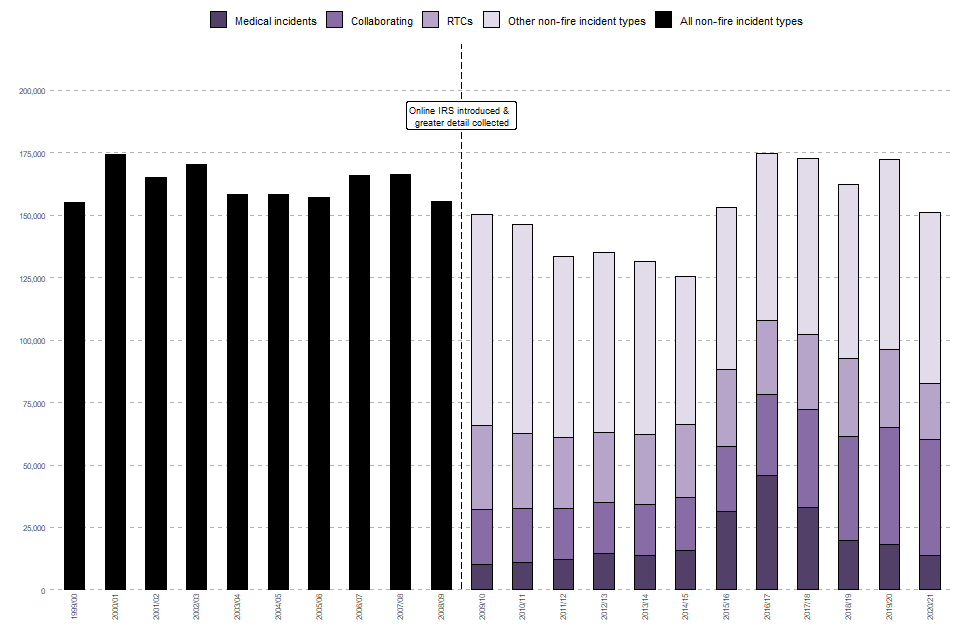
Figure 1.1: Total incidents attended by incident type, England; year ending March 2000 to year ending March 2021
Source: FIRE0102
Note: Non-fire incidents include non-fire false alarms
2. Fires attended
Primary fires are those that meet at least one of the following criteria - occurred in a (non-derelict) building, vehicle or outdoor structure or involved a fatality, casualty or rescue or were attended by five or more pumping appliances.
Secondary fires are generally small outdoor fires, not involving people or property.
Chimney fires are in (non-industrial) buildings where the flame was contained within the chimney structure.
Fire incidents are broadly categorised as primary, secondary or chimney fires depending on the location, severity and risk levels of the fire, and on the scale of response needed from FRSs to contain them.
Key results
In year ending March 2021:
-
FRSs attended 151,086 fires, a two per cent decrease compared with the previous year (154,180) and a 34 per cent decrease compared with ten years ago (228,412 in 2010/11) Source: FIRE0102
-
there were 61,912 primary fires, a ten per cent decrease compared with the previous year (68,771); three categories of primary fires (dwelling fires, other buildings fires and vehicle fires) showed decreases over this time, only outdoor primary fires, the smallest category of primary fire, showed an increase over this time Source: FIRE0102
-
FRSs attended 726 fires in purpose-built high-rise (10+ storeys) flats/maisonettes, a six per cent decrease compared with the previous year (775) and three per cent of the 27,021 dwelling fires attended Source: FIRE0205
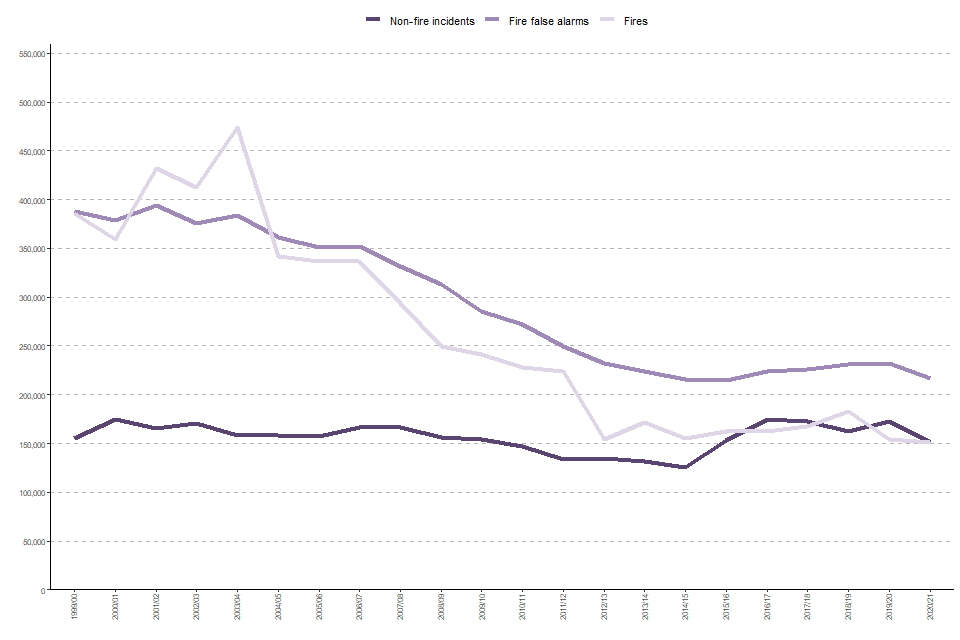
The long-term picture shows that the total number of fires attended by FRSs decreased for around a decade - falling by around two thirds from a peak of around 474,000 in year ending March 2004 to around 154,000 in year ending March 2013. The total number of fires has fluctuated since year ending March 2013 and although year ending March 2021 was the lowest figure recorded since comparable statistics became available in year ending March 1996, restrictions on life throughout year ending March 2021 in response to the COVID-19 pandemic was an element in this relatively low figure.
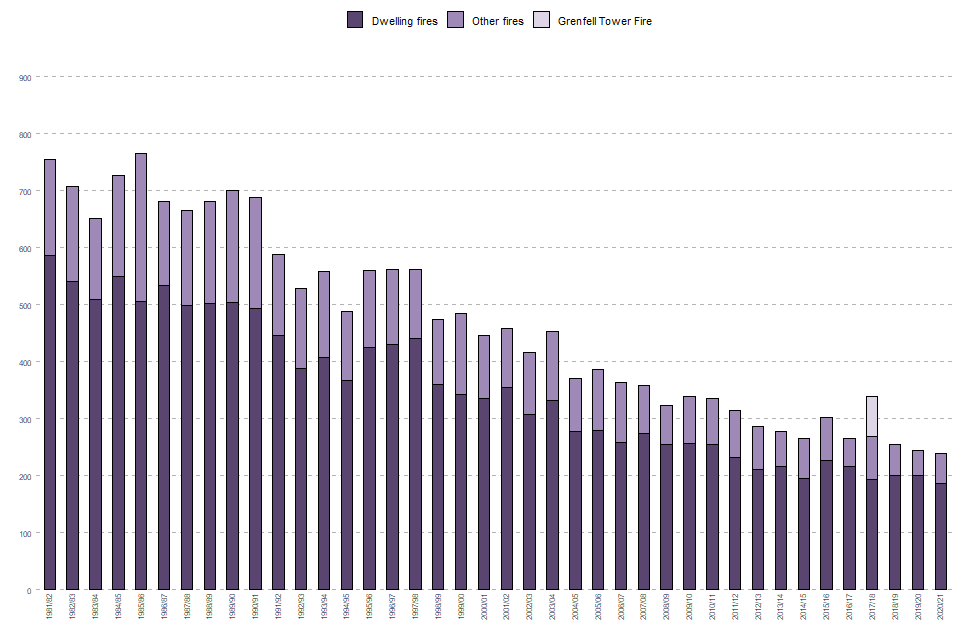
Figure 2.1 shows the long-term trend in fire incidents from year ending March 2000 to year ending March 2021, for primary (split into dwelling and other primary) and secondary plus chimney fires. The series high for secondary plus chimney fires occurred in year ending March 2004, which experienced an unusually hot and dry summer. This reflects the fact that the total number of fires attended in a single year can often be affected by external factors, particularly the weather. Weather is more likely to affect outdoor primary and secondary fires which make up a large share of all fires (over half in almost every year since these figures became available in year ending March 2000).
Figure 2.1: Total fires attended by type of fire, England; year ending March 2000 to year ending March 2021
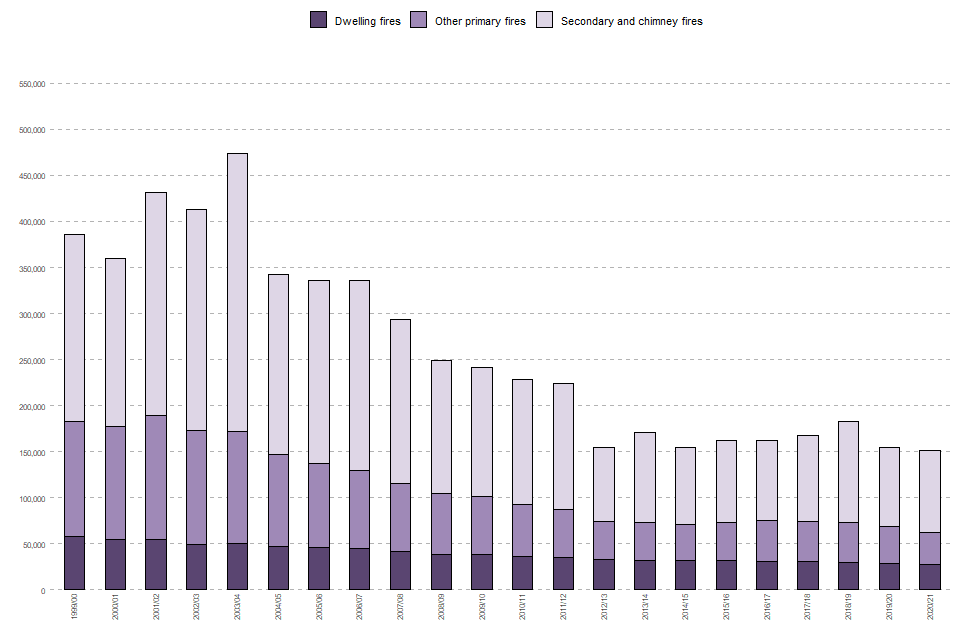
Source: FIRE0102
Primary fires
In year ending March 2021 there were 61,912 primary fires (41% of the 151,086 fires attended). This was a ten per cent decrease compared with the previous year (68,771), a 16 per cent decrease compared with five years ago (73,479) and a 33 per cent decrease compared with ten years ago (92,248).
Compared with the previous year, there were decreases of five per cent in dwelling fires, 17 per cent in other buildings fires and 15 per cent in road vehicle fires, and an increase of two per cent in other outdoor fires.
Of the 27,021 dwelling fires attended by FRSs, 74 per cent were in houses, bungalows, converted flats and other properties, whilst 26 per cent were in purpose-built flats or maisonettes.
When looking at fires in purpose-built flats or maisonettes in more detail, 17 per cent of dwelling fires were in purpose-built low-rise (1-3 storeys) flats or maisonettes; seven per cent were in purpose-built medium-rise (4-9 storeys) flats or maisonettes and three per cent were in purpose-built high-rise (10+ storeys) flats or maisonettes.
Fires attended under COVID-19 national lockdowns
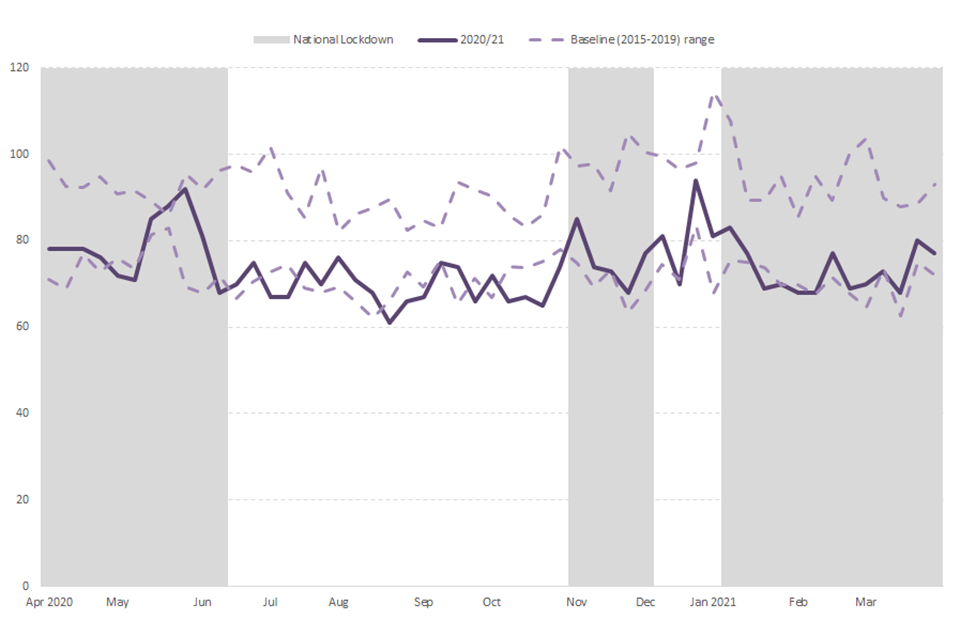
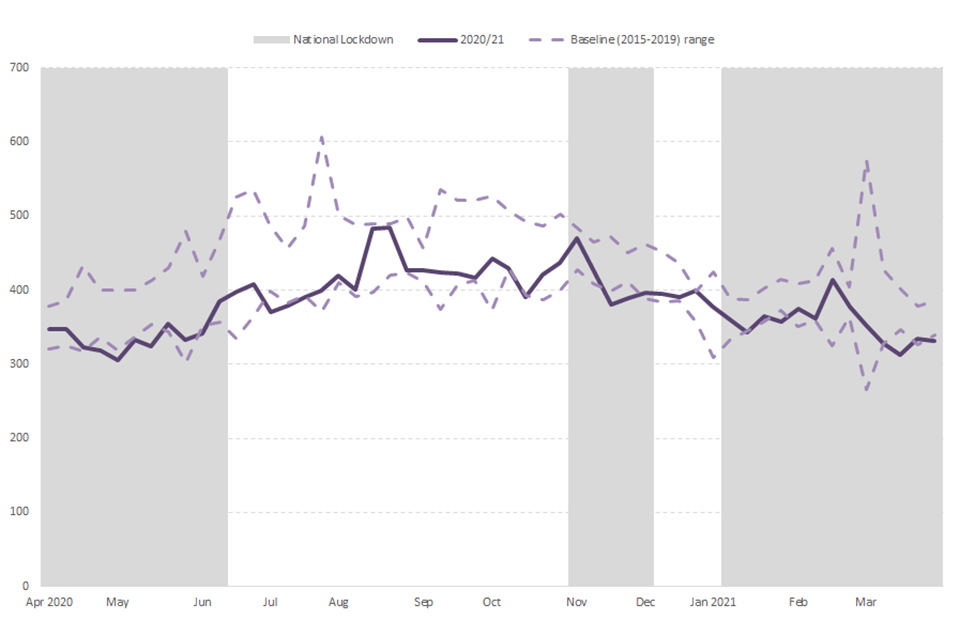
This section shows the average incident numbers per day of dwelling, other building and road vehicle fires by week in year ending March 2021 attended by FRSs compared against a baseline of the previous five years (year ending March 2016 to year ending March 2020). This analysis attempts to show if the three national lockdowns, various local lockdowns and restrictions on life throughout year ending March 2021 in response to the COVID-19 pandemic affected the number of these incidents attended by FRSs.
Weekly figures are highly susceptible to fluctuation and so an upper and lower range, using the mean and standard deviation of the year ending March 2016 to year ending March 2020 baseline figures, was calculated. Any figures beyond this range would fall outside of what would be expected, although these results could be explained by various factors such as the weather, school or bank holiday dates and not simply the restrictions on life throughout year ending March 2021. Whilst it is difficult to define exactly what constituted a “national lockdown” and when they started and finished, in this analysis we have used the dates when the majority of “non-essential retail” was closed.
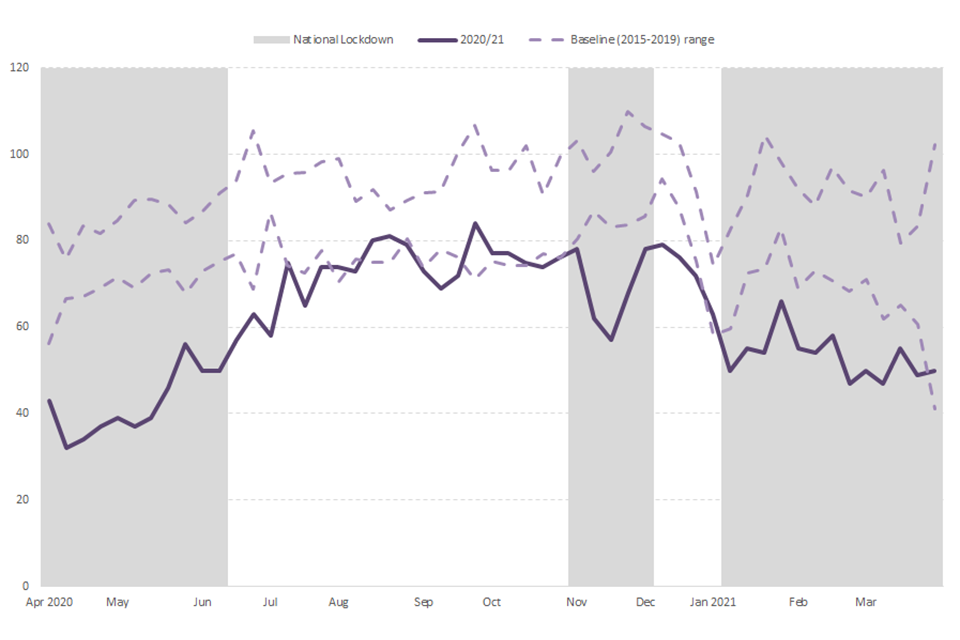
The number of dwellings fires attended by FRSs in year ending March 2021 was only occasionally out of the ordinary. 19 out of the 53 weeks captured by this analysis fell below the range of what would be expected (i.e. below the 2 dotted lines in Figure 2.2a) while 1 week was above the range. Even greater proportions of weeks were below the range during national lockdowns (20 out of 29 weeks shaded grey) and during the first national lockdown (8 out of 11 weeks in the first grey shaded area) when the restrictions were tighter. This supports, relatively weakly, suggestions that the restrictions on life throughout year ending March 2021 caused fewer dwelling fires. This could be because with people at home more, fires were prevented before a call to the FRS was necessary.
Figure 2.2a: Average number of dwelling fires per day, in year ending March 2021 by week
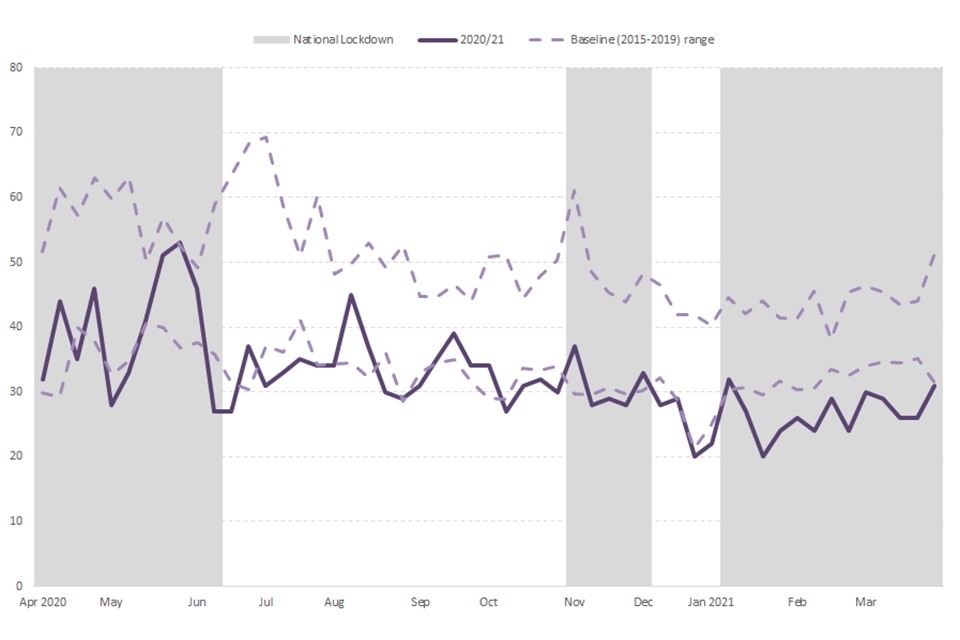
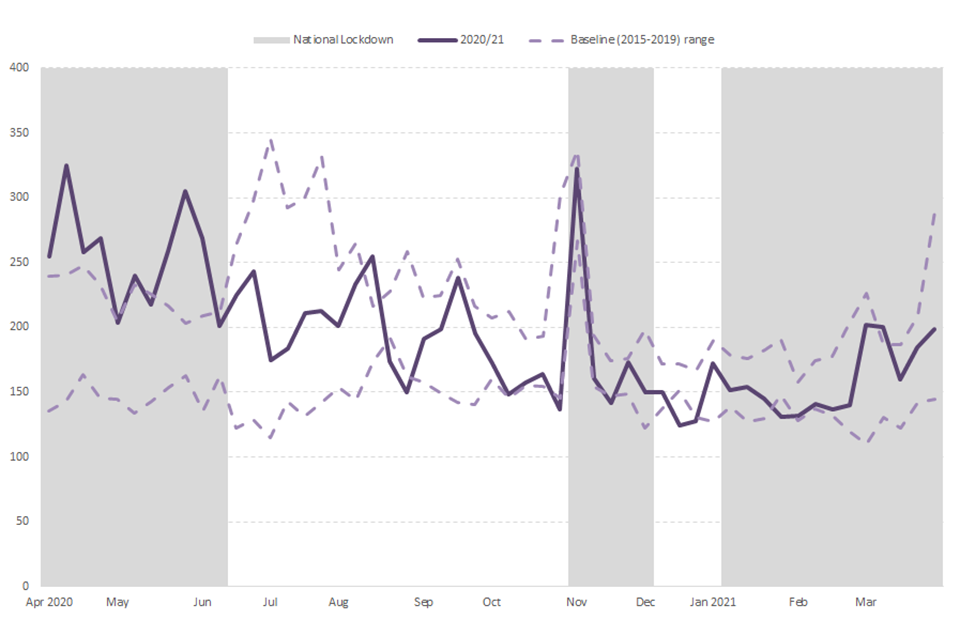
The number of other building fires attended by FRSs in year ending March 2021 was often out of the ordinary. 34 weeks out of the 53 weeks captured by this analysis fell below the range of what would be expected (i.e. below the 2 dotted lines in Figure 2.2b) while 1 week was above the range. All of the last 12 weeks of year ending March 2021 were below the range. This supports, relatively weakly, the suggestion that the restrictions on life throughout year ending March 2021 caused fewer fires in other buildings as many workplaces were closed or used less than usual.
Figure 2.2b: Average number of other building fires per day, in year ending March 2021 by week
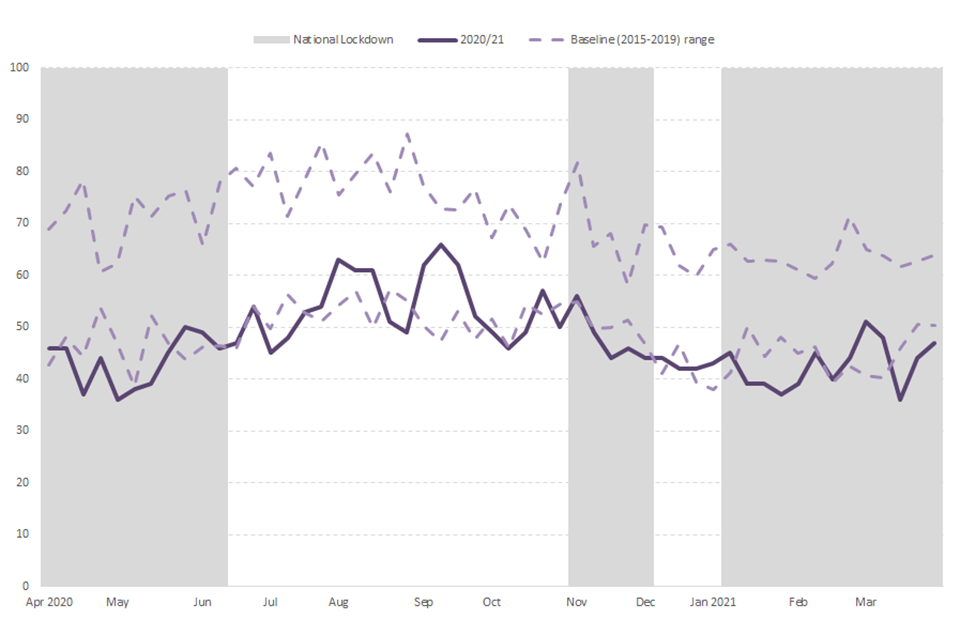
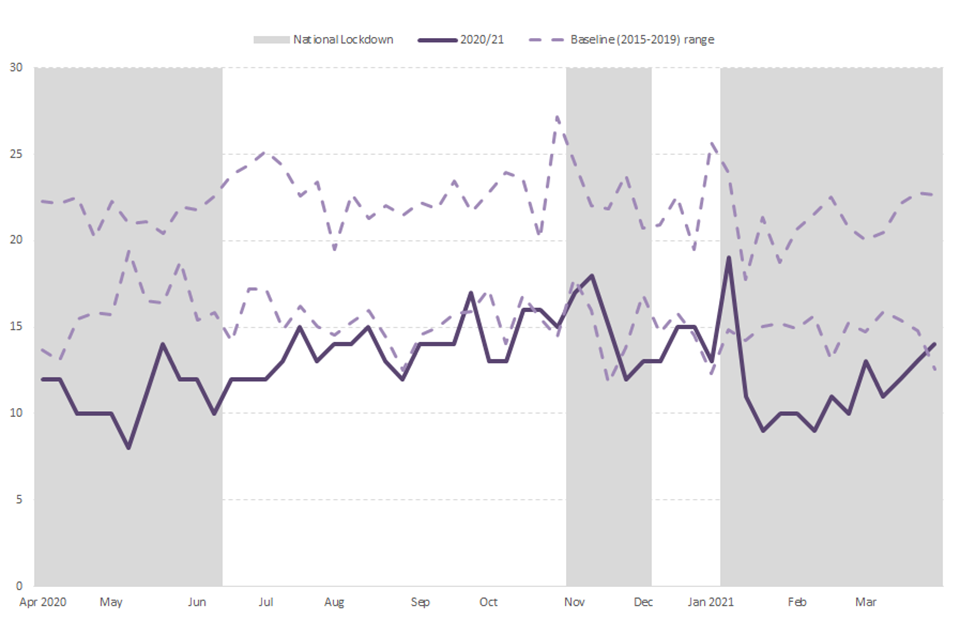
The number of road vehicle fires attended by FRSs in year ending March 2021 was often out of the ordinary. 29 weeks out of the 53 weeks captured by this analysis fell below the range of what would be expected (i.e. below the 2 dotted lines in Figure 2.2c) while no weeks were above the range. Even greater proportions of weeks were below the range during national lockdowns (20 out of 29 weeks shaded grey) and during the first national lockdown (8 out of 11 weeks in the first grey shaded area) when the restrictions were tighter. This supports the suggestion that the restrictions on life throughout year ending March 2021 caused fewer vehicle journeys and hence fewer road vehicle fires.
Figure 2.2c: Average number of road vehicle fires per day, in year ending March 2021 by week
The number of secondary fires and outdoor primary fires attended by FRSs in year ending March 2021 was rarely out of the ordinary during the lockdown. These types of incident are heavily affected by the weather and so any effect of the lockdowns would be minor in comparison.
In conclusion, in year ending March 2021 three types of primary fire (dwelling, other building and road vehicle fires) showed decreases compared with the previous year which may be explained by the restrictions on life throughout year ending March 2021 whilst outdoor primary and secondary fires showed increases (partly due to the weather).
3. Fire false alarms
Fire false alarms are where an FRS attends a location believing there to be a fire incident but, on arrival, discovers that no such incident exists or existed. They are broadly categorised by motive into ‘due to apparatus’, ‘good intent’ and ‘malicious’.
Due to apparatus calls are where a fire alarm or fire-fighting equipment operate (including accidental initiation by persons) in error.
Good intent calls are made in good faith in the belief that the FRS really would be attending a fire.
Malicious false alarms are made with the intention of getting the FRS to attend a non-existent incident.
Key results
In year ending March 2021:
- FRSs attended 216,149 fire false alarms, a seven per cent decrease compared with the previous year (231,630), a one per cent increase compared with five years ago (214,411) and a 21 per cent decrease compared with ten years ago (272,179) Source: FIRE0104
The number of fire false alarms attended by FRSs in England was on a general downward trajectory, from a peak of around 393,900 in year ending March 2002 to a low of around 214,400 in year ending March 2016. The number then climbed to around 231,000 in year ending March 2019, however in year ending March 2021 it decreased to around 216,100 (see Figure 3.1).
The proportion of total incidents that were fire false alarms in year ending March 2021 was 42 per cent. This proportion has been relatively stable over the past decade, varying between 40 and 44 per cent.
Figure 3.1: Total fire false alarms by type of false alarm, England; year ending March 2000 to year ending March 2021
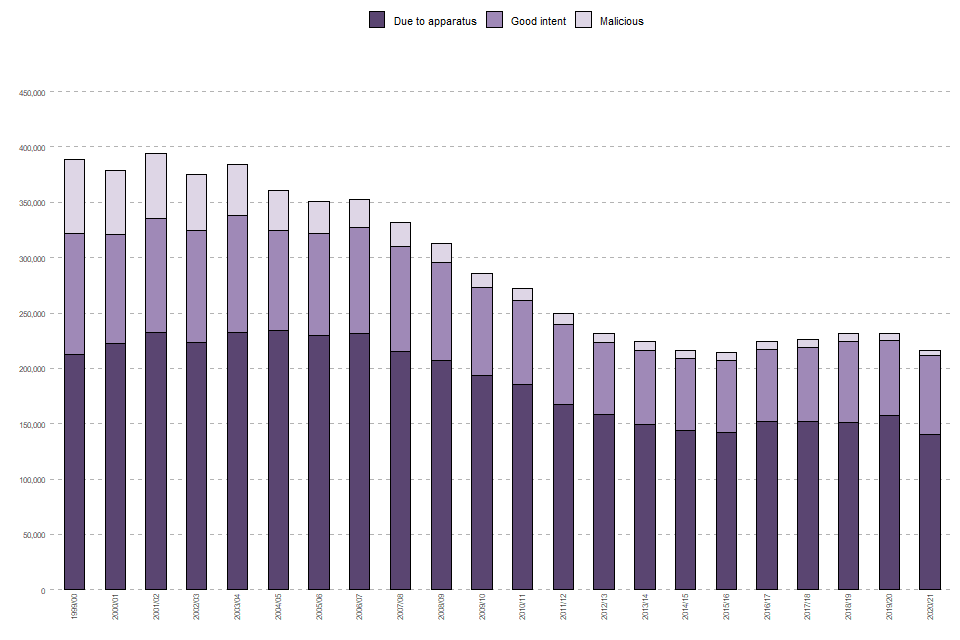
Source: FIRE0102
Fire false alarms are broadly categorised by motive into ‘due to apparatus’, ‘good intent’ and ‘malicious’. In year ending March 2021 there were:
-
140,148 fire false alarms due to apparatus: an 11 per cent decrease from the previous year (157,286), a two per cent decrease from five years previously (142,440) and a 24 per cent decrease from ten years previously (185,534)
-
71,186 fire false alarms due to good intent: a five per cent increase from the previous year (67,794), a nine per cent increase from five years previously (65,026) and a six per cent decrease from ten years previously (75,792)
-
4,815 malicious fire false alarms: a 26 per cent decrease from the previous year (6,550), a 31 per cent decrease from five years previously (6,945) and a 56 per cent decrease from ten years previously (10,853) Source: FIRE0104
Fire false alarms under COVID-19 national lockdowns
This section shows the average incident numbers per day of fire false alarms by week in year ending March 2021 attended by FRSs compared against a baseline of the previous five years (year ending March 2016 to year ending March 2020). This analysis attempts to show if the three national lockdowns, various local lockdowns and restrictions on life throughout year ending March 2021 in response to the COVID-19 pandemic affected the number of these incidents attended by FRSs. The analysis used the same method as in the fire section.
The number of due to apparatus fire false alarms attended by FRSs in year ending March 2021 was occasionally out of the ordinary. 16 weeks out of the 53 weeks captured by this analysis fell below the range of what would be expected (i.e. below the 2 dotted lines in Figure 3.2a) while no weeks were above the range. A greater proportion of weeks were below the range during the first national lockdown (5 out of 11 weeks in the first grey shaded area) when the restrictions were tighter. This supports, relatively weakly, the suggestions that the restrictions on life throughout year ending March 2021 caused fewer than expected due to apparatus fire false alarms. This could be because those buildings with alarm apparatus were less used than in other years.
Figure 3.2a: Average number of due to apparatus fire false alarms per day, in year ending March 2021 by week
The number of good intent false alarms attended by FRSs in year ending March 2021 was rarely out of the ordinary. 7 weeks out of the 53 weeks captured by this analysis fell below the range of what would be expected while 10 weeks were above the range. Interestingly 8 of the 10 above the range occurred in the first national lockdown.
Figure 3.2b: Average number of good intent fire false alarms per day, in year ending March 2021 by week
The number of malicious fire false alarms attended by FRSs in year ending March 2021 was often out of the ordinary. 44 weeks out of the 53 weeks captured by this analysis fell below the range of what would be expected (i.e. below the 2 dotted lines in Figure 3.2c) while no weeks were above the range. All of the weeks in the first national lockdown (the first grey shaded area) were below the range. This supports the suggestion that the restrictions on life throughout year ending March 2021 caused fewer than expected malicious fire false alarms, perhaps because those inclined to make malicious calls were restricted in their movements in year ending March 2021.
Figure 3.2c: Average number of malicious fire false alarms per day, in year ending March 2021 by week
In conclusion, in year ending March 2021 two types of fire false alarm (malicious and, the larger, due to apparatus) showed decreases compared with the previous year which may be explained by the restrictions on life throughout year ending March 2021 whilst good intent showed an increase which may be explained by more people at home being ‘good samaritans’.
4. Non-fire incidents attended
FRSs attend many types of incident that are not fires or fire false alarms. These are known as non-fire incidents or special service incidents. Examples include flooding incidents, responding to road traffic collisions, animal assistance and collaboration incidents such as effecting entry or exit and assisting other agencies (a complete list can be found in fire data table FIRE0902).
Key results
In year ending March 2021:
-
FRSs attended 151,028 non-fire incidents, a 12 per cent decrease compared with the previous year (172,203) and a one per cent decrease compared with five years ago (152,987) (Source: FIRE0901)
-
FRSs attended 46,353 collaborating incidents[footnote 1]; this was a one per cent decrease compared with the previous year (46,679) (Source: FIRE0901)
-
FRSs attended 22,522 road traffic collisions; this was a 28 per cent decrease compared with the previous year (31,106) caused in part by April to June 2020 being the lowest quarterly figure since before this detailed breakdown was first collected consistently in 2010, and probably due to the first COVID-19 national lockdown covering much of this time period and the subsequently reduced traffic on the roads (Source: FIRE0901)
-
FRSs attended 13,843 medical incidents [footnote 2]; this was a 25 per cent decrease compared with the previous year (18,347); medical incidents have been on a downward trend in recent years (Source: FIRE0901)
There was a general decline in the number of non-fire incidents attended between year ending March 2008 and year ending March 2015 (Figure 4.1). This was followed by a large increase of almost two-fifths to year ending March 2017 coinciding with the introduction, in 2015, of the National Joint Council (NJC) supported trials of emergency medical responding (EMR) where FRSs formed agreements with ambulance trusts to undertake health and care related work, in particular, co-responding. Following the withdrawal of the Fire Brigades Union (FBU) support in September 2017, the number of these incidents has decreased to a level slightly higher than before the trials and the total number of non-fire incidents has been broadly stable.
Between year ending March 2015 and year ending March 2020 the number of collaborating incidents attended has more than doubled (from 21,145 to 46,749). The increases coincide with the duty to collaborate legislation, whereby each emergency service “must keep under consideration whether entering into a collaboration agreement with one or more other relevant emergency services in England could be in the interests of the efficiency or effectiveness of that service and those other services.” The number then decreased by one per cent (to 46,353) in year ending March 2021.
Figure 4.1: Total non-fire incidents attended by FRSs, England; year ending March 2000 to year ending March 2021
Source: FIRE0901
In year ending March 2021 FRSs attended 151,028 non-fire incidents. This was a 12 per cent decrease compared with the previous year (172,203) and was the result of distinct changes in the largest categories of non-fire incidents, as shown in Table 4.1.
Table 4.1: The five largest categories of non-fire incidents attended by FRSs in England; year ending March 2020 and year ending March 2021
| Non-fire incident type | 2019/20 | 2020/21 | % change |
|---|---|---|---|
| Total non-fire incidents | 172,203 | 151,028 | -12% |
| Road traffic collisions | 31,106 | 22,522 | -28% |
| Effecting entry/exit | 26,363 | 24,241 | -8% |
| Assisting other agencies | 18,275 | 20,017 | +10% |
| Medical incidents | 18,347 | 13,843 | -25% |
| Flooding incidents | 15,542 | 14,921 | -4% |
Source: FIRE0901
Non-fire incidents under COVID-19 national lockdowns
This section shows the average incident numbers per day of non-fire incidents by week in year ending March 2021 attended by FRSs compared against a baseline of the previous five years (year ending March 2016 to year ending March 2020). This analysis attempts to show if the three national lockdowns, various local lockdowns and restrictions on life throughout year ending March 2021 in response to the COVID-19 pandemic affected the number of these incidents attended by FRSs. The analysis used the same method as in the fire section.
In year ending March 2021, there was a general decrease in many of the wide range of different incident types, however many were difficult to analyse as they have been very variable over the previous five years causing large ranges (i.e. large gaps between the 2 dotted lines). The largest decrease since year ending March 2020 in non-fire incident types was in road traffic collisions, which decreased by 8,584.
The number of road traffic collisions attended by FRSs in year ending March 2021 was often out of the ordinary. 43 weeks out of the 53 weeks captured by this analysis fell below the range of what would be expected (i.e. below the 2 dotted lines in Figure 4.2a) while no weeks were above the range. Even greater proportions of weeks were below the range during national lockdowns (28 out of 29 weeks shaded grey) and during the first national lockdown (all 11 weeks in the first grey shaded area) when the restrictions were tighter. This supports the suggestion that the restrictions on life throughout year ending March 2021 caused fewer vehicle journeys and hence fewer road traffic collisions.
Figure 4.2: Average number of road traffic collisions per day, in year ending March 2021 by week
In conclusion, in year ending March 2021 road traffic collisions showed a decrease compared with the previous year which may be explained by the restrictions on life throughout year ending March 2021. Other significant non-fire incident types have been very variable over the previous five years causing large ranges, making it impossible to draw similar conclusions.
5. Fire-related fatalities and casualties
Fire-related fatalities are those that would not have otherwise occurred had there not been a fire. For the purpose of publications, a fire-related fatality includes those that were recorded as ‘don’t know’.
Non-fatal casualties are those resulting from a fire, whether the injury was caused by the fire or not.
As the Incident Recording System (IRS) is a continually updated database, the statistics published in this release may not match those held locally by FRSs, and revisions may occur in the future (see the revisions section for further detail). This may be particularly relevant for fire-related fatalities, where a coroner’s report could lead to revisions in the data some time after the incident. It should also be noted that the numbers of fire-related fatalities are prone to year-on-year fluctuations due to relatively low numbers.
Key results
In year ending March 2021:
-
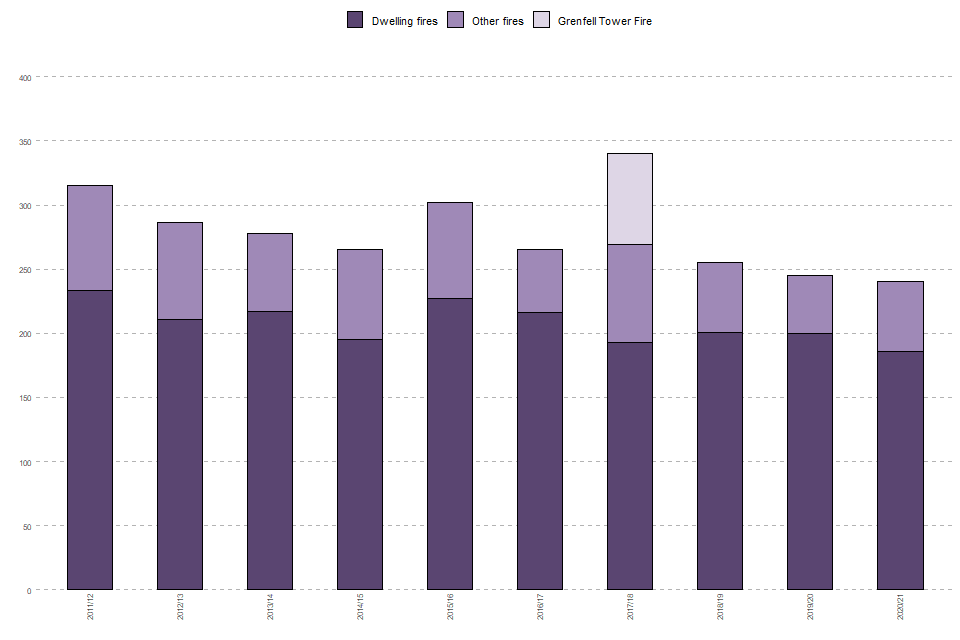
there were 240 fire-related fatalities (see Figure 5.1) compared with 245 in the previous year (a decrease of 2%), the lowest financial year figure since comparable data became available in year ending March 1982 and the number of fatalities has been at historically low levels in recent years (Source: FIRE0502)
-
there were 186 fire-related fatalities in dwelling fires, compared with 200 in the previous year (a decrease of 7%)
-
there were 6,347 non-fatal casualties [footnote 3] , an eight per cent decrease compared with 6,933 in the previous year, this includes 2,603 casualties requiring hospital treatment, a 13 per cent decrease compared with the 2,977 in the previous year (Source: FIRE0502)
Fire-related fatalities
The number of fire-related fatalities in England was on a general downward trend from year ending March 1982, when comparable figures first became available. Though the numbers have fluctuated due to the relatively small numbers involved, in recent years the number of fatalities has decreased. There was an exceptionally high figure in year ending March 2018 (Figure 5.1) due to the Grenfell Tower fire [footnote 4] .
The 240 fire-related fatalities in year ending March 2021 was the lowest annual figure since data became available in year ending March 1982. Of these 240 fatalities, over three quarters (186) were in dwelling fires whilst the remaining 54 were in other building fires (14), road vehicle fires (28) and other outdoor fires (12). It should also be noted that the numbers of fire-related fatalities are prone to year-on-year fluctuations due to relatively low numbers.
A very small proportion of fires resulted in a fire-related fatality: 225 out of the 61,912 primary fires (0.36%). This proportion is virtually unchanged compared with the previous year, when there were 234 fires with a fire-related fatality out of the 68,771 primary fires (0.34%).
There were 33 fire-related fatalities in purpose-built low rise (1 to 3 storeys) flats or maisonettes, from 33 fires out of the total of 4,494 fires in this dwelling type. There were 31 such fires in the previous year causing 32 fire-related fatalities.
There were eight fire-related fatalities in purpose-built medium rise (4 to 9 storeys) flats or maisonettes in year ending March 2021, from eight fires out of the total of 1,814 fires in this dwelling type. There were four such fires in the previous year causing four fire-related fatalities.
There were six fire-related fatalities in purpose-built high-rise (10+ storeys) flats or maisonettes in year ending March 2021, from four fires out of the total of 726 fires in this dwelling type. There were five such fires in the previous year causing five fire-related fatalities.
Figure 5.1: Total fire-related fatalities, England; year ending March 1982 to year ending March 2021
Source: FIRE0502
Note: Fire-related fatalities are those that would not have otherwise occurred had there not been a fire, those where the role of fire in the fatality was “not known” are included in “fire-related”.
Non-fatal casualties
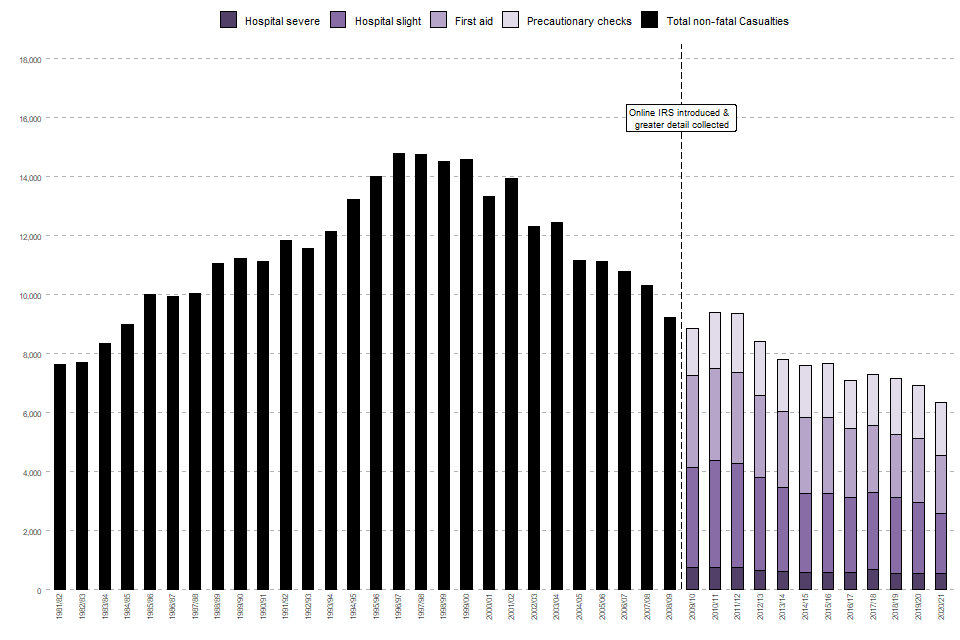
The number of non-fatal casualties in fires in England has been on a downward trend since the mid-1990s. More detailed data became available due to the introduction of the online IRS in 2009 and since then the “hospital slight” and “first aid” categories have shown the biggest decline.
Year ending March 2021 had the lowest number of non-fatal casualties (6,347) since year ending March 1982. There were decreases across three categories compared with the previous year: hospital severe (down 1%), hospital slight (down 15%) and first aid (down 10%) - precautionary checks were virtually unchanged. It should be noted that casualties recorded as hospital severe have remained low but fluctuate from year to year. (Figure 5.2)
Figure 5.2: Total non-fatal casualties in fires by injury severity, England; year ending March 1982 to year ending March 2021
Source: FIRE0502
Notes: These figures are for all casualties in fires, whether the fire caused the casualty or not.
6. Response Times
Total response time is the minutes and seconds elapsed from the time of call to the arrival of the first vehicle to the incident.
The following incidents are not included in response time totals.
a. Road vehicle fires, where the road vehicle was abandoned.
b. Where the location of the fire was a derelict property.
c. Where an FRS learned of the fire when it was known to have already been extinguished (known as “late calls”).
d. Where the total response time for an incident was over an hour or less than one minute (to avoid erroneous data or exceptional incidents from skewing the averages)
e. Where the sequence of events (time of call - mobilisation - vehicle mobile - arrival at scene) in an incident are not recorded in a logical sequence, either through recording error (e.g.a vehicle appears to have arrived before it left) or absence of data (null values).
Headline findings on response times are included in Fire and Rescue Incident Statistics for the first time in response to user requests. Table FIRE1001 is published alongside this release and shows greater detail than this commentary, for example breakdowns by fire and rescue service and by time components. Full commentary and further tables will be published in Winter year ending March 2022 in Detailed Analysis of Fire Response Times
Key results
In year ending March 2021:
-
the average total response time to primary fires[footnote 5] in England was 8 minutes and 35 seconds: a decrease of eight seconds since the previous year and of five seconds from five years previously (Source: FIRE1001)
-
three types of primary fires showed a decrease in average response times (dwellings by ten seconds, other buildings by one second and road vehicles by 13 seconds), while other outdoor primary fires (by far the smallest category of primary fire) increased by 2 seconds
-
average total response time to secondary fires[footnote 6] (which can broadly be thought of as smaller outdoor fires, not involving people or property) in England increased by five seconds to 9 minutes 23 seconds compared with year ending March 2020
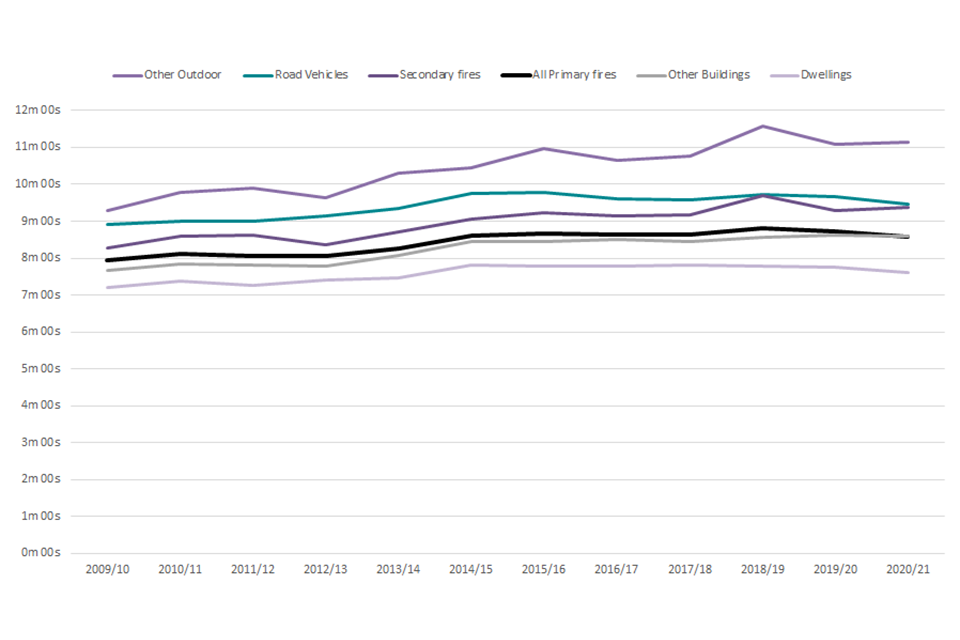
Overall, response times to fires increased gradually between year ending March 1995 and year ending March 2015, since when there’s been a general plateau. The average total response time to primary fires in year ending March 2021 was 8 minutes and 35 seconds, an increase of 28 seconds over the past decade but a decrease of five seconds in the past five years - the pattern across different types of fire was varied (see Figure 6.1).
The average response time to dwelling fires in year ending March 2021 was 7 minutes 36 seconds. Of these, the average response time to fires in flats was 6 minutes 52 seconds, compared with 8 minutes 3 seconds for houses or bungalows and 7 minutes 34 seconds for other dwellings. This probably reflects that most flats are in urban locations and therefore generally within closer proximity to a fire station than rural dwellings.
The average response time to other building fires in year ending March 2021 was 8 minutes 36 seconds. Of these, the average response time to fires in other residential buildings (such as student halls of residence, nursing or care homes and hotels) was 8 minutes 1 second, compared with 8 minutes 40 seconds for non-residential buildings. This could reflect local prioritisation and the greater risk to lives.
The average response time to road vehicle fires in year ending March 2021 was 9 minutes 27 seconds. After the response times increased between year ending March 2010 and year ending March 2015 they have plateaued since.
The average response time to outdoor primary fires (11 minutes 8 seconds) and secondary fires (9 minutes 23 seconds) both increased in the last year (by 2 and 5 seconds respectively). Over the past ten years these two measures have gradually increased, although as both are influenced by the weather, they are prone to fluctuations. It should be noted that other outdoor fires are numerically the smallest of the main primary fire types and so are more prone to larger fluctuations (of both increases and decreases) as can be seen throughout the time series (see Figure 6.1).
Figure 6.1: Average total response times (minutes) by type of fire, England; year ending March 2010 to year ending March 2021
Source: FIRE1001
7. Summary of changes over time
Table 7.1: Number of incidents, comparing year ending March 2021 with one, five and ten years previously
| Incident type | 2020/21 | 2019/20 | change | 2015/16 | change | 2010/11 | change |
|---|---|---|---|---|---|---|---|
| All incidents | 518,263 | 558,013 | -7% | 529,674 | -2% | 647,362 | -20% |
| Fires | 151,086 | 154,180 | -2% | 162,276 | -7% | 228,412 | -34% |
| Primary fires | 61,912 | 68,771 | -10% | 73,479 | -16% | 92,248 | -33% |
| Dwelling fires | 27,021 | 28,499 | -5% | 31,376 | -14% | 36,611 | -26% |
| Accidental dwelling fires | 24,296 | 25,528 | -5% | 28,360 | -14% | 31,718 | -23% |
| Secondary fires | 86,069 | 82,265 | +5% | 84,590 | +2% | 128,478 | -33% |
| Fire false alarms | 216,149 | 231,630 | -7% | 214,411 | +1% | 272,179 | -21% |
| Non-fire incidents | 151,028 | 172,203 | -12% | 152,987 | -1% | 146,771 | +3% |
Table 7.2: Number of fire-related fatalities and non-fatal casualties, comparing year ending March 2021 with one, five and ten years previously
| Fatalities and non-fatal casualties | 2020/21 | 2019/20 | change | 2015/16 | change | 2010/11 | change |
|---|---|---|---|---|---|---|---|
| Fire-related fatalities | 240 | 245 | -2% | 302 | -21% | 335 | -28% |
| Fire-related fatalities in dwellings | 186 | 200 | -7% | 227 | -18% | 255 | -27% |
| Non-fatal casualties | 6,347 | 6,933 | -8% | 7,672 | -17% | 9,397 | -32% |
| Non-fatal casualties requiring hospital treatment | 2,603 | 2,977 | -13% | 3,279 | -21% | 4,371 | -40% |
| Non-fatal casualties in dwellings | 4,877 | 5,154 | -5% | 5,771 | -15% | 7,498 | -35% |
Table 7.3: Average response times, comparing year ending March 2021 with one, five and ten years previously
| Fire type | 2020/21 | 2019/20 | change | 2015/16 | change | 2010/11 | change |
|---|---|---|---|---|---|---|---|
| Primary fires | 8m 35s | 8m 43s | -8s | 8m 40s | -5s | 8m 7s | +28s |
| Dwellings | 7m 36s | 7m 46s | -10s | 7m 47s | -11s | 7m 23s | +13s |
| Other buildings | 8m 36s | 8m 37s | -1s | 8m 26s | +10s | 7m 51s | +45s |
| Road vehicles | 9m 27s | 9m 40s | -13s | 9m 48s | -21s | 9m 0s | +27s |
| Other outdoors | 11m 8s | 11m 6s | +2s | 10m 58s | +10s | 9m 46s | +1m 22s |
| Secondary fires | 9m 23s | 9m 18s | +5s | 9m 15s | +8s | 8m 35s | +48s |
Source: Fire statistics data tables
8. Further information
This release contains statistics about incidents attended by fire and rescue services (FRSs) in England. The statistics are sourced from the Home Office’s online Incident Recording System (IRS). This system allows FRSs to complete an incident form for every incident attended, be it a fire, a false alarm or a non-fire incident (also known as a Special Service incident). The online IRS was introduced in April 2009. Previously, paper forms were submitted by FRSs and an element of sampling was involved in the data compilation process.
Fire and Rescue Incident Statistics and other Home Office statistical releases are available via the Statistics at Home Office pages on the GOV.UK website.
Data tables linked to this release and all other fire statistics releases can be found on the Home Office’s Fire statistics data tables page.
Guidance for using these statistics and other fire statistics outputs, including a Quality Report, is available on the fire statistics guidance page.
The information published in this release is kept under review, taking into account the needs of users and burdens on suppliers and producers, in line with the Code of Practice for Statistics. The Office for Statistics Regulation recently carried out a compliance check of the Home Office’s fire and rescue incident statistics against the Code of Practice and the results can be found in a letter to the Home Office’s Head of Profession published on the OSR website.
If you have any comments, suggestions or enquiries, please contact the team via email using firestatistics@homeoffice.gov.uk or via the user feedback form on the fire statistics collection page.
Revisions
The IRS is a continually updated database, with FRSs adding incidents daily. The figures in this release refer to records of incidents that occurred up to and including 31 March 2021. This includes incident records that were submitted to the IRS by 17 June 2021, when a snapshot of the database was taken for the purpose of analysis. As a snapshot of the dataset was taken on 17 June 2021, the statistics published may not match those held locally by FRSs and revisions may occur in the future. This is particularly the case for statistics with relatively small numbers, such as fire-related fatalities. For instance, this can occur because coroner’s reports may mean the initial view taken by the FRS will need to be revised; this can take many months, even years, to do so.
COVID-19 and the impact on the IRS
The figures presented in this release relate to incidents attended by FRSs during year ending March 2021. In response to the coronavirus pandemic, restrictions in England, Scotland and Wales started from 12 March 2020. In England, during year ending March 2021, three lockdowns which applied strict limits on daily life were imposed. A first lockdown was applied on 23 March 2020 (i.e. slightly before the start of year ending March 2021) and was eased from 15 June 2020, a second lockdown began on 5 November 2020 and ended on 2 December 2020 and the third began on 4 January 2021 and ended on 12 April 2021 (i.e. after the end of year ending March 2021). The restrictions and lockdowns are therefore captured in IRS data for year ending March 2021.
Extra analysis on fire and rescue incidents can be found in this release. This analysis shows the average incident numbers per day for various incident types by week attended by FRSs under the lockdown compared against a baseline of the previous five years (year ending March 2016 to year ending March 2020). The charts are presented as “average number of … per day” for each week in the financial year because 365 and 366 do not divide into 52 perfect weeks and hence the 1st and 53rd “weeks” can be shorter than 7 days. To ensure the analysis is fair weeks are divided by the appropriate number of days (usually but not always 7). Weekly figures are highly susceptible to fluctuation and so an upper and lower range, using the mean and standard deviation of the year ending March 2016 to year ending March 2000 baseline figures, was calculated. Any figures beyond this range would fall outside of what would be expected, although these results could be explained by various factors such as the weather, school or bank holiday dates and not simply the COVID related lockdowns and restrictions. This updates analysis published in Fire and rescue incident statistics, England, year ending June 2020 and Detailed analysis of non-fire incidents: England, April 2019 to March 2020.
We plan to publish more detailed analysis on the effects of COVID-19 lockdowns in Detailed Analysis of Fires and Detailed Analysis of Response Times.
Other related publications
Home Office publish five other statistical releases covering fire and rescue services:
-
Detailed analysis of fires attended by fire and rescue services in England: focuses on fires attended by fire and rescue services across England, fire-related fatalities and non-fatal casualties in those fires; including analyses of the causes of fires and smoke alarms ownership and operation
-
Detailed analysis of non-fire incidents attended by fire and rescue services, England: focuses on non-fire incidents attended by fire and rescue services across England, including analysis on overall trends, fatalities and non-fatal casualties in non-fire incidents, and further detailed analysis of different categories of non-fire incidents
-
Fire and rescue workforce and pensions statistics: focuses on total workforce numbers, workforce diversity and information regarding leavers and joiners; covers both pension fund income and expenditure and firefighters’ pension schemes membership; and includes information on incidents involving attacks on firefighters
-
Fire prevention and protection statistics, England: focuses on trends in smoke alarm ownership, fire prevention and protection activities by fire and rescue services
-
Response times to fires attended by fire and rescue services, England: covers statistics on trends in average response times to fires attended by fire and rescue services
The Ministry of Housing, Communities & Local Government also publish statistical releases on fire:
-
English housing survey: fire and fire safety report focuses on the extent to which the existence of fire and fire safety features vary by household and dwelling type
-
English housing survey: feeling safe from fire report focuses on whether people felt safe from fire in their homes by household and dwelling type
Fire statistics are published by the other UK nations:
Scottish fire statistics and Welsh fire statistics are published based on the IRS. Fire statistics for Northern Ireland are published by the Northern Ireland Fire and Rescue Service using data from a system similar to the Incident Recording System, which means that they are not directly comparable to English, Welsh and Scottish data.
National Statistics
These statistics have been assessed by the UK Statistics Authority to ensure that they continue to meet the standards required to be designated as National Statistics. This statistical bulletin is produced to the highest professional standards and is free from political interference. It has been produced by statisticians working in accordance with the Home Office’s Statement of compliance with the Code of Practice for Official Statistics, which covers Home Office policy on revisions and other matters. The Chief Statistician, as Head of Profession, reports to the National Statistician with respect to all professional statistical matters and oversees all Home Office National Statistics products with respect to the Code, being responsible for their timing, content and methodology. This means that these statistics meet the highest standards of trustworthiness, impartiality, quality and public value, and are fully compliant with the Code of Practice for Statistics.
-
Collaborating incidents include “Assisting other agencies”, “Effecting entry or exit” and “Suicide or attempts”. ↩
-
Medical incidents include “First responder” and “Co-responder” incidents. ↩
-
For more detailed technical definitions of fire-related and non-fatal casualties, see the Fire Statistics Definitions document. A further breakdown of the different types of non-fatal casualties is available in the published fire data tables. ↩
-
For more information on the Grenfell Tower fire and how the associated fire-related fatalities figures are recorded, see the Fire Statistics Definitions document. ↩
-
Primary fires are those that meet at least one of the following criteria - occurred in a (non-derelict) building, vehicle or outdoor structure or involved a fatality, casualty or rescue or were attended by five or more pumping appliances. ↩
-
Secondary fires are generally small outdoor fires, not involving people or property. ↩