Fire and rescue incident statistics, England, year ending December 2020
Published 13 May 2021
Applies to England

© Crown copyright 2021
This publication is licensed under the terms of the Open Government Licence v3.0 except where otherwise stated. To view this licence, visit nationalarchives.gov.uk/doc/open-government-licence/version/3 or write to the Information Policy Team, The National Archives, Kew, London TW9 4DU, or email: psi@nationalarchives.gov.uk.
Where we have identified any third party copyright information you will need to obtain permission from the copyright holders concerned.
This publication is available at https://www.gov.uk/government/statistics/fire-and-rescue-incident-statistics-england-year-ending-december-2020/fire-and-rescue-incident-statistics-england-year-ending-december-2020
Frequency of release: Quarterly
Forthcoming releases: Home Office statistics release calendar
Home Office responsible statistician: Deborah Lader
Press enquiries: pressoffice@homeoffice.gov.uk
Telephone: 0300 123 3535
Public enquiries: firestatistics@homeoffice.gov.uk
This release contains statistics about incidents attended by fire and rescue services (FRSs) in England for the year ending December 2020. The statistics are sourced from the Home Office’s online Incident Recording System (IRS) and include statistics on all incidents, fire-related fatalities and casualties from fires, with long term comparisons.
Key results
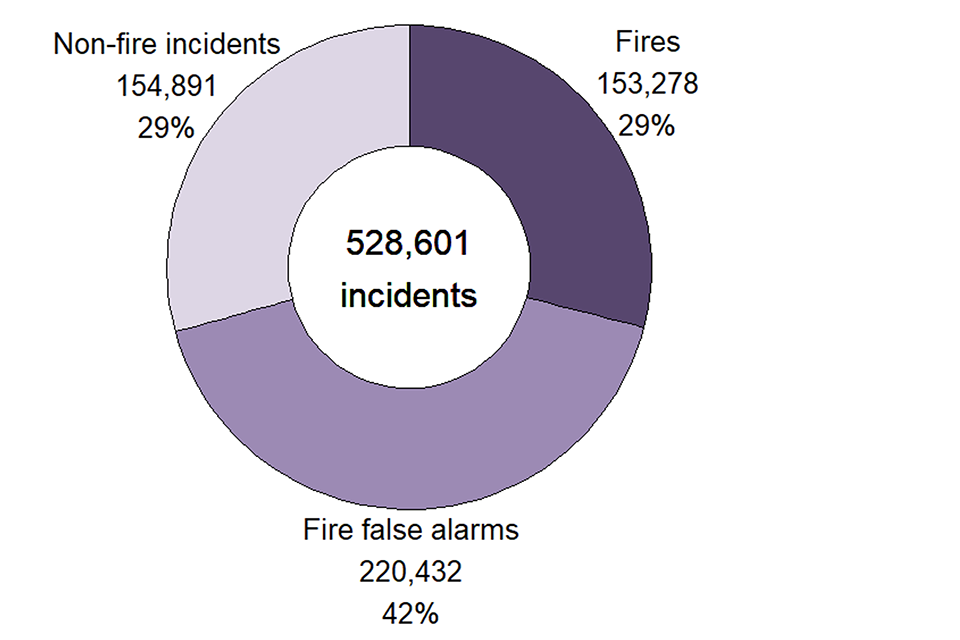
FRSs attended 528,601 incidents in the year ending December 2020. This was a five per cent decrease compared with the previous year (557,073). Of these incidents, there were 153,278 fires. This was a three per cent decrease compared with the previous year (157,563).
There were 221 fire-related fatalities in the year ending December 2020 compared with 248 in the previous year.
1. Incident summary
Incidents that FRSs attend are categorised into three main types - fires attended, non-fire incidents and fire false alarms.
Key results
In the year ending December 2020:
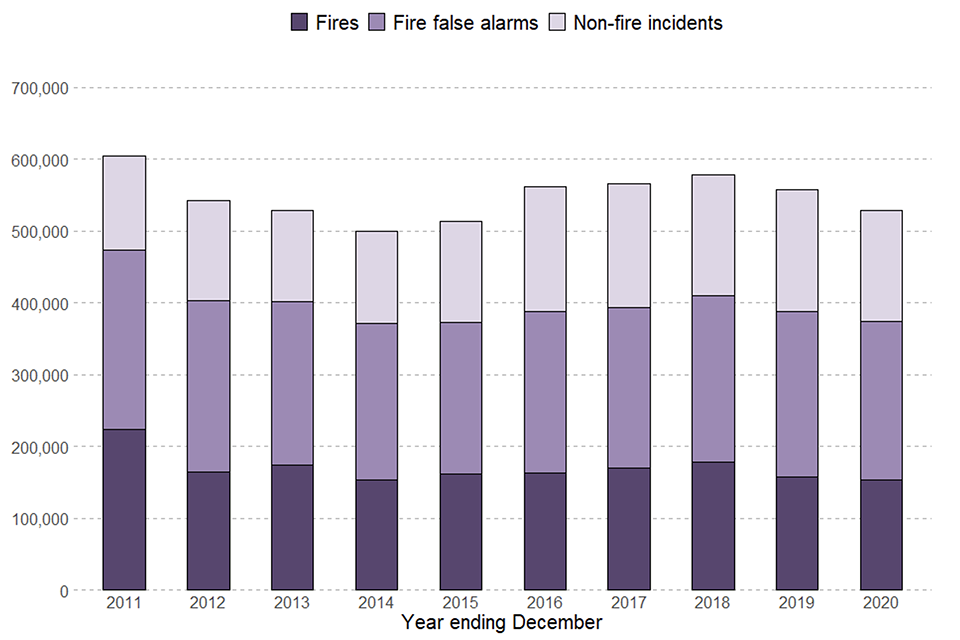
- 528,601 incidents were attended by FRSs; this was a five per cent decrease compared with the previous year (557,073), a seven per cent increase compared with five years ago (496,273) and a 22 per cent decrease compared with ten years ago (680,634); the decrease this year compared with last year was driven by decreases in all three main incident types (fires, non-fire incidents and fire false alarms) (Source: FIRE0102)
- of all incidents attended by FRSs, fires accounted for 29 per cent, fire false alarms 42 per cent and non-fire incidents 29 per cent; this compares with fires accounting for 35 per cent, fire false alarms 42 per cent and non-fire incidents 23 per cent ten years ago (Source: FIRE0102)
The number of incidents attended by FRSs in England peaked in 2003/04, at over one million incidents. For around a decade, there was a general decline in all three categories of incidents attended and between year ending March 2013 and year ending March 2016 there were around half a million a year. Since year ending March 2016 this number rose to around 577,000 incidents in year ending March 2019 then fell to around 529,000 in the year ending December 2020.
In contrast to the earlier decreases (caused by a reduction in fire and fire false alarm incidents), the increase in total incidents between year ending March 2015 and year ending March 2019 was driven by increases in fires and non-fire incidents; and the increase in non-fire incidents over this time was mainly due to the changes in the number of medical incidents and collaboration incidents attended, which are discussed in Section 4. This year’s decrease compared with the year ending December 2019 was partly driven by decreases in primary fires as well as decreases in non-fire incidents and fire false alarms. It should also be noted that the year ending December 2020 includes two national lockdowns and various local lockdowns which applied strict limits on daily life (for more information see the ‘COVID-19 and the impact on the IRS’ section).
Figure 1.1: Total incidents attended by incident type, England; year ending December 2020
Source: FIRE0102
Notes: Non-fire incidents include non-fire false alarms
2. Fires attended
Fire incidents are broadly categorised as primary, secondary or chimney fires depending on the location, severity and risk levels of the fire, and on the scale of response needed from FRSs to contain them.
Primary fires are those that meet at least one of the following criteria – occurred in a (non-derelict) building, vehicle or outdoor structure or involved a fatality, casualty or rescue or were attended by five or more pumping appliances.
Secondary fires are generally small outdoor fires, not involving people or property.
Chimney fires are in (non-industrial) buildings where the flame was contained within the chimney structure.
Key results
In the year ending December 2020:
- FRSs attended 153,278 fires, a three per cent decrease compared with the previous year (157,563) and a 37 per cent decrease compared with ten years ago (241,462 in 2009/10) (Source: FIRE0102)
- there were 64,066 primary fires, a seven per cent decrease compared with the previous year (69,184); most categories of primary fires (dwelling fires, other buildings fires and vehicle fires), except for outdoor primary fires, showed decreases over this time. (Source: FIRE0102)
- FRSs attended 755 fires in purpose-built high-rise (10+ storeys) flats, a three per cent decrease compared with the previous year (782) and three per cent of the 27,482 primary dwelling fires attended (Source: FIRE0205)
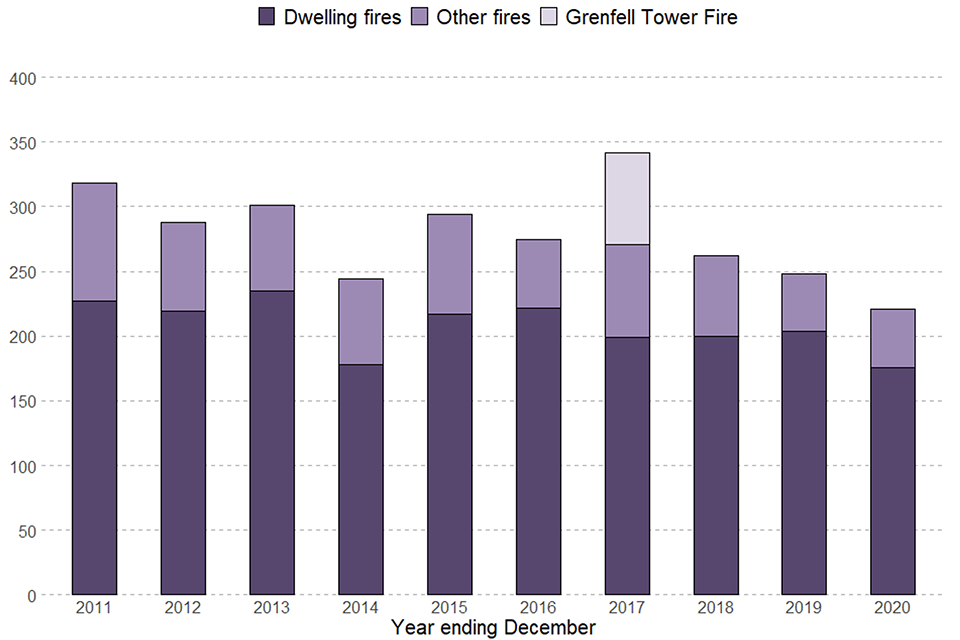
The long-term picture shows that the total number of fires attended by FRSs decreased for around a decade – falling by around two thirds from a peak of around 474,000 in year ending March 2004 to around 154,000 in year ending March 2013. The total number of fires has fluctuated since year ending March 2013.
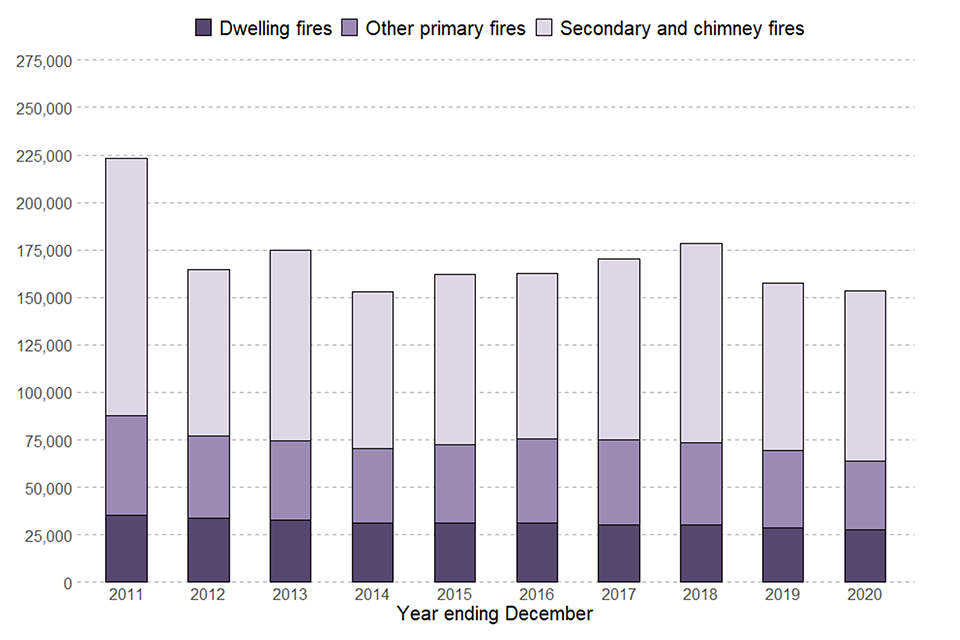
The total number of fires decreased by three per cent from 157,563 in the year ending December 2019 to 153,278 in the year ending December 2020 (Figure 2.1). There was a fall of seven per cent (from 69,184 to 64,066) in primary fires mainly driven by decreases in dwellings fires (4%), other buildings fires (11%) and road vehicles fires (12%), and an increase of one per cent (from 85,202 to 86,140) in secondary fires. This year’s decrease in the number of fires compared with the year ending December 2019, was driven by low figures in January 2019 to March 2020 and October 2020 to December 2020 due to lower figures in road vehicles fires and other building fires. The number of fires in the year ending December 2020 showed a one per cent decrease compared with five years ago (155,065) and a 37 per cent decrease compared with ten years ago (241,462).
Figure 2.1: Total fires attended by type of fire, England; year ending December 2011 to year ending December 2020
Source: FIRE0102
2.1 Primary fires
In the year ending December 2020 there were 64,066 primary fires (42% of the 153,278 fires attended). This was a seven per cent decrease compared with the previous year (69,184), a ten per cent decrease compared with five years ago (71,126) and a 37 per cent decrease compared with ten years ago (101,159). Compared with last year, there were decreases of four per cent in dwelling fires, 11 per cent in other buildings fires and 12 per cent in road vehicles fires, and an increase of three per cent in other outdoor fires.
Of the 27,482 primary dwelling fires attended by FRSs, around three-quarters (74%) were in houses, bungalows, converted flats and other properties, whilst around a quarter (26%) were in purpose-built flats.
When looking at fires in purpose-built flats in more detail, 16 per cent of primary dwelling fires were in purpose-built low-rise (1-3 storeys) flats/maisonettes; seven per cent were in purpose-built medium-rise (4-9 storeys) flats and three per cent were in purpose-built high-rise (10+ storeys) flats.
3. Fire false alarms
Fire false alarms are where an FRS attends a location believing there to be a fire incident but, on arrival, discovers that no such incident exists or existed. They are broadly categorised by motive into ‘due to apparatus’, ‘good intent’ and ‘malicious’.
Due to apparatus calls are where a fire alarm or fire-fighting equipment operate (including accidental initiation by persons) in error.
Good intent calls are made in good faith in the belief that the FRS really would be attending a fire.
Malicious false alarms are made with the intention of getting the FRS to attend a non-existent incident.
Key results
In the year ending December 2020:
- FRSs attended 220,432 fire false alarms, a four per cent decrease compared with the previous year (230,271), a two per cent increase compared with five years ago (215,873) and a 23 per cent decrease compared with ten years ago (285,368)
The number of fire false alarms attended by FRSs in England was on a general downward trajectory, from a peak of around 393,900 in year ending March 2002 to a low of around 214,400 in year ending March 2016. The number then climbed to around 232,000 in year ending March 2019, however in the past year (since year ending March 2020) the number decreased to around 220,000 (see Figure 3.1). The proportion of total incidents that were fire false alarms in the year ending December 2020 was 42 per cent. This proportion has been relatively stable over the past decade, varying between 40 and 44 per cent.
Figure 3.1: Total fire false alarms by type of false alarm, England; year ending December 2011 to year ending December 2020
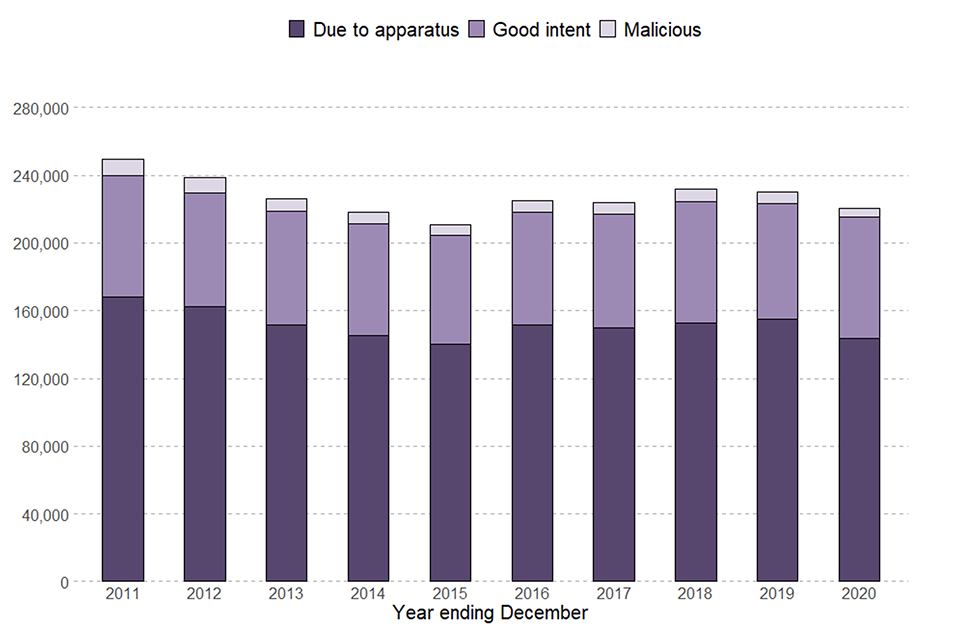
Source: FIRE0102
Fire false alarms are broadly categorised by motive into ‘due to apparatus’, ‘good intent’ and ‘malicious’. In the year ending December 2020 there were:
- 143,683 fire false alarms due to apparatus: a seven per cent decrease from the previous year (155,269), similar to five years previously (143,722) but a 26 per cent decrease from ten years previously (194,002)
- 71,468 fire false alarms due to good intent: an increase of five per cent from the previous year (68,298), an increase of nine per cent from five years previously (65,340) and a decrease of nine per cent from ten years previously (78,961)
- 5,281 malicious fire false alarms: decreases of 21 per cent from the previous year (6,704), 22 per cent from five years previously (6,811) and 57 per cent from ten years previously (12,405) (Source: FIRE0104)
4. Non-fire incidents attended
FRSs attend many types of incident that are not fires or fire false alarms. These are known as non-fire incidents or special service incidents. Examples include flooding incidents, responding to road traffic collisions, animal assistance and collaboration incidents such as effecting entry and or exit and assisting other agencies (a complete list can be found in fire data table FIRE0902).
Key results
In the year ending December 2020:
- FRSs attended 154,891 non-fire incidents, an eight per cent decrease compared with the previous year (169,239) and a 24 per cent increase compared with five years ago (125,335) (Source: FIRE0901, FIRE0902)
- FRSs attended 45,582 collaborating incidents[footnote 1]; this was similar to the previous year (45,702) (Source: FIRE0901, FIRE0902)
- FRSs attended 24,575 road traffic collisions; this was a 22 per cent decrease compared with the previous year (31,536) caused by April to June 2020 being the lowest quarterly figure since before this detailed breakdown was first collected consistently in 2010, and probably due to the first COVID-19 National Lockdown covering much of this time period and the subsequently reduced traffic on the roads (Source: FIRE0901, FIRE0902)
- FRSs attended 14,344 medical incidents[footnote 2]; this was a 25 per cent decrease compared with the previous year (19,122); medical incidents have been on a downward trend in recent years (Source: FIRE0901, FIRE0902)
There was a general decline in the number of non-fire incidents attended between year ending March 2008 and year ending March 2015 (Figure 4.1). This was followed by a large increase of almost two-fifths to year ending March 2017 coinciding with the introduction, in 2015, of the National Joint Council (NJC) supported trials of emergency medical responding (EMR) where FRSs formed agreements with ambulance trusts to undertake health and care related work, in particular, co-responding. Following the withdrawal of the Fire Brigades Union (FBU) support in September 2017, the number of these incidents has decreased to a level slightly higher than before the trials and the total number of non-fire incidents has been broadly stable.
Between year ending March 2015 and year ending March 2020 the number of collaborating incidents attended has more than doubled (from 21,145 to 46,749). The increases coincide with the duty to collaborate legislation, whereby each emergency service “must keep under consideration whether entering into a collaboration agreement with one or more other relevant emergency services in England could be in the interests of the efficiency or effectiveness of that service and those other services.”
Figure 4.1: Total non-fire incidents attended by FRSs, England; year ending December 2011 to year ending December 2020
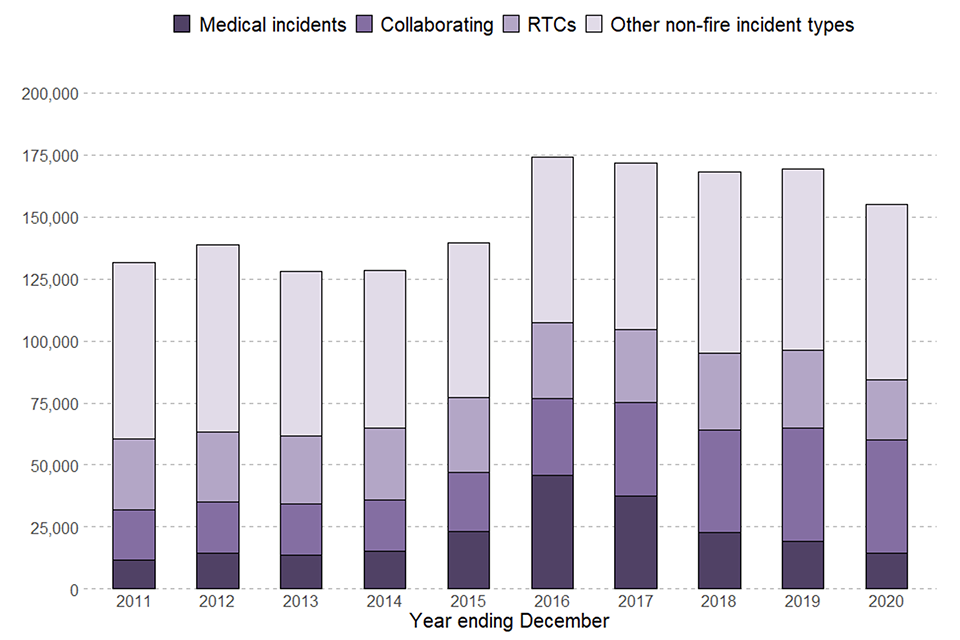
Source: FIRE0901
In the year ending December 2020 FRSs attended 154,891 non-fire incidents. This was an eight per cent decrease compared with the previous year (169,239), a 24 per cent increase compared with five years ago (125,335) and a one per cent increase compared with ten years ago (153,804). The overall net eight percent decrease was the result of distinct changes in the largest categories of non-fire incidents, as shown in Table 4.1.
Table 4.1: The five largest categories of non-fire incidents attended by FRSs in England; year ending December 2019 to year ending December 2020
| Non-fire incident type | Year ending December 2019 | Year ending December 2020 | % change |
|---|---|---|---|
| Total non-fire incidents | 169,239 | 154,891 | -8% |
| Road traffic collisions | 31,536 | 24,575 | -22% |
| Effecting entry/exit | 26,203 | 24,098 | -8% |
| Assisting other agencies | 17,491 | 19,433 | +11% |
| Medical incidents | 19,122 | 14,344 | -25% |
| Flooding incidents | 14,484 | 14,913 | +3% |
Source: FIRE0901, FIRE0902
The 22 per cent decrease in “road traffic collisions” compared with the previous year was caused by April to June 2020 being the lowest quarterly figure since this detailed breakdown was first collected consistently in 2010. This low figure was probably due to the first COVID-19 National Lockdown covering much of this time period and the subsequently reduced traffic on the roads (Transport use during the coronavirus (COVID-19) pandemic). This was explored in the Detailed analysis of non-fire incidents: England, April 2019 to March 2020 release.
The 11 per cent increase in “assisting other agencies” continues a recent trend of increases – a 34 per cent increase from the year ending December 2018 (14,529) – that coincides with the duty to collaborate legislation.
The 25 per cent decrease in “medical incidents” continues a recent trend of decreases – a 37 per cent decrease from the year ending December 2018 (22,836) – following the removal of FBU support for EMR trials in 2017. However, the April to June 2020 figure was the lowest quarterly figure since April to June 2010 and coincided with the first National COVID-19 Lockdown.
The three per cent increase in flooding incidents probably reflects the wet weather between January 2020 and March 2020. Rainfall in February 2020 was the highest February figure of the last ten years (UK and regional series - Met Office).
For more detailed information on EMR and collaborating incidents see table FIRE0901 and the chapter in the Detailed analysis of non-fire incidents: England, April 2018 to March 2019 statistical release (the year ending March 2020 release has not included a chapter on EMR and collaborating incidents).
5. Fire-related fatalities and casualties
As the Incident Recording System (IRS) is a continually updated database, the statistics published in this release may not match those held locally by FRSs, and revisions may occur in the future (see the revisions section for further detail). This may be particularly relevant for fire-related fatalities, where a coroner’s report could lead to revisions in the data some time after the incident. It should also be noted that the numbers of fire-related fatalities are prone to year-on-year fluctuations due to relatively low numbers.
Fire-related fatalities are those that would not have otherwise occurred had there not been a fire. For the purpose of publications, a fire-related fatality includes those that were recorded as ‘don’t know’.
Non-fatal casualties are those resulting from a fire, whether the injury was caused by the fire or not.
Key results
In the year ending December 2020:
- there were 221 fire-related fatalities (see Figure 5.1) compared with 248 in the previous year (a decrease of 11%) and this was the lowest 12-month figure since quarterly data became available in year ending March 2002, following a period of fluctuation (Source: FIRE0502)
- there were 176 fire-related fatalities in dwelling fires, compared with 204 in the previous year (a decrease of 14%)
- there were 6,567 non-fatal casualties[footnote 3], a seven per cent decrease compared with 7,093 in the previous year, this includes 2,761 casualties requiring hospital treatment, a nine per cent decrease compared with the 3,031 in the previous year (Source: FIRE0502)
5.1 Fire-related fatalities
The number of fire-related fatalities in England was on a general downward trend from year ending March 1982, when comparable figures first became available. Though the numbers have fluctuated due to the relatively small numbers involved, in recent quarters the number of fatalities has decreased. There was an exceptionally high figure in year ending December 2017 (Figure 5.1) due to the Grenfell Tower fire[footnote 4]. The 221 fire-related fatalities in the year ending December 2020 was the lowest 12-month figure since quarterly data became available in year ending March 2002. It should also be noted that the numbers of fire-related fatalities are prone to year-on-year fluctuations due to relatively low numbers.
A very small proportion of fires resulted in a fire-related fatality: 210 out of the 64,066 primary fires (0.33%). This proportion is virtually unchanged compared with the previous year, when there were 232 fires with a fire-related fatality out of the 69,184 primary fires (0.34%). There were three fires from the 755 fires in purpose-built high-rise (10+ storeys) flats in the year ending December 2020 which resulted in a fatality, compared with six in the previous year.
Figure 5.1: Total fire-related fatalities, England; year ending December 2011 to year ending December 2020
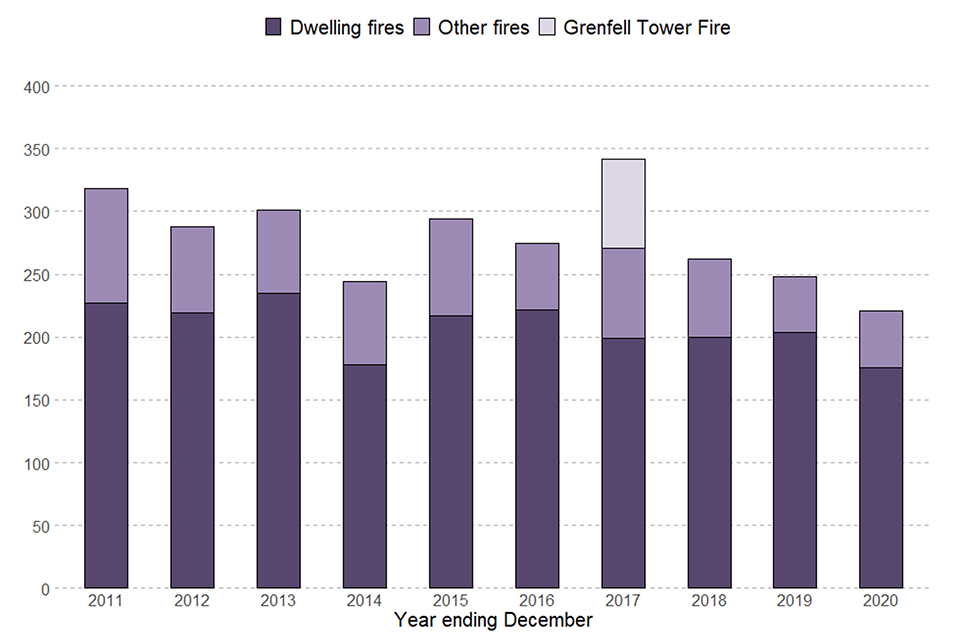
Source: FIRE0502
Notes: Fire-related fatalities are those that would not have otherwise occurred had there not been a fire, those where the role of fire in the fatality was “not known” are included in “fire-related”.
5.2 Non-fatal casualties
The number of non-fatal casualties in fires in England has been on a downward trend since the mid-1990s. More detailed data became available due to the introduction of the online IRS in 2009 and since then the “hospital slight” and “first aid” categories have shown the biggest decline. The year ending December 2020 had the lowest number of non-fatal casualties (6,567) since year ending March 1982. There were decreases across all categories compared with the year ending December 2019: hospital severe (down 10%), hospital slight (down 9%), first aid (down 2%) and precautionary checks (down 11%). It should be noted that casualties recorded as hospital severe have remained low but fluctuate from year to year. (Figure 5.2)
Figure 5.2: Total non-fatal casualties in fires by injury severity, England; year ending December 2011 to year ending December 2020
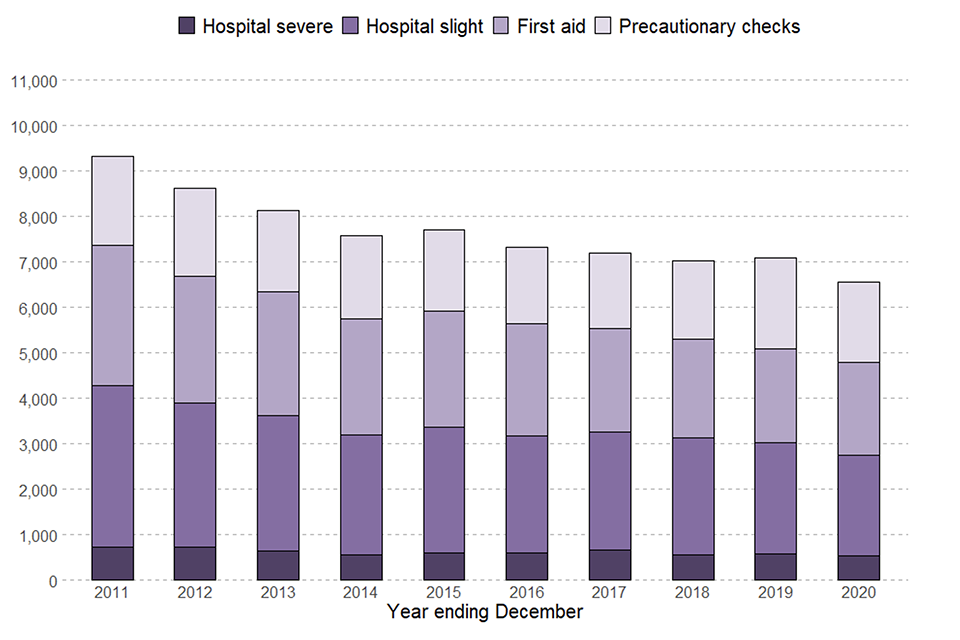
Source: FIRE0502
Notes: These figures are for all casualties in fires, whether the fire caused the casualty or not.
6. Summary of changes over time
Table 6.1: Number of incidents, comparing the year ending December 2020 with the year ending December 2019, five years previously in 2014/15 and ten years previously in 2009/10
| Year ending December 2020 compared with | |||
|---|---|---|---|
| Incident type | Year ending December 2019 | Year ending March 2015 | Year ending March 2010 |
| 528,601 all incidents | 557,073 -5% | 96,273 +7% | 80,634 -22% |
| 153,278 fires | 157,563 -3% | 155,065 -1% | 241,462 -37% |
| 64,066 primary fires | 69,184 -7% | 71,126 -10% | 101,159 -37% |
| 27,482 dwelling fires | 28,609 -4% | 31,338 -12% | 38,376 -28% |
| 24,652 accidental dwelling fires | 25,677 -4% | 28,325 -13% | 33,032 -25% |
| 86,140 secondary fires | 85,202 +1% | 78,753 +9% | 132,941 -35% |
| 220,432 fire false alarms | 230,271 -4% | 215,873 +2% | 285,368 -23% |
| 154,891 non-fire incidents | 169,239 -8% | 125,335 +24% | 153,804 +1% |
Table 6.2: Number of fire-related fatalities and non-fatal casualties, comparing the year ending December 2020 with the year ending December 2019, five years previously in 2014/15 and ten years previously in 2009/10
| Year ending December 2020 compared with | |||
|---|---|---|---|
| Fatalities and non-fatal casualties | Year ending December 2019 | Year ending March 2015 | Year ending March 2010 |
| 221 fire-related fatalities | 248 -11% | 265 -17% | 340 -35% |
| 176 fire-related fatalities in dwellings | 204 -14% | 195 -10% | 257 -32% |
| 6,567 non-fatal casualties | 7,093 -7% | 7,596 -14% | 8,864 -26% |
| 2,761 non-fatal casualties requiring hospital treatment | 3,031 -9% | 3,252 -15% | 4,155 -34% |
| 5,051 non-fatal casualties in dwellings | 5,107 -1% | 5,926 -15% | 6,863 -26% |
Source: Fire statistics data tables
7. Further information
This release contains statistics about incidents attended by fire and rescue services (FRSs) in England. The statistics are sourced from the Home Office’s online Incident Recording System (IRS). This system allows FRSs to complete an incident form for every incident attended, be it a fire, a false alarm or a non-fire incident (also known as a Special Service incident). The online IRS was introduced in April 2009. Previously, paper forms were submitted by FRSs and an element of sampling was involved in the data compilation process.
Fire and Rescue Incident Statistics and other Home Office statistical releases are available via the Statistics at Home Office pages on the GOV.UK website.
Data tables linked to this release and all other fire statistics releases can be found on the Home Office’s Fire statistics data tables page.
Guidance for using these statistics and other fire statistics outputs, including a Quality Report, is available on the fire statistics guidance page.
The information published in this release is kept under review, taking into account the needs of users and burdens on suppliers and producers, in line with the Code of Practice for Statistics. If you have any comments, suggestions or enquiries, please contact the team via email using firestatistics@homeoffice.gov.uk or via the user feedback form on the fire statistics collection page.
7.1 Revisions
The IRS is a continually updated database, with FRSs adding incidents daily. The figures in this release refer to records of incidents that occurred up to and including 31 December 2020. This includes incident records that were submitted to the IRS by 11 March 2021, when a snapshot of the database was taken for the purpose of analysis. As a snapshot of the dataset was taken on 11 March 2021, the statistics published may not match those held locally by FRSs and revisions may occur in the future. This is particularly the case for statistics with relatively small numbers, such as fire-related fatalities. For instance, this can occur because coroner’s reports may mean the initial view taken by the FRS will need to be revised; this can take many months, even years, to do so.
7.2 COVID-19 and the impact on the IRS
The figures presented in this release relate to incidents attended by FRSs during the period January 2020 to the end of December 2020. In response to the coronavirus pandemic, restrictions in England, Scotland and Wales started from 12 March 2020. In England, during the year ending December 2020, two lockdowns which applied strict limits on daily life were imposed. A first lockdown was applied on 23 March 2020 and was eased from 10 May 2020, while a second lockdown began on 5 November 2020 and ended on 2 December 2020. The restrictions and lockdowns are therefore captured in IRS data for the year ending December 2020.
Extra analysis on Fire and rescue incidents during the first COVID-19 National Lockdown can be found in Fire and rescue incident statistics, England, year ending June 2020 and Detailed analysis of non-fire incidents: England, April 2019 to March 2020.
7.3 Other related publications
Home Office publish five other statistical releases covering fire and rescue services:
- Detailed analysis of fires attended by fire and rescue services in England: focuses on fires attended by fire and rescue services across England, fire-related fatalities and non-fatal casualties in those fires; including analyses of the causes of fires and smoke alarms ownership and operation
- Detailed analysis of non-fire incidents attended by fire and rescue services, England: focuses on non-fire incidents attended by fire and rescue services across England, including analysis on overall trends, fatalities and non-fatal casualties in non-fire incidents, and further detailed analysis of different categories of non-fire incidents
- Fire and rescue workforce and pensions statistics: focuses on total workforce numbers, workforce diversity and information regarding leavers and joiners; covers both pension fund income and expenditure and firefighters’ pension schemes membership; and includes information on incidents involving attacks on firefighters
- Fire prevention and protection statistics, England: focuses on trends in smoke alarm ownership, fire prevention and protection activities by fire and rescue services
- Response times to fires attended by fire and rescue services, England: covers statistics on trends in average response times to fires attended by fire and rescue services
The Ministry of Housing, Communities & Local Government publish one statistical release on fire:
- English housing survey: fire and fire safety report: focuses on the extent to which the existence of fire and fire safety features vary by household and dwelling type.
Fire statistics are published by the other UK nations:
Scottish fire statistics and Welsh fire statistics are published based on the IRS. Fire statistics for Northern Ireland are published by the Northern Ireland Fire and Rescue Service using data from a system similar to the Incident Recording System, which means that they are not directly comparable to English, Welsh and Scottish data.
National Statistics
These statistics have been assessed by the UK Statistics Authority to ensure that they continue to meet the standards required to be designated as National Statistics. This statistical bulletin is produced to the highest professional standards and is free from political interference. It has been produced by statisticians working in accordance with the Home Office’s Statement of compliance with the Code of Practice for Official Statistics, which covers Home Office policy on revisions and other matters. The Chief Statistician, as Head of Profession, reports to the National Statistician with respect to all professional statistical matters and oversees all Home Office National Statistics products with respect to the Code, being responsible for their timing, content and methodology. This means that these statistics meet the highest standards of trustworthiness, impartiality, quality and public value, and are fully compliant with the Code of Practice for Statistics.
-
Collaborating incidents include “Assisting other agencies”, “Effecting entry and or exit” and “Suicide and or attempts”. ↩
-
Medical incidents include “First responder” and “Co-responder” incidents. ↩
-
For more detailed technical definitions of fire-related and non-fatal casualties, see the Fire Statistics Definitions document. A further breakdown of the different types of non-fatal casualties is available in the published fire data tables. ↩
-
For more information on the Grenfell Tower fire and how the associated fire-related fatalities figures are recorded, see the Fire Statistics Definitions document. ↩