Family Resources Survey: background information and methodology
Published 25 March 2021

© Crown copyright 2021
This publication is licensed under the terms of the Open Government Licence v3.0 except where otherwise stated. To view this licence, visit nationalarchives.gov.uk/doc/open-government-licence/version/3 or write to the Information Policy Team, The National Archives, Kew, London TW9 4DU, or email: psi@nationalarchives.gov.uk.
Where we have identified any third party copyright information you will need to obtain permission from the copyright holders concerned.
This publication is available at https://www.gov.uk/government/statistics/family-resources-survey-financial-year-2019-to-2020/family-resources-survey-background-information-and-methodology
1. Introduction
This note accompanies the main Family Resources Survey 2019 to 2020 report
The purpose of this note is to provide further contextual information to aid understanding of the statistics presented in the main report and detailed tables. It outlines points to note as well as strengths and limitations of the information presented in each section of the main report; alternative data sources; as well as changes to the survey this year compared to last year.
A detailed description of the FRS methodology, fieldwork operations, data processing and quality assurance is also presented.
Editorial team
Claire Cameron, Matt Jarvis, Harrison Jones, Justyna Owen, Kyle Robertson, Amy Skates, Clive Warhurst
Feedback
If you have any comments or questions about any aspect of the FRS, or are interested in receiving information on consultations, planned changes, and advance notice of future releases, please contact:
Claire Cameron,
Surveys Branch,
Department for Work and Pensions,
2nd Floor,
Caxton House,
Tothill Street,
London,
SW1H 9NA
Email: team.frs@dwp.gov.uk
Direct line: 020 7449 7332
Acknowledgements
Thank you to all the respondents in households across the United Kingdom who agreed to be interviewed; to the interviewers at the Office for National Statistics, NatCen Social Research and the Northern Ireland Statistics and Research Agency, and colleagues in those organisations; to those who have contributed towards the Family Resources Survey 2019 to 2020 report through providing quality assurance and feedback; and to our web support team.
2. Background
The Family Resources Survey (FRS) is a continuous survey which collects information on the income and circumstances of individuals living in a representative sample of private households in the United Kingdom. The survey has been running in Great Britain since October 1992 and was extended to cover Northern Ireland in 2002 to 2003.
The primary objective of the FRS is to provide the Department for Work and Pensions (DWP) with information to inform the development, monitoring and evaluation of social welfare policy. Detailed information is collected on: respondents’ incomes from all sources including benefits, tax credits and pensions; housing tenure; caring needs and responsibilities; disability; expenditure on housing; education; childcare; family circumstances; child maintenance.
Microsimulation is central to DWP’s use of the data. Therefore, careful attention is paid to the accurate collection of information followed by meticulous data processing, editing, and quality assurance.
The FRS data are designated by the UK Statistics Authority as National Statistics. The FRS provides the data for a number of other DWP National Statistics publications: Households Below Average Income, Pensioners’ Incomes Series and Income-Related Benefits: Estimates of Take-up.
The survey contains information of much interest to other government departments and, in particular, is used for tax and benefit policy purposes by Her Majesty’s Revenue and Customs and Her Majesty’s Treasury. The survey is also used extensively by academics and research institutes for social research purposes.
Status and Development
These statistics underwent a full assessment against the Code of Practice for Statistics in 2011 and were confirmed as National Statistics in November 2012 by the Office for Statistics Regulation.
Since the latest review by the Office for Statistics Regulation, the FRS has continued to comply with the Code of Practice for Statistics, with a number of improvements including:
- The timeliness of the publication has been improved so that reports are released within 12 months of the completion of the survey; made possible by a detailed Lean Six Sigma review and implementation of the recommendations. This led to an improvement in timeliness of three months
- The quality of statistics has improved as audits of processing methodology have been made, ensuring that imputation reflects changes to the questionnaire and subsequent changes to variables or formats. The publication code has been revised allowing both a more streamlined process for publication and a clearer approach to update for annual changes, while retaining the core structure for consistency and harmonisation
- A review of the Grossing regime used was conducted to follow the move to use of 2011 Census results in the production of mid-year population estimates by ONS. The new grossing regime was implemented in the 2012 to 2013 publication
- Value has been added in line with DWP statistics reporting practices. Publications have been made significantly shorter to enable a focus on commentary and analysis. This aids interpretation and increases clarity and insight, while still allowing a more in-depth scrutiny of the data in Excel or ODS table format
- The content of the FRS has evolved in response to user needs: the addition of “guest chapters” to focus on topical areas of interest such as Social & Cultural Participation; additional regular chapters for emerging areas of increased policy interest such as Self Employment and Household Food Security; and further tables by ethnicity to respond to Cabinet Office requirements for Ethnicity Facts and Figures
- New questions and variables have been added to reflect changes in policy, such as benefit changes specific to some areas of the UK, and in the field of pensions policy. This enables related policy analysis to be conducted
3. Uses of FRS Data
The FRS is used extensively both within and outside DWP. The main uses are as follows.
Households Below Average Income (HBAI)
The HBAI publication uses household disposable incomes, adjusted for household size and composition, as a proxy for material living standards or, more precisely, for the level of consumption of goods and services that people could attain given the disposable income of the household in which they live.
Pensioners’ Incomes Series
The HBAI dataset is used in the Pensioners’ Incomes Series, the Department’s analysis of trends in components and levels of pensioners’ incomes.
Income-Related Benefits: Estimates of Take-Up
Figures are based on a combination of administrative and survey data. The FRS provides information about people’s circumstances, which is used to estimate numbers of people who are not claiming benefits to which they may be entitled. Read the Take-up publications.
DWP Policy Simulation Model and other policy analysis
DWP’s Policy Simulation Model (PSM) is used extensively for the development and costing of policy options. FRS responses are uprated to current prices, benefits and earnings levels and can be calibrated to the DWP Departmental Report forecasts of benefit caseload. Using FRS data has made it possible to model some aspects of the benefit system which could not be done previously, for example severe disability premiums or allowances for childcare costs.
In addition to their use in formal modelling, FRS data play a vital role in the analysis of patterns of benefit receipt for policy monitoring and evaluation, and benefit forecasting.
Other government departments and the wider research community
The survey is widely used by other government departments, including Her Majesty’s Treasury and Her Majesty’s Revenue and Customs.
The Department for Communities (Northern Ireland) uses the FRS to produce similar reports to those from DWP, which are focused on Northern Ireland.
Researchers and analysts outside government can also access the data through the UK Data Service.
The Office for National Statistics produces small area model-based income estimates as the official estimates of annual household income at the middle layer super output area (MSOA) level in England and Wales. The estimates are produced using a combination of survey data from the Family Resources Survey and previously published data from the 2011 Census and a number of administrative data sources.
The Race Disparity Unit published the first in a series of summaries of data from the ‘Ethnicity Facts and Figures’ website in June 2019 and this was updated in October 2020. Ethnicity Facts and Figures provides information about the different experiences of people from a variety of ethnic backgrounds. It gathers data collected by Government in one place, making it available to the public, specialists and charities. Family Resources Survey data is used to provide state support data, by ethnicity and type of benefit.
4. Points to Note
This section presents contextual detail as well as strengths and limitations of the information presented in each section of the main FRS report.
Impact of COVID-19
The data in this report are from interviews conducted between April 2019 and March 2020. Interviews were suspended in mid-March 2020 in line with the national lockdown. At this point, nearly a full year’s worth of FRS interviews had already taken place and there is no material impact of COVID-19 upon these results. FRS 2019 to 2020 forms a key, pre-pandemic baseline of household incomes.
Income and state support
All income figures are presented gross of tax, national insurance and before other deductions from wages except where noted.
It is thought that household surveys underestimate income from both self employment and investment income. We rely on respondent recall of very detailed financial information across a comprehensive range of income sources. Some of these are hard for respondents to recall. The FRS interviewers ask respondents to check pay-slips, tax returns and other financial paperwork at the time of the face-to-face interview. This helps to improve the reliability of what respondents report they earn.
The FRS captures detailed information on benefit receipt. In most cases this is analysed at a benefit unit (family) level because income-related benefits are paid to families as a whole rather than being separately assessed for each individual.
Some respondents do not know or do not have the necessary information to answer specific questions about individual benefits which makes it difficult to collect accurate information: see State Benefits on the Family Resources Survey (WP115).
Relative to administrative records, the FRS under-reports numbers on benefit (caseload). See Methodology Tables M.6a and M.6b for a comparison of (i) numbers on benefit (caseload) and also (ii) the average £ per week received, showing any differences between DWP administrative data and the numbers implied by the survey results. One of the strengths of the FRS is that it collects many personal and family characteristics which are not available from administrative sources. This means that the FRS can be used to analyse income and benefit receipt in ways which are not possible from administrative sources alone.
Tenure
As presented in the FRS, the “social rented sector” is a combination of the categories “Rented from Council” and “Rented from a Housing Association”. These categories are combined because some housing association tenants may misreport that they are council tenants. For instance, where their home used to be owned by the council and although ownership has now transferred to a housing association, the tenant may still think that their landlord is the council (local authority).
Disability
The way in which disabled people have been identified in the FRS has changed over time. From 2002 to 2003 statistics were based on responses to questions about barriers across a number of areas of life; figures from FYE 2005 to FYE 2012 are based on those reporting barriers across nine areas of life.
From 2012 to 2013 a person is considered to have a disability if they regard themselves as having a long-standing illness, disability or impairment which causes substantial difficulty with day-to-day activities. This updated definition is consistent with the core definition of disability under the Equality Act 2010, and complies with harmonised standards for social surveys published in August 2011 and updated in June 2019
An impairment is different to a medical condition. It looks at the functions that a person either cannot perform or has difficulty performing because of their health condition. For example, glaucoma is a medical condition but being unable to see or being partially sighted is an impairment
Some people classified as disabled and having rights under the Equality Act 2010 are not captured by this definition, such as people with a long-standing illness or disability which is not currently affecting their day-to-day activities. More information is available from the GSS Policy Store.
Care
FRS respondents are asked if they receive care from anyone. This includes both professional help; paid-for care from the local authority, health professionals or domestic staff, but it also includes informal care. This is any care where their carer is not doing it as a paid job; it can be for many, or only a few hours a week, and can take several different forms. The survey is intentionally not prescriptive about what counts as care; it could, for example, include going shopping for someone, or helping them with paperwork.
Where respondents are receiving care at least once a week, they are further asked about the nature and frequency of that care. FRS respondents are also asked if they provide care to someone else, on an informal basis. That person could be living with them, in their household, or they could live somewhere else (outside the household).
Pension Participation
The FRS pension participation reference tables present data for both ‘all adults’ and ‘working-age adults only’. Those over State Pension age are often excluded from analysis of pension participation in other publications, although they could continue to work and participate in pension schemes. The ‘all adults’ category allows data for this group to be represented and also provides continuity across all chapters within the FRS.
Employer-sponsored pensions comprise any company or occupational pension scheme run by an employer including group personal pensions and group stakeholder pensions.
Individual pensions include individual stakeholder pensions and retirement annuity contracts as well as personal pensions.
Although the numbers are relatively small, self-employed people can contribute to an employer-sponsored pension scheme, for a variety of reasons. Doctors and dentists in private practice can be members of an occupational scheme. People who have recently become self-employed can continue to contribute to their previous employer scheme and people whose main job is self-employed, may work part-time as an employee and contribute to an employer scheme. These circumstances are captured within the FRS tables under the ‘Self-employed – Other’ category.
Savings and investments
The FRS does not capture information on non-liquid assets. Physical wealth and pensions accruing are not included in FRS estimates. The survey also does not capture detailed information on expenditure (except for housing costs). Therefore, it is not possible to show how households are coping financially, in terms of income versus outgoings.
However, the FRS does capture information on liquid financial assets, referred to in the survey as ‘savings and investments’. Estimates for savings and investments should be treated with caution, as they are likely to be under-estimates, since respondents often inaccurately report their account details. In view of this, the information is gathered as follows:
-
Respondents are asked, as a benefit unit, to say which of several £ bands their total level of savings and investments are in
-
Benefit units that report between £1,500 and £20,000 (28% of benefit units) are then asked, for each of their accounts and assets, how much each is worth and how much interest they accrue. The total level of savings and investments is then calculated using this set of reported values
-
Benefit units with reported savings and investments below £1,500 and above £20,000 (72% of benefit units) are only asked how much interest each account and asset accrues. These respondents are also asked to estimate the value of all of their current accounts and basic bank accounts combined
Methodological change for 2019 to 2020
The level of savings and investments, for some families (benefit units) and households in this category, has been estimated using a slightly different methodology in 2019 to 2020 than in previous years. The new method more accurately estimates savings in current accounts and basic bank accounts.
For current and basic bank accounts only, the new method avoids imputation of the account balance from interest paid, instead basing account balances on the figure given by the respondent. 33% of all accounts are covered by this new methodology.
Benefit unit respondents with reported savings and investments below £1,500 and above £20,000 are not asked to estimate the value of any of their accounts, other than current and basic bank accounts, so it is not possible to apply the new methodology to any other accounts.
This change has caused a large shift in the division of families (benefit units) and households between the two categories of (i) those with no savings at all to (ii) those with less than £1,500 in savings. This has produced estimates of savings in the relevant categories which are closer to those of other related surveys, but it should be noted that figures in this publication are not directly comparable with figures in previous FRS publications.
Self Employment
The FRS asks a detailed set of questions to capture earnings from self employment:
- Self-employed respondents are asked questions on their most recent business accounts as submitted to HMRC: dates of the accounts, profit or loss figures, and amounts paid in tax and National Insurance
- They are then asked if they draw money from their business accounts for non-business purposes, such as for payments to themselves, personal spending, paying domestic bills etc. and how much this is per month on average. They are also asked if they receive other income from their business for personal use, e.g. cash in hand, and how much this is per month on average
- Those who do not keep annual business accounts and do not draw money for non-business purposes are asked for their income after paying for materials, equipment, goods etc. and whether they make tax and National Insurance payments on this amount
The FRS does not fully capture information on all types of income in kind accurately – for example, benefits of vehicles, computers and mobile phones purchased by the business – that are also for personal use. And these benefits are likely to be more important for the self-employed than for employees. Therefore, the FRS earnings measures are likely to underestimate the true monetary and other benefits of self employment. However, it is very difficult to quantify this.
Other benefits of self employment compared to employment are not captured, such as flexibility in working patterns, independence and flexibility in the way money is drawn from the business. The complexity of self employment circumstances, with irregular income and benefits-in-kind coming from a range of sources, could also contribute to inaccuracy of information capture.
One of the significant advantages of the FRS is that it has captured self employment in a consistent way over time. Therefore, the trends in self employment compared to employment are likely to be reasonably accurate.
The FRS does undercount the number of people reporting self employment compared to the Labour Force Survey, although the trends and proportions by age, gender etc. are consistent across the two surveys. The LFS is considered the definitive source where numbers participating in the labour market are concerned.
For self-employed individuals, net income figures are presented after any deductions which include, but are not limited to tax, national insurance and pension contributions. Where gross income figures are presented these include all of these elements.
Household Food Security
For the 2019 to 2020 survey year, a new set of questions on this subject were added to the questionnaire. The new questions provide evidence on the standing of households in relation to their food security. “Food security” as a concept is defined as “access by all people at all times to enough food for an active, healthy life”. Questions relate to the household’s experience in the 30 days immediately before the interview. The questions are put to the person in each household who is best placed to answer about food shopping and preparation. These respondents are asked the first three questions, on whether they are concerned about:
- food running out before they had enough money to buy more
- the food they had bought not lasting, and not having money to buy more
- not being able to afford balanced meals
The possible answers are ‘often, ‘sometimes’ or ‘never’ true. If respondents say that all three statements are never true they will not be asked further questions on food security. If respondents answer that any of these statements are sometimes or often true they will be asked further questions on the extent of their food security.
Taking the responses together, a household ‘score’ for food security is then derived. For further information on the questions, scoring system and data generation, see the Questionnaire Changes and Glossary sections, and the relevant publication tables.
The broad structure and sequence of the questions is the same as those used internationally. They are used within the UK (Food Standards Agency) and are also used by other countries, including the United States Department of Agriculture, enabling broad international comparability of the results.
Adjusting for inflation
Some figures in the main FRS report and the accompanying tables combine several years of income data. In these circumstances, uprating factors are used to adjust for inflation by bringing values from previous years into current price terms.
Prior to the 2014 to 2015 FRS report, the Retail Prices Index (RPI) was used to adjust for inflation. In March 2016, the National Statistician recommended that the RPI should no longer be used to adjust for inflation in statistical publications.
Since the 2014 to 2015 FRS, the Consumer Price Index (CPI) has been used to adjust for inflation. Read more information concerning this methodological change.
5. Alternative data sources
Income
A Guide to Sources of Data on Earnings and Income
The Effects of Taxes and Benefits on Households
Annual Survey of Hours and Earnings
Benefits statistics on Stat-Xplore
Households Below Average Income on Stat-Xplore
Pensioners’ Incomes Series on Stat-Xplore
Income Dynamics: Income movements and persistence of low incomes
ONS: explanation of incomes and earnings
Tenure
Index of Private Housing Rental Prices
Housing affordability in England and Wales: 2020
More information about housing statistics is available from Housing research summaries
Housing and planning statistics
Disability
ONS Outcomes for Disabled People in the UK
Care
Department of Health Personal Social Services survey of adult carers in England
GSS Health and care stsatistics
GSS Adult social care statistics
Pension Participation
Occupational Pension Schemes Survey
Note that the collection and publication of the annual Occupational Pension Schemes Survey (OPSS) has ceased. The quarterly Financial Survey of Pension Schemes (FSPS) has superseded this.
Employers’ Pension Provision Survey
The Pensions Regulator – DC Trust: a presentation of scheme return data
The Pensions Regulator – annual report on UK defined benefit and hybrid scheme
English Longitudinal Study of Ageing
Annual Survey of Hours and Earnings (pension tables)
Self employment
Understanding Self Employment: A Labour Force Survey follow-up survey by the Department for Business, Innovation and Skills.
Department for Business Innovation & Skills report on self employment
Trends in self employment in the UK
Labour Market overview UK, including breakdown of the self-employed.
Household Food Security
The Food and You Survey Wave 5: Combined report for England, Wales and Northern Ireland
The Food and You 2 Survey Wave 1: Combined report for England, Wales and Northern Ireland
6. FRS changes in year 2019 to 2020
Policy changes
Council Tax
In England, the Ministry of Housing, Communities and Local Government estimated that the average Band D council tax set by local authorities in 2019 to 2020 represented an increase of 4.7% on 2018 to 2019 levels.
In Wales, the average Band D council tax in 2019 to 2020 represented an increase of 6.6% on 2018 to 2019 levels.
In Scotland, the average Band D council tax in 2019 to 2020 represented an increase of 3.6% on 2018 to 2019 levels.
In Northern Ireland, the Regional Rate for the tax year ending 2020 increased by 4.8% on 2019 levels.
Housing Benefit
In 2019 to 2020, most Local Housing Allowance (LHA) rates remained frozen at 2015 to 2016 cash values. Rates in the least affordable areas were given Targeted Affordability Fund (TAF), which amounts to a three per cent increase.
The majority of Housing Benefit rates for 2019 to 2020 remained unchanged.
Income Tax
In 2019 to 2020, the standard income tax personal allowance increased by £650 to £12,500.
National Living Wage
In April 2019, the National Living Wage was increased to £8.21 per hour for employees aged 25 years and over. Employees under the age of 25 continue to get the National Minimum Wage, which increased from April 2019 to £7.70 per hour for those aged 21 to 24 years and £6.15 per hour for those aged 18 to 20 years.
Pension Participation
Automatic enrolment completed its roll-out in 2018. From April 2019, the minimum contribution increased by three percentage points to eight per cent with at least three per cent from the employer.
Pension Credit
From May 2019, couples where only one person is over State Pension Age, will no longer be able to claim Pension Credit. Instead, mixed age couples will be able to claim Universal Credit until both parties reach State Pension Age.
Personal Independence Payment
PIP was introduced from April 2013 for new claimants and from October 2013 DWP began inviting claimants in receipt of DLA for those aged 16 to 64 years on 8 April 2013, or reached age 16 after that date, to claim PIP.
State Pension
The new single-tier State Pension launched on 6 April 2016 for people who reach pension age on or after April 2016. This consolidated the basic State Pension and additional State Pension into one single amount. The amount paid to individuals depends on recipients’ National Insurance contributions.
From 6 April 2010, the State Pension age has been increasing gradually for both men and women. The data in this report were collected throughout the financial year 2019 to 2020, during which the State Pension age for both men and women increased from 65 years 2 months to 65 years 8 months.
Support for Mortgage Interest
In April 2018 Support for Mortgage Interest Loans (SMIL) were introduced to provide support for mortgage interest through a loan instead of benefits. In tandem with this change, Mortgage Payment Protection Insurance (MPPI) payments are fully disregarded in all means-tested benefits if the claimants would be entitled to a SMIL and all MPPI is disregarded in the calculation of Universal Credit.
Universal Credit
Since April 2013, Universal Credit has been replacing income-based Jobseeker’s Allowance, income-related Employment and Support Allowance, Income Support, Working Tax Credit, Child Tax Credit and Housing Benefit.
National roll-out of Universal Credit, for all new relevant claims, completed in December 2018. Existing exceptions within the two child policy for kinship carers and adopters were extended to apply to any eligible children in a household from November 2018.
Existing claimants on legacy benefits without a change in circumstance can currently remain on their legacy benefit(s) until there is a change in circumstance.
In July 2019, The Universal Credit (Managed Migration Pilot and Miscellaneous Amendments) Regulations 2019 were introduced. These provided for the removal of the Severe Disability Premium (SDP) Gateway from 27 January 2021, meaning that from this date, SDP recipients will be able to make a new claim to Universal Credit.
The regulations also introduced the SDP transitional payments to those claimants who were previously entitled to the SDP as part of their legacy benefit and had moved to Universal Credit before the SDP Gateway came into effect on 16 January 2019. The SDP transitional payments consisted of:
- an ongoing monthly amount of either £120, £285 or £405 depending on a person’s circumstances; and
- an additional lump-sum payment to cover the period since they moved onto UC
Up-rating
From FYE 2017 to FYE 2020 certain working-age benefits were frozen at 2015 to 2016 cash values.
- Working-age benefits, including the main rates of Jobseeker’s Allowance, Income Support, Universal Credit, Employment and Support Allowance and Housing Benefit remained frozen at 2015 to 2016 cash values
- Child Benefit, along with some elements of tax credits, was frozen at 2015 to 2016 cash values. Family and childcare elements of tax credit were frozen in cash terms
Benefits excluded from the freeze included:
- Disability Living Allowance
- Personal Independence Payment
- Employment and Support Allowance Support Group component
- UC Limited Capability for Work and Work-Related Activity Element
- Premiums paid to disabled people receiving working-age benefits, where they, their partner or their children are disabled
- Carer benefits
- Pension benefits
- Attendance Allowance
- Maternity Allowance
- Statutory Sick Pay
- Statutory Maternity Pay
- Statutory Paternity Pay
- Statutory Shared Parental Pay
- Statutory Adoption Pay
In April 2019:
- The State Pension was up-rated by 2.6% (CPI) in line with the triple lock, which ensures that it increases by the highest of the increase in earnings, price inflation (as measured by the CPI) or 2.5%
- In 2019 to 2020, the Standard Minimum Guarantee in Pension Credit was increased by earnings resulting in a 2.6% increase for a single person from £163.00 a week to £167.25, a cash increase of £4.25. For couples, the Standard Minimum Guarantee in Pension Credit was increased by earnings resulting in a 2.6% increase from £248.80 a week to £255.25, a cash increase of £6.45
- Universal Credit work allowances were increased by £1,000 per year
COVID-19 (March 2020 onwards)
Some policy changes were implemented from March 2020 as a result of COVID-19. These will not be reflected in the data collected during the survey year 2019 to 2020 as interviews were suspended with the announcement of the first national lockdown, mid-March 2020.
Questionnaire changes
Household Food Security questions
These questions were introduced at the start of the survey year and were asked throughout the whole year. They were asked of all households in the survey.
The question set is comparable to those used both by other branches of Government and internationally. It is based on the Adult Food Security Survey Module from the United States Department of Agriculture. This module can be used for households with and without children, and allows for better comparison between these two groups than utilising two different survey methodologies for households with and without children.
This section outlines both the question set and the treatment of the resulting data, in terms of onward generation of a household score, for analysis purposes.
Layout of questions
Step 1: If the household has two or more members, to identify the most appropriate person in the household to answer the question, the section on household food security is prefaced with:
“The next questions should be answered by the person who has the best information about the food preparation and shopping for the household.”
The respondent is identified by the variable WhoFood on the FRS dataset (for that respondent, WhoFood will equal 1).
Step 2: The Household Food Security question block is then introduced:
“These next questions are about the food eaten in your household in the last 30 days, that is since [date 30 days ago], and whether you were able to afford the food you need.”
Step 3: The respondent (WhoFood=1) is then read three statements, and asked if the statement was “Often true”, “Sometimes true” or “Never true” for the last 30 days:
FoodQ1: “[I or We] worried whether [my or our] food would run out before [I or we] got money to buy more.”
FoodQ2: “The food that [I or we] bought just didn’t last, and [I or we] didn’t have money to get more.”
FoodQ3: “[I or We] couldn’t afford to eat balanced meals.”
If all three questions are answered as being “Never true”, then the respondent does not answer any further questions on household food security and moves on to the next section of the survey. If any of these questions are answered “Often true” or “Sometimes true”, then the respondent continues with the other questions on household food security, as follows.
Step 4: The same respondent is asked the next questions in the set. Some are answered either ‘yes’ or ‘no’, and some by providing a number of days an event happened. The questions are:
FoodQ4a: “Did [you or other adults in your household] skip or cut meals because there wasn’t enough money for food?”
-
FoodQ4b: “How many days did this happen?
-
FoodQ4c: [only asked if unsure at FoodQ4b] “Please tell me, did this happen on 3 or more days out of the last 30?”
FoodQ5: “Did you ever eat less than you felt you should because there wasn’t enough money for food?”
FoodQ6: “Were you ever hungry but didn’t eat because there wasn’t enough money for food?”
FoodQ7: “Did you lose weight because there wasn’t enough money for food?”
FoodQ8a: “Did [you or other adults in your household] ever not eat for a whole day because there wasn’t enough money for food?”
-
FoodQ8b: “How many days did this happen?”
-
FoodQ8c: [only asked if unsure at FoodQ8b] “Please tell me, did this happen for 3 or more days out of the last 30?”
Household food security scores
From the questions, a ten-point household score is generated. One point is scored for each ‘positive’ answer, that is, answers of “Often true”, “Sometimes true”, “Yes”, (or “3 days or more” for questions 4b, 4c and 8b, 8c). For questions 4b and 4c, and 8b and 8c, only a single point can be scored from each pair, since the latter question of each pair is only asked where respondents are unsure of an answer at 4b, 8b.
| Question | Points | Scoring answer | Scoring answer | Non-scoring answer | Non-scoring answer |
|---|---|---|---|---|---|
| FoodQ1 | 1 | “Sometimes true” | “Often true” | “Never true” | |
| FoodQ2 | 1 | “Sometimes true” | “Often true” | “Never true” | |
| FoodQ3 | 1 | “Sometimes true” | “Often true” | “Never true” | |
| FoodQ4a | 1 | “Yes” | “No” | ||
| FoodQ4b/4c | 1 | 3 or more | “Yes” | 2 or fewer | “No” |
| FoodQ5 | 1 | “Yes” | “No” | ||
| FoodQ6 | 1 | “Yes” | “No” | ||
| FoodQ7 | 1 | “Yes” | “No” | ||
| FoodQ8 | 1 | “Yes” | “No” | ||
| FoodQ8b/8c | 1 | 3 or more | “Yes” | 2 or fewer | “No” |
From the questions, a ten-point household score is generated, and the household is placed into one of four categories of household food security status:
- High food security (score = 0): The household has no problem, or anxiety about, consistently accessing adequate food
- Marginal food security (score = 1 or 2): The household had problems at times, or anxiety about, accessing adequate food, but the quality, variety, and quantity of their food intake were not substantially reduced
- Low food security (score = 3 to 5): The household reduced the quality, variety, and desirability of their diets, but the quantity of food intake and normal eating patterns were not substantially disrupted
- Very low food security (score = 6 to 10): At times during the last 30 days, eating patterns of one or more household members were disrupted and food intake reduced because the household lacked money and other resources for food
Households with high or marginal food security are “food secure”. Food secure households are considered to have sufficient, varied food to facilitate an active and healthy lifestyle. Households with low or very low food security are “food insecure”. Food insecure households have a risk of, or lack of access to, sufficient, varied food.
Introduction of questions to capture new grants available
In Scotland, Wales and Northern Ireland, parents on low incomes may be eligible for a grant for school clothing. The names of the grants and amounts payable vary, depending where they are issued.
A new question has been added to collect information about receipt of the Young Carer Grant in Scotland. The Young Carer Grant is a new benefit which the Scottish Government has introduced and has been in place since 21 October 2019. The grant, which can be applied for annually by young carers with significant caring responsibilities, aims to provide financial support to young carers in the form of a single payment of £300. For context, Carer’s Allowance was set at £66.15 per week during this survey year.
Numerous other minor updates and changes to the questionnaire have been made to reflect changing categories, definitions etc. and in response to feedback on the operation of the questionnaire from interviewers.
7. Population and sample selection methodology
The FRS sample is designed to be representative of private households in the United Kingdom.
The sampling frame in Great Britain
The Great Britain FRS sample is drawn from the Royal Mail’s small users Postcode Address File (PAF). The small users PAF is limited to addresses which receive, on average, fewer than 50 items of post per day and which are not flagged with Royal Mail’s “organisation code”. An updated version of this list is obtained twice a year.
By using only the small-user delivery points most large institutions and businesses are excluded from the sample. Small-user delivery points which are flagged as small business addresses are also excluded. However, some small businesses and other ineligible addresses remain on the sampling frame. If sampled, they are recorded as ineligible once the interviewer verifies that no private household lives there.
The sample design in Great Britain
The Great Britain FRS uses a stratified clustered probability sample design. The survey samples 1,417 postcode sectors, from around 9,200 in Great Britain, with a probability of selection that is proportional to size. Each postcode sector is known as a Primary Sampling Unit (PSU).
The PSUs are stratified by 27 regions and three other variables, described below, derived from the 2011 Census of Population. Stratifying ensures that the proportions of the sample falling into each group reflect those of the population.
Within each region the postcode sectors are ranked and grouped into eight equal bands using the proportion of households where the household reference person (HRP) is in National Statistics Socio-Economic Classification (NS-SEC) 1 to 3. Within each of these eight bands, the PSUs are ranked by the proportion of economically active adults aged 16-74 years and formed into two further bands, resulting in sixteen bands for each region. These are then ranked according to the proportion of economically active men aged 16-74 years who are unemployed. This set of stratifiers is chosen to have maximum effectiveness on the accuracy of two key variables: household income and housing costs. The table below summarises the stratification variables.
Within each PSU a sample of addresses is selected. In 2019 to 2020, 28 addresses were selected per PSU. The total Great Britain set sample size in 2019 to 2020 was 39,676 addresses. Each address had approximately a 1-in-705 chance of being included in the survey. For England and Wales each address had approximately a 1-in-772 chance of inclusion in the survey. In order to improve the quality of estimates for Scotland the PSUs in Scotland are over-sampled. Approximately twice the numbers of PSUs were sampled in Scotland than would be required under an equal-probability sample of the UK. Therefore, 6,832 addresses were selected in Scotland, with approximately a 1-in-385 chance of being included in the survey.
FRS sample stratification variables for Great Britain
| Strata | |
|---|---|
| Regions | 19 in England (including Metropolitan vs non-Metropolitan split |
| Regions | 4 in London |
| Regions | 2 in Wales |
| Regions | 6 in Scotland |
| The proportion of households where the HRP is in NS-SEC 1 to 3 | 8 equal bands |
| The proportion of economically active adults aged 16-74 | 2 equal bands |
| The proportion of economically active men aged 16-74 who are unemployed | Sorted within above bands |
Each year, half of the PSUs are retained from the previous year’s sample, but with new addresses chosen; for the other half of the sample, a fresh selection of PSUs is made (which in turn will be retained for the following year). This is to improve comparability between years.
The sampling frame in Northern Ireland
The sampling frame employed on the Northern Ireland FRS is the NISRA Address Register (NAR). The NAR is developed within NISRA and is primarily based on the Land and Property Services (LPS) Pointer database, the most comprehensive and authoritative address database in Northern Ireland, with approximately 745,000 address records available for selection.
The sample design in Northern Ireland
A systematic random sample of 4,080 addresses was selected for the 2019 to 2020 Northern Ireland FRS from the NISRA Address Register. Addresses are sorted by district council and ward, so the sample is effectively stratified geographically. Each address had approximately a 1-in-183 chance of being selected for the survey.
8. Data collection
Data collection in Great Britain
A consortium consisting of the Office for National Statistics (ONS) and NatCen Social Research conducts fieldwork for the FRS in Great Britain on behalf of the Department for Work and Pensions (DWP).
Each month the PSUs are systematically divided between the two organisations and then assigned to the field staff.
Before interviewers visit the selected addresses, a letter is sent to the occupier explaining that they have been chosen for the survey and that an interviewer will call. The letter also explains that the survey relies on the voluntary co-operation of respondents and emphasises that information given in the interview will be treated in the strictest confidence and used only for research and statistical analysis purposes. As a token of appreciation and to encourage participation, a £10 Post Office voucher is included with the letter.
In 2019 to 2020, ONS interviewers averaged about five calls per address before returning the address as a non-contact. This data is not currently available for NatCen and NISRA interviewers. Addresses returned as non-contacts or partial refusals can be re-issued to another interviewer where appropriate, in the hope that an interview at the non-responding household can still be achieved. Interviewing at re-issued addresses can be carried out at any point in the remaining survey year.
Data collection in Northern Ireland
In Northern Ireland the sampling and fieldwork for the survey are carried out by the Central Survey Unit at the Northern Ireland Statistics and Research Agency. The responsibilities for programming the survey questionnaire, making annual modifications, initial data processing and data delivery are retained within ONS and NatCen.
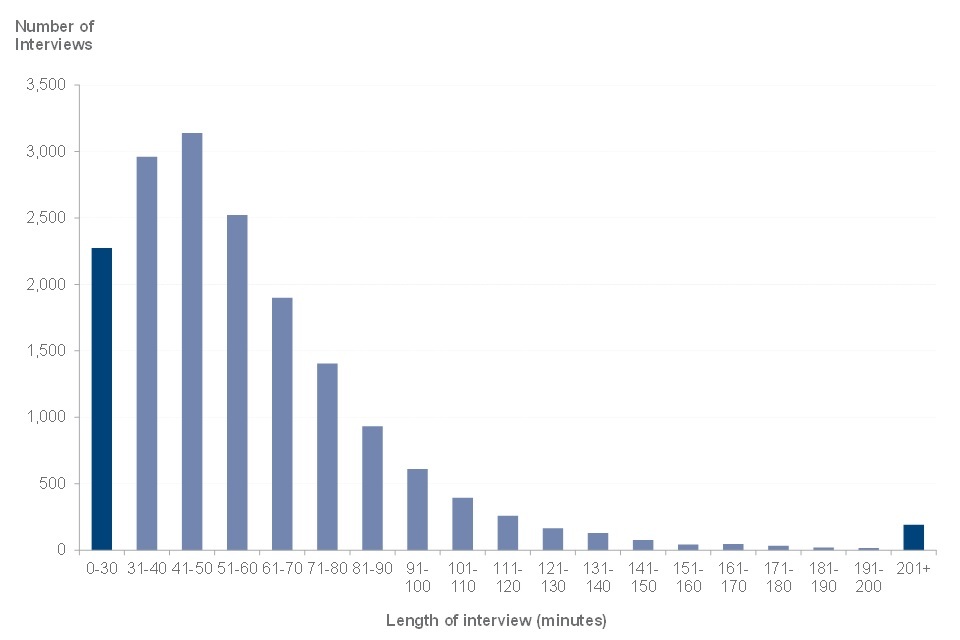
Length of interview
Interviews are conducted face-to-face. The length of each fully co-operating interview is recorded by the interviewer. In 2019 to 2020 the median face-to-face interview length for Great Britain was 52 minutes, but the time varies according to the size of household and its circumstances. The distribution of interview lengths in Great Britain is shown below, with full data in Methodology Table M.7. The timings exclude interviewer time spent preparing for and completing administration tasks after the face-to-face interview and are based on completed audit data from 17,128 fully productive ONS and NatCen interviews.
Distribution of FRS interview lengths, 2019 to 2020, Great Britain
Respondent Burden
The Code of Practice for Statistics states that producers of statistics should consider the burden on survey respondents. The FRS can measure the burden placed on respondents by using measured interview times for 17,128 full interviews, in Great Britain.
Great Britain Respondent burden is calculated as Number of responses x Median interview time
The median interview time for these 17,128 interviews was 52.2 minutes. Therefore, the respondent burden for the FRS in 2019 to 2020 was 894,100 minutes [621 days].
Multi-household procedures
If more than one household receives mail at an address a single household is interviewed. Multi households are not selected in Northern Ireland.
Ineligible addresses
Addresses containing no private households are classed as ineligible and excluded. The most common types of excluded addresses are non-residential or vacant addresses, and addresses that contain only communal establishments, such as hostels, hotels, and boarding houses.
9. The FRS questionnaire
FRS interviews are conducted using Computer Assisted Personal Interviewing (CAPI). The questionnaire is divided into three parts. The first part is the household schedule which is addressed to one person in the household (usually the household reference person, although other members are encouraged to be present) and mainly asks household level information, such as relationships of individuals to each other, tenure and housing costs. Next is the individual schedule which is addressed to each adult in turn and asks questions about employment, benefits and Tax Credits, pensions, investments, and other income. Information on children in the household is collected by proxy from a responsible adult. A final section asks the value of investments by type for respondents with savings between £1,500 and £20,000.
Interviewers new to the FRS are briefed on the questionnaire and an annual re-briefing is given to all interviewers on changes to the questionnaire. Those who have been working on the survey for some time also complete a written field report each year, describing their experiences with particular parts of the questionnaire and commenting on how changes are received in the field.
Prior to the start of fieldwork, DWP consults FRS users and draws up a list of possible questionnaire changes. Users are asked to identify individual questions or sections which were no longer of interest. The FRS questionnaire is lengthy and demanding and a key concern is, where possible, to reduce (or at least not increase) its length, so as not to overburden respondents or interviewers.
As part of the process of agreeing annual changes, suggestions from contractors are also considered, as well as those arising from an evaluation of feedback from interviewers. Any changes to the questionnaire are checked for consistency with the harmonised standards for Government social surveys.
Consultation of Documentation
Interviewers encourage respondents to consult documentation at all stages of the interview to ensure that the answers provided are as accurate as possible. For some items whether or not certain documents are consulted is recorded on the questionnaire. This assists FRS users in assessing the accuracy of the data.
- Employees have consulted their latest payslip for 32% of jobs they have reported. Of all employees, 93% reported to have one job only and seven per cent reported to have more than one job
- Employees did not have a payslip to consult for seven per cent of jobs they have reported; 22% could not consult a payslip because their payslips were only received electronically
- Fifty-six per cent of all reported benefit and payable Tax Credit receipt involved consultation of documentation (a letter from DWP or HM Revenue and Customs, or a bank statement)
- Fifty-four per cent of households in Great Britain consulted a Council Tax bill or statement in answering questions on their Council Tax payments
Response
Response in the FRS, 2019 to 2020, United Kingdom
In each eligible household, the aim is to interview all adults aged 16 years and over, except those aged 16 to 19 years who were classed as dependent children. A household is defined as fully co-operating when it meets this requirement and there are fewer than 13 ‘don’t know’ or ‘refusal’ answers to monetary amount questions in the benefit unit schedule (i.e. excluding the assets section of the questionnaire).
Proxy interviews are accepted when a household member is unavailable for interview. In 2019 to 2020, for those households classed as fully co-operating, proxy responses were obtained for 22% of adults.
It should be noted that all data shown in the main body of this publication refer only to fully co-operating households. Households that are not fully co-operating are further classified as partially co-operating, refusals, or unable to make contact. To be classified as partially co-operating a full interview has to be obtained from the Household Reference Person’s (HRP’s) benefit unit.
This table summarises the household response. The UK-wide sample chosen for 2019 to 2020 consisted of 43,756 households. Eligibility of the households was confirmed and the total number of households was adjusted to reflect only the households that were fully eligible. In total, 4,419 households were found to be ineligible. Households are classed as ineligible if they are empty or if they do not contain any private households.
A further 1,169 households were identified as households with unknown eligibility, where the interviewer was unable to establish whether the property was a residential address (e.g. the property was inaccessible). Addresses of unknown eligibility have been allocated as eligible and ineligible proportional to the levels of eligibility for the remainder of the sample. The total number of ineligible household post-adjustment was 4,540 and the effective, post-adjustment sample was 39,216 households.
In total 19,244 households UK-wide fully co-operated (49%), 375 partially co-operated (one per cent) and 15,990 refused to proceed with the interview (41%). The interviewer was unable to make contact with 2,559 households (seven per cent) and 1,048 households were of unknown eligibility (three per cent).
Response rates are calculated as follows:
The number of fully co-operating households, multiplied by 100 / Divided by the number of eligible households after adjustment
The overall response rate for the FRS in 2019 to 2020 was 49%.
When respondents refuse to participate in the FRS, interviewers record up to three reasons for refusal. The most common reasons for refusal in 2019 to 2020 are shown below
Reasons for refusal to participate in the FRS, Great Britain, 2019 to 2020
| Reason for refusal | Percentage of households |
|---|---|
| Couldn’t be bothered | 25 |
| Invasion of privacy | 18 |
| Genuinely too busy | 17 |
| Don’t believe in surveys | 17 |
| Concerns about confidentiality | 9 |
| Disliked survey of income | 8 |
| Personal problems | 6 |
| Anti-government | 5 |
| Temporarily too busy | 4 |
| Total number who gave a reason for refusal | 9,211 |
| Total number of refusals | 12,825 |
This table shows response rates broken down by region. Yorkshire and the Humber had the highest response rate in England, where 55% of all households selected responded fully. London had the lowest response rate where 42% of the chosen households fully co-operated. The variations in response rates reflect those of other major surveys and the Census of Population i.e. response rates are generally lower in large city areas.
Non-response
The lower the response rate to a survey, the greater the likelihood that those who responded are significantly unlike those who did not, and so the greater the risk of systematic bias in the survey results. Unless information is available about the nature and extent of such bias there are likely to be problems in generalising the sample results to the population.
For a United Kingdom survey of the size and complexity of the FRS, the total non-response rate in 2019 to 2020 of 51% is not considered unreasonable. However, any information that can be obtained about the non-respondents is useful both in terms of future attempts to improve the overall response rate and potentially in improving the weighting of the sample results. It is considered to be important for the FRS to obtain as much information as possible about non-respondents. The following sections outline some of the analyses that have been carried out in this area.
Non-response and Council Tax band
Comparisons were made by country between 2019 to 2020 Great Britain FRS data and administrative data on the number of households within each Council Tax band.
Methodology Table M.3 shows that FRS percentages were similar to those obtained from examining administrative data.
Non-response form analysis
Direct information about the non-responding households is valuable, although by definition difficult to obtain. However, some non-responding households who are not willing to take part in the full survey are willing to provide some basic information by completing a non-response form. Analysis of these forms is used to monitor characteristics of non-respondents and trends in non-response.
10. Validation, editing, conversion and imputation
In addition to unit non-response, where a household does not participate, a problem inherent in all large surveys is item non-response. This occurs when a household agrees to give an interview, but either does not know the answer to certain questions or refuses to answer them. This does not prevent them being classified as fully co-operating households because there is enough known data to be of good use to the analyst (although see the first paragraph of the Response section above for information about non-response to monetary questions).
The fact that the FRS allows missing values in the data collection can create problems for users, so missing values are imputed where appropriate. The policy is that for variables that are components of key derived variables, such as total household income and housing costs, and areas key to the work of DWP, such as benefit receipt, there should be no missing information in the final data.
In addition to imputation, prior to publication FRS data are put through several stages of validation and editing. This ensures the final data presented to the public are as accurate as possible.
The stages in the validation, editing, conversion and imputation process are laid out below:
Stage one – the interview
One of the benefits of interviewing using CAPI is that in-built checks can be made at the interview stage. This helps to check respondents’ responses and also that interviewers do not make keying errors. There are checks to ensure that amounts are within a valid range and also cross-checks which make sure that an answer does not contradict a previous response. However, it is not possible to check all potential inconsistencies, as this would slow down the interview to an unacceptable degree, and there are also capacity constraints on interviewer notes. FRS interviewers can override most checks if the answers are confirmed as accurate with respondents.
Stage two – post-interview checks
Once an interview has taken place, data are returned to ONS, NatCen, or NISRA. At this stage, editing takes place, based on any notes made by interviewers. Notes are made by the interviewer when a warning has been overridden, for example, where an amount is outside the expected range, but the respondent has documentation to prove it is correct. Office-based staff make editing decisions based on these notes. Other edits taking place at this stage are checking amounts of fixed-rate benefits and, where possible, separating multiple benefit payments into their constituent parts, such as separating Disability Living Allowance into the Care and Mobility components.
Stage three – data conversion
Before further validation, FRS data are converted from CAPI format into SAS readable tables. Using DWP specifications, SAS tables are created by ONS, with each table displaying information from different parts of the questionnaire. Both DWP and ONS then carry out validation checks on key input and output variables to ensure that the data have converted correctly to the new format. Checks include ensuring that the number of adults and children recorded is correct, and that records are internally consistent.
Stage four – state support validation
Information on benefit and tax credit receipt is one of the key areas of the FRS, and it is very important that this section is thoroughly validated and cleaned.
It is not appropriate to use the imputation methods outlined in stages five and six (below) for benefits data so instead a separate procedure of validation and editing is used. The following types of validation were carried out for 2019 to 2020 FRS data:
Missing values
For cases where a respondent had answered ‘yes’ to whether they are in receipt of a particular benefit, but did not give the amount received, an imputation decision has been made, depending on the benefit. For benefits such as Universal Credit, where the rate could vary greatly depending on the situation of the respondent, individual benefit assessments have been carried out. However, for benefits such as State Pension, where fewer rates apply, a more general method has been used.
Near-zero amounts
Where benefit amounts are recorded as near-zero, the case is examined individually and an edit decision is made.
Multiple benefits
Any combined benefit amounts (for example where State Pension is paid with Attendance Allowance) are edited by carrying out benefit entitlement assessments on individual cases, while preserving the reported total wherever possible.
Validation reports
Computer programs are run to carry out a final check for benefit entitlement and to output any cases that look unreasonable. All cases detected as a result of this validation exercise are individually checked and edited where necessary.
Stage five – other pre-imputation cleaning
In preparation for imputing missing values, data are made as clean as possible. This involves edits and checks of the following nature:
Weekly amounts
In the FRS, most monetary amounts are converted to a weekly equivalent. To calculate this, respondents are usually asked the amount, then the length of time this amount covered. The latter is known as a “period code”. Period codes are used in conjunction with amounts to derive weekly figures for all receipts and payments. Some variables, such as interest on savings accounts, refer to the amount paid in the whole of the past year. These are also converted to a weekly amount.
Sometimes the period code relates to a lump sum or a one-off payment. In these cases, the corresponding value does not automatically convert to a weekly amount. In order for the data to be consistent across the survey, edits are applied to convert most lump sums and one-off payments to weekly amounts. In the same way, where period codes are recorded as ‘don’t know’ or ‘refused’, these are imputed so that the corresponding amount can be converted to a weekly value in the final dataset.
Near-zero amounts
It is not possible for interviewers to enter zero amounts where it is inappropriate to do so. For example, in response to a question on receipt of benefit, a zero amount will result in a warning message being displayed. Some interviewers try to avoid this message by recording near-zero amounts. As a result, all near-zero values are examined and a decision taken as to whether the value is genuine or whether the value should be treated as missing.
Outliers
Statistical reports of the data are produced to show those cases where an amount was greater than four standard deviations from the mean. For the seven largest values over this limit, the individual record is examined and where necessary (but only if a value looks unrealistic), the case is edited. The outliers remaining in the dataset are verified by examining other relevant data. Compared with earlier FRS years, only a small number of these edits are now carried out, because of the many range checks in the CAPI questionnaire.
Credibility checks
Checks are carried out for the internal consistency of certain variables. For example, one check on mortgage payments ensures that payments to the mortgage from outside the household are not greater than the mortgage payment itself. Such cases are examined and edited where necessary.
Stage six – imputation
The responses to some questions are much more likely to have missing values than others. For example, it is very unlikely that a respondent will refuse to give or will not know their age or marital status; whereas it is much more likely that they will not be able to provide precise information on the amount of interest received from their investments.
Two areas where missing values are a problem are (1) income from self employment and (2) income from investments. Results in the tables provided in this publication include imputed values. Elsewhere however, values are left to remain as missing in some variables (such as hours of care).
This table illustrates the extent of missing values. Of the 13.6 million set values in the 2019 to 2020 FRS dataset, one per cent were originally recorded as either ‘don’t know’ or ‘refused’. Out of 129,611 missing values, approximately 89% were then imputed. The main imputation methods are summarised below, in the order in which they were applied.
Closing down routes
As with any questionnaire, a typical feature of the FRS is a gatekeeper question positioned at the top of a sequence of questions, at which a particular response will open up the rest of the sequence. If the gatekeeper question is answered as ‘don’t know’ or ‘refused’ then the whole sequence is skipped.
A missing gatekeeper variable could be imputed such that a further series of answers would be expected. However, these answers will not appear because a whole new route has been opened. For example, if the amount of rent is missing for a record and has since been imputed, any further questions about rent would not have been asked. From the post-imputed dataset, it will appear that these questions should have been asked because a value is present for rent.
For this reason, where the gatekeeper question has been skipped the onward routes should be closed down. In most cases, gatekeeper variables are of the ‘yes or no’ type. If missing, these would be imputed to ‘no’, assuming that if a respondent does not know whether an item is received or paid, then it is not.
Hot-decking
This process looks at characteristics within a record containing a missing value to be imputed, and matches it up to another record with similar characteristics for which the variable is not missing. It then takes the known variable and copies it to the missing case. For example, when imputing the Council Tax Band of a household, the number of bedrooms, type of accommodation and region are used to search for a case with a similar record. This method ensures that imputed solutions are realistic, and allows a wide range of outcomes which maintain variability in the data.
Algorithms
These are used to impute missing values for certain variables, for example variables relating to mortgages. The algorithms range from very simple calculations to more sophisticated models, based on observed relationships within the data and individual characteristics, such as age and gender.
‘Mop-up’ imputation
This is achieved by running a general validation report of all variables and looking at those cases where missing values are still present. At this stage, variables are examined on a case-by-case basis to decide what to impute. Credibility checks are re-run to identify any inconsistencies in the data caused by imputation, and further edits are applied where necessary. All imputations, by each of the methods above, are applied to the un-imputed dataset via a transaction database. This ensures auditability in that it is always possible to reproduce the original data.
Points to note with imputed data
- Whilst several processes are used to impute missing values, it should be remembered that they represent only a very small proportion (typically one per cent) of the dataset as a whole
- Imputation will have a greater effect on the distribution of original data for variables that have a higher proportion of non-response, as proportions of imputed data will be higher
- As mentioned above, in certain situations, imputed values will be followed by ‘skipped’ values. It was decided in some cases that it was better to impute the top of a route only, and not large amounts of onward data. For a small proportion of imputed values, it is not possible to close down a route. These cases are followed by ‘skipped’ responses (where a value might otherwise be expected)
Stage seven – derived variables
Derived variables (DVs) are those which are not created by the original interview, but instead are made by combining information, both within the survey and from other sources.
They are created at the FRS user’s request. Their main purpose is to make it easier for users to carry out analysis and to ensure consistent definitions are used in all FRS analyses. For example, INDINC is a DV which sums all components of income to find an individual’s total income. This is possible because of the various sources collected by the survey. As new information is collected in the survey, the relevant DVs are updated as necessary.
11. Grossing
The FRS publication presents tabulations where the percentages refer to sample estimates grossed-up to apply to the whole population. Grossing-up is the term given to the process of applying factors to sample data so that they yield estimates for the overall population. The simplest grossing system would be a single factor e.g. the number of households in the population divided by the number in the achieved sample. However, surveys are normally grossed by a more complex set of grossing factors that attempt to correct for differential non-response, at the same time as they scale up sample estimates.
The system used to calculate grossing factors for the FRS divides the sample into different groups. The groups are designed to reflect differences in response rates among different types of household. The FRS stratified sample structure is designed to minimise differential non-response in the achieved sample. Grossing is then designed to account for residual differential non-response.
They have also been chosen with the aims of DWP analysis in mind. The population estimates for these groups, obtained from official data sources, provide control variables. The grossing factors are then calculated in a way which ensures the FRS produces population estimates that are as close as possible to the control variables. As an example, a grossed FRS count of the number of men aged 35-39 years would be consistent with the ONS population estimates of the same group.
In developing the grossing regime careful consideration has been given to the combination of control totals, and the way age ranges, Council Tax Bands and so on, are grouped together. The aim has been to strike a balance so that the grossing system will provide, where possible, accurate estimates in different dimensions without significantly increasing variances.
Some adjustments are made to the original control total sources so that definitions match those in the FRS, e.g. an adjustment is made to the demographic data to exclude people whose residence is not a private household. It is also the case that some totals have to be adjusted time-wise, to correspond to the FRS survey year which runs from April to March.
A software package called CALMAR, provided by the French National Statistics Institute, is used to reconcile control variables at different levels and estimate their joint population. This software makes the final weighted sample distributions match the population distributions through a process known as calibration weighting. It should be noted that if a few cases are associated with very small or very large grossing factors, grossed estimates will have relatively wide confidence intervals.
A review of the FRS grossing methodology was carried out by the ONS Methodological Advisory Service in 2013.
A number of relatively minor methodological improvements were made as a result, with the grossing calculations updated to use 2011 Census data at that point. Further details on the methodological changes have also been published.
Both Great Britain and Northern Ireland data use the same CALMAR software to reconcile control variables at different levels, and estimate their joint population. There are minor differences between the methods used to gross the Northern Ireland sample as compared with the Great Britain sample:
- Local taxes in Northern Ireland are collected through the rates system, so Council Tax Band is not applicable as a control variable
- Northern Ireland housing data are based largely on small-sample surveys. It is not desirable to introduce the variance of one survey into another by using it to compute control totals; therefore tenure type is not used as a control variable
Details of the control variables used in the grossing regimes for Great Britain and Northern Ireland are shown below.
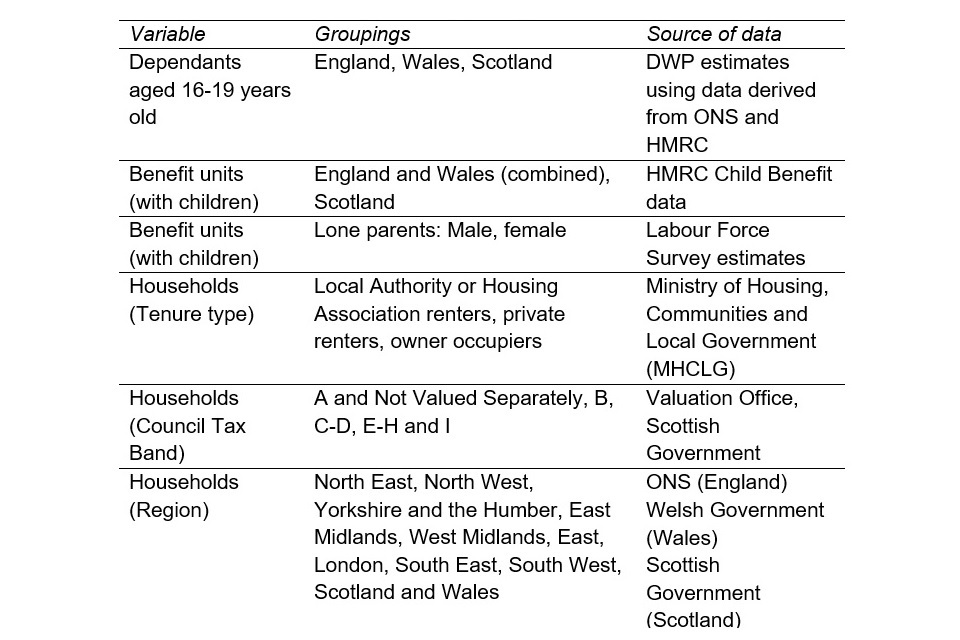
Grossing regime for Great Britain, 2019 to 2020
Control variables used to generate grossing factors for private households
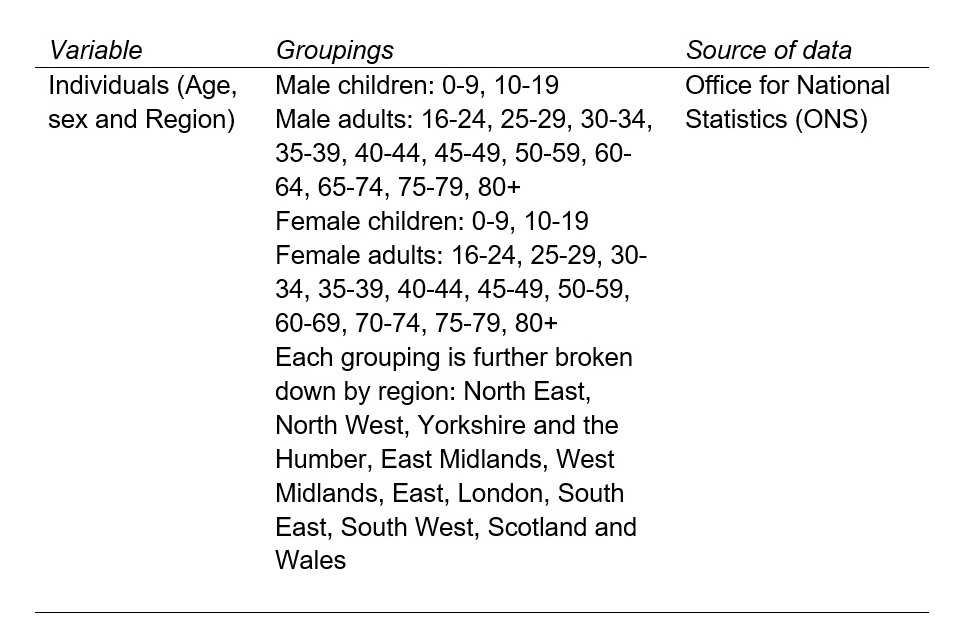
Control variables used to generate grossing factors for private households
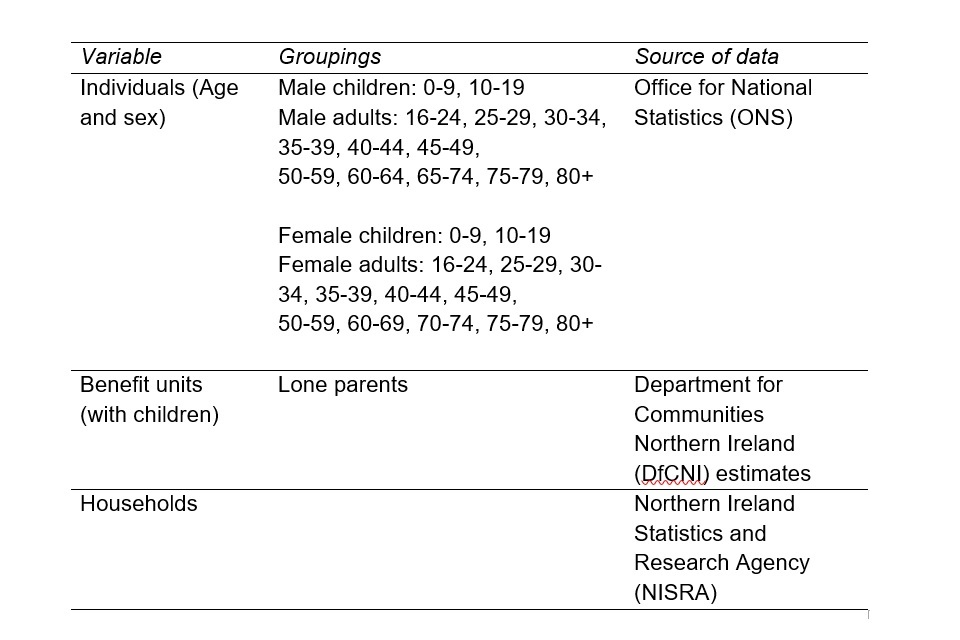
Grossing regime for Northern Ireland, 2019 to 2020
Control variables used to generate grossing factors for private households
12. Reliability of estimates
All survey estimates have a sampling error attached to them, calculated from the variability of the observations in the sample. From this, a margin of error (confidence interval) is estimated. It is this confidence interval, rather than the estimate itself, that is used to make statements about the likely ‘true’ value in the population; specifically, to state the probability that the true value will be found between the upper and lower limits of the confidence interval. In general, a confidence interval of the estimate plus or minus two standard errors is used to state, with 95% confidence, that the true value falls within that interval. A small margin of error will result in a narrow interval, and hence a more precise estimate of where the true value lies.
The sample in Great Britain for the FRS, as described earlier, is selected using a stratified multi-stage design, based on addresses clustered within postcode sectors. As a result, FRS sampling error is not just dependent on the variability among units in the sample (whether households or individuals), but is also a function of variability within and between postcode sectors. For example, if a sample characteristic is distributed differently by postcode sector (i.e. is clustered) the sampling variability is greater overall than would occur in a simple random sample of the same size. Therefore, the complex (actual) sampling error is normally greater than the standard error calculated under the assumption of simple random sampling.
The size of the actual standard error relative to the standard error calculated under the assumption of simple random sampling is represented by the design factor, which is calculated as the ratio of the two. Where the standard errors are the same, the design factor equals one, implying that there is no loss of precision associated with the use of a clustered sample design. In most cases, the design factor will be greater than one, implying that the estimates based on the clustered sample are less precise than those of a simple random sample of the same size. Conversely a design factor of less than one implies the estimate is more precise than would be obtained from a simple random sample.
Standard Errors
These tables provide standard errors, design factors and confidence intervals for a selection of variables from the 2019 to 2020 FRS. An example of how to interpret figures in this table follows:
Example: Standard errors for household composition, table SE.1
Table SE.1 shows that 72.0% of households did not contain any children. The standard error is estimated as 0.4%. This is the final estimate after rounding and taking into account the design factor.
The design factor for this variable is 1.1. That is, the effect of using a clustered sample rather than a simple random sample is a loss in precision of 10% on standard errors. In contrast, a design factor of 0.9 would have denoted a gain in precision of 10%.
The 95% confidence interval (of plus or minus two standard errors) is therefore between 71.2% and 72.8%. That is, if sampling error is the sole source of error, in 95 out of 100 samples the percentage of households without children will lie within this range.
The sampling errors shown are likely to be slightly larger than the true sampling errors because the software used for the calculation does not take into account the improvement in precision due to post-stratification.
See the linked paper for information on estimating variance and confidence intervals in special circumstances, for example where the occurrences of a response in the sample are very small.
In addition to sampling errors, consideration should also be given to non-sampling errors. Sampling errors arise through the process of random sampling and the influence of chance. Non-sampling errors arise from the introduction of some systematic bias in the sample compared with the population it is supposed to represent.
As well as response bias, such biases include inappropriate definition of the population; misleading questions; data input errors; data handling problems; or any other factor that might lead to the survey results systematically misrepresenting the population. There is no simple control or measurement for such non-sampling errors, although the risk can be minimised through careful application of the appropriate survey techniques from the questionnaire and sample design stages through to analysis of results.
13. Linking FRS data to administrative data
As a national statistic, and in line with the Code of Practice for Statistics (Value V4.1) DWP looks to improve the FRS, year on year.
A review of legal requirements for informed consent led to a successful trial of a new approach to achieving consent from January to May 2017. This was followed by a full rollout within Great Britain. The new approach was to inform people prior to interview that their responses would be linked. Participation in the survey thereby demonstrated consent to linking.
With implementation of the General Data Protection Regulation (GDPR) in May 2018, the survey moved away from consent as the legal basis and instead used the GDPR provision (Article 6.1.e). This allows data processing that is necessary for DWP to carry out its functions as a public body. This gives us a firm, ongoing legal basis to link all FRS respondents to their administrative records.
The FRS makes an up-front statement that DWP will link respondent information to administrative records held by DWP, as the responsible department for Great Britain. Northern Ireland retained an explicit consent question for the 2019 to 2020 survey. FRS data for these respondents are linked to DWP administrative data applying matching routines using a combination of date of birth, forename, surname and full postcode. Names and addresses of respondents are kept confidential and only made available to a small team of named staff at DWP who carry out the linking. Linked data are anonymised and only used for research and statistical purposes.
We have previously advised users of our intention to match those taking part in the survey to their benefit records. Matching happens across the range of administrative datasets available to DWP. The successful match rate for linking respondents to their administrative data was 95% in 2019 to 2020. This means that 89% of all United Kingdom FRS respondents have been matched to their administrative records.
This enables a check on the accuracy of monetary amounts reported during the interview, as well as the respondent’s eligibility for the various elements of state support.
For the current survey year, 2019 to 2020, some developments in this area have been taken forward. The matching exercise described above has supplied helpful information for the benefit recipients in the FRS sample. This was most notably the case for the Universal Credit data (UC), for which:
- It is likely to be harder for individuals to respond in terms of amounts, given that payments can vary each month, unlike the benefits UC replaces
- Respondents are asked for a single amount in the survey – we do not ask about different components
- The range of possible monetary values is wider than any other state benefit, running from zero to several hundred pounds per week
- The time taken to recalculate dubious amounts is longer than for other benefits, owing to the number of different components of the UC calculation
- There has been a substantial increase in the number of observations since the previous survey year, more than doubling since then
Given the above factors, editing reported UC amounts was a more challenging task than in previous surveys. Given the legal deadline to publish HBAI data by the end of March it is important to be efficient in survey processing. We have therefore made processing improvements to the benefit editing for Universal Credit, to automate previously complex and time consuming editing, through the use of administrative data.
The process looked at instances where people stated that they were receiving some form of state support; and where the amount reported was in some way questionable. The information then retrieved included respondents’ (true) amounts of benefit received, thus allowing closer editing of benefit rates than would otherwise have been the case.
Please note that the current benefit editing approach is confined to editing the amounts of benefit reported by FRS respondents. It does nothing to correct for benefit caseload under-reporting, whether because of non-response or respondents not accurately reporting all benefits they receive.
It should also be noted that the matching process, specifically, has continued to go through several iterations and refinements during 2020. Development will continue through 2021, in support of next year’s publication, and beyond. We will engage further with users on our plans.
We make comparisons of FRS survey and administrative data in a number of ways. Please see Methodology tables, M.6a and M.6b, for a summary of how FRS benefit caseloads and amounts compare with DWP administrative data. In particular, the benefit caseload undercounts for Housing Benefit (HB) and Personal Independence Payment (PIP) were greater in 2019 to 2020 than in 2018 to 2019.
These are outlined in the following tables.
M6a compares the grossed number of benefit recipients in the FRS 2019 to 2020 data, with the total caseload on benefits from administrative data sources. For almost all benefits, and as in previous years, the FRS numbers in receipt are below those seen in administrative data.
M6b compares the average weekly receipt of state support in the FRS 2019 to 2020 data, with the average weekly receipt of state support from the administrative data sources. Some benefit types have not been included in this analysis because no directly comparable administrative data source is available.
M8 shows the percentage of adults in receipt of DWP benefits for the 2019 to 2020 survey year, according to FRS and administrative data linked at a record level. It can be seen that some benefits are better represented on the FRS than others. For example, 99% of adults in receipt of State Pension are represented on the FRS, while only 63% of those in receipt of Attendance Allowance are.
Percentage of adults shown in receipt of DWP benefits, FRS and administrative data, 2019 to 2020, United Kingdom
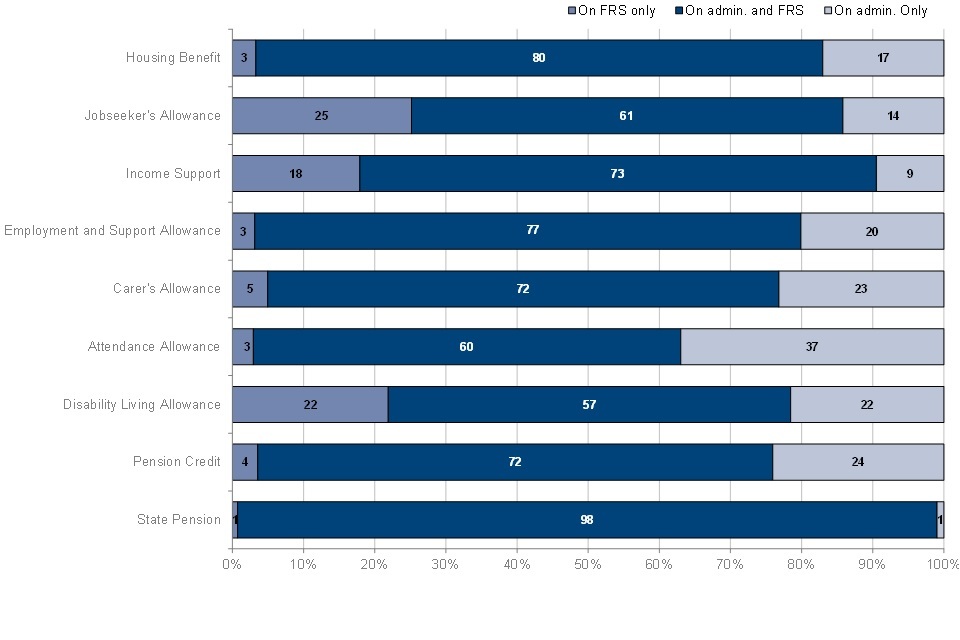
14. Glossary
This glossary provides a brief explanation for each of the key terms used in the Family Resources Survey (FRS). Further details on these definitions, including full derivations of variables, are available on request from the FRS team team.frs@dwp.gov.uk.
Adult
All individuals who are aged 16 and over are classified as an adult, unless the individual is defined as a dependent child. All adults in the household are interviewed as part of the FRS.
Age
Respondent’s age at last birthday (at the time of the interview).
Automatic Enrolment
Automatic enrolment requires all employers to enrol their eligible workers into a workplace pension scheme if they are not already in one. This enrolment also commits the employer to make contributions into the employee’s pension. The staged timetable began in October 2012 for larger firms, with enrolment for all employers completed in 2018. In order to preserve individual responsibility for the decision to save, workers can opt out of the scheme.
To be eligible for automatic enrolment, the jobholder must be at least 22 years old, under State Pension age, earn above the earnings threshold for automatic enrolment, and work or usually work in the UK.
However, those not eligible for automatic enrolment may be entitled to opt in. Those people now defined as self-employed could have been a member of an employer scheme, from auto-enrolment, but are entitled to remain in their auto-enrolled scheme and make their own contributions. Likewise, someone now an employee, who was self-employed can have employer contributions into their previous scheme.
For more information see this pensions guide
Benefit Unit or Family
A benefit unit may consist of: a single adult, or a married or cohabiting couple, plus any dependent children. Same-sex partners (civil partners and cohabitees) have been included in the same benefit unit since January 2006. Where a total for a benefit unit is presented (such as total benefit unit income) this includes both income from adults plus any income from children.
There are various types of benefit unit:
- Pensioner couple: Benefit units headed by a couple where the head of the benefit unit is over State Pension age. Note that this differs from definitions used in the Households Below Average Income, Income Dynamics and Pensioners’ Incomes Series reports. These publications define a benefit unit as a pensioner couple if either the head of the benefit unit or their partner is over State Pension age
- Pensioner couple, married or civil partnered: Benefit units headed by a couple where the head of the benefit unit is over State Pension age and the couple are either married or in a civil partnership
- Pensioner couple, cohabiting: Benefit units headed by a couple where the head of the benefit unit is over State Pension age, and the couple are neither married nor in a civil partnership
- Single male pensioner: Benefit units headed by a single male adult over State Pension age
- Single female pensioner: Benefit units headed by a single female adult over State Pension age
- Couple with children: Benefit units containing two adults, headed by a non-pensioner, with dependent children
- Couple with children, married or civil partnered: Benefit units containing two adults, headed by a non-pensioner, with dependent children and the couple are either married or in a civil partnership
- Couple with children, cohabiting: Benefit units containing two adults, headed by a non-pensioner, with dependent children and the couple are neither married nor in a civil partnership
- Couple without children: Benefit units containing two adults, headed by a non-pensioner, with no dependent children
- Couple without children, married or civil partnered: Benefit units containing two adults, headed by a non-pensioner, with no dependent children and the couple are either married or in a civil partnership
- Couple without children, cohabiting: Benefit units containing two adults, headed by a non-pensioner, with no dependent children and the couple are neither married nor in a civil partnership
- Single with children: Benefit units containing a single adult (male or female), headed by a non-pensioner, with dependent children
- Single male without children: Benefit units containing a single male adult, headed by a non-pensioner, with no dependent children
- Single female without children: Benefit units containing a single female adult, headed by a non-pensioner, with no dependent children
Benefits
Financial support from the Government. Most of these benefits are administered by DWP. The major exceptions are Housing Benefit and Council Tax Reduction, which are administered by local authorities. Child Benefit is administered by HM Revenue and Customs, who also administer Tax Credits. These are not treated as benefits, but both Tax Credits and benefits are included in the term State Support. Tax Credits will ultimately be superseded by Universal Credit.
Benefits are often divided into income-related benefits and non-income-related benefits. In assessing entitlement to the former, the claimant’s income and savings will be checked against the rules of the benefit. In contrast, eligibility for non-income-related benefits is dependent on the claimant’s circumstances (a recent bereavement, for example), rather than their income and savings. A list of the main state benefits can be found in the tables below.
United Kingdom benefits
| Income-related benefits | Non-income-related benefits |
|---|---|
| Council Tax Reduction | Armed Forces Compensation Scheme |
| Employment and Support Allowance (income-related element) | Attendance Allowance |
| Extended Payments (Council Tax Reduction and Housing Benefit) | Bereavement or Widowed Parent’s Allowance |
| Housing Benefit | Bereavement Support Payment |
| Income Support | Carer’s Allowance |
| Jobseeker’s Allowance (income-based element) | Child Benefit |
| Pension Credit | Disability Living Allowance (both mobility and care components) |
| Social Fund – Funeral Grant | Employment and Support Allowance (contributory element) |
| Social Fund – Sure Start Maternity Grant | Guardian’s Allowance |
| Universal Credit | Jobseeker’s Allowance (contributory element) |
| Incapacity Benefit | |
| Industrial Injuries Disablement Benefit | |
| Personal Independence Payment (Daily Living and Mobility components) | |
| Severe Disablement Allowance | |
| State Pension | |
| Statutory Maternity, Paternity or Adoption Pay | |
| Statutory Sick Pay | |
| Winter Fuel Payments |
Northern Ireland benefits
| Income related benefits | Non Income related benefits |
|---|---|
| Northern Ireland Other Rate Rebate | Northern Ireland Disability Rate Rebate |
| Northern Ireland Rate Rebate through energy efficient homes | Northern Ireland Lone Pensioner Rate Rebate |
| Northern Ireland Rate Relief | |
| Rates Rebate |
‘Disability-related benefits’ is the term used to describe all benefits paid on the grounds of disability. These are Personal Independence Payment, Disability Living Allowance, Severe Disablement Allowance, Attendance Allowance, Armed Forces Compensation Scheme, Industrial Injuries Disablement Benefit and Northern Ireland Disability Rate Rebate.
Before 2008 to 2009 Incapacity Benefit was also in this group. The number of people on Incapacity Benefit (IB), and Severe Disablement Allowance (SDA) has been steadily decreasing over time, as both were replaced by Employment and Support Allowance from October 2008. SDA and some other benefits now have sample sizes which are too small to be presented separately in this publication.
Child
A dependent child is defined as an individual aged under 16. A person will also be defined as a child if they are 16 to 19 years old and they are:
- Not married nor in a civil partnership nor living with a partner
- Living with parents (or a responsible adult)
- In full-time non-advanced education or in unwaged government training
Child Benefit
This is a non-income related benefit in terms of eligibility, but remains taxable in households where one adult is earning more than £50,000 per year.
Council Tax
The tax is based on a set of bands that a property’s value falls into, and is evaluated accordingly by each council. Its headline rate is based on two adults per household.
Disability
The definition of disability used in this publication is consistent with the core definition of disability under the Equality Act 2010. A person is considered to have a disability if they “have a physical or mental impairment that has a ‘substantial’ and ‘long-term’ negative effect on their ability to do normal daily activities”. Where by ‘substantial’ means more than minor or trivial, and ‘long-term’ means 12 months or more. However, some individuals classified as disabled and having rights under the Equality Act 2010 are not captured by this definition:
- People with a long-standing illness or disability who would experience substantial difficulties without medication or treatment
- People who have been diagnosed with cancer, HIV infection or multiple sclerosis but who are not currently experiencing difficulties with their day-to-day activities
- People with progressive conditions, where the effect of the impairment does not yet impede their lives
- People who were disabled in the past but are no longer limited in their daily lives are still covered by the Act
This definition of disability differs from that used for Economic status.
Economic status
This classification follows the harmonised output category for economic status, based on respondents’ answers to the survey questions. All definitions conform to those of the International Labour Organization (ILO):
- Employee: where respondents have an arrangement with an employer, whereby work is done in exchange for a wage or salary. This would include those doing unpaid work in a business that a relative owns
- Self-employed: where respondents report regular working activities, which over time are responsible only to themselves (and not an employer). Various groups are classified as self-employed, including farmers, doctors in private practice and some builders, as well as anyone whose job is habitually done on a freelance basis (for example, journalists or musicians). The self-employed include anyone doing work for their own business, but which is currently unpaid
Several respondents have more than one job. The FRS identifies which of these is their ‘main job’. This is the job which the respondent says is the dominant activity. Where they cannot decide, the number of hours worked will determine which is the main job. This process of categorisation also applies to respondents who are employees in one job but self-employed in another; whilst the survey will capture information on both of these jobs, only one can be their main job.
-
Unemployed: Adults who are under State Pension age and not working, but are available and have been actively seeking work in the last four weeks; includes those who were waiting to take up a job already obtained and were to start in the next two weeks
-
Economically inactive: Individuals who are both out of work, and not seeking or not available to work. There are several sub-categories:
- Retired: individuals who are over State Pension age, or say they are now retired
- Student: individuals who have not completed their education
- Looking after family or home: working-age individuals who are looking after their family or their home
- Permanently sick or disabled: working-age individuals who have been sick, injured or disabled for longer than 28 weeks
- Temporarily sick or disabled: working-age individuals who have been sick, injured or disabled for less than 28 weeks. Note that the sick or disabled definitions are different to that used for Disability, as they are based on different questions that are only asked of working-age adults who are not working
- Other inactive: all respondents not already classified above
Employment status
This classification is equivalent to economic status but includes those in employment only.
Ethnic group
The ethnic group to which respondents consider that they belong. Where respondents do volunteer their ethnicity, this is captured as one of 18 recognised groups. This is consistent with the harmonised principles for ethnicity, as set out by the Government Statistical Service, wherever social surveys are carried out.
- White
- Irish Traveller
- Mixed or Multiple ethnic groups
- Asian or Asian British
- Indian
- Pakistani
- Bangladeshi
- Chinese
- Any other Asian background
- Black or African or Caribbean or Black British
- Other ethnic group
Sample sizes for ‘Gypsy, Traveller or Irish Traveller’ are small. In Northern Ireland, ‘Irish Traveller’ is included in ‘Other ethnic group’ whereas elsewhere ‘Gypsy or Irish Traveller’ is included in ‘White’. The group ‘Arab’ is included in ‘Other ethnic group’.
Food Security
Harmonised Principles
The harmonised principles contain harmonised definitions, survey questions, standards for administrative data and standards for presentation. They have been developed by topic groups, after wide consultation with producers and customers across the GSS and beyond. Further information is available via the Government Statistical Service pages: https://gss.civilservice.gov.uk/guidances/harmonisation/
Full-time education
Individuals registered as full-time at an educational establishment. Students on sandwich courses are coded as working, or studying, depending on their position at the time of interview.
Head of benefit unit
If the household reference person does not belong to the benefit unit, then the head of benefit unit is simply the first person from that benefit unit, in the order they were named in the interview. If the household reference person does belong to the benefit unit, they are also the head of that benefit unit.
Household
A household consists of one person living alone or a group of people (not necessarily related) living at the same address, who share cooking facilities and share a living room or sitting room or dining area. A household will consist of one or more benefit units. Where a total value for a household is presented, such as total household income, this includes both income from adults plus any income from children.
Household Food Security
This is a measure of whether households have sufficient food to facilitate active and healthy lifestyles. This measure has four classifications:
- High food security (score = 0): The household has no problem, or anxiety about, consistently accessing adequate food
- Marginal food security (score = 1 or 2): The household had problems at times, or anxiety about, accessing adequate food, but the quality, variety, and quantity of their food intake were not substantially reduced
- Low food security (score = 3 to 5): The household reduced the quality, variety, and desirability of their diets, but the quantity of food intake and normal eating patterns were not substantially disrupted
- Very low food security (score = 6 to 10): At times during the last 30 days, eating patterns of one or more household members were disrupted and food intake reduced because the household lacked money and other resources for food
High and marginal food security households are considered to be “food secure”. Food secure households are considered to have sufficient, varied food to facilitate an active and healthy lifestyle. Conversely, low and very low food security households are considered to be “food insecure”. Food insecure households are where there is risk of, or lack of access to, sufficient, varied food.
Household Reference Person (HRP)
The highest income householder.
- In a single-adult household, the HRP is simply the sole householder (i.e. the person in whose name the accommodation is owned or rented)
- If there are two or more householders, the HRP is the householder with the highest personal income, taking all sources of income into account
- If there are two or more householders who have the same income, the HRP is the elder
Where we refer to ‘Head’ in tables relating to households, this is the HRP. The Head of benefit unit will not necessarily be the HRP.
Individual
An adult or child. Where ‘people’ are presented, this is all adults and children.
Informal carers
Individuals who provide any regular service or help to someone. That person can be within or outside of their household, and might be sick, disabled or elderly; this description excludes those who give this service or help as part of a formal job.
Marital status
This is the person’s de facto marital status:
- Married or Civil partnership: currently married or in a civil partnership, and not separated from spouse (excludes temporary absences)
- Cohabiting: not married nor in a civil partnership, but living as a couple
- Single: is not currently cohabiting and has never been married nor in a civil partnership
- Widowed: widowed and not currently cohabiting
- Separated: married or in a civil partnership, but separated from spouse and is not currently cohabiting
- Divorced or Civil partnership dissolved: marriage or civil partnership legally dissolved and is not currently cohabiting
Pension
- Employer-sponsored pension: schemes that are set up and run by the employer
- Occupational pension: an occupational pension scheme is an arrangement an employer makes to give their employees a pension when they retire. They are often referred to as ‘company pensions’. As of 2017 the Occupational Pension Schemes regulations brought restrictions on the Early Exit charges for those aged 55 and older, and are eligible to access the pension freedoms
There are two main types of occupational pension:
i) Defined-benefit (DB) schemes (also called salary-related pension or superannuation schemes). In a defined benefit scheme, the pension is based on the number of years you belong to the scheme and how much you earn. Your employer contributes to the scheme and trustees look after scheme members’ interests. Employees often have to pay contributions into the scheme on top of those made by the employer. Some schemes are ‘non-contributory’: The employee either makes no contributions, or makes a small contribution, typically 1%-2% of salary
ii) Defined-contribution (DC) schemes (also called Money purchase schemes). A defined contribution scheme can be a personal pension arranged by the individual or a workplace pension arranged by the employer (such as NEST). Money is paid in by the individual or the employer over time and is then invested by the pension provider. The size of the pension available to take out when the individual retires depends on how much was paid in and the level of growth from the investments. With a defined contribution pension the individual can also decide how to take their money out
-
Group personal pension: some employers who do not offer an occupational pension scheme may arrange for a third-party pension provider to offer employees a pension instead. The employer may have negotiated special terms with the provider, which means that administration charges are lower than those for individual personal pensions. Although sometimes still referred to as ‘company pensions’, they are not run by employers and should not be confused with occupational pensions, which have different tax, benefit and contribution rules
- Group stakeholder pension: like Group Personal Pensions, an employer can make an arrangement with a pension provider and offer their employees a Group Stakeholder Pension (see Stakeholder Pension)
- Personal pension: a pension provided through a contract between an individual and the pension provider. The pension which is produced will be based upon the level of contributions, investment returns and annuity rates; a personal pension can be either employer provided (see Group Personal Pension) or privately purchased (see Private pension)
- Private pension: includes occupational pensions (also known as employer-sponsored pensions) and personal pensions (including stakeholder pensions). People can have several different private pensions at once
- Stakeholder pension: enables those without earnings, such as non-earning partners, carers, pensioners and students, to pay into a pension scheme. Almost anybody up to the age of 75 may take out a stakeholder pension and it is not necessary to make regular contributions
For more information, see the GOV.UK pension guide.
Pension Credit
The qualifying age for Pension Credit has been increasing gradually in line with the increase in the State Pension age.
Region
Regional classifications are based on the standard statistical geography of UK Regions: nine in England, and a single region for each of Wales, Scotland and Northern Ireland. Tables will also show statistics for the United Kingdom, Great Britain, and England as a whole. Some split London into Inner and Outer where there is sufficient data to provide meaningful comparisons.
Savings
The total value of all liquid assets, including fixed-term investments. Pound amounts are informed by responses to questions on the value of assets or, in some cases, estimated from the interest on the savings. Note that banded savings do not include assets held by children in the benefit unit or household.
The FRS asks questions about all saving and investment products, including bank and building society accounts, and shares. These products go by many names. In this publication, the products are labelled as follows:
-
Basic bank account: This type of account is similar to a current account. Payments can be received from other sources and it can pay bills by direct debit, but unlike a current account there are no overdraft facilities. Withdrawals can be made from cash machines and, in some cases, over the counter of the bank or building society itself
-
Child Trust Funds (CTFs) have been replaced by Junior ISAs (JISAs) as the main tax-free savings account for children. See ISA.
-
Current account: This includes all accounts at both banks and building societies, which are used for day-to-day transactions; with a bank card. Overdraft facilities may be offered
-
Company share schemes (profit sharing): Some companies provide extra rewards or bonuses to their employees depending on the profitability of the company. In publicly traded companies, this often takes the form of shares in the company. This label is given to any scheme which follows this general principle
-
Credit union: A credit union is a financial co-operative similar in many respects to mainstream building societies. Its members both own and control the credit union, which is run solely for their benefit. All members of a specific credit union must share what is known as a “common bond” i.e. they must be connected in some way to the other members of that credit union. The members pool their savings into a single ‘pot’ from which loans can be made to members of the credit union. Members who have deposited money receive an annual dividend, while those to whom money is lent have to pay interest on the loan
-
Endowment policy (not linked): An endowment policy taken out to repay a mortgage but no longer used to do so. This is where the mortgage has either been paid off or, more usually, converted to a different method of repayment. The respondent has decided to retain the endowment as an investment in its own right, even though it is no longer intended to repay the mortgage
-
ISA: An Individual Savings Account (ISA) pays interest on a tax-free basis. To be eligible for a Junior ISA, children must be under 18 and living in the UK. Junior ISAs are now included at the question ChSave. There are two types of Junior ISA. A child can have both types; a cash Junior ISA; a stocks & shares Junior ISA. There is a limit on annual payments into JISAs
As with Child Trust Funds, the Junior ISA is a long-term savings account which can only be accessed by the child on their 18th birthday. The Junior ISA is then transferred to an Adult ISA so that the child can access their money.
- Investment trust: See Unit trusts
- National savings bonds: All types of National Savings investments in this category are collected on the survey, except Easy Access and Investment accounts:
- Fixed Rate Savings Bonds: replaced new issues of FIRST Option Bonds
- National Savings Certificates: yield earnings in either a fixed or index-linked manner, for lump sum savings of £100 or more. Maximum earnings are obtained after five years and interest on investments is tax free
- National Savings Income Bonds: minimum purchase is £2,000 and a maximum holding of £250,000; interest is paid monthly, and is gross of tax
- Children’s Bonus Bonds: can be bought for any child aged under 16 as a five-year accumulating investment; interest is paid gross of tax
- NS&I savings accounts: The National Savings & Investments (NS&I) Investment Account and Direct Saver
- Other bank or building society account: Accounts belonging to adults recorded under categories “savings account, investment account or bond, any other account with bank building society, etc.”
- Post Office card account (POCA): This type of account can only be used to receive benefits and Tax Credit payments. Some other payments, such as Housing Benefit, occupational pensions, or wages cannot be paid into it. Payments can only be collected over the counter at a Post Office and will not incur any charges or accrue interest on money contained therein. Due to the limited capability to receive payments, these accounts are included or excluded in tables as noted
- Premium bonds: Investments which do not earn interest, but are entered in a monthly draw for tax-free cash prizes
- Stocks and shares: This includes all bonds, debentures and other securities which are usually traded on the financial markets. Bonds issued by the UK or foreign governments, or local authorities would also be recorded here. A share is a single unit of ownership in a company. ‘Stocks’ is the general term for various types of security issued by companies to raise financial support. If respondents are members of a shares club they will be included with those owning stocks and shares
- Unit trusts: A collectively managed investment in the financial markets, where investors buy ‘units’ of a fund, which invests in shares, stocks, Gilts, etc. Dividends are paid net of tax. The data presented for unit trusts also includes investment trusts, since these two assets are collected together in the FRS
- Any other type of asset: This is a catch-all category for the small numbers who own other types of financial asset. This includes Gilts (HM Government bonds) which raise money for the UK Government by offering a secure investment, usually over a fixed term, and usually with a set rate of interest although some are index-linked. Interest is paid half-yearly
The above products cover all types of savings. Some of them are grouped together in other ways in the tables:
- Direct payment account: A direct payment account is one that can accept electronic payment of benefits via BACS (the Banker’s Automated Clearing System). The types of accounts included in this grouping are:
- Current Account
- National Savings and Investments Savings Accounts
- Savings, investments etc.
- Basic Account
Where noted, Post Office Card Accounts are also included in this group.
Sources of income
- Wages and salaries: for a respondent currently working as an employee, income from wages and salaries is equal to: gross pay before any deductions, less any refunds of income tax, any motoring and mileage expenses, any refunds for items of household expenditure and any Statutory Sick Pay or Statutory Maternity Pay, plus bonuses received over the last 12 months (converted to a weekly amount) and any children’s earnings from part-time jobs
- Self-employed income: the total amount of income received from self employment gross of tax and national insurance payments, based on profits (where the individual considers themselves as running a business) or on estimated drawings otherwise. Excludes any profits due to partners in the business. Any losses are recorded as such
- Investments: Interest and dividends received on savings and investments. See Savings and investments for details of investments covered by the FRS
- Tax Credits: Income from Tax Credits
- State Pension plus any Pension Credit: for any adults who are over State Pension age, any State Pension plus any Pension Credit which is received; these benefits are shown together because of known problems with separating these amounts for pensioners
- Other pensions: payments received from pension schemes, including occupational, stakeholder or personal pension schemes; employee pensions for surviving spouses, annuity pensions, trusts and covenants.
- Disability benefits: payments received from any of the benefits payable due to disability – see Benefits.
- Other benefits: payments received from any of the other Benefits
- Other sources: payments from all other sources including, for example, baby-sitting, allowances from absent spouses including child maintenance, organisations, royalties, odd jobs, sub-tenants, educational grants, alimony and Healthy Start Vouchers
State Pension age
Since 6 April 2010, the State Pension age for women has been gradually increasing and since December 2018 has been increasing for both men and women. On 6 March 2020, the State Pension age for both men and women increased to over 65 years 8 months. The State Pension age for both men and women will continue to increase at the same rate, reaching 66 by October 2020.
Details of further planned changes to State Pension age
State support
An individual is in receipt of state support if they receive one or more benefits, or are being paid Tax Credits.
Tax Credits
Working Tax Credits and Child Tax Credits are paid by HM Revenue & Customs. Tax Credits are being phased out, as they are replaced by Universal Credit.
Tenure
This is the basis on which the head of household is resident in their dwelling. Types of renting or ownership as classified as follows:
- Social renting: includes all cases where the landlord is either the local authority, or a housing association
- Private renting: all cases where the property is rented from a private landlord, including those on a rent-free basis
Rent-free accommodation is any provided free by an employer or by an organisation to a self-employed respondent, provided that the normal activities of the tenant are to further the cause of the organisation (e.g. Church of England clergy). Accommodation is not classed as rent-free if anyone, apart from an employer or organisation, is paying a rent or mortgage on a property on behalf of the respondent.
- Buying with a mortgage: includes local authority and housing association part-own-and-part-rent, and shared ownership arrangements
- Owned outright: households who pay neither rent, nor any mortgage or loan used to purchase the property. These households may have other loans secured on their property for which information is collected on the FRS. However, these payments are excluded from the costs of housing
Prior to 2008 to 2009, social renting was split into council and housing association groups. This division was removed because it was found to be unreliable. Comparison with administrative data showed that a significant number of housing association tenants wrongly reported that they were council tenants. Also in 2008 to 2009, a split between furnished and unfurnished private renting was removed.
Universal Credit
Universal Credit (UC) is now the primary working age benefit. Most claimants will be of working age, though claimants can be over State Pension age if their partner is still of working age. UC supports those on low incomes with their housing and living costs, as well as child and childcare support where appropriate. It is not just for those who are out of work; it is also for those who are working, but whose earnings are low enough to qualify.
UC has now completed its nationwide roll-out for new claims, and is available throughout GB and Northern Ireland.
Universal Credit replaces all of the following state support: income-based Jobseeker’s Allowance, income-related Employment and Support Allowance, Income Support, Working Tax Credit, Child Tax Credit and Housing Benefit. It replaces the numerous payments these benefits would have given with a single, usually monthly payment, administered by DWP. It is paid monthly, in very nearly all cases.
Working
All respondents whose employment status was employed or self-employed, irrespective of full-time or part-time working patterns.
Working-age
Adults (see Adult and Child) under State Pension age.