Area of habitat created or restored
Updated 17 November 2026
Applies to England

© Crown copyright 2026
This publication is licensed under the terms of the Open Government Licence v3.0 except where otherwise stated. To view this licence, visit nationalarchives.gov.uk/doc/open-government-licence/version/3 or write to the Information Policy Team, The National Archives, Kew, London TW9 4DU, or email: psi@nationalarchives.gov.uk.
Where we have identified any third party copyright information you will need to obtain permission from the copyright holders concerned.
This publication is available at https://www.gov.uk/government/statistics/england-biodiversity-indicators/area-of-habitat-created-or-restored
Last updated: 2026
Latest data available: June 2026
Introduction
This indicator reports the number of hectares where action is known to have been or is being taken that is reasonably expected to create or restore wildlife-rich habitats in England. At present only land outside of European protected sites (Special Areas of Conservation and Special Protection Areas), Sites of Special Scientific Interest, or Marine Conservation Zones is included, and only land which has been restored or created since 30 January 2023.
When fully developed, this indicator will be used to track the government’s progress towards meeting the statutory target to restore or create more than 500,000 hectares of wildlife-rich habitats outside protected sites by 31 December 2042, and towards the Environmental Improvement Plan 2025 interim target of 250,000 hectares by 31 December 2030.
The indicator is action-based and records where eligible habitat restoration or creation activity has been undertaken. It does not directly measure whether wildlife-rich habitat has become established, nor the condition of that habitat. This indicator builds on analysis presented by Natural England in May 2026, and includes a limited data update since that publication.
The national cumulative figure should be interpreted as a minimum estimate based on the best data currently available. The indicator includes selected data for Defra funded activity or that of external partners for which suitable data were available. Additional activity is likely to have occurred which has not been captured in these statistics because it has not yet been reported to Defra, or it has been reported to Defra but not in a suitable format.
Data for this indicator can be found in the published datafile. We are developing a similar indicator at the UK level.
Type of indicator
Response indicator
Type of official statistics
These are official statistics in development.
Official statistics in development are published where further development and user feedback are needed before the statistics can be considered fully mature. This indicator is in development because the underlying reporting data and methods are still being refined.
Further information is available from the Types of official statistics, UK Statistics Authority page.
Assessment of change
This indicator is not currently assessed for long-term or short-term change as it is an official statistics in development.
Key results
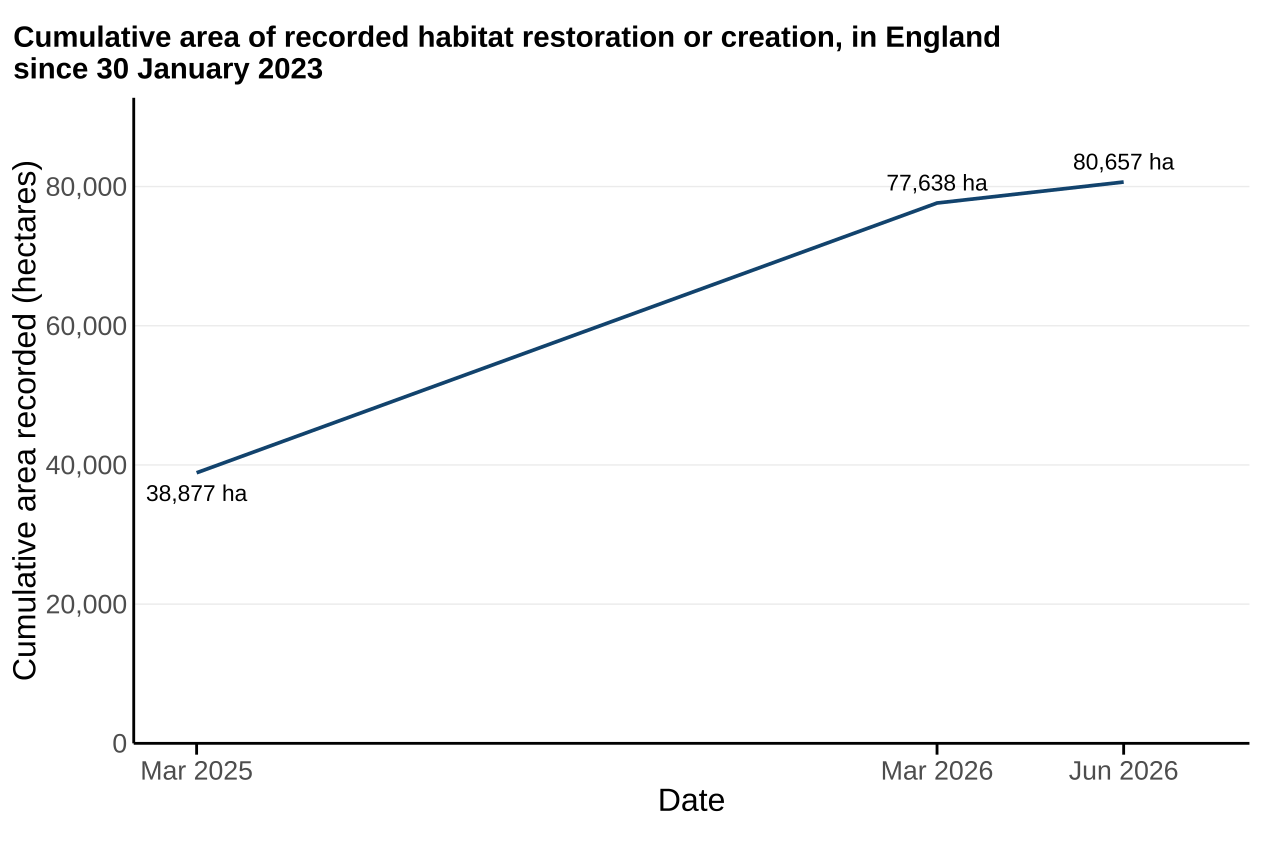
As of June 2026, around 80,700 hectares have been reported where action is known to have been or is being taken that is reasonably expected to create or restore wildlife-rich habitats outside of protected sites since 30 January 2023 (Figure 1).
The total area which contributes towards the habitat target is around 79,100 hectares. This is less than the overall total due to the area of wildlife-rich arable field margins being capped at 40,000 hectares for the purpose of the habitat target reporting (see Further detail section). All other statistics presented in this publication are based upon the uncapped area.
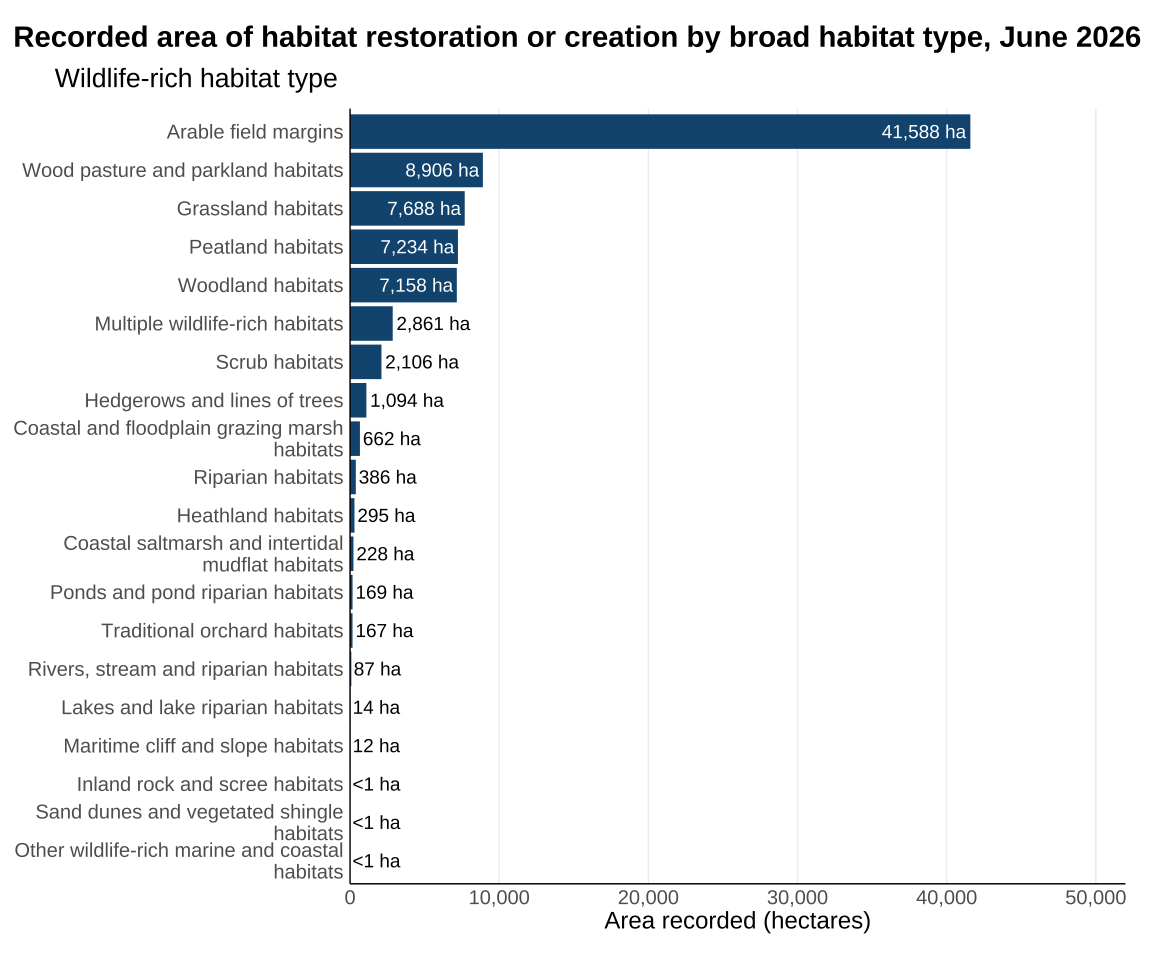
Restoration and creation activity was concentrated in a small number of broad habitat categories. Wildlife-rich arable field margins accounted for around 52% of the habitat breakdown. The four largest categories (Wildlife-rich arable field margins, wildlife-rich wood pasture and parkland habitats, wildlife-rich grassland habitats, and wildlife-rich peatland habitats) together accounted for around 81%.
The largest recorded area of habitat restoration and creation was associated with two agri-environment schemes (AES), Countryside Stewardship and Sustainable Farming Incentive, at 64,700 hectares. See the accompanying datafile for further information on delivery providers.
Around 22,800 hectares of the total area of recorded habitat restoration or creation were recorded within National Parks and National Landscapes (formerly Areas of Outstanding Natural Beauty), collectively known as Protected Landscapes. This total area is a subset of the national total and is based on data which were reported to Defra in a format suitable for spatial disaggregation. Non-spatial data did not provide the geographic breakdown needed to identify whether activity was within a protected landscape.
Figure 1: Recorded habitat restoration or creation increased to nearly 80,700 hectares by June 2026
Source: Habitat action data collected from Defra delivery partners and external organisations (see Table 1)
Notes about Figure 1
- The figure shows the cumulative recorded area of habitat restoration or creation in England before 30 January 2023, before applying the cap to wildlife-rich arable field margins for habitat target reporting.
- Changes between reporting months may reflect newly recorded activity and revisions to previously reported data.
- The cumulative series may be revised when additional data become available, spatial data improve, or confidence in previously reported actions changes.
- Data for March 2025 and March 2026 arefrom the Natural England Environment Act - Evidence reports for 2025 and 2026, respectively. Note that these values have had the cap to wildlife-rich arable field margins applied.
Breakdown by habitat type
Recorded habitat restoration or creation was concentrated in a small number of broad wildlife-rich habitat types. Arable field margins accounted for around 52% of the area recorded in the habitat breakdown. The largest recorded habitat categories were arable field margins, wood pasture and parkland habitats, grassland habitats, peatland habitats. These four largest habitat categories together accounted for around 81% of the total recorded area.
Figure 2: The four largest broad habitats accounted for 81% of the area in the habitat breakdown
Source: Habitat action data collected from Defra delivery partners and external organisations (see Table 1)
Notes about Figure 2
- The figure shows all broad habitat categories supplied in the data.
- The figure shows the full recorded area before applying the cap to wildlife-rich arable field margins for habitat target reporting.
Breakdown by Local Nature Recovery Strategy (LNRS)
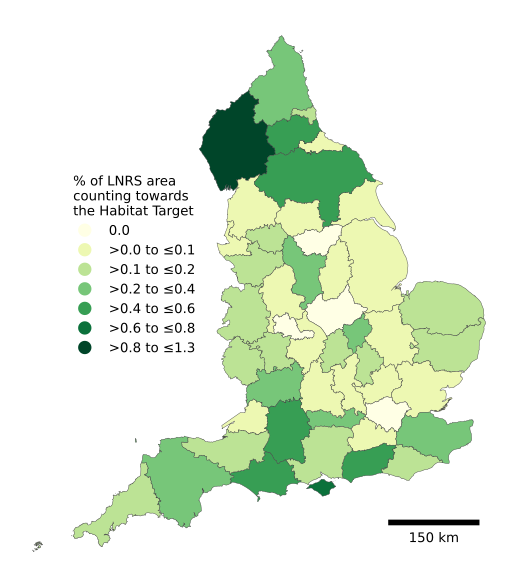
Recorded habitat restoration or creation activity was identified in all 48 Local Nature Recovery Strategy (LNRS) areas. The extent of recorded activity varied considerably between LNRS areas, ranging from 37 to 8,991 hectares.
In the LNRS area with the highest proportional coverage, habitat restoration or creation accounted for 1.3% of the total LNRS area. Nearly half (48.9%) of all recorded habitat restoration or creation area was located within the five LNRS areas with the highest levels of activity, excluding records reported only as geographical portions.
Figure 3: Percentage of LNRS area with recorded habitat restoration or creation activity
Source: Habitat action data collected from Defra delivery partners and external organisations (see Table 1). Joined with LNRS boundary data from the Office for National Statistics Open Geography Portal
Notes about Figure 3
- The figure shows the percentage of each Local Nature Recovery Strategy area where eligible habitat restoration or creation activity has been recorded.
- It is an action-based measure and does not show whether wildlife-rich habitat has become established or the condition of that habitat.
- The breakdown is based only on records that could be allocated spatially to a Local Nature Recovery Strategy area. It excludes non-spatial records and does not represent the full national cumulative total.
- Percentages were calculated by dividing the recorded area by the total area of each Local Nature Recovery Strategy area.
Further detail
The indicator combines information from government delivery mechanisms and external organisations. At present only land outside of European protected sites (Special Areas of Conservation and Special Protection Areas), Sites of Special Scientific Interest, or Marine Conservation Zones is included, and only land which has been restored or created since 30 January 2023.
The cumulative total should be interpreted as a minimum estimate based on the best available evidence. Additional eligible habitat restoration and creation activity may have occurred but is not currently included where suitable data are unavailable or cannot yet be aligned with reporting requirements. The cumulative total may be revised in future releases as additional data become available or improvements are made to the underlying data.
The indicator includes breakdowns by habitat type, delivery provider and geography, helping to show where habitat restoration and creation activity is being recorded and which habitat types contribute most to reported progress.
The contribution of arable field margins to the habitat target is capped at 40,000 hectares above the baseline amount present in 2022, due to their ephemeral nature and the need for a diverse range of habitats. This level was chosen to maintain the existing extent of arable field margins delivery and increase restoration and creation of other habitat types to meet the required supply of wildlife features for birds, insects, and flower-rich habitat across farmland.
Relevance
Habitat restoration and creation are important components of nature recovery because they increase the area of habitat available for wildlife. This indicator provides information on the recorded area where action has been undertaken that is reasonably expected to create or restore wildlife-rich habitat outside protected sites. It supports reporting on progress towards the Environment Act Habitat Target and the Environmental Improvement Plan interim target. As an action-based measure, it should be interpreted alongside England indicators of habitat extent and condition (such as protected areas and priority habitats).
International and domestic reporting
The UK and England Biodiversity Indicators are used for a variety of reporting and other purposes. This includes international reporting, such as the UK’s National Reports to the Convention on Biological Diversity (CBD) on progress towards the goals and targets of the Kunming-Montreal Global Biodiversity Framework. They are also used to track the state of biodiversity domestically, such as in England’s Environmental Indicator Framework. The intention is for this metric to be incorporated into the Environmental Indicator Framework, under Indicator D1 (quantity, quality and connectivity of habitats).
Web links for further information
- Convention on Biological Diversity
- Kunming-Montreal Global Biodiversity Framework
- Environmental Indicator Framework
- Types of official statistics, UK Statistics Authority
- Environment Act Habitat Target - Reporting Data Model and Standard (TIN223)
- Environment Act Habitat Target – Definitions and Descriptions Version 2 (TIN219)
Acknowledgements
Thank you to the people and organisations who provided data and contributed to the development of this indicator.
Technical annex
Data included in the analysis
Data on habitat restoration and creation activity are collected from government delivery mechanisms and external organisations. Source data structure is assessed against habitat target reporting requirements and transformed where necessary to align with a common reporting standard. The Environment Act Habitat Target – Reporting Data Model and Standard (TIN223) publication sets out the data requirements for reporting progress towards the habitat target.
Table 1. Delivery mechanisms contributing data on habitat restoration and creation
| Delivery mechanism | Provider type | Description |
|---|---|---|
| AES: Countryside Stewardship and Sustainable Farming Incentive | Defra Group | Combines agreement data from relevant AES options and Rural Payments Agency (RPA) Land Parcels to provide parcel-level data showing where options have been undertaken. |
| Buglife | External | Buglife developed the B-Lines initiative, a national network of 3 km wide corridors designed to reconnect wildflower habitats across England and prioritise habitat restoration for pollinators and other wildlife. |
| Environment Agency (EA) | Defra Group | Data has been extracted from the EA Conservation Projects Database (CPD) on habitat creation and restoration. This data represents projects to restore or create wildlife-rich habitat, most of which are undertaken by the EA in partnership with other organisations. This includes delivery from across delivery mechanisms, including the Flood and Coastal Erosion Risk Management Programme and EA peatland restoration works. |
| Farming in Protected Landscapes | Defra Group | The FiPL programme offers funding to farmers and land managers in National Landscapes, National Parks and the Broads. The programme funds projects that support nature recovery, mitigate the impacts of climate change, and provide opportunities for people to discover and enjoy the landscape and its cultural heritage. |
| Forestry Commission | Defra Group | Supplied data covers tree planting associated with the England Woodland Creation Scheme, tree planting by Forestry England, Countryside Stewardship, Community Forests, The Northern Forest, The National Forest Company and the Woodland Creation Partnership. |
| Forestry England | Defra Group | Data is supplied for restoration of ancient semi-natural woodland in the nation’s forests using compartment survey data showing changes in tree composition on Plantations on Ancient Woodland Sites (PAWS). |
| National Trails UK | External | National Trails UK is a charity dedicated to preserving and promoting the 5,500-mile National Trail network across the UK. Enabled through funding from the Protected Landscapes Partnership, its Nature Recovery Programme supports National Trail staff and wider partners to deliver habitat creation and restoration actions. |
| Nature for Climate Peatland Grant Scheme (NCPGS) | Defra Group | NCPGS provides funding to restore peatlands in the uplands and lowlands of England. |
| Nature Returns Programme | Defra Group | Nature Returns looks at how nature-based solutions can be practically implemented at the landscape scale, including how public and private funding can be blended to support large-scale environmental recovery. Natural England leads Nature Returns, in partnership with the Environment Agency, Forestry Commission, Royal Botanic Gardens Kew at Wakehurst and six Local Partnership Projects. |
| Newt Conservation Partnership | External | The Newt Conservation Partnership is a community benefit society formed through partnership between two charities: Freshwater Habitats Trust and Amphibian and Reptile Conservation. The partnership creates, restores and monitors ponds and terrestrial habitat for great crested newts, funded via NatureSpace Partnership’s District Licensing and Organisational Licensing schemes. |
| Plantlife | External | Plantlife is a conservation charity focused on protecting and restoring wild plants and fungi and their habitats across the UK and globally, including through large-scale habitat and species restoration projects. Data provided by Plantlife covers delivery under the National Highways Meadow Makers programme. |
| Species Survival Fund | External | The Species Survival Fund supports the creation and restoration of wildlife-rich habitats in England, supporting ecosystem restoration and improving species abundance at the landscape, catchment or local scale. The fund was delivered by the National Lottery Heritage Fund on behalf of Defra. |
Methodology
Data providers submit habitat reporting data to a dedicated Defra email mailbox. New data are ingested into Defra’s Databricks platform and processed using Python-based analytical workflows. For data providers that were unable to supply updated data following Natural England’s latest Environment Act Habitat Target Evidence Report, previously generated intermediate outputs from the legacy Feature Manipulation Engine (FME) pipeline were reused. Future reporting iterations will benefit from a more consistent and automated data ingestion and validation process that is currently under development.
Not all reported habitat actions are supplied as spatially explicit polygons. Where geographic information is provided as points, lines or indirect references (for example, identifiers linked to ancillary datasets, postcodes, or grid references), polygon geometries must be derived before the data can be included in the analysis. These derived polygons represent the best available spatial interpretation of the reported action and are therefore subject to a greater degree of spatial uncertainty than data supplied as explicit polygons.
Data received from Defra’s Farming Directorate uses field parcel identifiers as the geographic reference. These records are joined to the appropriate Rural Payments Agency (RPA) Land Parcel dataset corresponding to the period in which the action was initiated. The Farming Directorate also provides non-spatial statistics relating to arable field margins, ponds and riparian habitats. As insufficient geographic information is available to spatially represent these actions, they are incorporated directly into the summary statistics rather than the spatial analysis.
Where records cannot be linked to an existing land parcel and are supplied as point geometries rather than polygons, spatial representations are created using proportional circular buffers around the reported point location. These buffers are sized to match the area of habitat creation or restoration reported by the data provider. Linear features, such as rivers and hedgerows, are converted to polygons using the standard widths specified in TIN223. While these approaches enable inclusion within the spatial analysis, they introduce spatial uncertainty.
Each record is assigned a contribution per hectare value. In many cases this equals 1, indicating that habitat creation or restoration applies to the entire reported polygon. In other cases, particularly Farming Directorate records linked to RPA Land Parcels, habitat actions apply only to part of the associated geography. With the precise location of the action within the polygon being unknown, the reported habitat area is divided by the total polygon area to derive a proportional contribution value. This represents the proportion of the polygon that has been subject to habitat action.
Once data from all providers have been transformed into the common reporting data model, they are combined into a single spatial dataset. Spatial analysis is then used to remove areas that overlap with protected sites, in accordance with the defined scope of the habitat target.
To prevent over-reporting resulting from duplicate records or co-located habitat actions, spatial overlaps between actions are identified and resolved. New child polygons are created to represent overlapping areas, with attributes aggregated from the parent features. The overlapping extent is then removed from the original polygons. Where all parent polygons share the same broad habitat classification, the child polygon retains that classification. Where multiple broad habitat types overlap, the child polygon is classified as ‘Multiple wildlife-rich habitats’. The child polygon’s ‘contribution per hectare’ value is calculated as the average of the parent values, after which habitat contributions used in reporting are recalculated by multiplying ‘contribution per hectare’ by the final polygon areas.
The total area of habitat action across all polygons is aggregated to produce the indicator. The resulting metric represents the cumulative area where actions are known to have been undertaken, or are underway, and are reasonably expected to create or restore wildlife-rich habitat outside protected sites since 30 January 2023. Additional summary statistics are calculated for Local Nature Recovery Strategy (LNRS) areas and Protected Landscapes through spatial intersection with official geographic boundary datasets.
The methodology, analytical process, codebase and final outputs have been subject to a rigorous quality assurance process.
Confidence in the metric
Defra has confidence that this metric provides a reasonable estimate of the area where action has been undertaken to create or restore wildlife-rich habitat. Confidence in the metric is supported by the use of spatial analysis to identify and remove overlapping records, alongside comprehensive quality assurance procedures, including code and analytical methodological review. The metric remains subject to some uncertainty where habitat actions are not reported as spatially explicit polygons and spatial representations must be derived from alternative geographic information.
Caveats and limitations
The data reflect recorded actions that are reasonably expected to create or restore wildlife-rich habitats. They are subject to limitations relating to data quality (including attribution and spatial accuracy), coverage and reporting lags.
The metric is not fully comprehensive. Some activities may not yet be included where suitable data are unavailable or cannot be aligned to the reporting requirements.
The treatment of point geometries is a source of uncertainty. This affects both the precision of individual action locations and the assessment of overlaps between different actions. Consistent and high quality spatial polygon data are required to allow confidence that double counting is avoided by enabling us to aggregate actions reported by multiple partners or delivery mechanisms in the same area.
The Farming Directorate within Defra provides non-spatial data for specific habitats. As locational information is not available, it is not possible to identify overlaps with other habitat actions represented by spatial data. Consequently, these data are also excluded from geographical breakdowns, including Local Nature Recovery Strategy (LNRS) areas and Protected Landscapes. Changes between observations in the cumulative progress series should not be interpreted as activity delivered solely within the intervening reporting period. Historical values may be revised as additional information on actions and outcomes becomes available.
Furthermore, there is often a lag between activity being delivered on the ground and its inclusion in annual reporting, which can be amplified by differences in reporting cycles between Defra and delivery partners. As a result, the metric should not be considered a real-time measure of progress towards the target.
Development plan
Further developments are expected to cover:
- Working with data providers to supply spatial data in enough detail to improve confidence in the metric, and to allow inclusion of all data in the geographical breakdowns.
- An estimate of habitat restoration or creation activity inside of protected sites.
- Expansion of the time-series to before January 2023.
- Development of a UK-wide indicator of habitat restoration and creation.
- Investigation of potential additional data products to allow stakeholders to clearly understand the location and type of habitat activities linked to restoration and creation.
We are keen to hear from users about this indicator as it develops. Please email us.