Energy Consumption in the UK (ECUK) 2026
Published 24 September 2026

© Crown copyright 2026
This publication is licensed under the terms of the Open Government Licence v3.0 except where otherwise stated. To view this licence, visit nationalarchives.gov.uk/doc/open-government-licence/version/3 or write to the Information Policy Team, The National Archives, Kew, London TW9 4DU, or email: psi@nationalarchives.gov.uk.
Where we have identified any third party copyright information you will need to obtain permission from the copyright holders concerned.
This publication is available at https://www.gov.uk/government/statistics/energy-consumption-in-the-uk-2026/energy-consumption-in-the-uk-ecuk-2026
Final energy consumption in the UK has been on a decreasing trend since the turn of the century, prior to which there had been two decades of steady increases throughout the 1980s and 1990s.
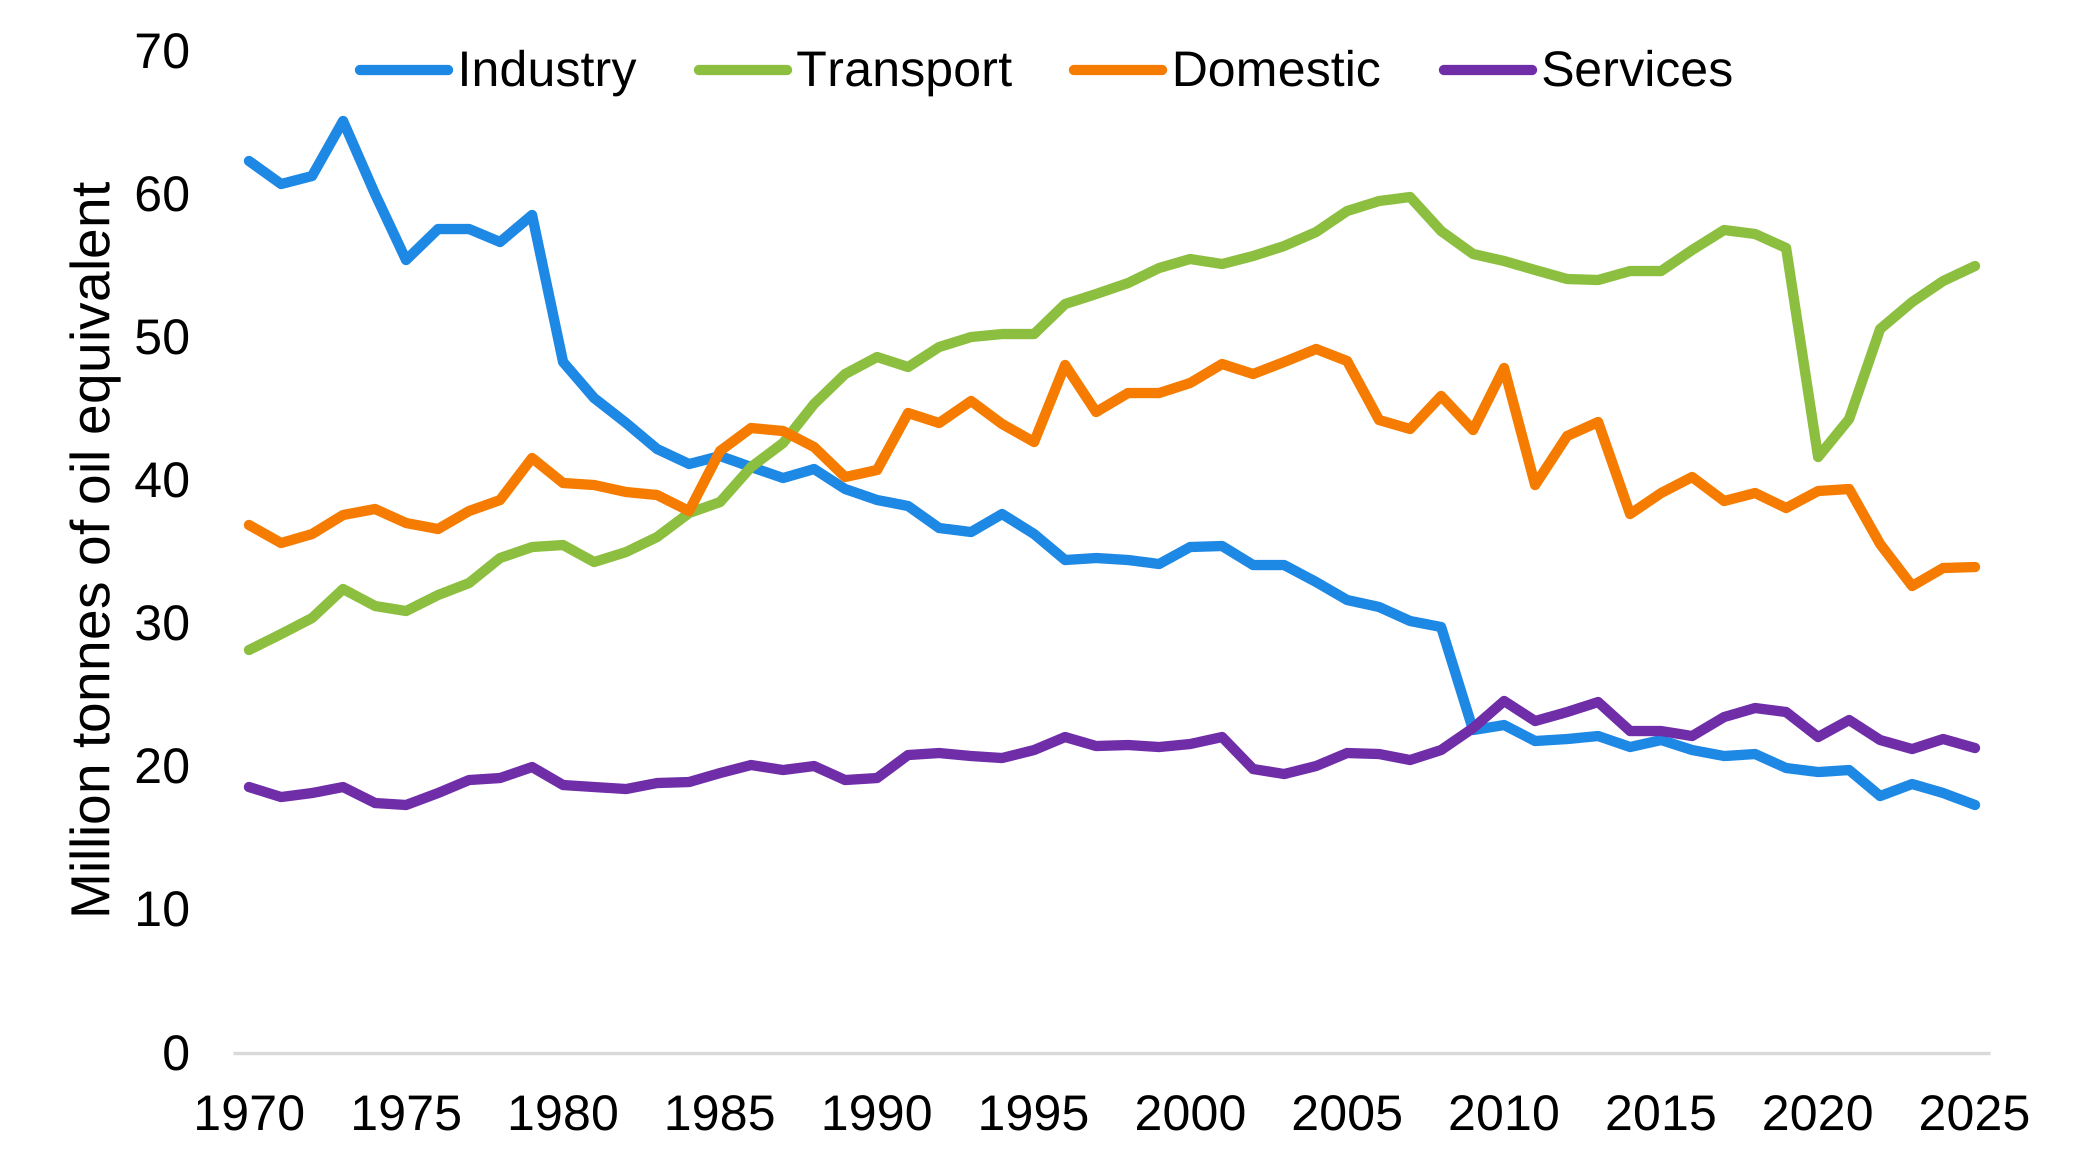
Consumption patterns over time differ by sector. Industrial consumption has been decreasing since the 1970s and is now 27 per cent of the peak in 1973. Consumption in the transport sector increased continually from 1970 to the late 2000s and has been relatively constant since. Domestic sector consumption slowly increased from 1970 and peaked in the early 2000s, after which consumption has gradually fallen, mostly due to improvements in energy efficiency. Compared to the other sectors the services sector has had a more stable consumption, but has been increasing slowly over time, with consumption now 15 per cent higher than in 1970.
Between 2024 and 2025, final energy consumption in the UK decreased by 0.3 per cent to 127.7 million tonnes of oil equivalent (mtoe). In the domestic sector energy consumption in 2025 increased by 0.2 per cent to 34.0 mtoe despite higher temperatures. Consumption in the transport sector also increased, by 2.0 per cent to 55.0 mtoe, with both the road and rail sectors showing increased consumption. Air transport consumption dropped slightly compared to 2024, but remained within two per cent of the pre-pandemic levels in 2019.
In contrast, energy consumption in the industry sector decreased in 2025, and is at the lowest level in the ECUK time series. Improvements in energy efficiency and a move away from traditional manufacturing have impacted the long-term trends in industrial consumption. Consumption in the services sector also decreased from 2024 to 2025.
Energy intensity in the domestic sector decreased slightly in 2025, continuing a long-term trend brought about by energy-saving measures such as improved insulation and more efficient boilers. In the transport sector energy intensities have largely returned to the levels seen in 2019 before the impact of COVID-19 restrictions on travel patterns.
Energy consumption by sector, 1970 to 2025 (Table C1)
1. Energy consumption
Final energy consumption is the energy used by people and businesses in their day-to-day activities. Core final consumption data are sourced directly from the energy balances as published in The Digest of UK Energy Statistics (DUKES).
1.1 Key headlines
Final energy consumption (excluding non-energy use) in the UK peaked in the early 2000s following two decades of steady increases throughout the 1980s and 1990s. These increases were driven largely by increasing consumption in the transport and domestic sectors, which were partly offset by decreasing consumption in the industry sector. Since the peak consumption of 160.9 mtoe in 2001, final energy consumption in the UK has decreased by 21 per cent, to 127.7 mtoe in 2025. This fall can mainly be attributed to decreased consumption in the domestic and industry sectors.
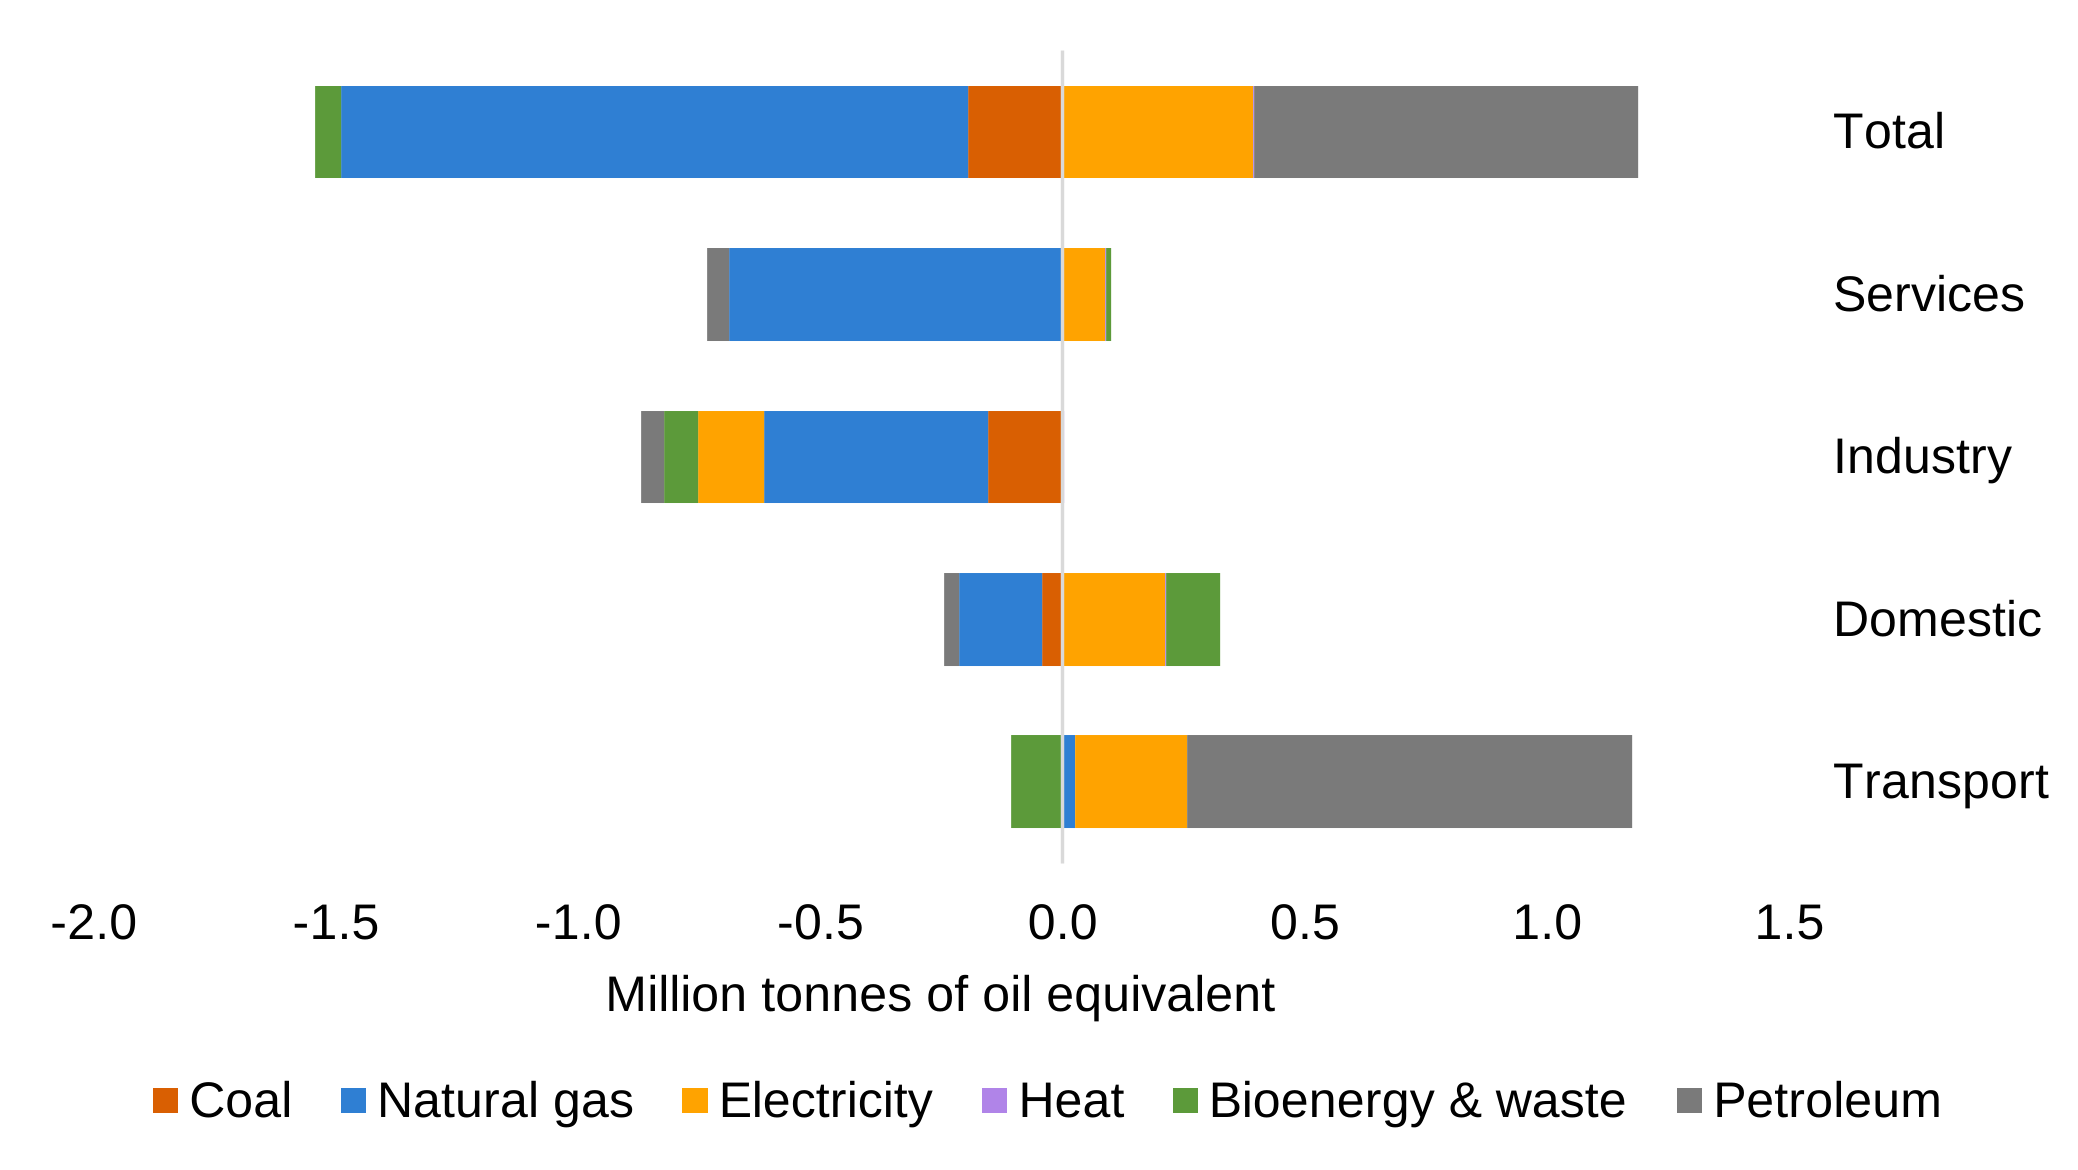
The 127.7 mtoe consumed in 2025 was 0.3 per cent lower than consumption in 2024 (128.1 mtoe), and 7.6 per cent lower than pre-pandemic (2019) levels. Between 2024 and 2025 the largest increase by fuel was petroleum consumption in the transport sector, while natural gas in the industry and services sectors saw the largest decrease in consumption (Chart 1).
Chart 1: Change in consumption by sector and fuel, 2024 to 2025 (Table C1)
1.2 Domestic
In the domestic sector energy consumption increased between 1970 and 2000, during which time domestic coal consumption decreased by almost 90 per cent and consumption of natural gas and electricity rose, by 256 per cent and 45 per cent respectively. Since the early 2000s energy consumption in the domestic sector has been on a long-term decreasing trend, partly due to improvements in energy efficiency and more recently the impact of warmer temperatures and higher energy and other prices.
Since 2000 domestic gas consumption has decreased by 32 per cent, from 31.8 mtoe in 2000 to 21.5 mtoe in 2025. Similarly, petroleum consumption in the domestic sector (predominantly used for heating) has fallen 29 per cent to 2.3 mtoe and electricity consumption has decreased 14 per cent to 8.3 mtoe. Over the same time period heat and bioenergy & waste have increased in the domestic fuel mix, and now account for 5.2 per cent of the total domestic consumption.
Between 2024 and 2025 domestic consumption increased slightly by 0.2 per cent to 34.0 mtoe, despite 2025 being the warmest year on record. The main fuel contributing to the increase was electricity, which increased by 2.6 per cent to 8.3 mtoe (electric vehicles are not included in the domestic total and do not contribute to this change, see ‘Electric vehicles within DUKES/ECUK data’ below for further information). Natural gas consumption decreased by 0.8 per cent year-on-year to 21.5 mtoe. Domestic consumption in 2025 was 4.3 per cent higher than 2023 when consumption was heavily impacted by higher energy and other prices, but still 11 per cent lower than the 38.1 mtoe consumed in 2019.
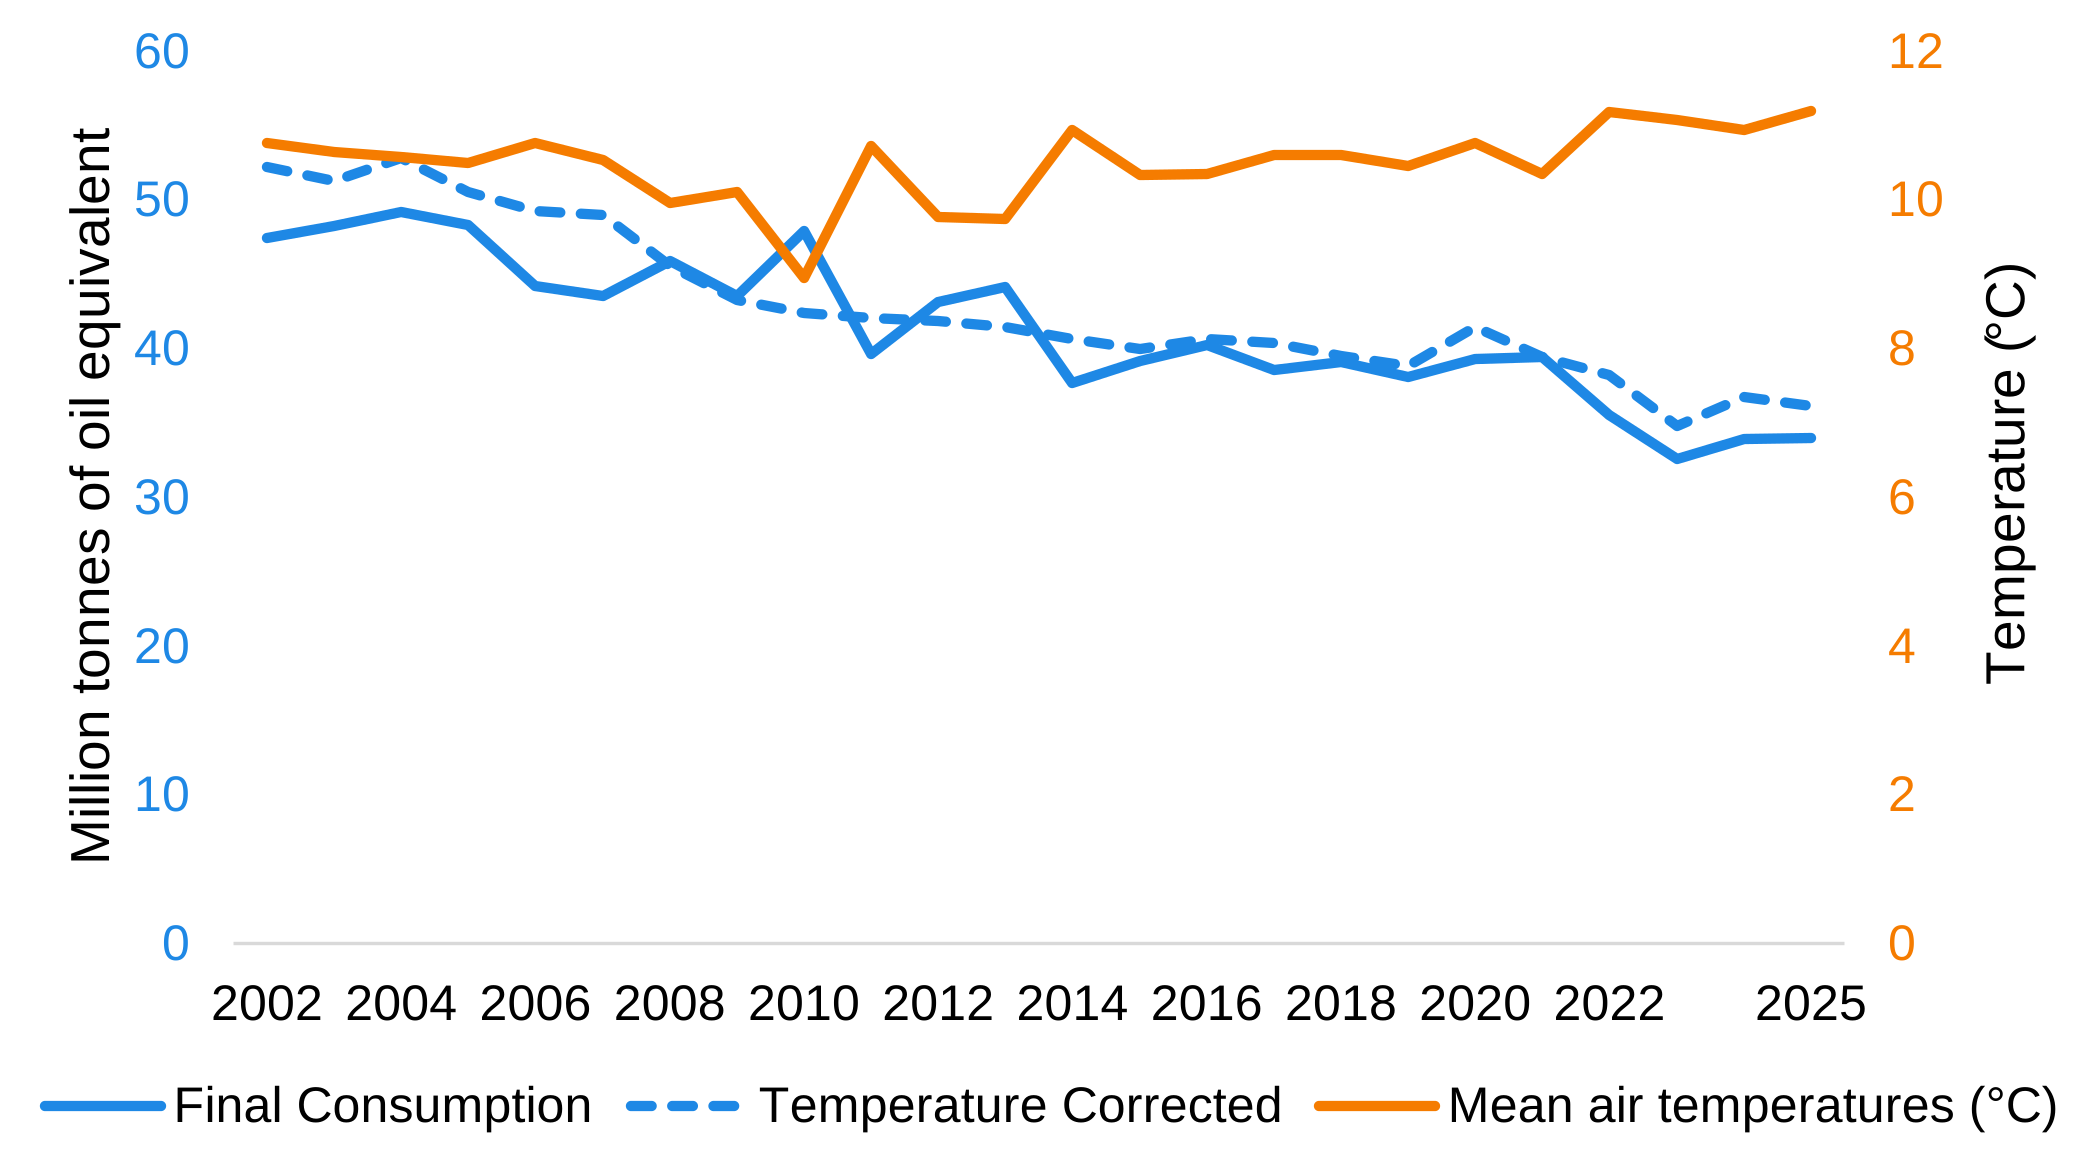
On a temperature corrected basis, domestic consumption in 2025 was 36.1 mtoe, 1.7 per cent lower than the temperature corrected consumption for 2024 (Chart 2). Temperature corrected consumption fell sharply in 2023 following higher energy prices and broader cost-of-living pressures, and remains 6.9 per cent below its pre-pandemic level in 2019.
Chart 2: Domestic consumption, temperature-corrected domestic consumption and average annual temperatures, 2002 to 2025 (Table C5)
1.3 Transport
Consumption in the transport sector increased steadily between 1970 and 2008 as both road and air traffic volumes increased.[footnote 1] Consumption decreased after 2008 following the financial crisis, primarily driven by decreased consumption in the road sector. Transport consumption decreased sharply during the COVID-19 pandemic as a result of lockdowns and associated travel restrictions. Since then, there have been increases in transport energy consumption every year since 2021.
Between 2024 and 2025 overall transport energy consumption increased by 2.0 per cent to 55.0 mtoe. However, this is still lower than the 56.3 mtoe consumed in the transport sector in 2019 prior to the pandemic, which may be reflective of changes to societal travel patterns (e.g. increased home working) and the increasing adoption of electric vehicles.
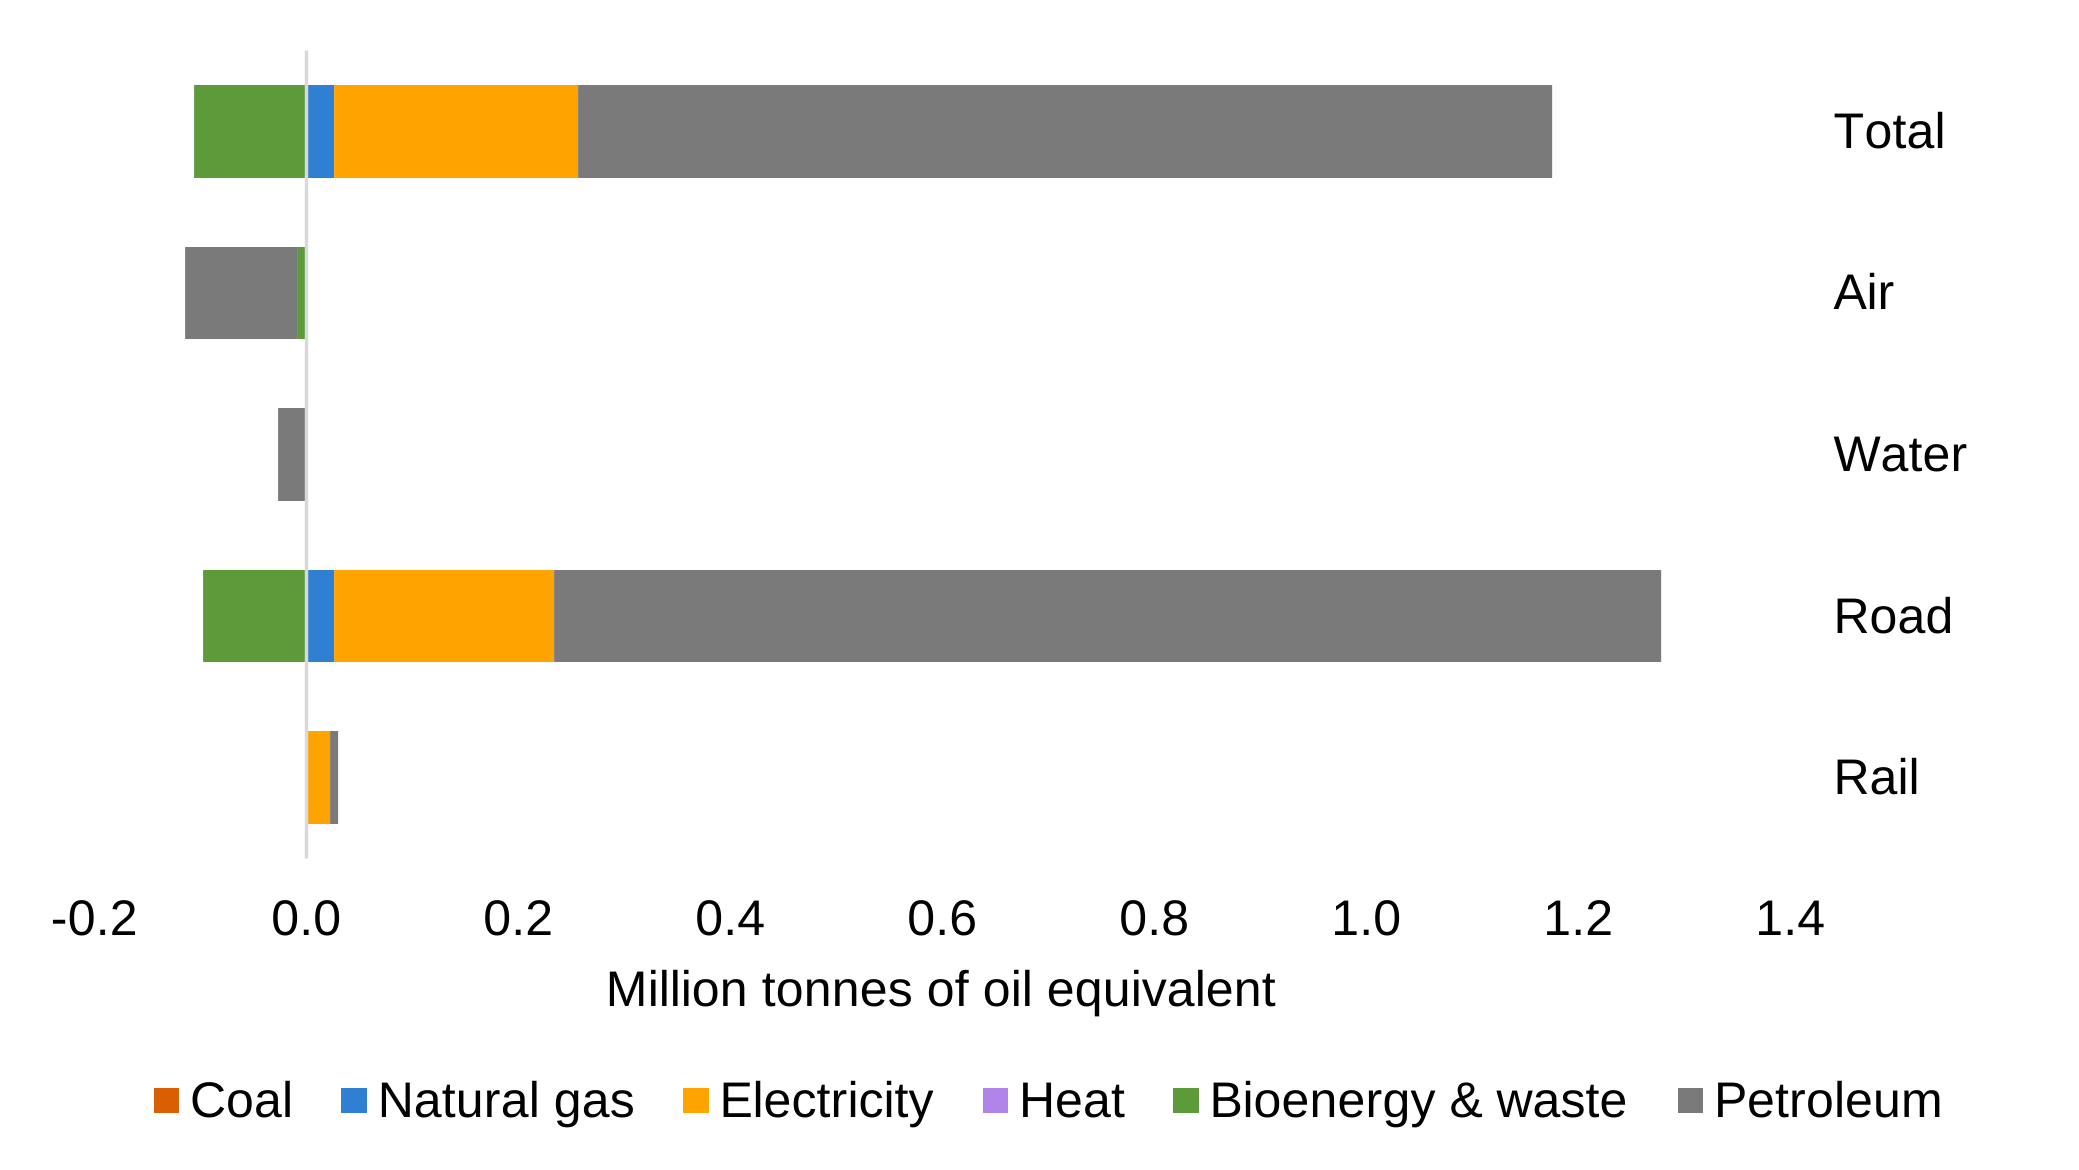
The increase in energy consumption in the transport sector in 2025 was primarily driven by increased consumption for road transport (Chart 3). Most of the increase was due to consumption of petroleum products (1.0 mtoe), however electricity consumption for road transport also increased (by 0.2 mtoe). Consumption for air transport decreased by 0.8 per cent to 13.4 mtoe between 2024 and 2025. This is still slightly higher than the consumption seen in 2019 prior to the pandemic.
Chart 3: Change in consumption in transport by travel mode, 2024 to 2025 (Table C1)
The transport sector was the biggest component of final energy consumption in the UK in 2025, and has been since 1988. In 2025 the sector accounted for 43.1 per cent of the total energy consumption. Within the transport sector, road transport is the biggest contributor to energy consumption (72.4 per cent), followed by air (24.4 per cent). Rail and water transport contribute approximately 1.8 per cent and 1.4 per cent of transport energy consumption respectively.
The vast majority of consumption in the transport sector is from petroleum fuel (92.4 per cent in 2025). However, this has been decreasing over recent years, with bioenergy & waste (i.e. biofuels) accounting for 4.8 per cent of transport sector consumption in 2025, and electricity consumption being 2.4 per cent of the total. Electricity consumption in the transport sector has almost doubled since 2022, from 0.7 mtoe to 1.3 mtoe. The installed base for electric cars continues to grow, with data from the Department for Transport showing 2.63 million plug-in electric cars being licensed for use at the end of December 2025 (out of a total of 34.49 million licensed cars), an increase of 33 per cent on the year before.[footnote 2]
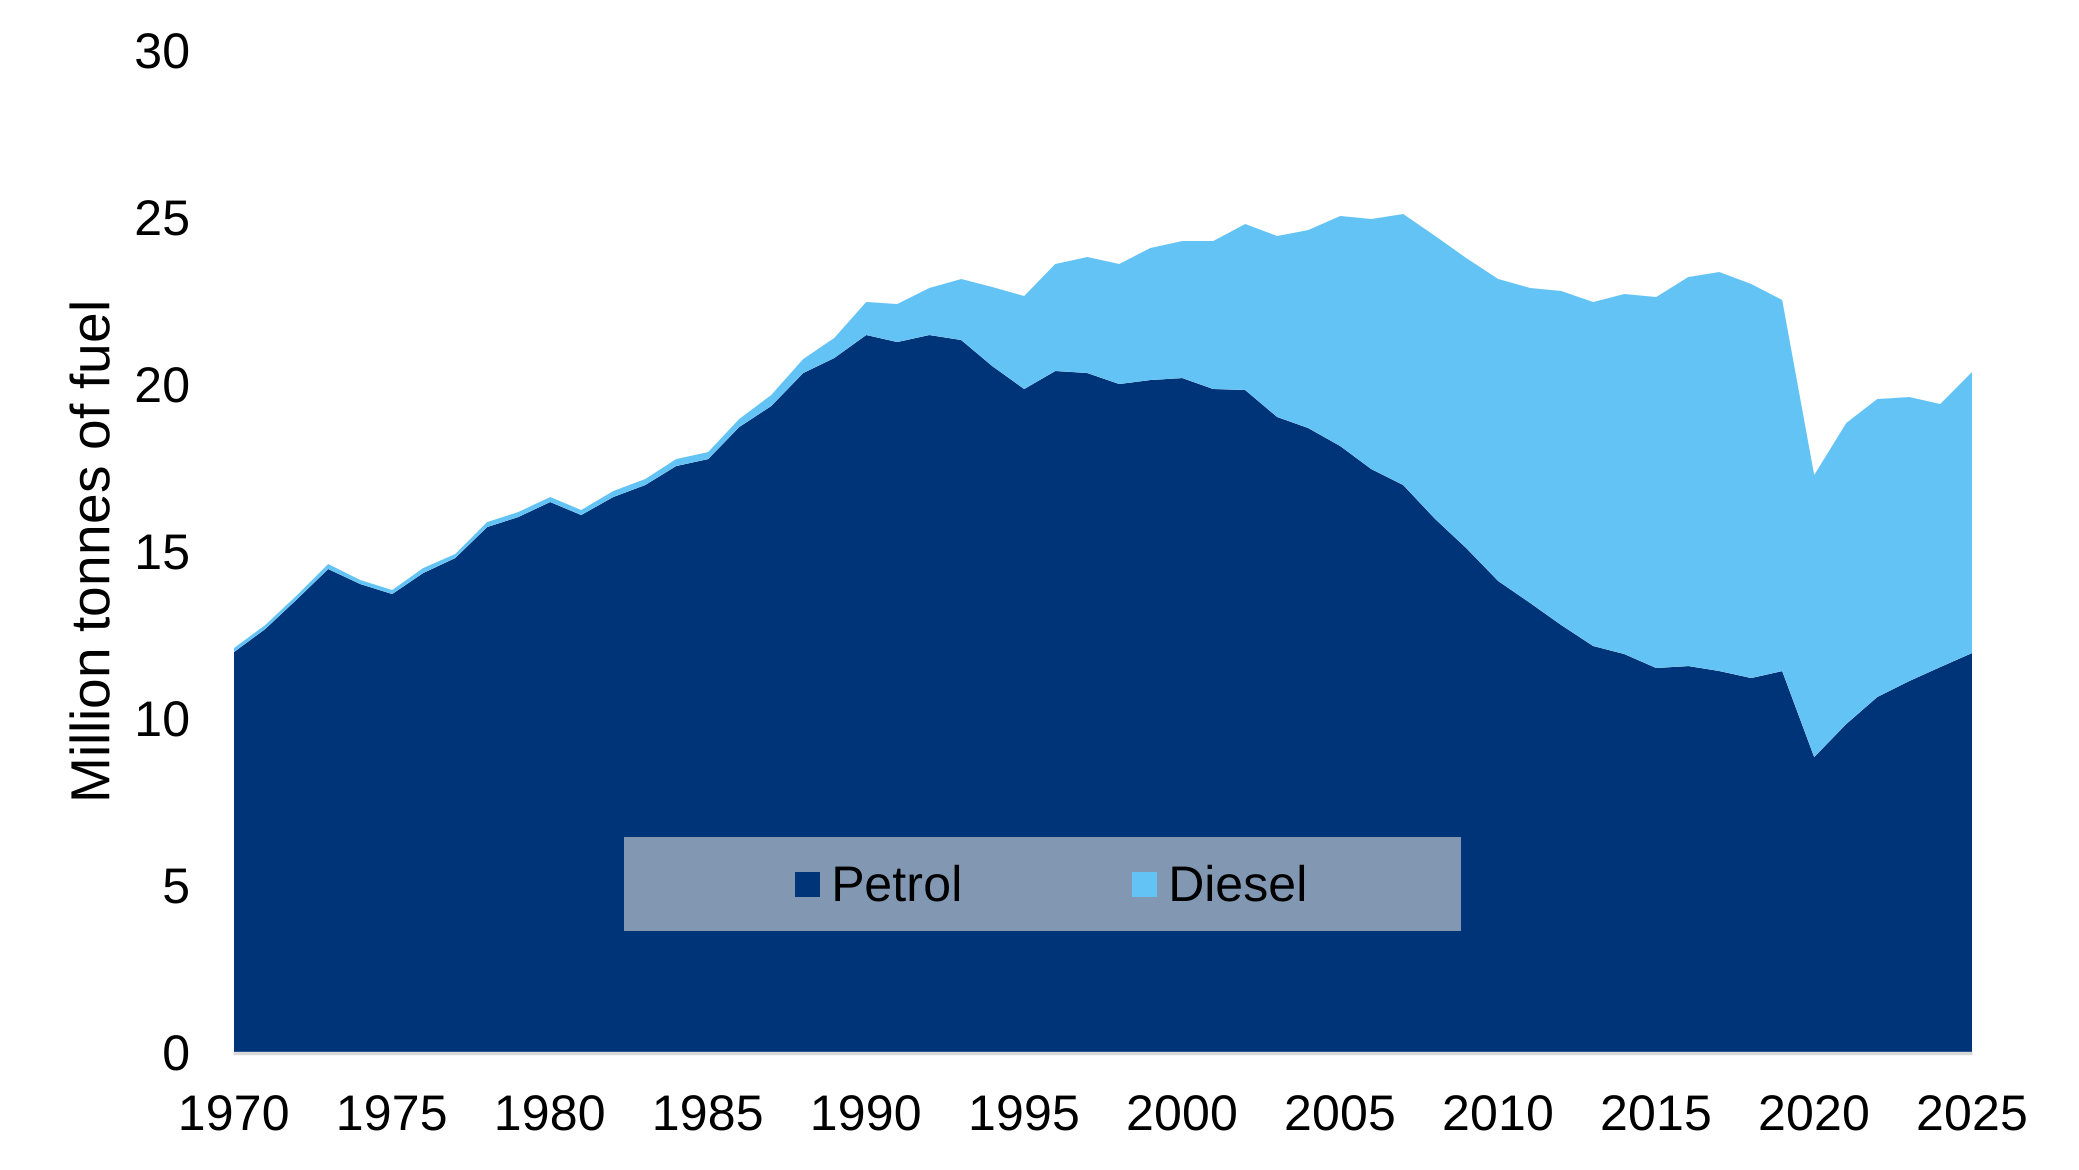
Cars were the largest consumer of road transport fuel, accounting for 20.4 million tonnes of fuel consumption (petrol and diesel combined) in 2025 (57.4 per cent of the total). This was an increase of 4.9 per cent on 2024, and the highest annual consumption of road transport fuel in cars since 2019 (Chart 4). Biofuels (which are not allocated to vehicle type in these data) contributed 7.4 per cent of the overall road fuel use in 2025. However, consumption of biofuels decreased by 4.8 per cent compared to 2024. This is likely due to decreased demand linked to increased hydrotreated vegetable oil prices.
Chart 4: Petrol and diesel consumption for cars, 1970 to 2025 (Table C8)
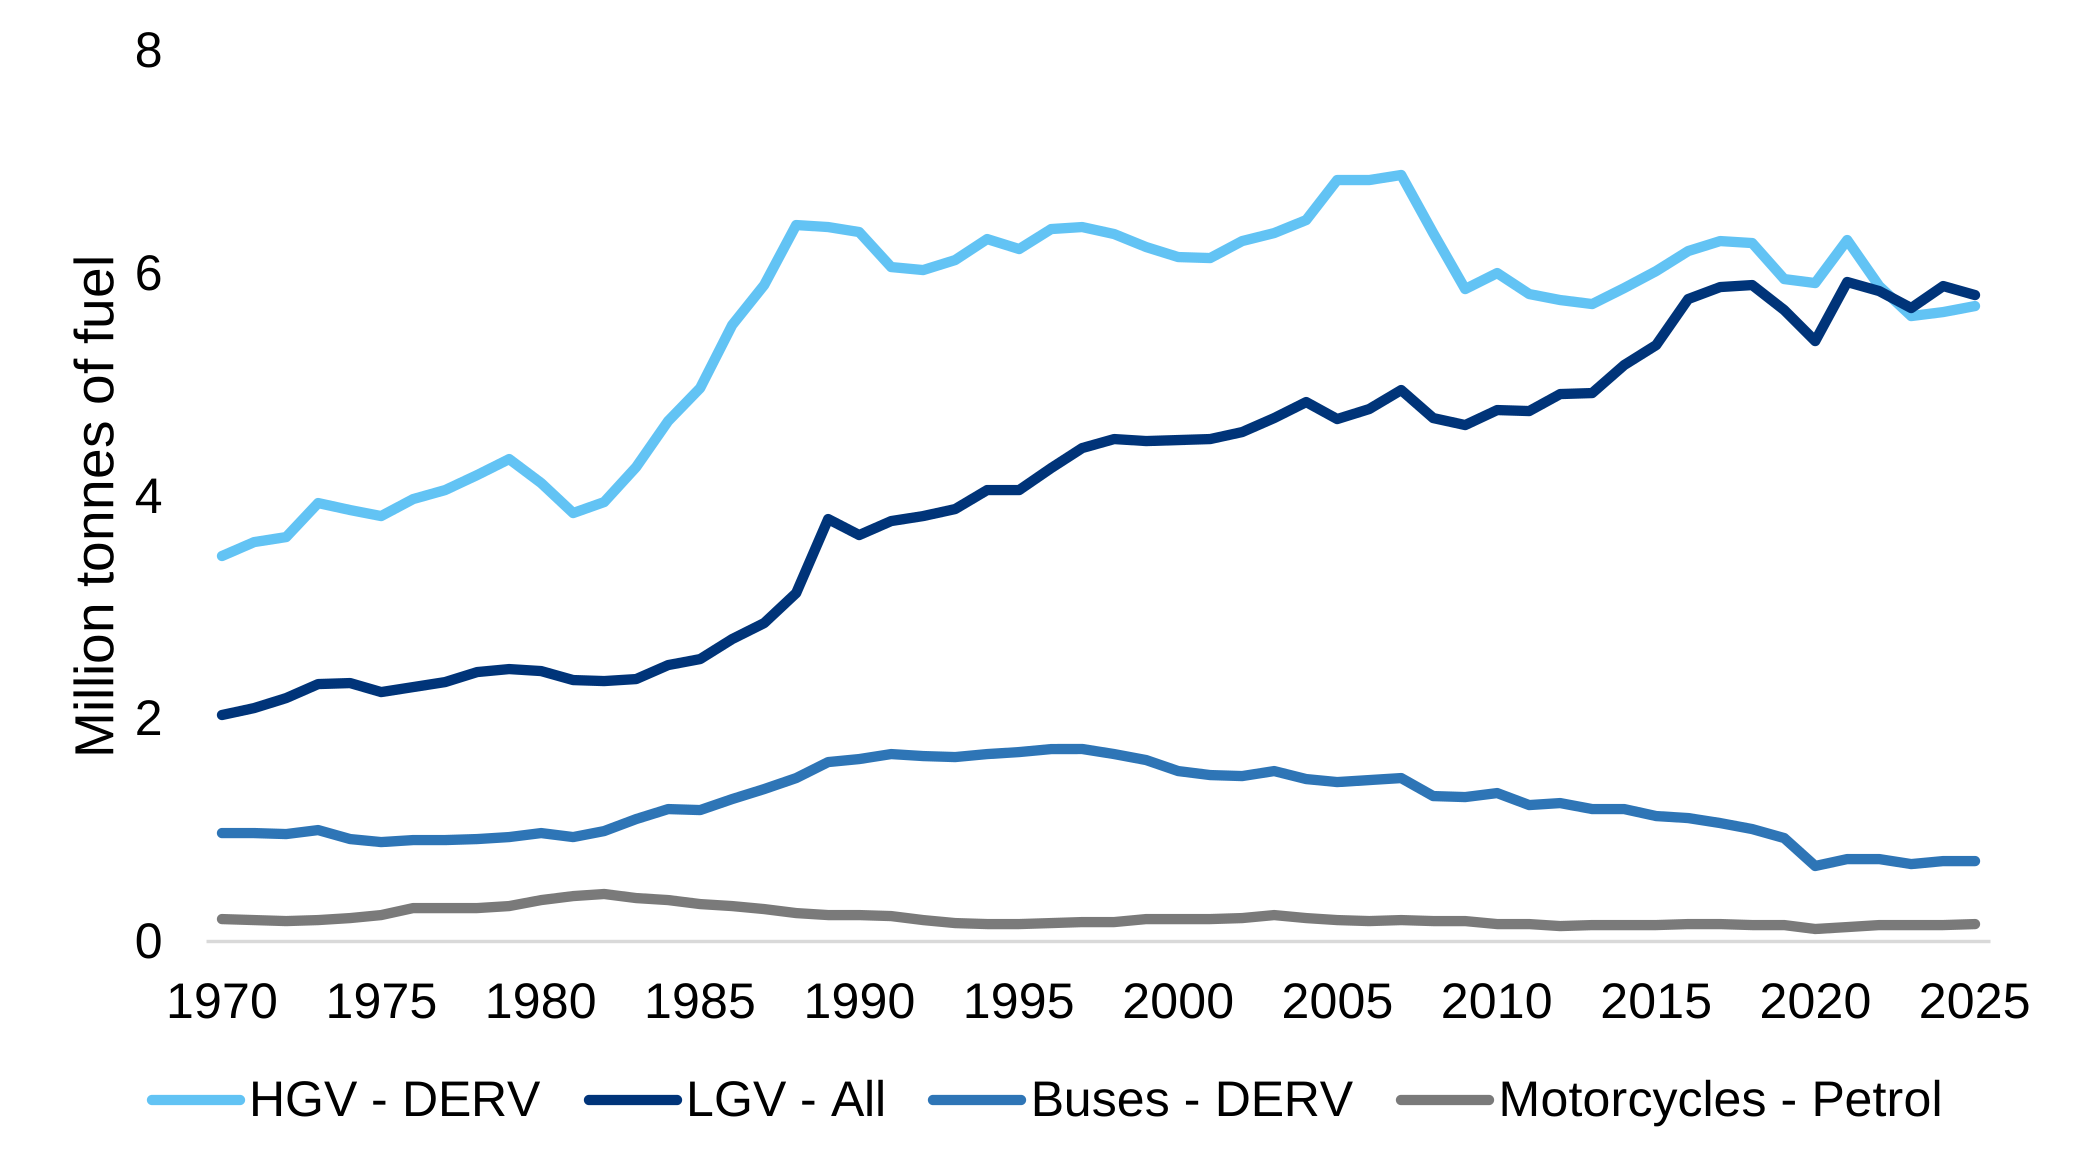
There has been a long-term trend of increasing fuel consumption in light goods vehicles (LGVs), while consumption in heavy goods vehicles (HGVs) has been decreasing, with both vehicle types now consuming a similar amount of fuel (Chart 5). However, between 2024 and 2025 fuel consumption in LGVs decreased by 1.4 per cent and HGVs increased by 1.0 per cent. Diesel consumption in buses was broadly static between 2024 and 2025, whereas fuel use in motorcycles increased by 7.4 per cent.
Chart 5: Petrol and diesel consumption by other types of vehicles, 1970 to 2025 (Table C8)
Electricity consumption for road vehicles has been rising steadily over the last 10 years, prior to which there was almost no consumption. Between 2024 and 2025 electricity consumption for road vehicles increased by 31 per cent to 884 ktoe. Electric cars account for the majority of road vehicle electricity consumption (85.3 per cent), with LGVs and buses accounting for the remaining 11.2 per cent and 3.4 per cent respectively.
Electric vehicles within DUKES/ECUK data
Electricity consumed by electric vehicles (EVs) is included within the DUKES transport sector regardless of which sector makes use of the transport, or where charging takes place (see Electricity statistics methodology note). Electric vehicle consumption is deducted from electricity consumption in the domestic and commercial sectors to prevent double-counting. For DUKES 2026 the methodology for estimating electric vehicle consumption was updated to include electric buses and to update the proportions used for deducting consumption from the domestic and commercial sectors (see Methodology changes for reporting electricity used by road vehicles).
Because the estimated electricity consumption for electric vehicles is deducted from the other sectors, the domestic and services consumption figures presented in this publication do not include the electricity used for charging EVs, and the associated trends over time are not impacted by the growth in EV ownership. Similarly, electric vehicle charging is not one of the domestic end use categories discussed in this publication or presented in the ECUK end uses tables.
1.4 Industry
Energy consumption in the industry sector in the UK decreased steadily between 1970 and 2008, falling from 62.3 mtoe in 1970 to 29.8 mtoe in 2008. The financial crisis led to a sharp fall in industrial energy consumption, which fell by 24 per cent to 22.6 mtoe in 2009. Since then the decreasing trend has continued but at a slower rate. Industry energy consumption has been below 20 mtoe each year since 2019. The long-term decrease in industrial energy consumption has been seen across many European countries[footnote 3], and has been driven by improvements in energy efficiency and a move from traditional manufacturing to higher value processes such as pharmaceuticals.
Industrial energy consumption decreased by 0.9 mtoe (4.9 per cent) between 2024 and 2025 to 17.3 mtoe, the lowest total in the ECUK time series. With the exception of heat, all fuels decreased in consumption in the sector between 2024 and 2025. Natural gas was the largest contributor to the overall fall in consumption, decreasing by 0.5 mtoe (7.8 per cent).
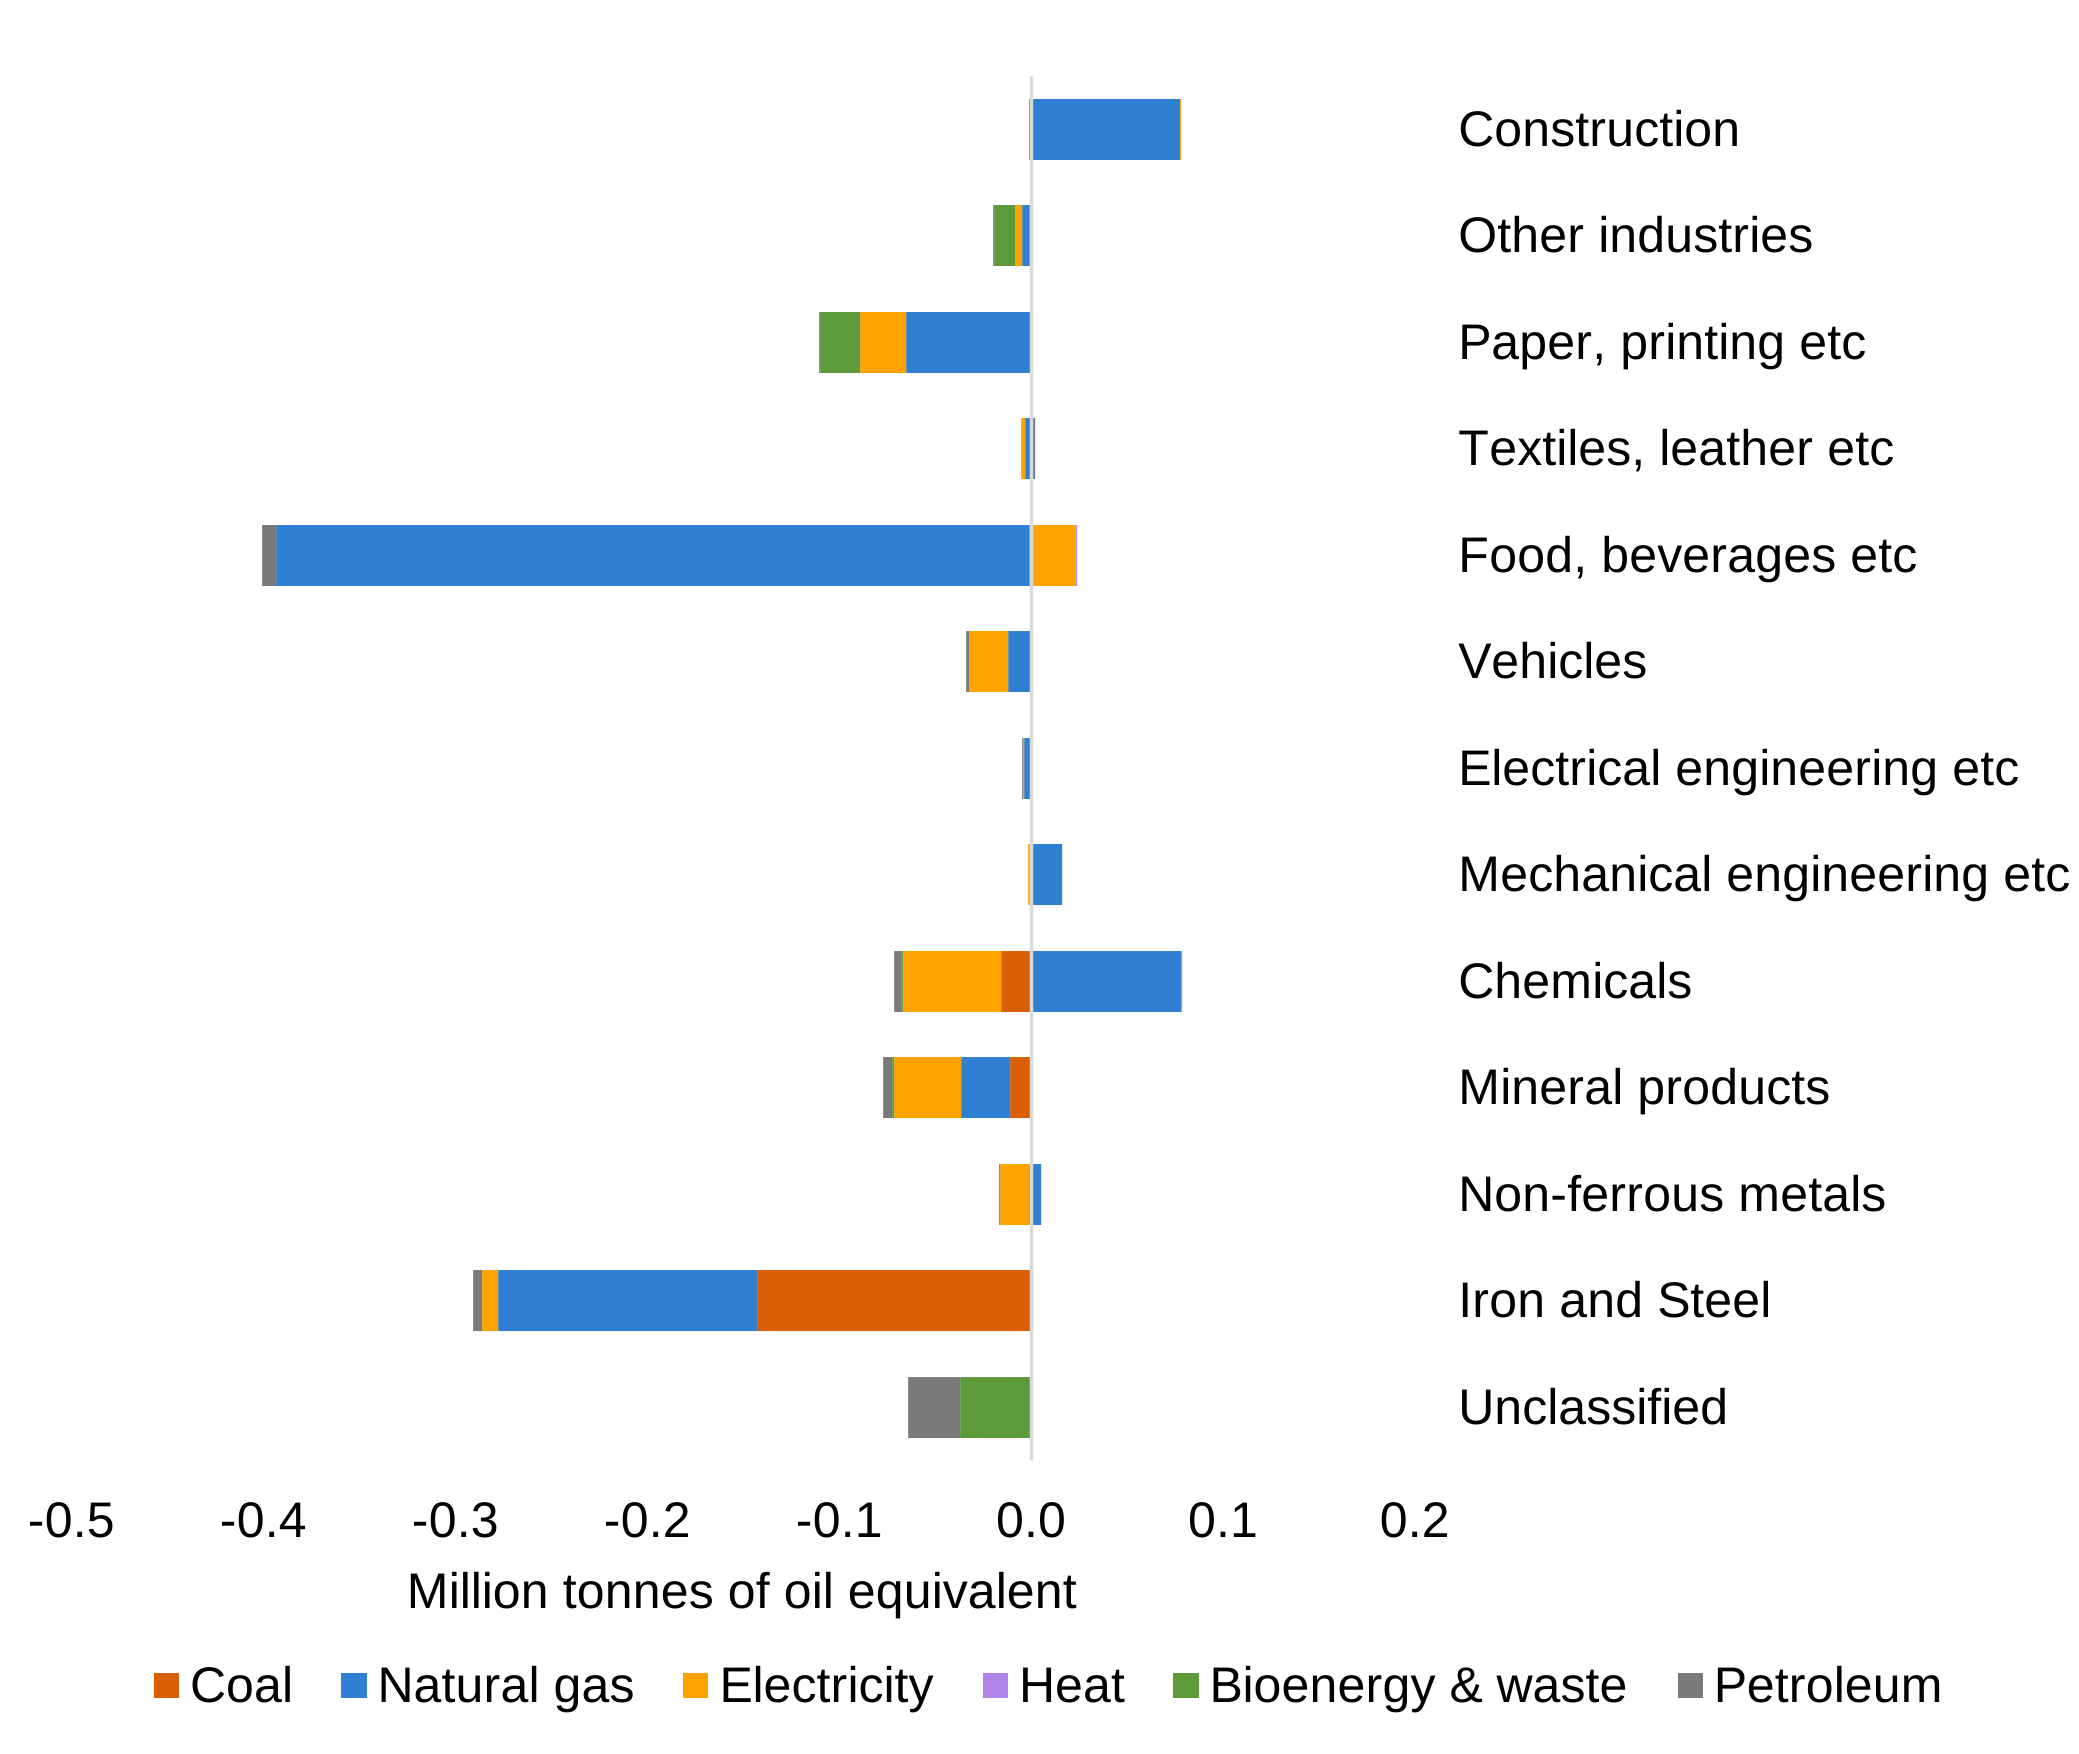
The change in consumption between 2024 and 2025 was primarily driven by reduced natural gas consumption in the food and beverage and iron and steel sub-sectors, and a decrease in the consumption of coal and other solid fuels in the iron and steel sub-sector (Chart 6). The decrease in consumption in the iron and steel sub-sector is likely linked to closures of steelworks, such as the ceasing of operations at Port Talbot.
Chart 6: Change in industrial consumption, 2024 to 2025 (Table C2)
1.5 Services
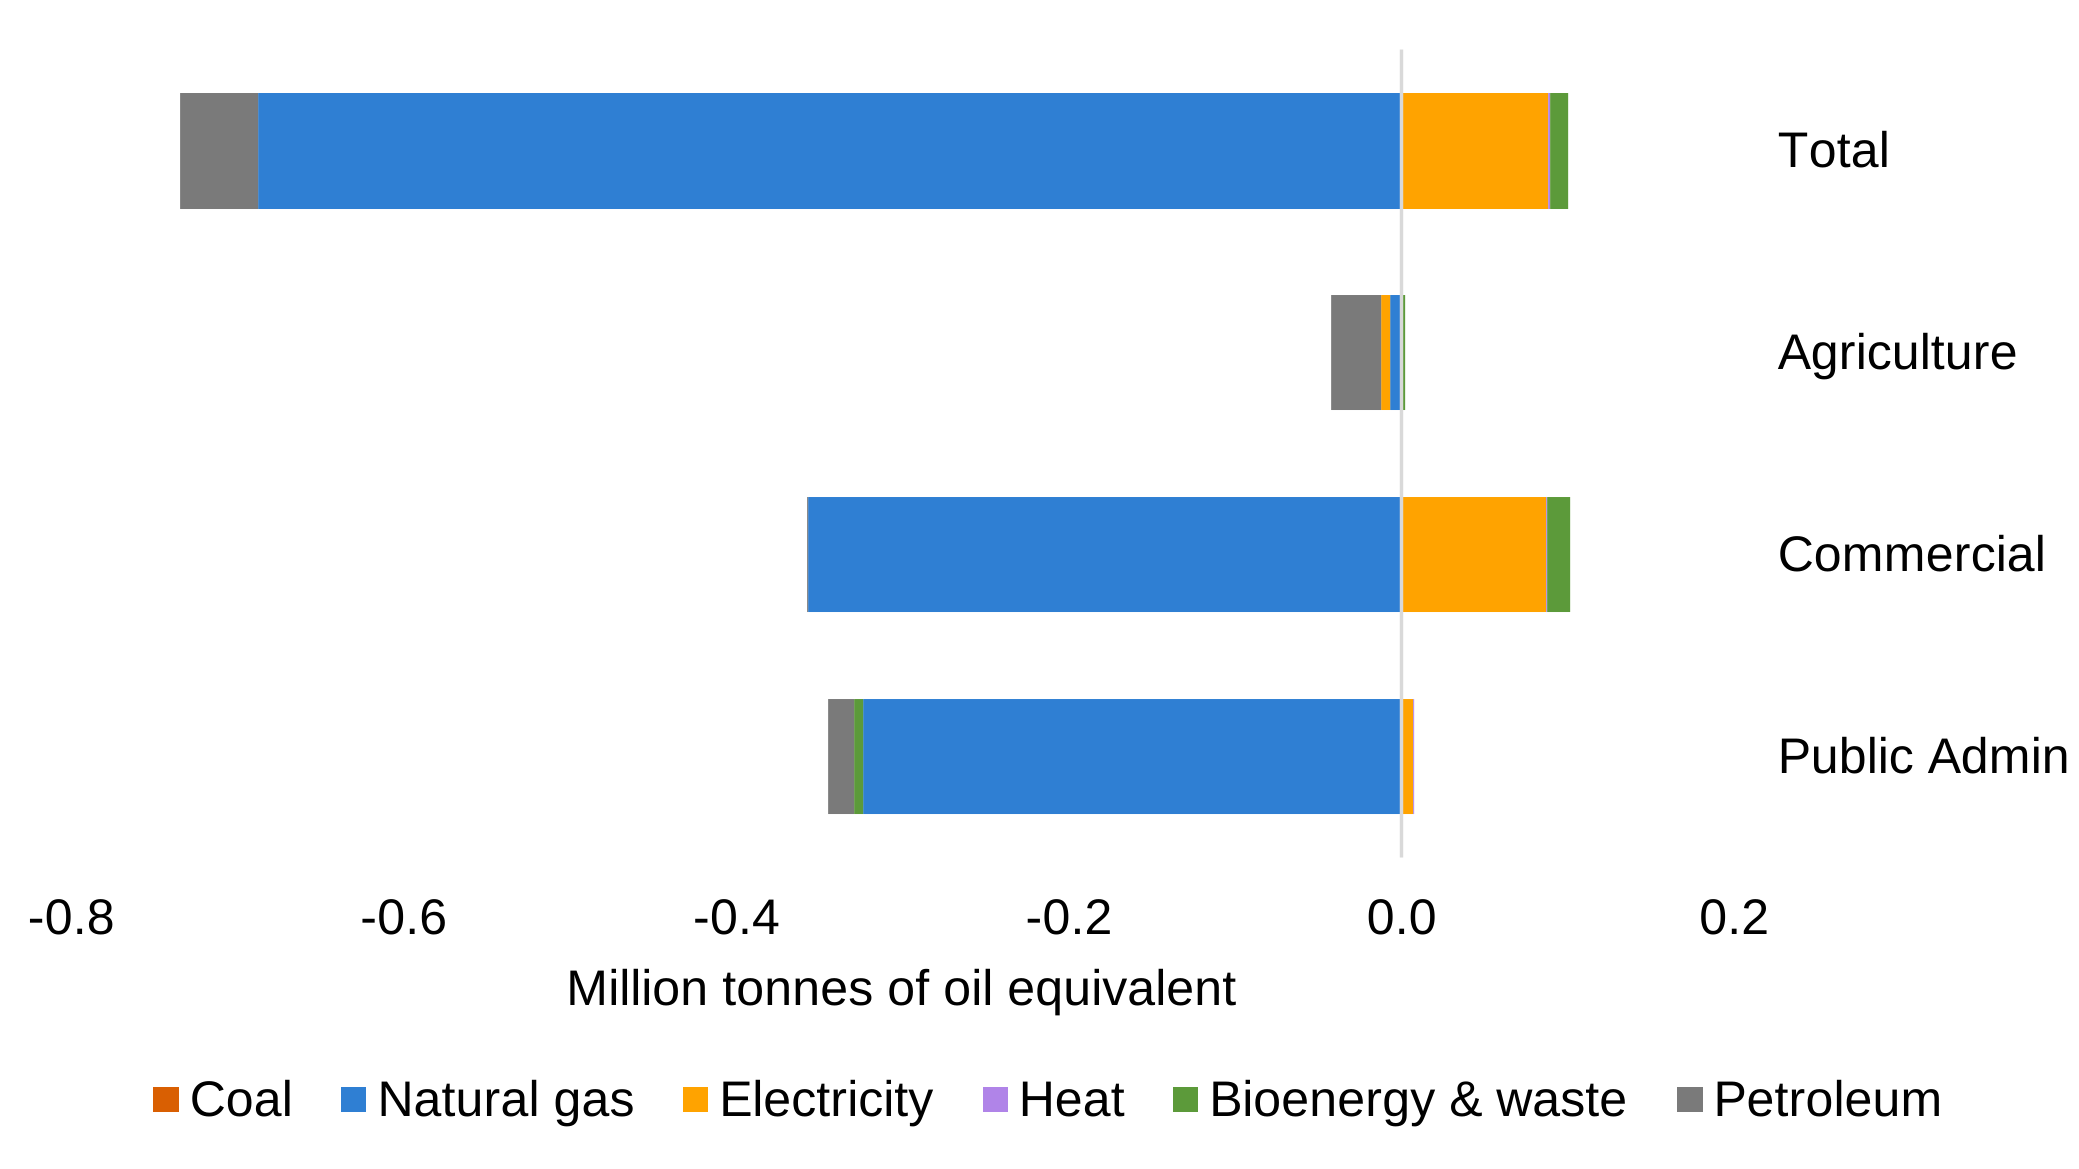
Compared to the other sectors, consumption in the services sector has been more stable, but has been increasing slowly over time, with consumption now 15 per cent higher than in 1970. Consumption in the services sector decreased by 0.6 mtoe (2.9 per cent) between 2024 and 2025. All three services sub-sectors saw a decrease in consumption. However, the overall trend was largely driven by decreases in gas consumption in both the commercial and public administration sub-sectors (Chart 7).
Chart 7: Changes in services consumption, 2024 to 2025 (Table C4)
2. Energy intensity
Energy intensity is the amount of energy per unit of output. It includes (but is not limited to) energy efficiency changes. Units of output vary depending on the sector and sub-sector and relate to economic activity such as distance travelled for the transport sector and Office for National Statistics Index of Production data for the industrial sector. The ECUK methodology document provides further information on the output factors used for each sub-sector.
2.1 Domestic
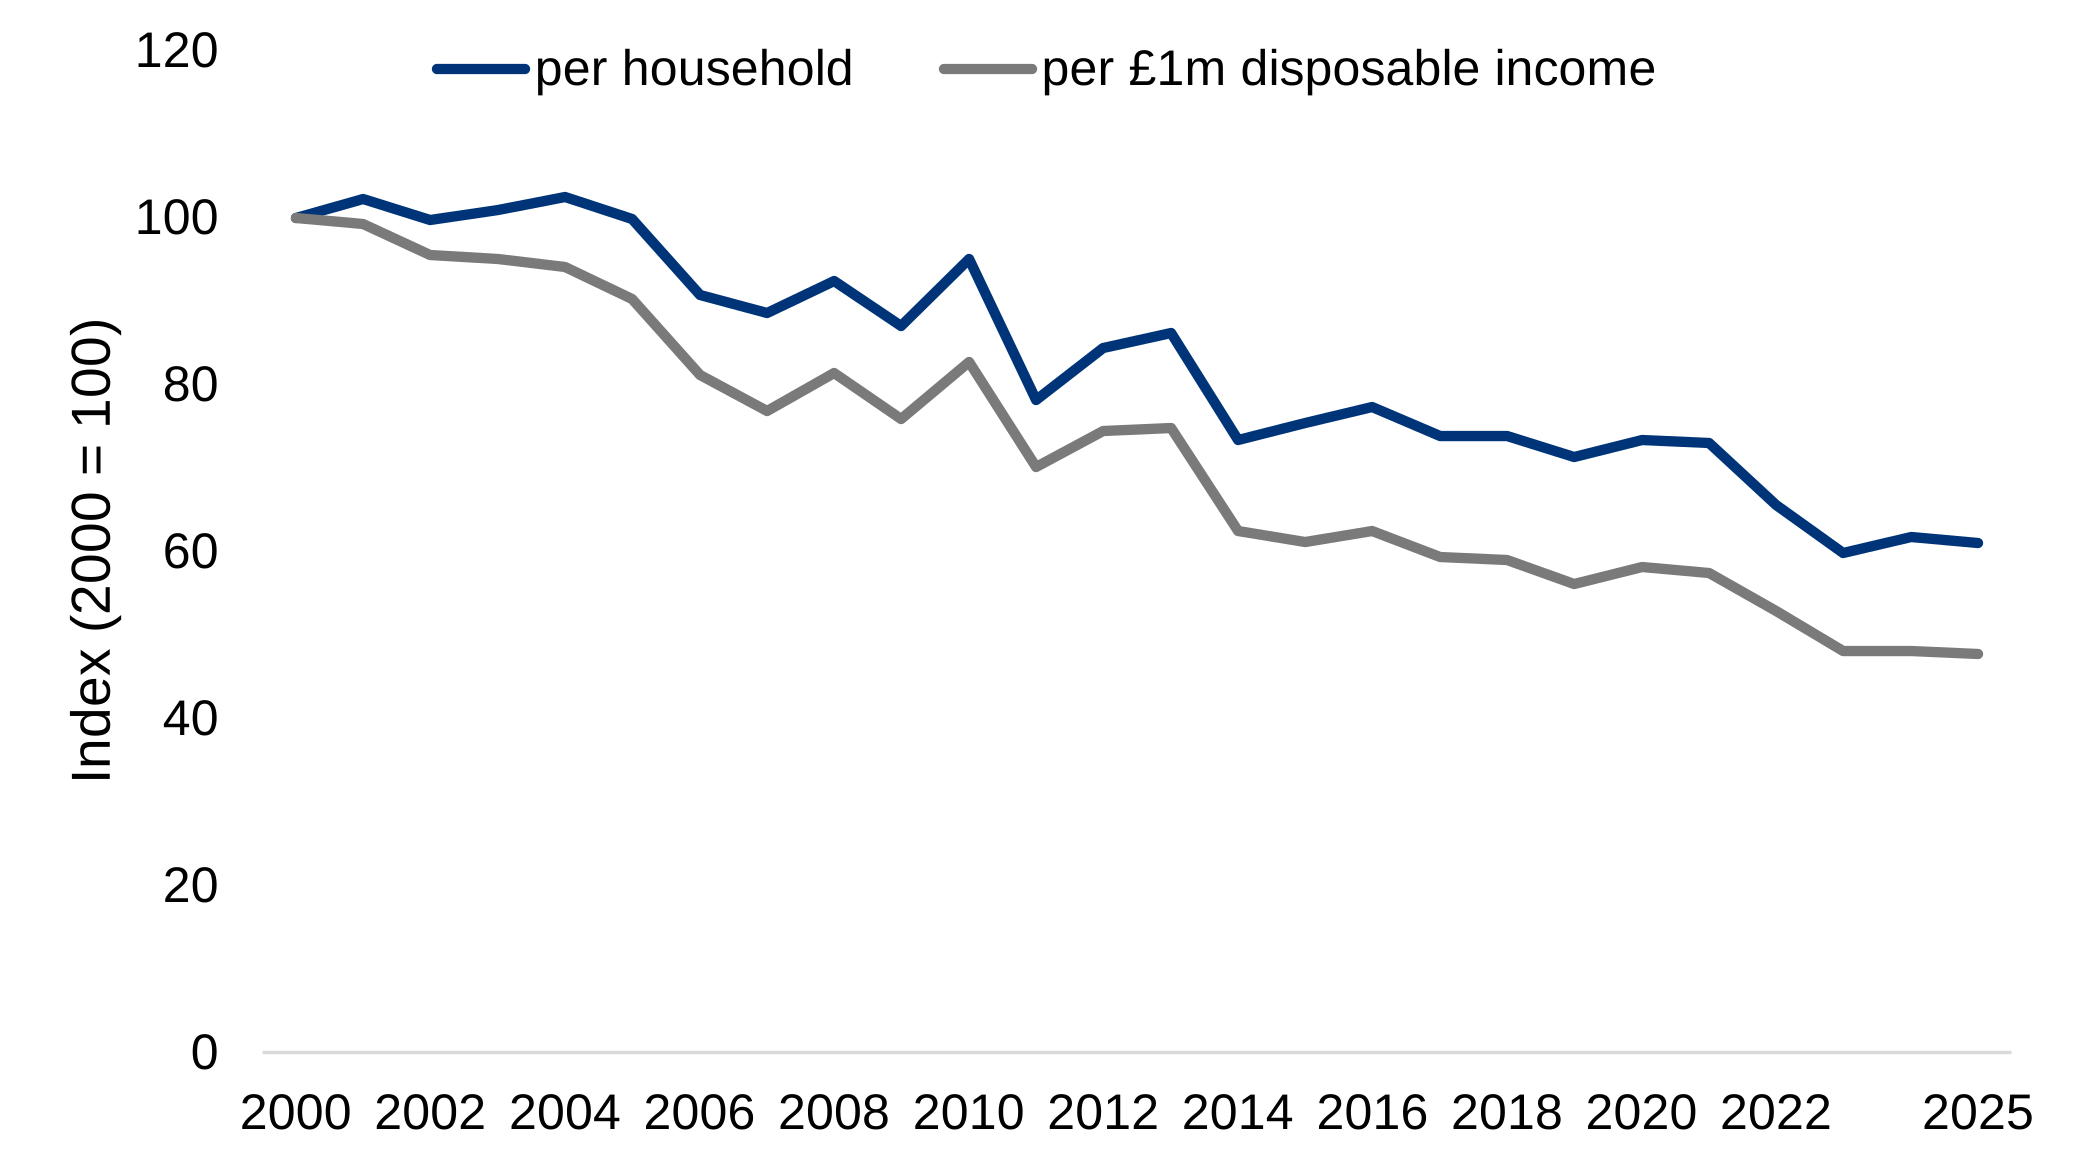
The long-term trend since 2000 has been a reduction in the domestic energy intensity, which can be attributed to improved insulation and more efficient boilers, lighting and consumer appliances. A small increase in domestic energy intensity was seen in 2020 and 2021 as a result of lockdowns and increased home working during the COVID-19 pandemic. In 2022 and 2023 domestic energy intensity decreased, which reflected reduced consumption due to warmer weather and higher energy prices. In 2025 consumption per household decreased by 1.1 per cent, as the number of households increased more rapidly than consumption. This decrease has likely been contributed to by improvements in energy efficiency and slightly warmer average temperatures. Energy consumption per household and a similar metric of consumption per £1 million of disposable income both demonstrate the long-term reducing trend (Chart 8).
Chart 8: Indexed change in energy intensity per household and on disposable income basis, 2000 to 2025 (Table I3)
2.2 Transport
The methodologies for calculating the transport energy intensities have been updated for ECUK 2026. These broadly serve to improve the alignment between the consumption figures and the output measures used, and provide further breakdowns into passenger and freight transport where possible (see Update to transport energy intensity estimates within ECUK). Note that for road and air transport the latest available traffic data is for 2024, therefore intensities for these sectors are only considered up to and including 2024.
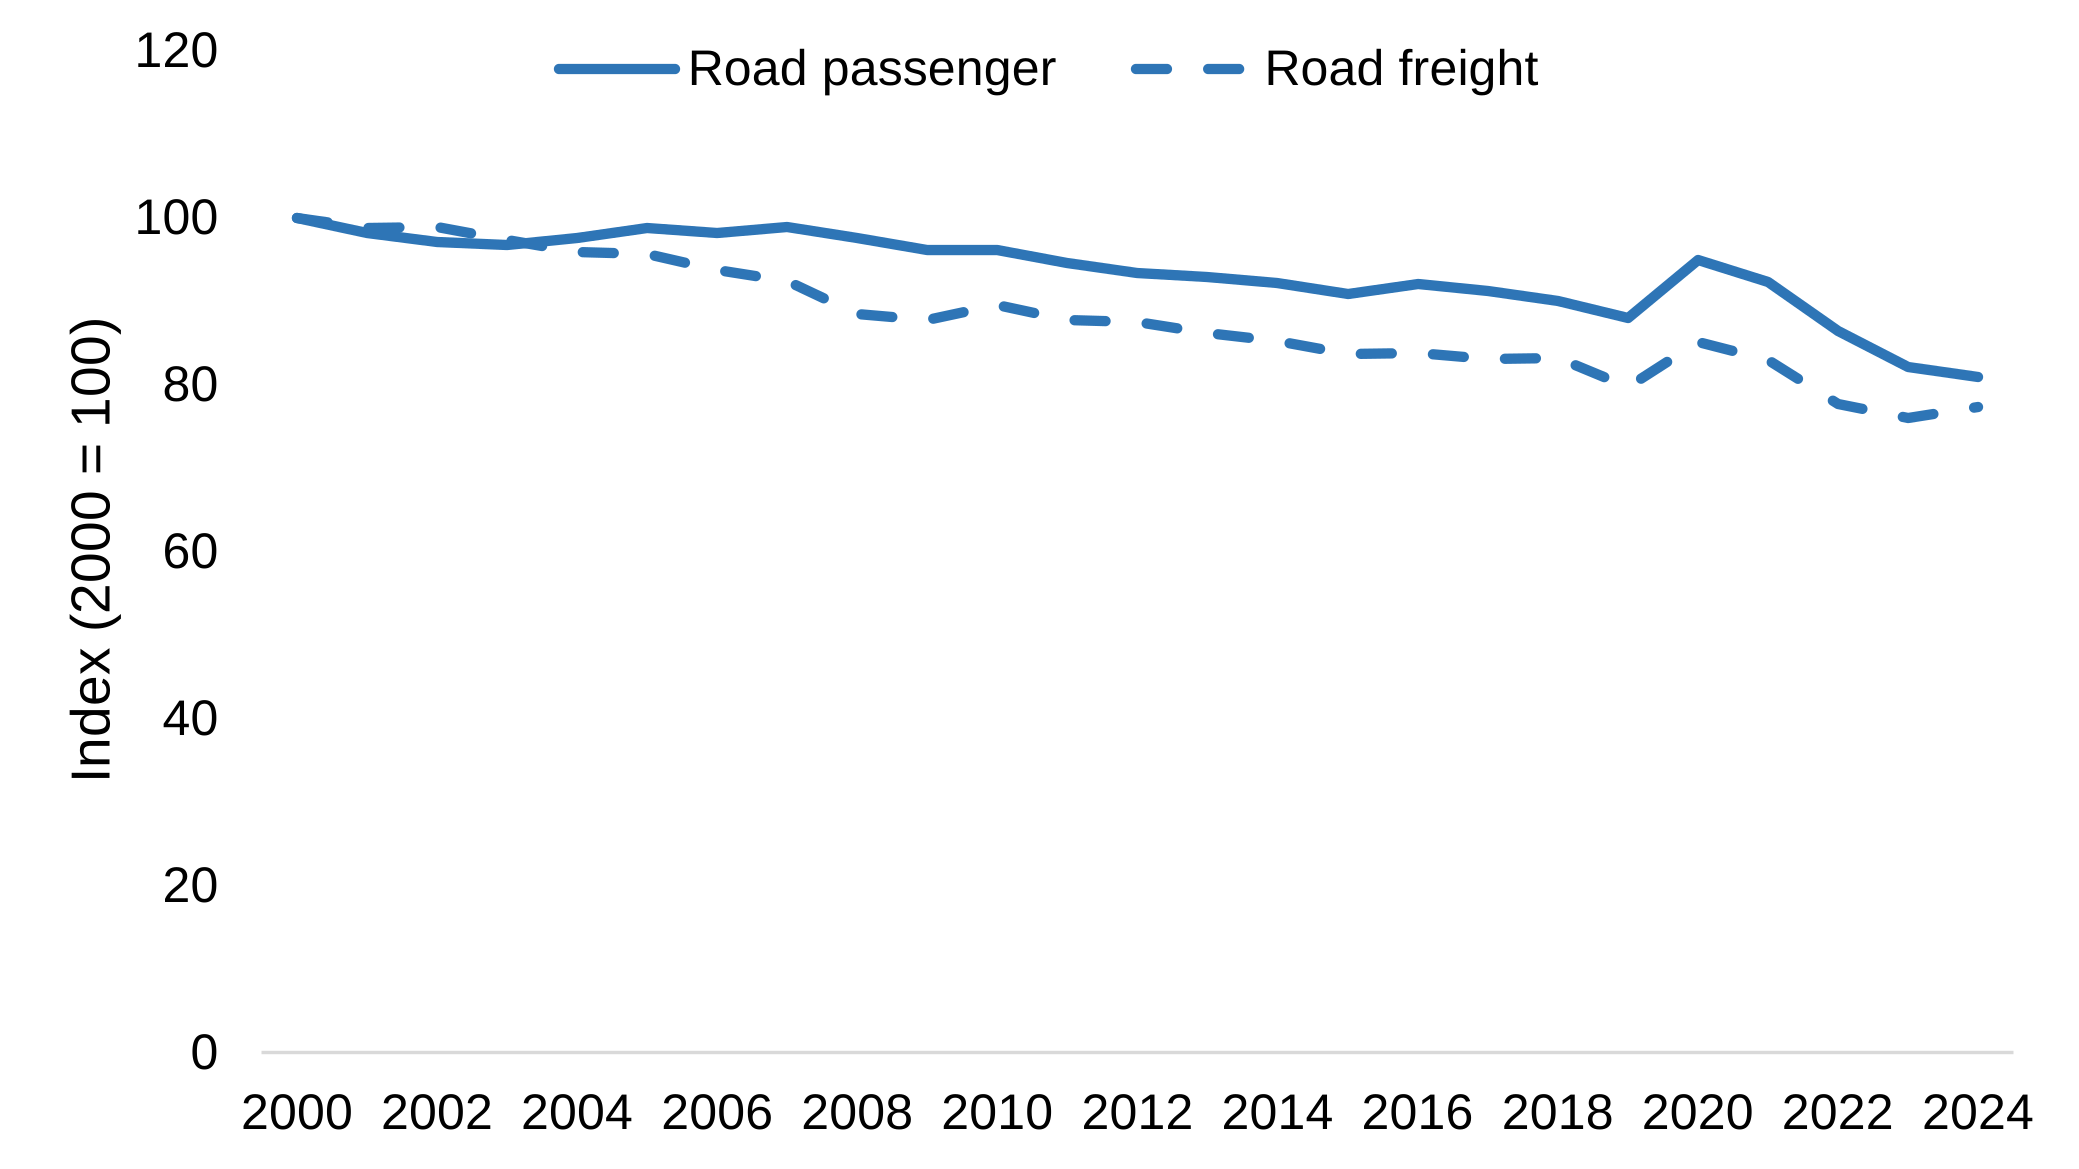
Between 2000 and 2024 there has been a steady decrease in the energy intensity of road passenger transport, from 42.0 ktoe per billion passenger kilometres in 2000 to 34.0 in 2024. This has been contributed to by both a lower consumption (24.7 mtoe in 2024 compared to 29.2 in 2000) and an overall increase in passenger kilometres travelled. This is likely due to a combination of changing fuel mix in the sector, the phasing out of older less efficient vehicles, and more recently the increased adoption of electric vehicles.
The energy intensity for road passenger transport increased slightly in 2020 during the pandemic due to the impact of lockdowns and travel restrictions, but since then has returned to the longer-term decreasing trend. In 2024 there were an estimated 727 billion road passenger kilometres travelled in Great Britain.[footnote 4] This was 1.1 per cent higher than the 719 billion kilometres travelled in 2023, but still 1.8 per cent lower than the 741 billion kilometres travelled in 2019. Energy consumption per billion passenger kilometres decreased by 1.4 per cent between 2023 and 2024 to 34.0 ktoe, the lowest intensity since 2000.
Road freight transport intensity has followed a similar overall trend of decreasing intensity between 2000 and 2024 (Chart 9).
Chart 9: Change in energy intensity for road transport, 2000 to 2024 (Table I2)
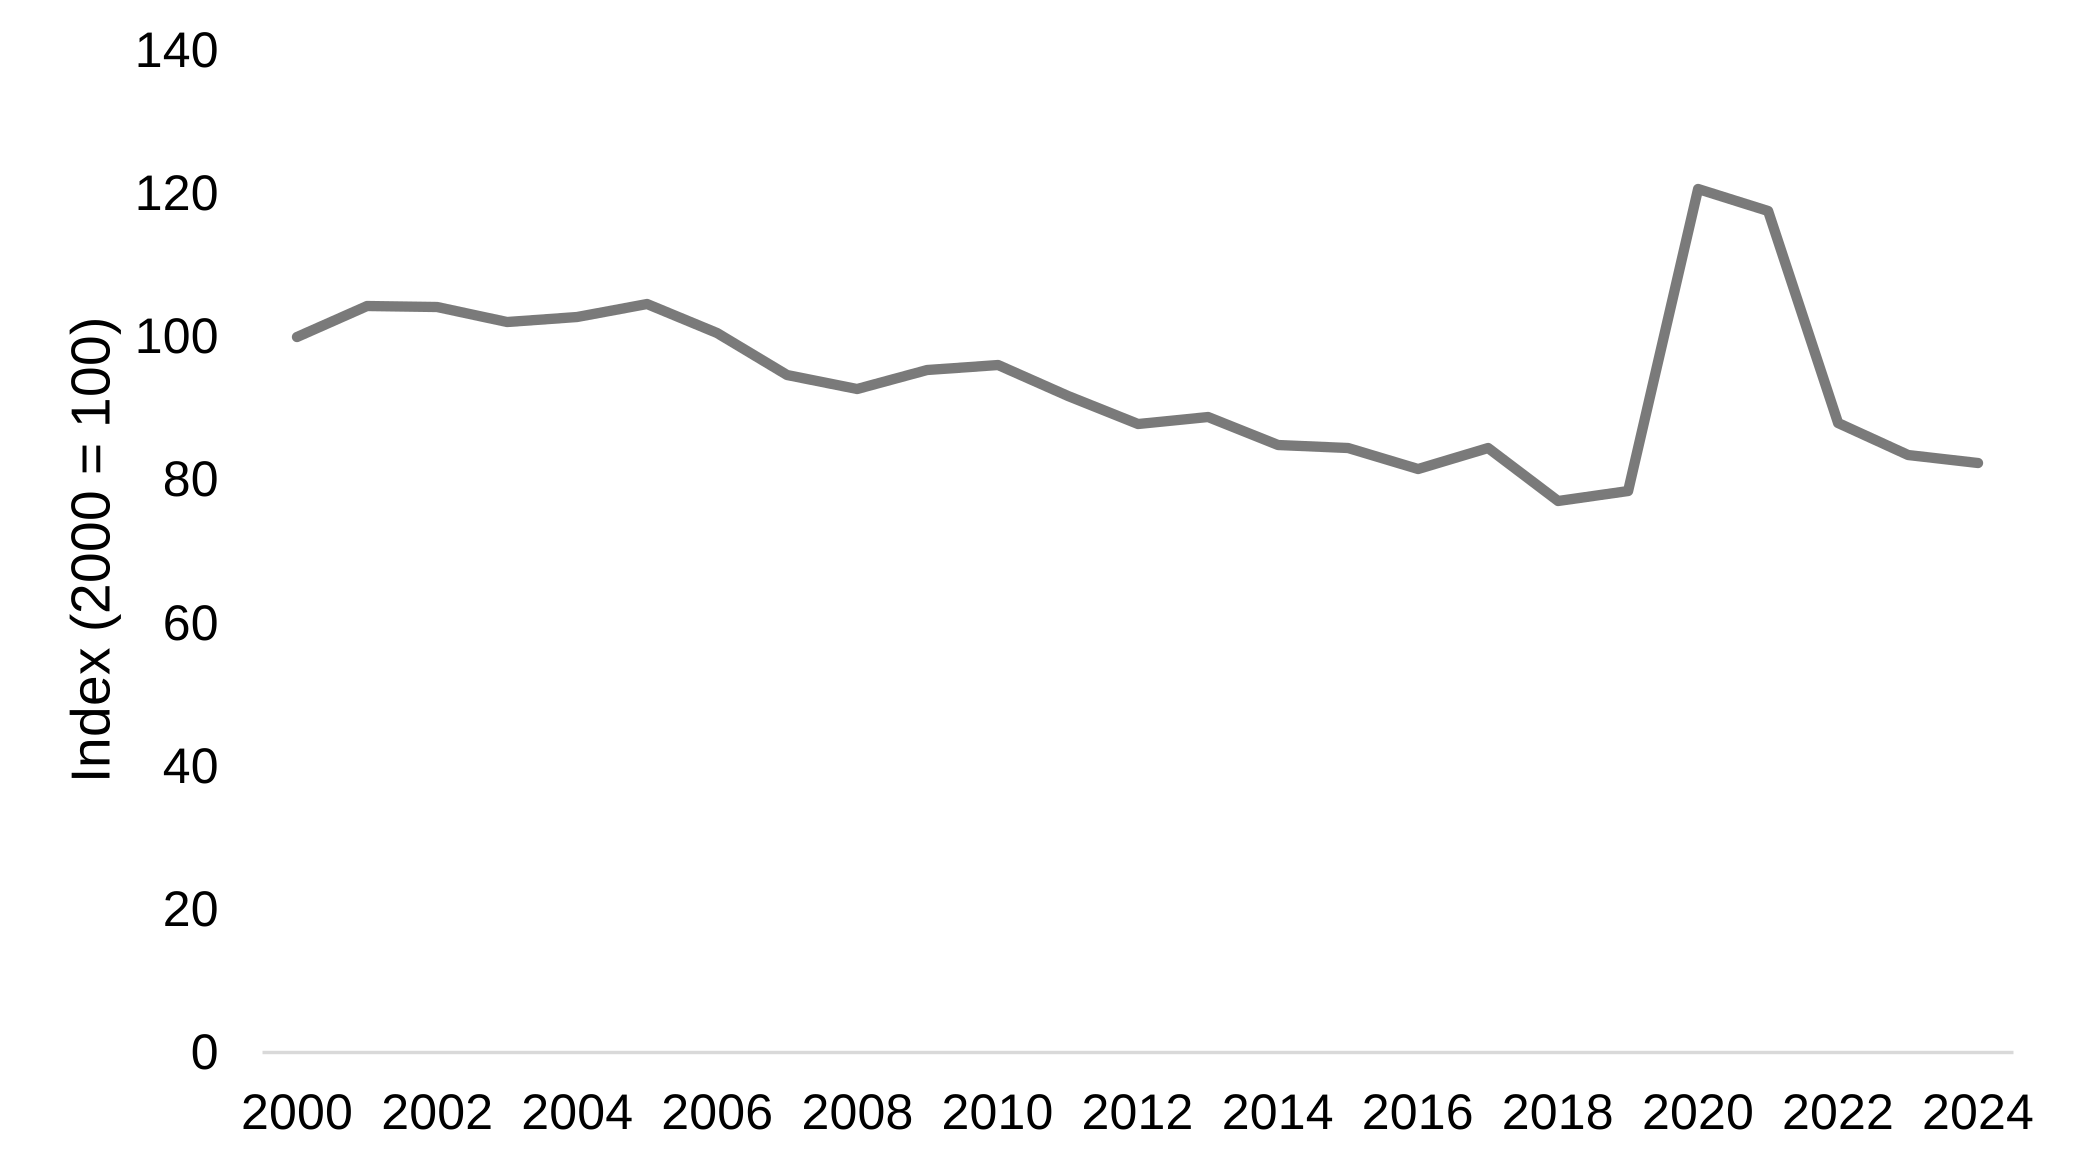
As with road, the long-term trend has been a decrease in energy intensity for air transport. The impact of lockdowns and travel restrictions during the pandemic caused air transport to fall from 23.2 billion tonne kilometres in 2019 to 6.2 billion tonne kilometres in 2021. Since then air transport has been increasing, reaching 22.4 billion tonne kilometres in 2024, 3.5 per cent lower than 2019. The air transport energy intensity in 2024 was the lowest since the pandemic, but still 5.0 per cent higher than 2019. The output measure used for air transport in these calculations is a combined metric representing both passenger travel and freight transport, presented in tonne-km (see the ECUK methodology document for further details).
Chart 10: Change in energy intensity for air transport, 2000 to 2024 (Table I2)
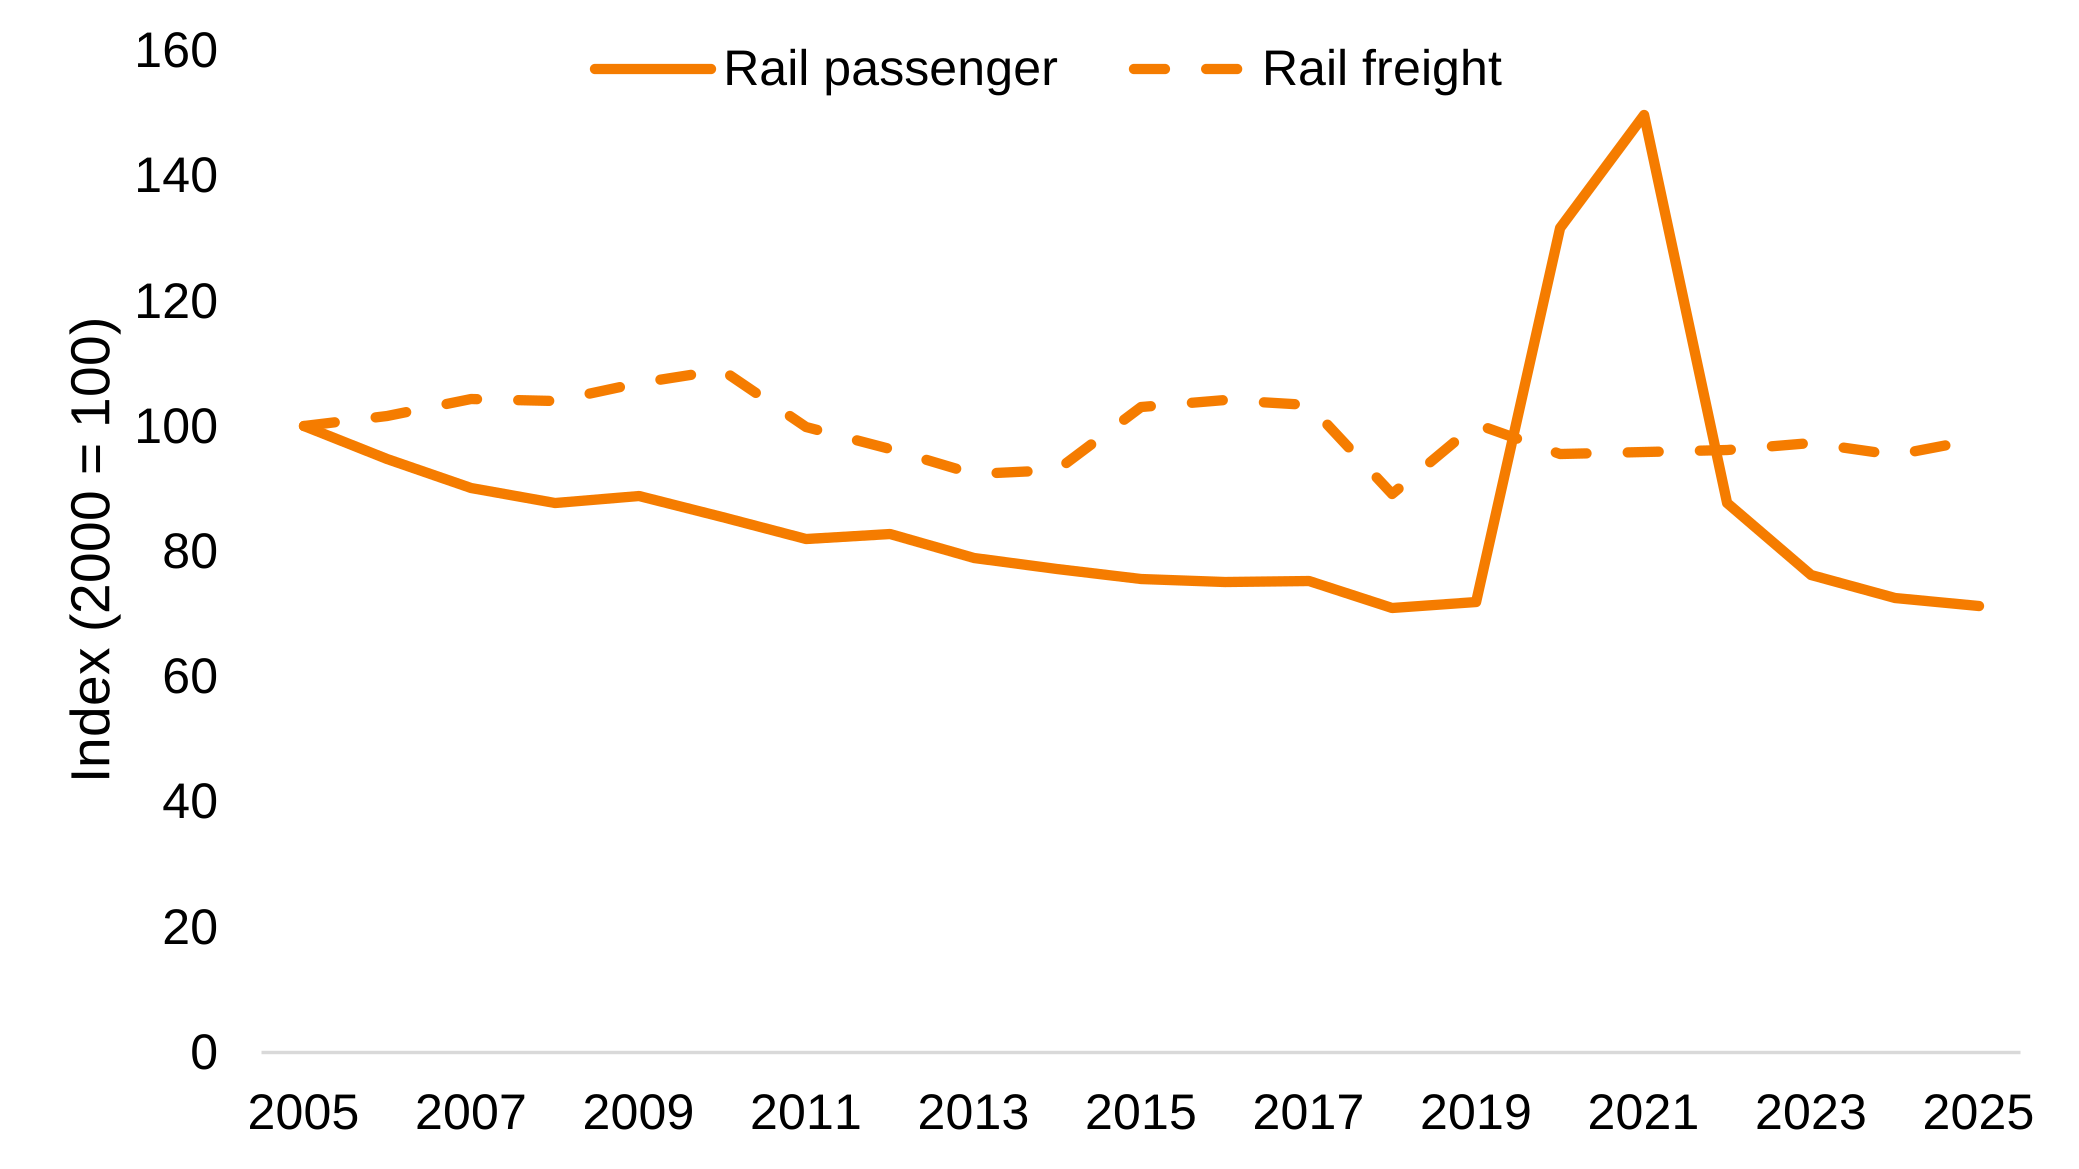
The energy intensity for passenger rail travel was heavily impacted by the pandemic, as passenger loadings decreased due to the impact of lockdowns and travel restrictions. This led to consumption per billion passenger kilometres increasing from 10.8 ktoe in 2019 to 22.4 ktoe in 2021. Since then the energy intensity has fallen rapidly, and in 2025 was 10.7 ktoe per billion passenger kilometres.
The energy intensity for freight rail travel has been much more consistent than passenger rail travel (Chart 11). Since 2005 the energy consumption for freight rail has fallen by 26 per cent, with freight tonne kilometres falling by 24 per cent.
Chart 11: Change in energy intensity for rail transport, 2005 to 2025 (Table I2)
2.3 Industry
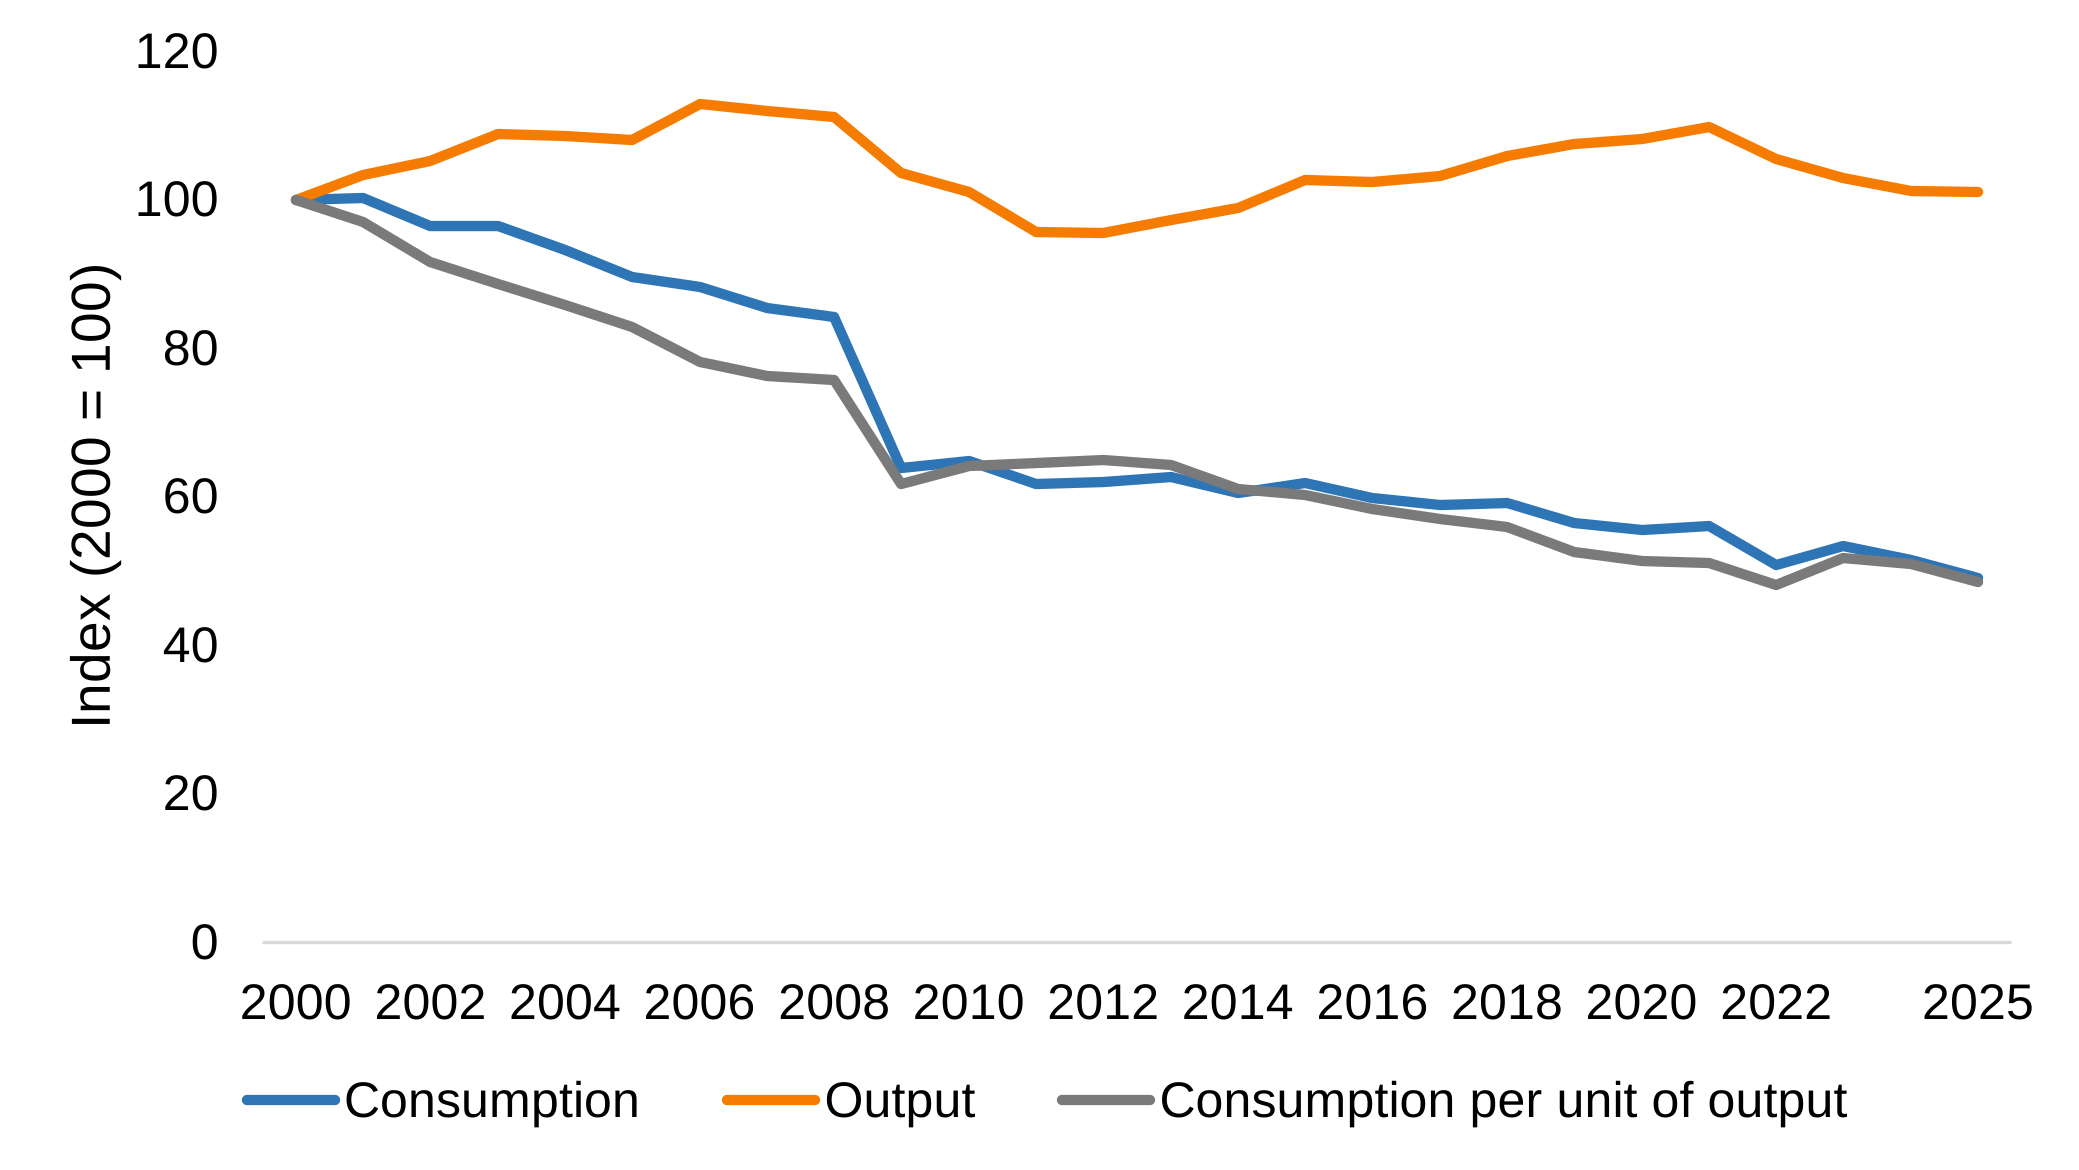
Since 1970 industrial output (measured using ONS index of production and gross value added data) has been maintained or increased, while overall energy consumption levels have decreased. This has led to a long-term falling trend in industrial energy intensity, where the value realised from industrial processes has required less energy. This can be attributed to changes in the kinds of products being manufactured as well as increased process efficiency.
Between 2024 and 2025 industrial output fell by just 0.2 per cent, whereas energy consumption decreased by 4.9 per cent. Consequently, the energy intensity decreased by 4.7 per cent to 176 ktoe per unit of output. The energy intensity values over recent years are some of the lowest across the time series since 1970, suggesting a sustained improvement in energy efficiency (Chart 12).
Chart 12: Indexed change in industrial consumption, output and intensity, 2000 to 2025 (Table I4)
2.4 Services
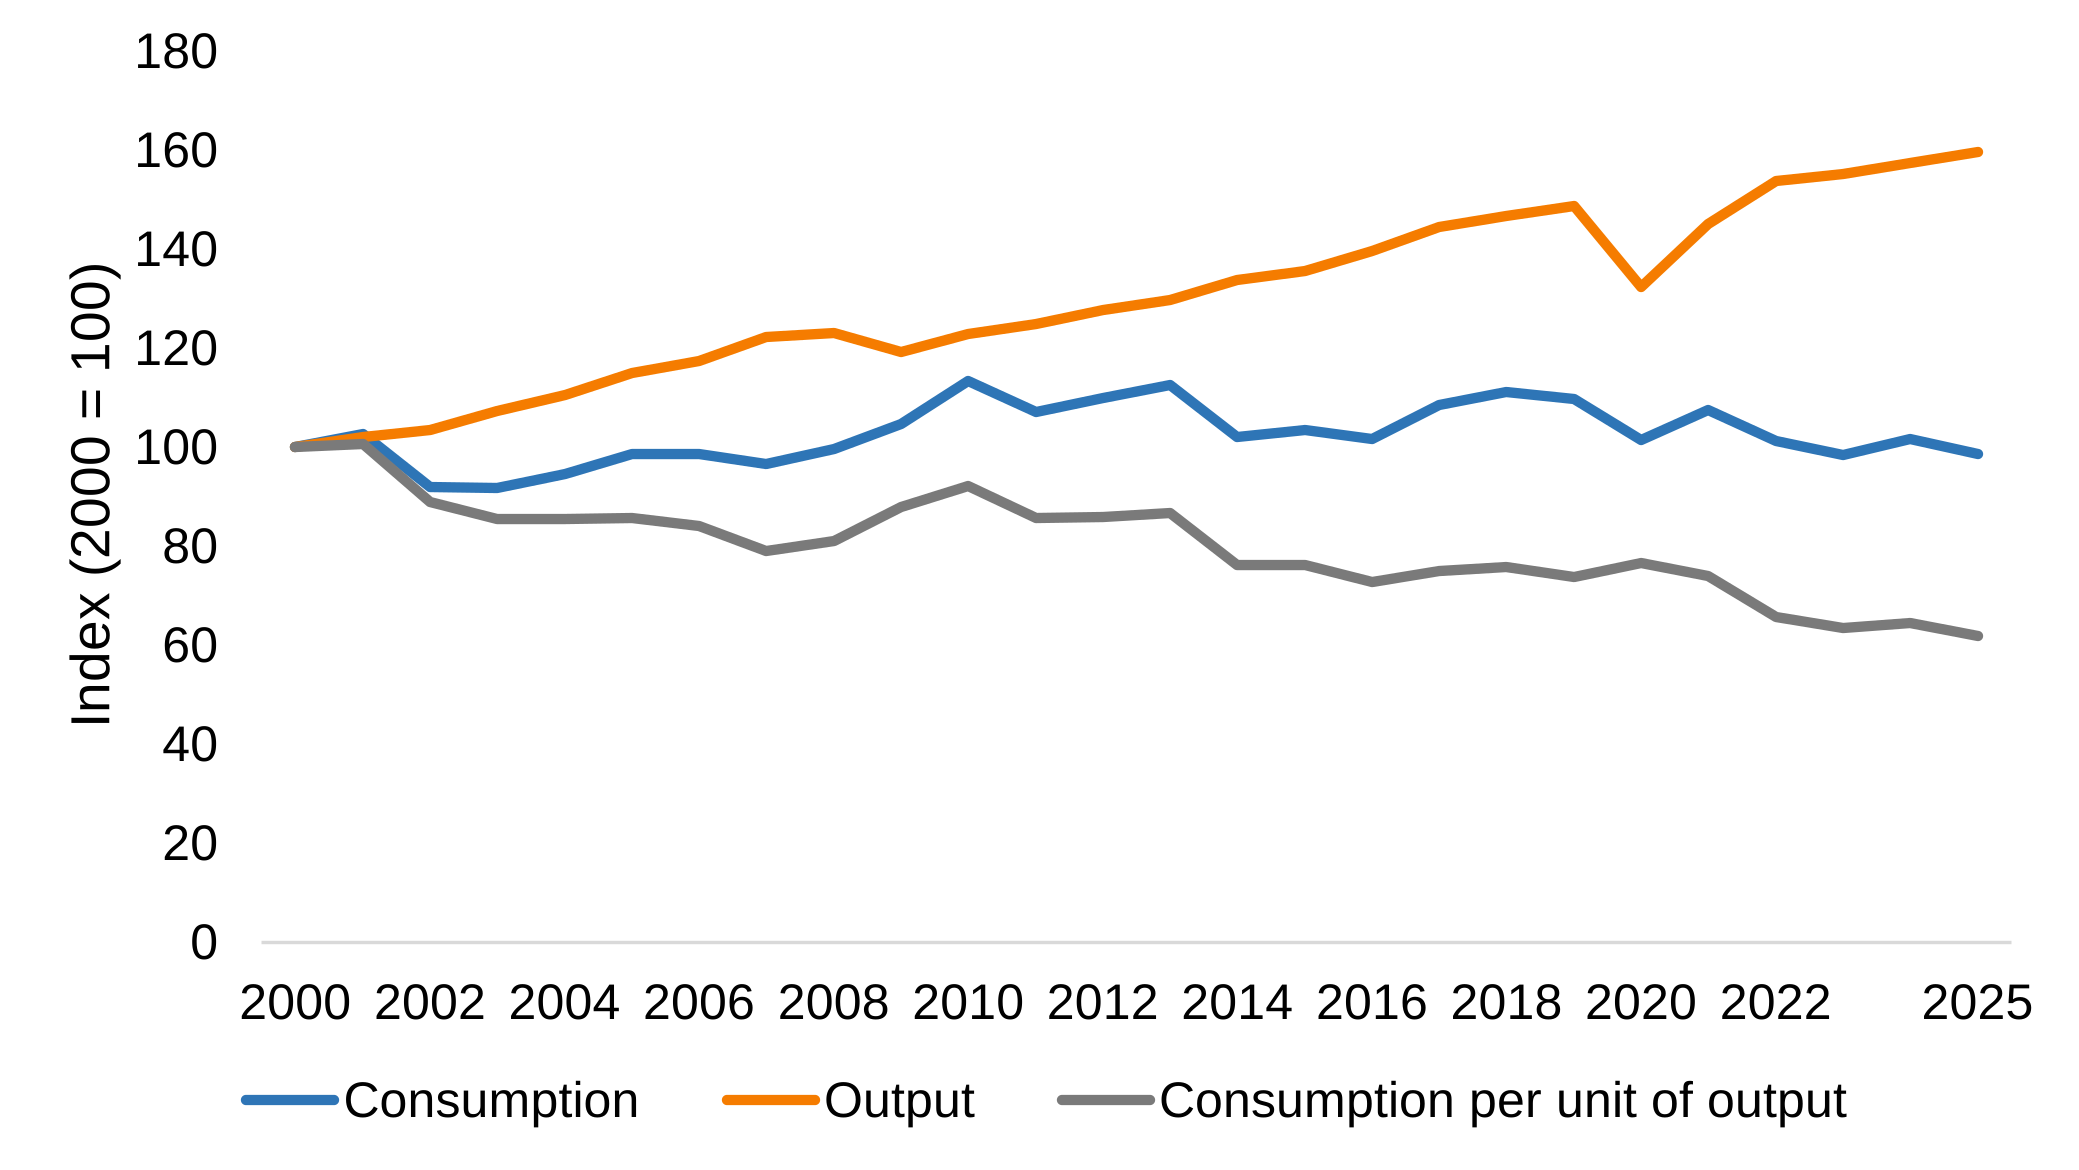
Economic activity (measured using ONS gross value added data) in the services sector (excluding agriculture) has been on a long-term increasing trend. Output in 2020 and 2021 was impacted by the COVID-19 pandemic but since then the increasing trend has continued. Between 2024 and 2025, energy consumption decreased by 2.9 per cent while output increased by 1.4 per cent. Consequently, energy intensity in the services sector decreased in 2025 to 195 ktoe per unit of output. This is the lowest intensity value for the services sector in the time series (Chart 13).
Chart 13: Indexed change in services consumption (excluding agriculture), output and intensity, 2000 to 2025 (Table I5)
2.5 Output and intensity factors
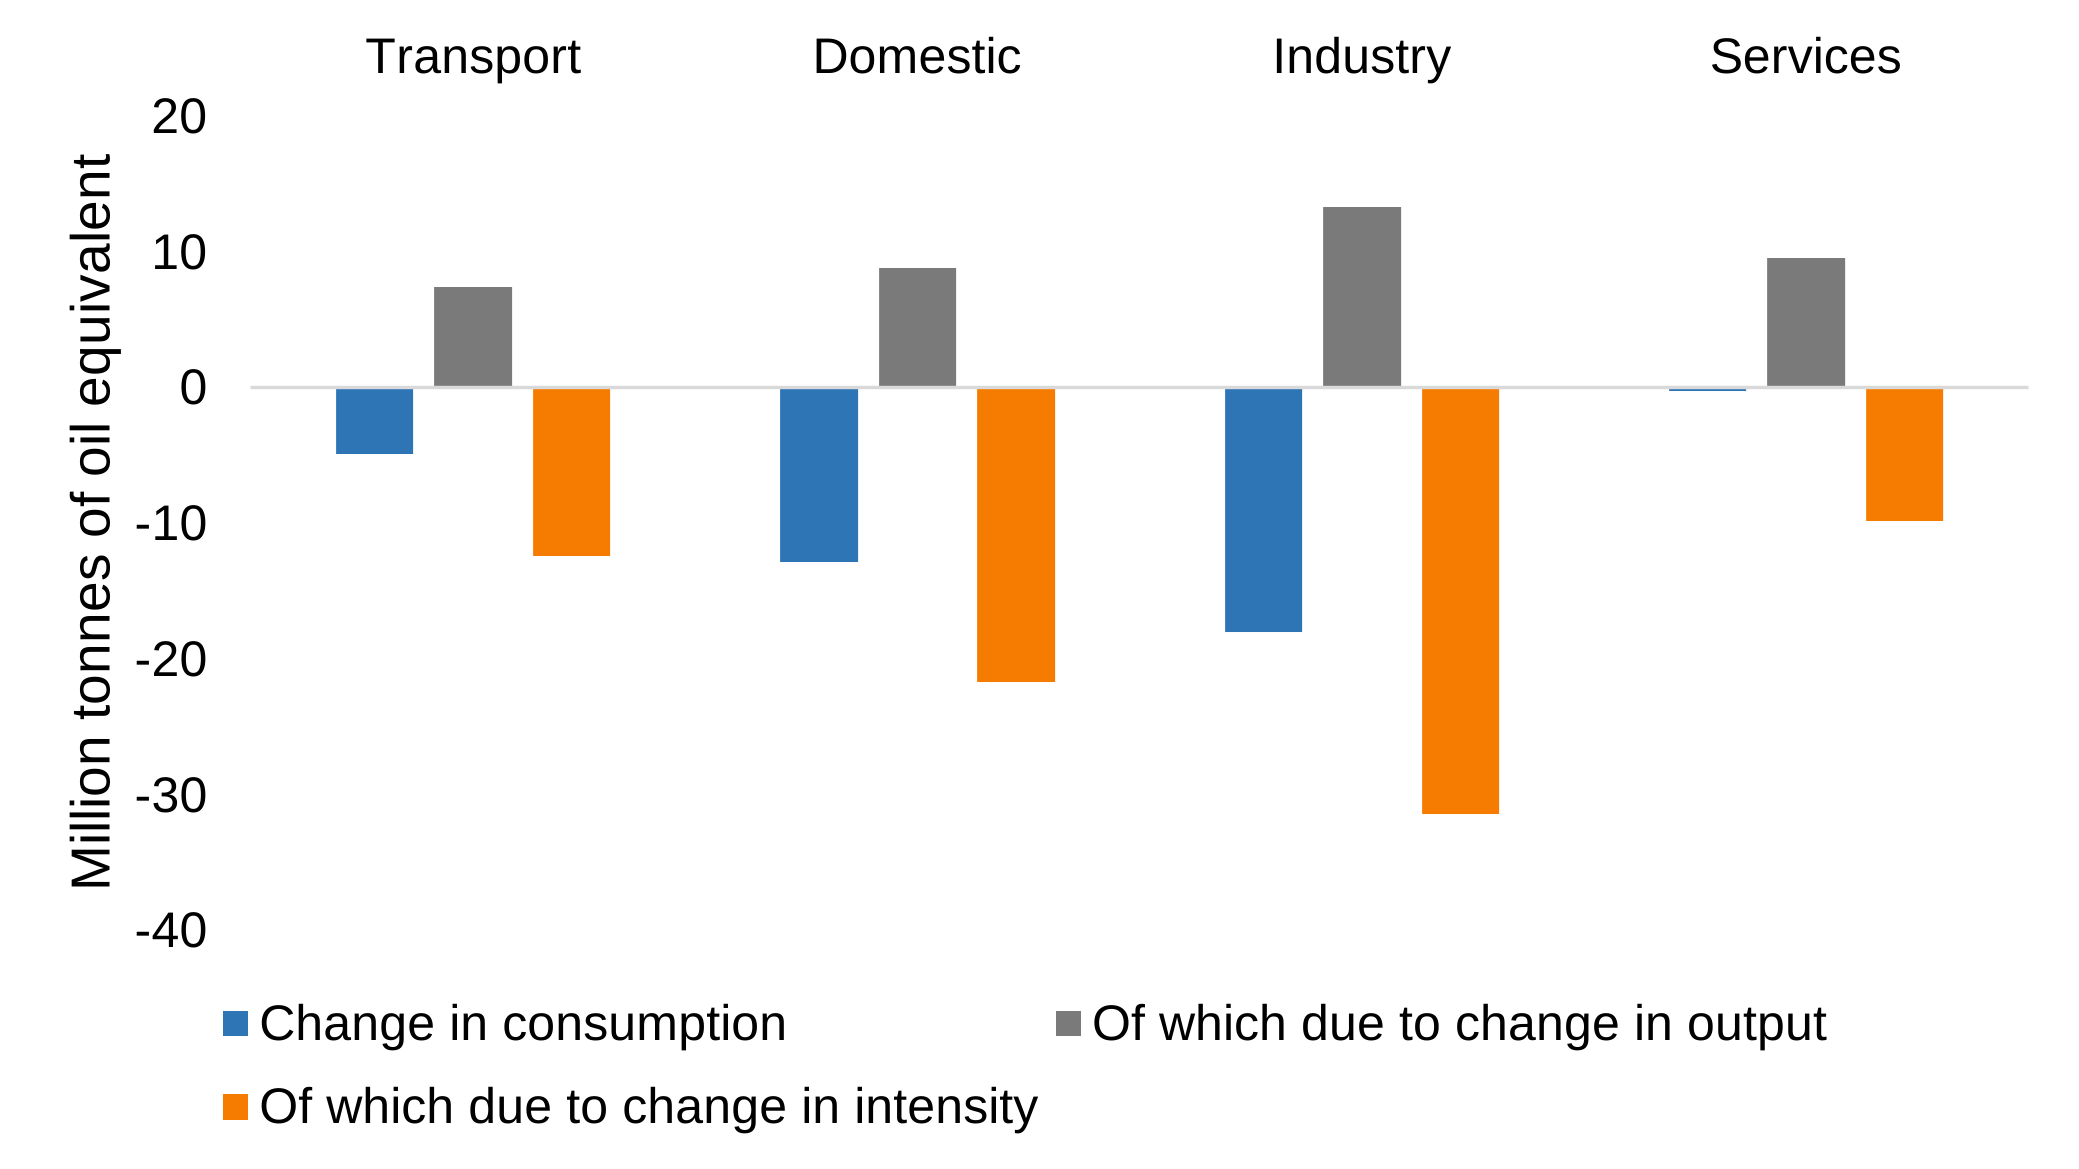
Chart 14 shows the contributions of changes in output and changes in intensity to changes in energy consumption between 2000 and 2025 (2005 to 2024 for transport). The output effect is the change in consumption which would have occurred had all other factors remained constant. The remaining difference is then the intensity effect.
Decreased energy intensity has offset the increased consumption that would have been seen due to economic growth in services and industry. Similarly, in the domestic sector energy consumption has decreased despite increasing numbers of households. In the transport sector the improvements in energy intensity have offset the increased consumption that would otherwise have been expected from the greater distances travelled.
Chart 14: Output and intensity effects by sector, 2000 to 2025 (2005 to 2024 for transport) (Table I6)
3. Primary energy
Primary energy consumption is the amount of fuel used prior to any loss of energy through conversion or transformation. The primary energy equivalent includes the losses incurred during the transformation process.
3.1 Total primary consumption
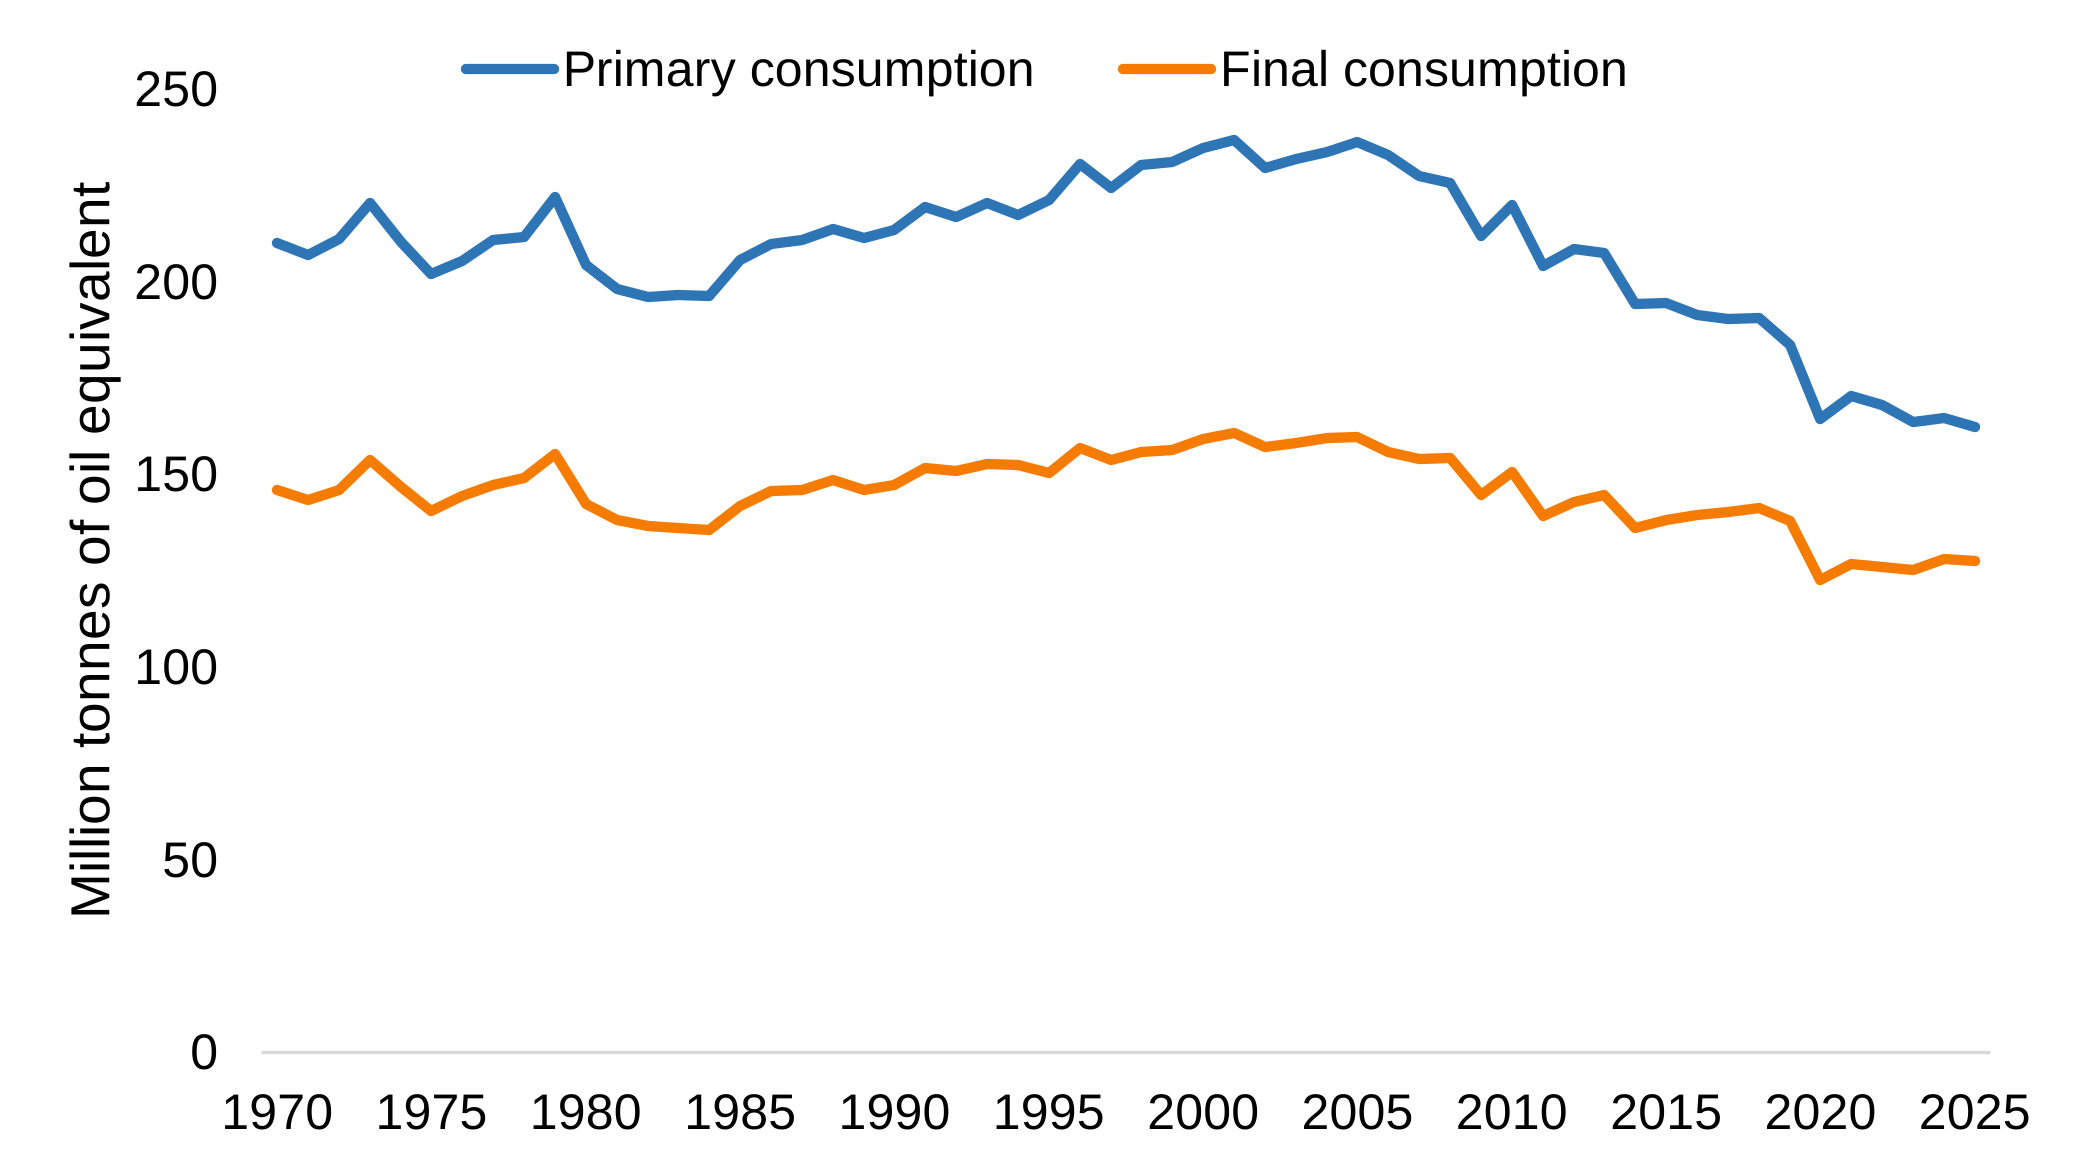
Primary energy consumption is made up of the fuel used prior to any conversion or transformation plus the direct usage of each fuel. Total primary energy consumption (excluding non-energy use) in the UK rose steadily from the early 1980s, peaking in the early 2000s at around 235 mtoe per year. Since then primary consumption has been decreasing, linked to increased renewables and reduced use of fossil fuels for electricity generation. In 2025 primary energy consumption decreased by 1.3 per cent compared to 2024 to a total of 162.5 mtoe. This is the lowest primary energy consumption in the UK in the ECUK time series (Chart 15).
Chart 15: Total primary and final energy consumption, 1970 to 2025 (Table P2)
3.2 Primary to final energy ratio
The ratio of primary energy to final energy consumption gives an indication of the efficiency of transformation, i.e. how many tonnes of oil equivalent are required to produce one tonne of oil equivalent final consumption. A reduction in the primary to final energy ratio implies greater efficiency in the delivery of final energy.
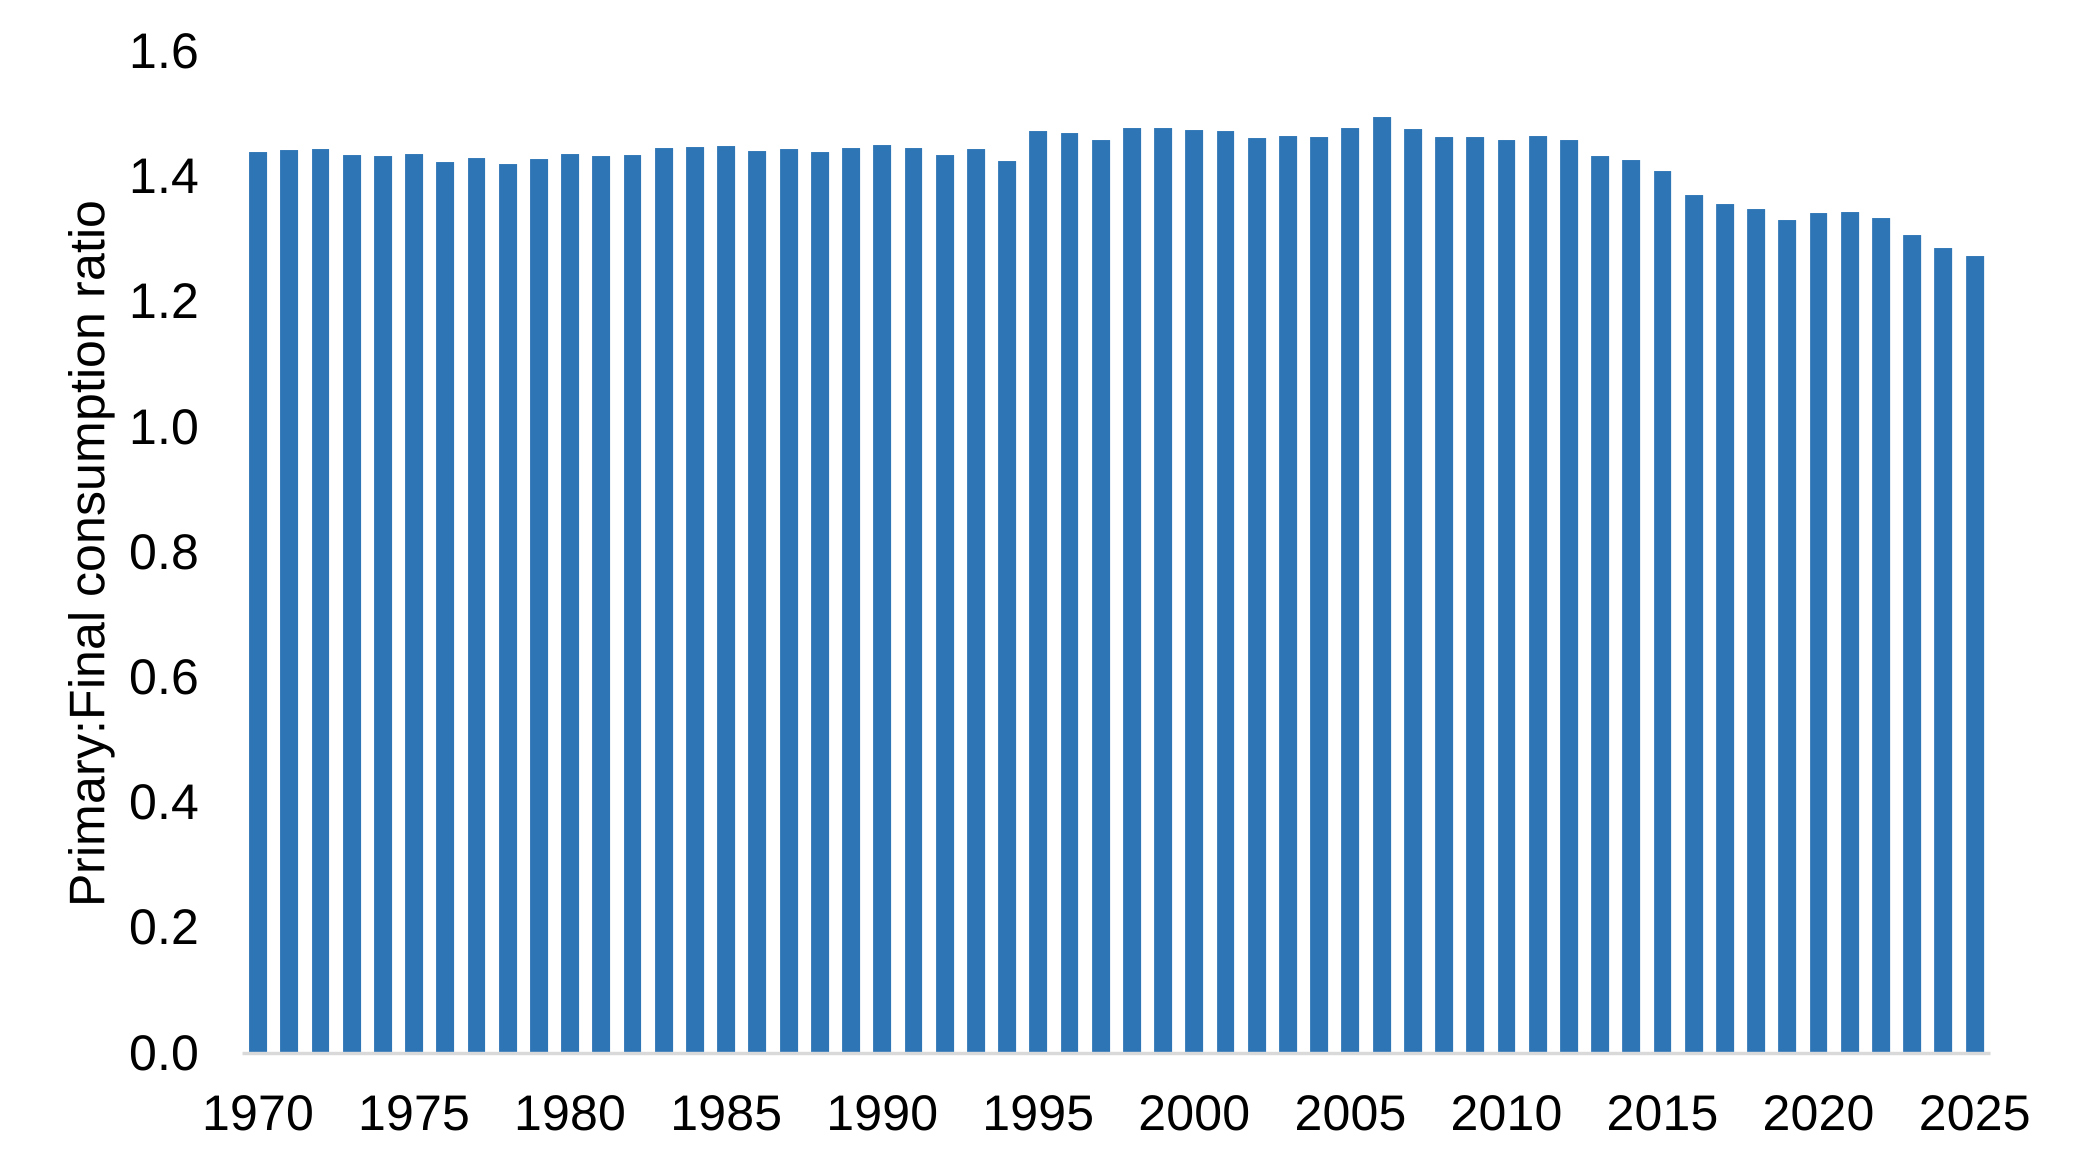
The primary to final energy ratio in the UK remained relatively consistent from 1970 to around 2010, ranging from 1.42 to 1.50. Since then the ratio has steadily decreased, reaching 1.27 in 2025 (Chart 16). This is likely due to a combination of the phasing out of coal from the fuel mix and the increasing adoption of renewable sources of electricity generation.
Chart 16: Primary to final energy ratio, 1970 to 2025 (Table P2)
For ECUK 2026 a number of the primary energy tables previously published have been discontinued. These were known to have low usage among users, and have been replaced with a new suite of tables covering the whole energy flow (see below). The aim of this change is to provide users with a more useful and relevant set of tables. We are keen to hear feedback from users to understand if these changes are beneficial and if there are any outstanding needs for the tables previously presented. Please contact energyconsumption.stats@energysecurity.gov.uk with any comments or feedback.
4. Whole energy flow
Whole energy flow analysis considers the entire energy system, covering primary energy demand and considering the uses and losses throughout the system through to end use efficiency once energy has been delivered into consumption. This analysis introduces the concept of useful and rejected energy, where useful energy serves the intended purpose of an end use (e.g. an appliance) and rejected energy is energy that is lost or does not serve its intended purpose. End use efficiency estimates are based on desk research and as such may not fully represent real-world efficiency.
4.1 Whole energy flow analysis in ECUK
The Department has previously published special feature articles on the whole energy flow incorporating end use efficiency, in June 2019 and March 2025. From 2026 the whole energy flow analysis has been incorporated into ECUK for the first time, with a new series of data tables being made available. These statistics are currently classed as Official Statistics in development as we are continuing to develop the underlying methodology. As such we are keen to hear feedback from users on these data. Please contact energyconsumption.stats@energysecurity.gov.uk with any comments or feedback.
Whole energy flow analysis considers how this energy is actually used, and whether it is used for its intended purpose, or rejected. Useful energy is defined as energy that is utilised for its intended purpose, for example light emitted by a light bulb. Comparatively, rejected energy is defined as energy that does not serve its intended purpose, for example heat emitted by a light bulb. Rejected energy covers all energy not serving the intended purpose, regardless of if there are some secondary usages that may be considered useful. For example, heat emitted from a light bulb could be considered a useful contribution to heat demand in winter. However in this analysis that energy would still be considered as rejected.
Useful energy is estimated using assumptions on the efficiency of different end uses or consumption sectors. Assumptions are derived from a mixture of public sources and internal assumptions. These typically reflect results from laboratory testing, and not real-world performance. See the ECUK methodology document for further details. The data tables published alongside this release show the efficiencies used in the useful energy estimates for 2025 data (Assumed Efficiencies data table). Users may wish to enter their own efficiency factors to understand how the balance between useful and rejected energy can change, and how these efficiencies impact the proportion of final energy consumption that is categorised as useful.
4.2 Final energy consumption useful and rejected energy
Final energy consumption in 2025 was 127.7 mtoe. From this a total of 74.9 mtoe of energy was used for its intended purpose (58.5 per cent of the total), while 53.2 mtoe (41.5 per cent) was rejected. The proportion of final energy consumption used for its intended purpose in 2025 is higher than it was in 2017, when the value was 53.1 per cent. This is primarily due to the incorporation of updated assumptions on end use efficiency, which should broadly represent improvements in efficiency within the UK market. Note that heat pumps create useful energy from ambient heat, meaning they have an efficiency of greater than 100 per cent in this analysis. Consequently the sum of useful energy and rejected energy exceeds the initial final energy consumption value.
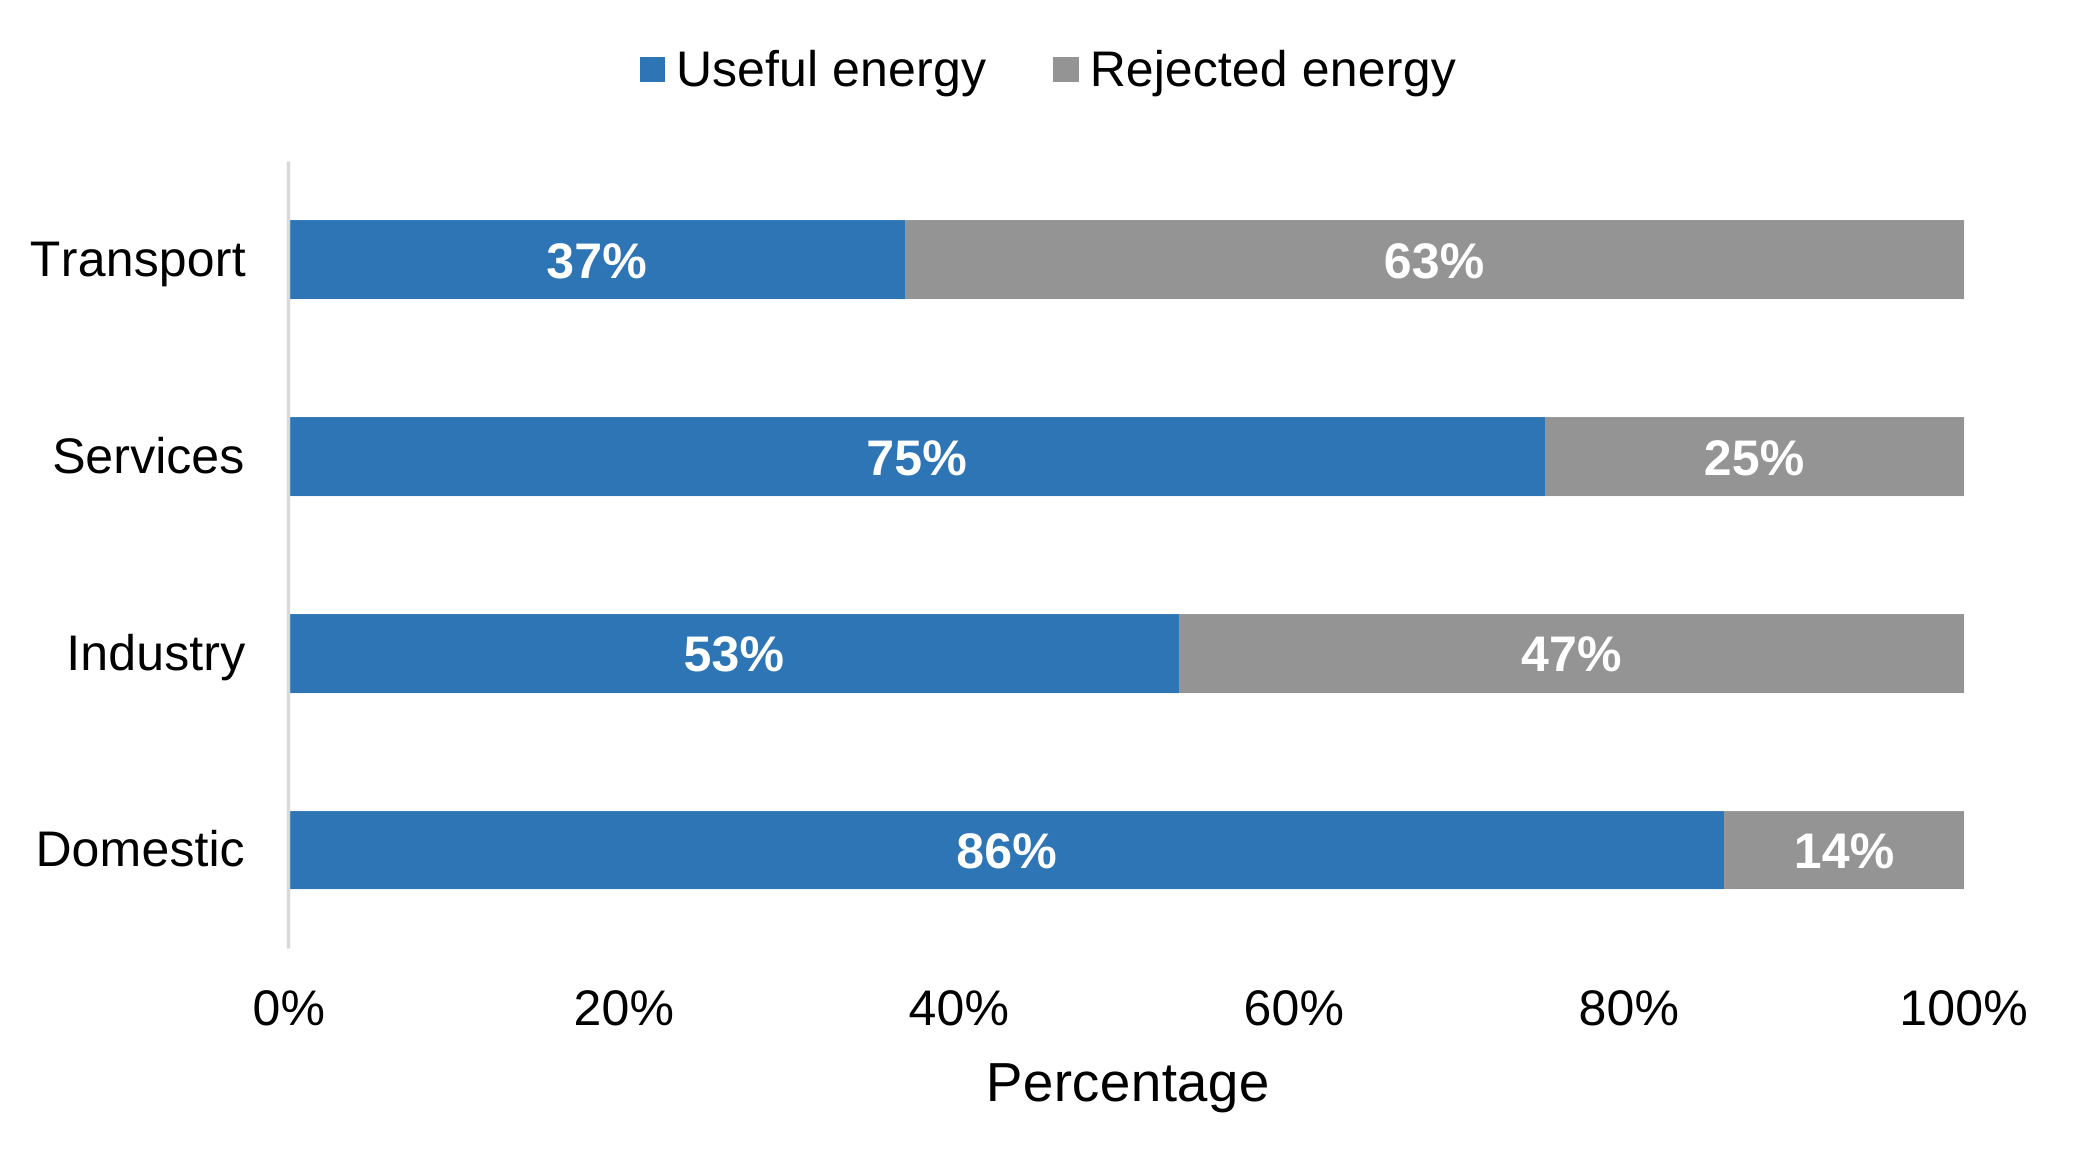
End use energy efficiency proportions vary significantly across sectors, influenced by factors such as the type of fuel used and the efficiency of end use appliances. The transport sector has the lowest overall efficiency, with only 37 per cent of energy in the sector being categorised as useful. This is largely due to the relative inefficiency of internal combustion engines. Comparatively the domestic sector has the highest end use efficiency with 86 per cent of energy categorised as useful, which can primarily be attributed to the relatively high reported efficiency of gas boilers for space and water heating when compared to petroleum use in transport.
Chart 17: Useful and rejected energy proportions by sector, 2025 (Table W2)
4.3 Whole energy system
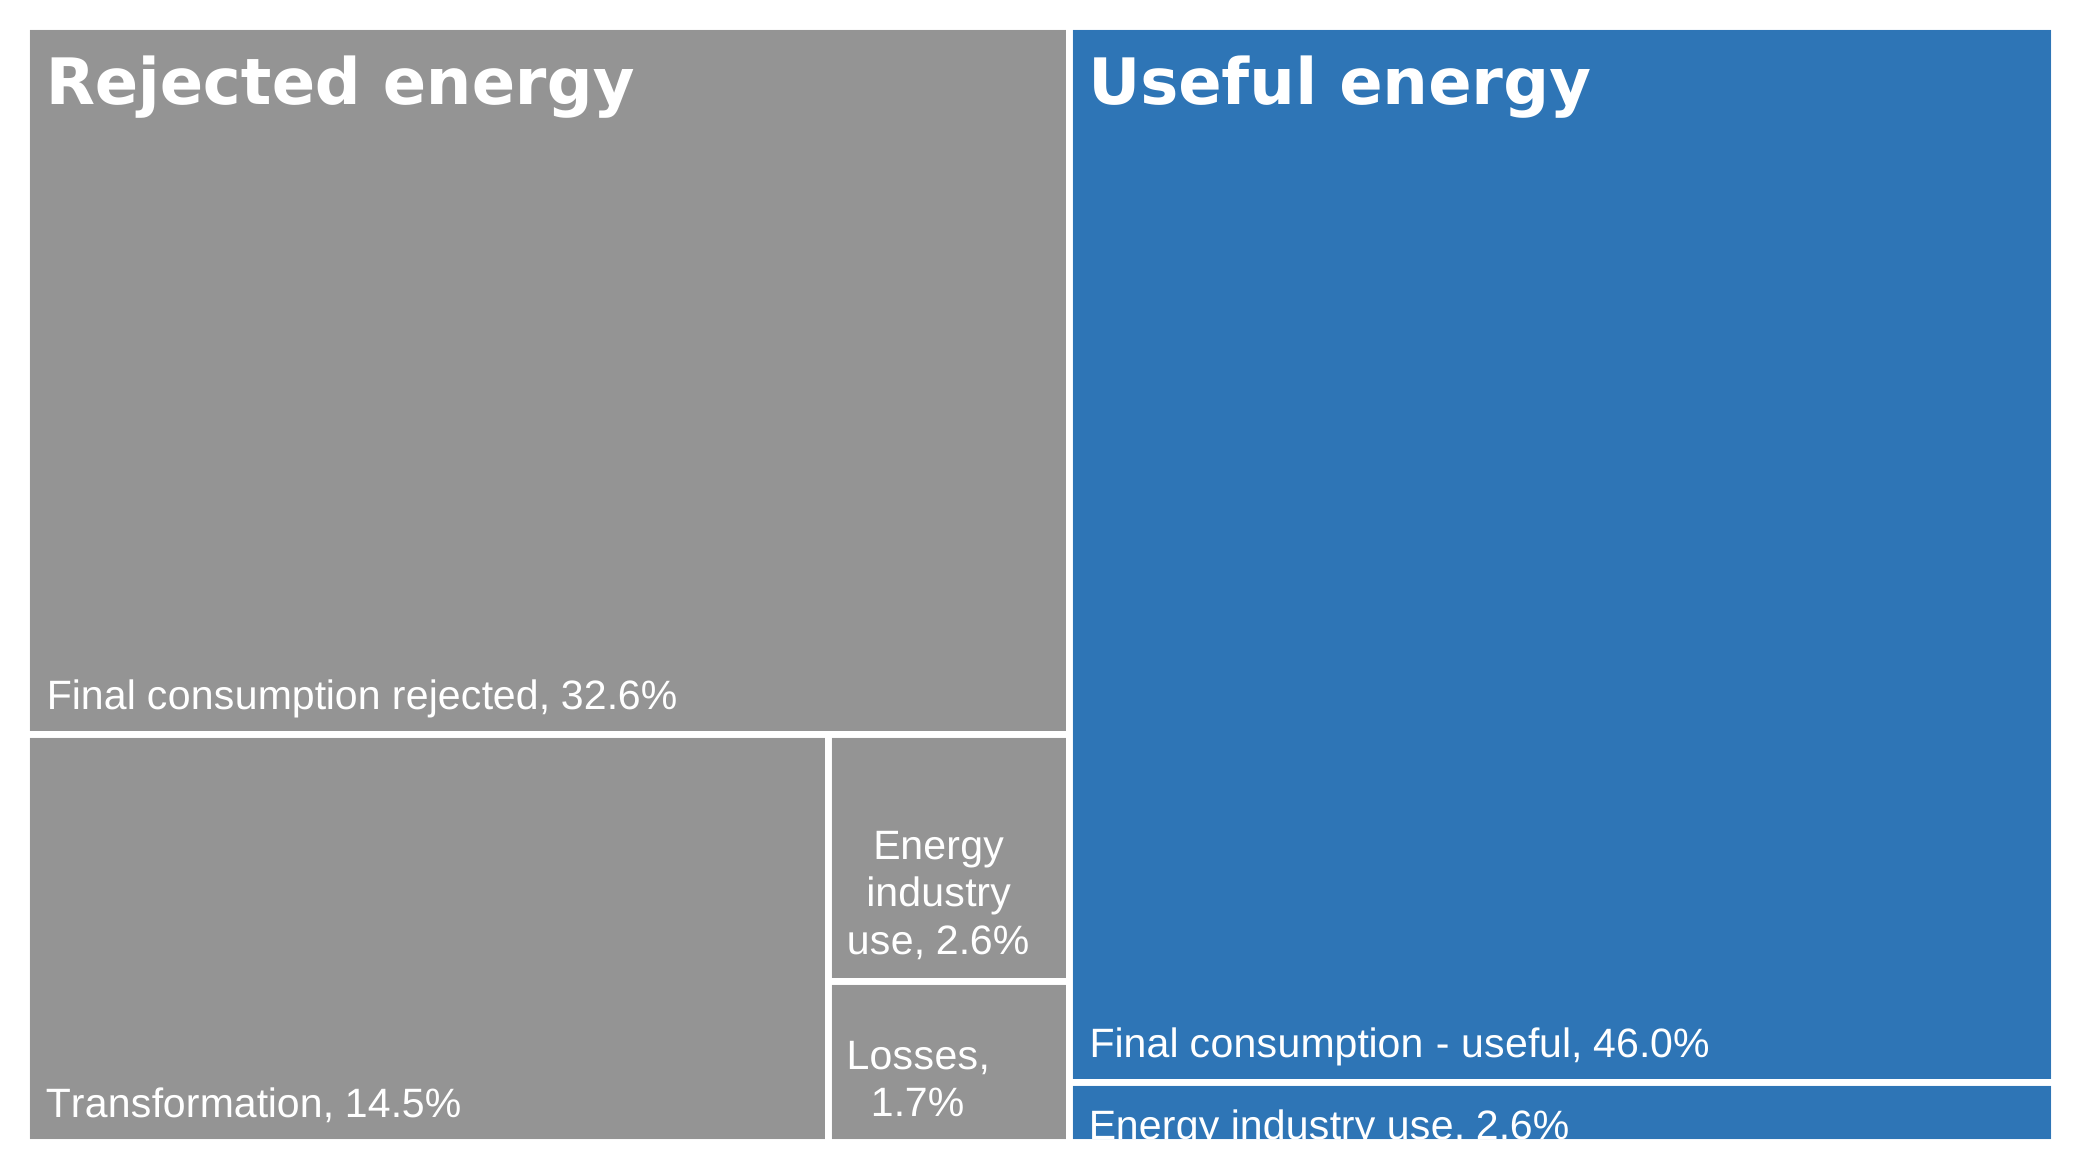
When considering the total useful energy from the whole system, the proportion of primary energy (excluding transfers and non-energy use) used for its intended purpose in 2025 was 48.6 per cent. This is lower than the useful energy proportion of final consumption, as the majority of primary energy used upstream of final consumption is classed as rejected energy (e.g. losses from electricity generation, transmission losses).
Chart 18: Whole energy system useful and rejected energy, 2025 (Table W1)
5. End uses
The end uses tables show how energy is being used, for example for space or water heating. Understanding what energy is used for is useful in assessing consumer behaviours, which in turn contributes to developing policies and establishing future strategies. Estimating end uses is difficult, and some sectors are more challenging than others due to data availability. Most estimates are modelled and use assumptions.
Final consumption data are sourced from Consumption Table C1, and proportions are applied to estimate end uses. For the domestic sector (Table U3), the assumptions are updated each year using data collected for the English Housing Survey. The splits for the services sector are sourced from the Building Energy Efficiency Survey (BEES), which was undertaken in 2015 and are therefore subject to greater uncertainty. For the industry sector, estimates of end uses have been updated for ECUK 2026. For further information on how end use estimates are derived, see the ECUK methodology document.
5.1 Domestic
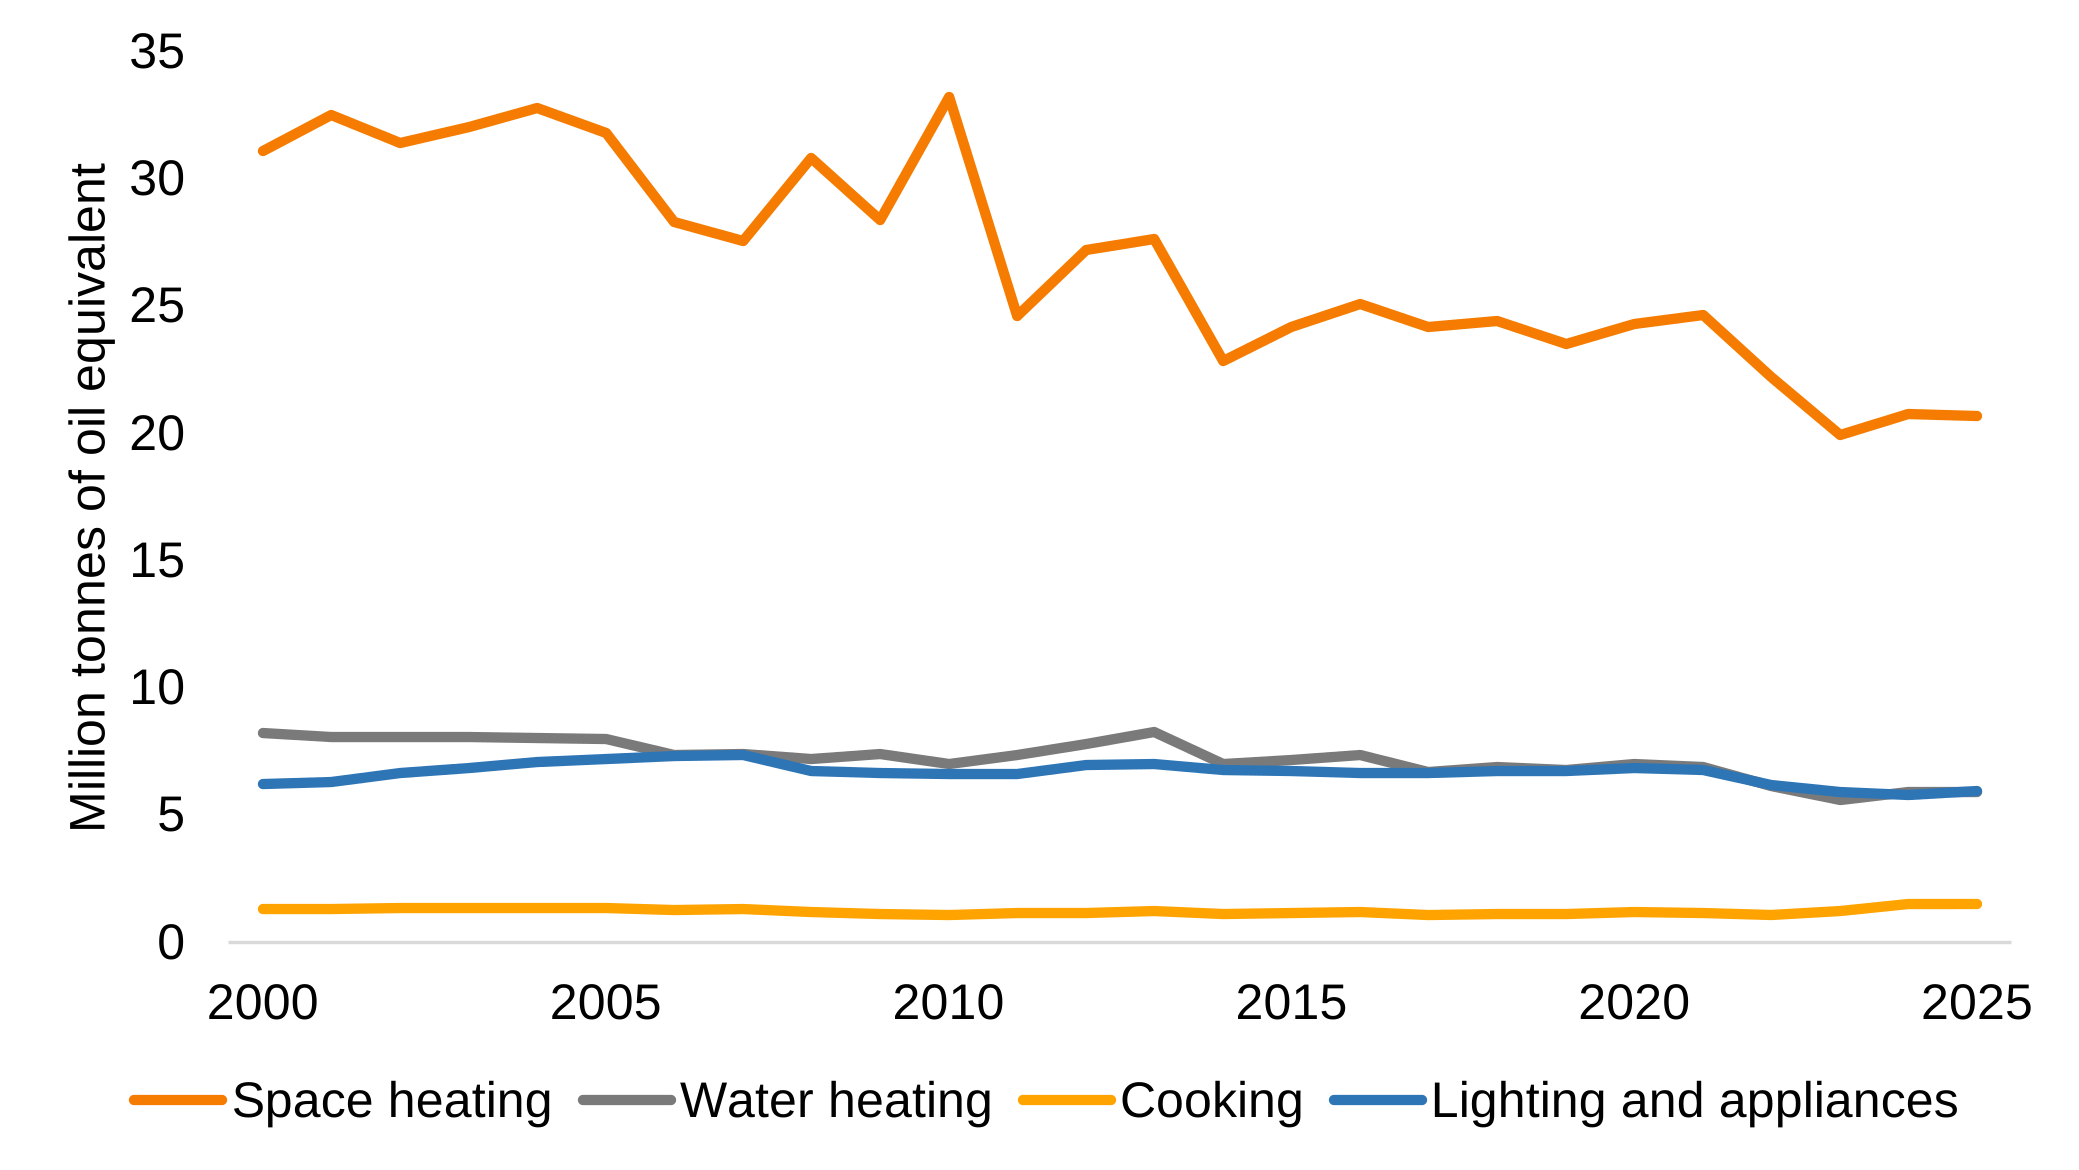
In 2025 60.8 per cent of the energy consumed in the domestic sector was for the purposes of space heating, with a further 17.4 per cent consumed for water heating. These proportions have been relatively consistent since 2000 when 66.4 per cent of domestic energy consumption was for space heating and 17.6 per cent for water heating. However, this is against a background of overall reduction in domestic energy consumption over this time period. Total consumption for space heating and water heating in the domestic sector has reduced by 32 per cent between 2000 and 2025 (from 39.3 mtoe to 26.6 mtoe).
Comparatively, energy consumption for cooking and lighting and appliances has remained relatively consistent since 2000, with cooking increasing by 0.2 mtoe (15 per cent) and lighting and appliances decreasing by 0.3 mtoe (4.5 per cent). These trends are likely being driven by increased energy efficiency, as the population has grown by nearly 20 per cent since 2000.
Chart 19: Domestic energy consumption by end use, 2000 to 2025 (Table U3)
The decrease in energy consumption in the domestic sector since 2000 (12.8 mtoe, 27 per cent) has largely been driven by a 10.3 mtoe (32 per cent) reduction in gas consumption.
Heat pump electricity consumption
The electricity consumed to drive heat pumps is implicitly included within the electricity consumption data in DUKES. However, due to the top-down nature of the data collections from electricity suppliers used to estimate energy in DUKES, electricity consumption data for specific end uses such as heat pumps are unavailable and need to be estimated.
Chapter 6 of DUKES uses an internationally recognised methodology[footnote 5] to estimate the ambient heat consumed by heat pumps. The same methodology can be applied to estimate the electricity consumed by heat pumps. These estimates show electricity consumption for heat pumps in the domestic sector has been rising steadily, and has more than doubled between 2020 and 2025 (Table U8). In 2025 domestic heat pumps consumed 2,280 GWh of electricity, an increase of 325 GWh (17 per cent) compared to 2024. This is approximately 2.4 per cent of the total domestic electricity consumption in 2025.
5.2 Industry
The methodology used to estimate industrial end use consumption has been updated in ECUK 2026 (see Update to estimates of industrial end use consumption within ECUK). These estimates now provide estimates for industrial energy consumption across nine end uses, which align with international energy reporting standards. The industry end use data now includes consumption values for bioenergy & waste and heat, which were unavailable in previous versions of ECUK.
For 2025 it is estimated that 50 per cent of industry energy consumption (7.3 mtoe) was used for industrial heat production. Of this, 2.8 mtoe (39 per cent) was for very-high temperature heat production (>500°C). The other main contributor to industry energy consumption was mechanical energy use (engines), which accounted for 2.8 mtoe (19 per cent of total industrial consumption).
Chart 20: Industry energy consumption by end use, 2025 (Table U4.1)
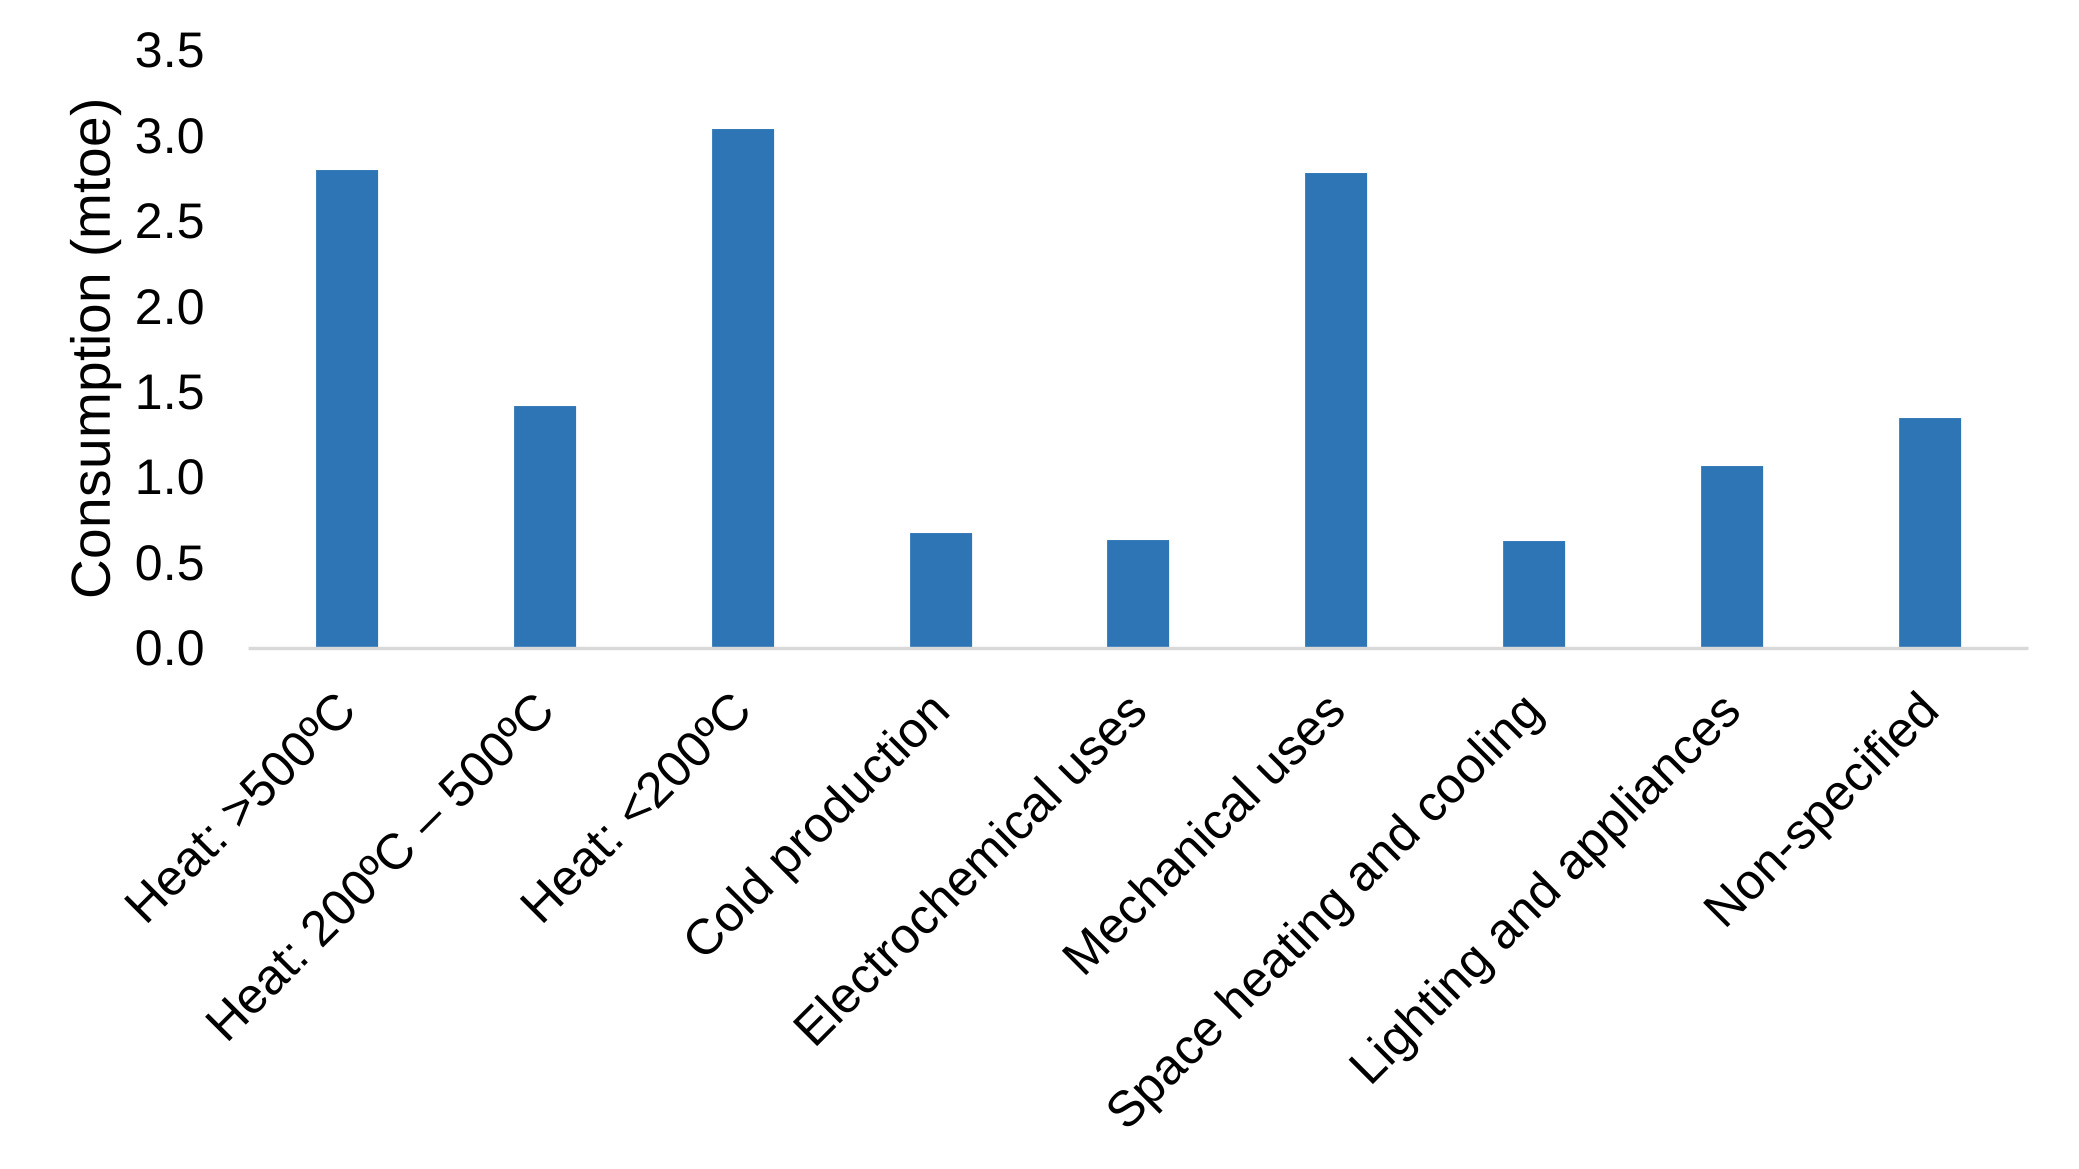
The end uses presented here exclude energy used for construction and unclassified industrial consumption, which totals 2.9 mtoe across oil and bioenergy & waste.
Users should note that the methodology used to estimate industrial end uses within the UK derives from research conducted in Spain. These estimates are considered to be the best current proxy for industrial estimates in the UK, and an improvement on the methodology used in previous versions of ECUK which was last updated in 2014 (previous versions of ECUK will remain available to users). We intend to continue to review the industrial end use estimates presented within ECUK, and therefore would welcome any feedback from users on the data presented here to help inform future developments.
Data centres
The electricity consumed by data centres is implicitly included within DUKES. However, as the DUKES data are top-down estimates, typically derived from data collected from energy providers, specific estimates of consumption by data centres are not available. Separate estimates of data centre electricity consumption have been published by DESNZ using a methodology distinct from DUKES. These showed that data centres in Great Britain were estimated to have consumed 4.5 TWh of electricity in 2024, approximately 2 per cent of total consumption. For further information see Data centre electricity consumption in Great Britain, 2020 to 2024.
6. Additional information
6.1 Future updates to these statistics
The next publication is scheduled for September 2027. We announce publication dates for all our official statistics at least one month in advance.
6.2 Revisions policy
The DESNZ statistical revisions policy sets out the revisions policy for these statistics, which has been developed in accordance with the UK Statistics Authority Code of Practice for Statistics.
6.3 Uses of these statistics
The main use of these statistics is to assist understanding of detailed trends in energy consumption within different sectors in the UK. They are used to help inform policy decisions within DESNZ and feed into other analysis and publications across government, for example the ONS environmental accounts publication.
6.4 User engagement
Users are encouraged to provide comments and feedback on how these statistics are used and how well they meet user needs. Comments on any issues relating to this statistical release are welcomed and should be sent to energyconsumption.stats@energysecurity.gov.uk.
The DESNZ Public involvement and engagement strategy sets out our approach to engaging with users of our official statistics.
6.5 Accredited Official Statistics designation
Accredited Official Statistics status means that our statistics meet the highest standards of trustworthiness, quality and public value, and it is our responsibility to maintain compliance with these standards.
The continued designation of these statistics as Accredited Official Statistics was confirmed in September 2018 following a compliance check by the Office for Statistics Regulation. The statistics last underwent a full assessment in June 2014.
Since the latest review by the Office for Statistics Regulation, we have continued to comply with the Code of Practice for Statistics and have made the following improvements:
- Continual updates to our data processing, reducing manual calculations and incorporating automated data pipelines where possible.
- Updated the industrial sector detailed consumption and end use estimates using new methodologies derived from more up-to-date research and data sources.
- Revised the methodology for transport intensity calculations to provide separate metrics for passenger and freight transport where possible, and improve the alignment between consumption data and the output measures used.
6.6 Pre-release access to statistics
Some ministers and officials receive access to these statistics up to 24 hours before release. Details of the arrangements for doing this and a list of the ministers and officials that receive pre-release access to these statistics can be found in the DESNZ Statistics release policy, which sets out how we comply with the Pre-Release Access to Official Statistics Order 2008.
6.7 Contact
Responsible statisticians: Ashley Goddard
Email: energyconsumption.stats@energysecurity.gov.uk
Media enquiries: 020 7215 1000
6.8 Technical information
The publication is supported by a methodology document that is updated annually to reflect any changes in how the statistics are calculated. The majority of terms used in this publication are covered in the DUKES glossary.
6.9 Related statistics
This publication draws mainly from the annual Digest of UK Energy Statistics (DUKES), which provides information on energy production, trade, and consumption in the UK. ECUK supplements DUKES by providing more detailed estimates of consumption and end uses of energy at a sectoral level.
-
Department for Transport – Road traffic estimates, Department for Transport / Civil Aviation Authority – Aviation statistics ↩
-
Department for Transport – Vehicle licensing statistics ↩
-
International Energy Agency – Energy End-use and Efficiency Indicators ↩
-
Department for Transport – Transport Statistics Great Britain ↩
-
UN Energy Statistics Compilers Manual, DESNZ Renewables methodology note ↩