DESNZ Public Attitudes Tracker: Energy bills and tariffs, Summer 2026, UK
Published 27 October 2026

© Crown copyright 2026
This publication is licensed under the terms of the Open Government Licence v3.0 except where otherwise stated. To view this licence, visit nationalarchives.gov.uk/doc/open-government-licence/version/3 or write to the Information Policy Team, The National Archives, Kew, London TW9 4DU, or email: psi@nationalarchives.gov.uk.
Where we have identified any third party copyright information you will need to obtain permission from the copyright holders concerned.
This publication is available at https://www.gov.uk/government/statistics/desnz-public-attitudes-tracker-summer-2026/desnz-public-attitudes-tracker-energy-bills-and-tariffs-summer-2026-uk
The DESNZ Public Attitudes Tracker is a nationally representative annual survey of adults (aged 16 and over) in the UK that tracks public awareness, attitudes, and behaviours relating to the policies of the Department for Energy Security and Net Zero (DESNZ), such as energy and climate change.
This report provides a summary of the headline findings relating to energy bills and tariffs from the Summer 2026 wave of the Tracker, which ran from 7 July to 12 August 2026.
Notes for interpretation of findings
Differences between groups are only reported where they are statistically significant at the 95% confidence level.
The annual personal income referred to in the report is a self-reported measure.
Line charts included in this report, based on a longer time series, use abbreviated season names in the x-axis (for example, Summer 2026 = Sum 2026).
The age-related findings are reported using six age groups (16-24, 25-34, 35-44, 45-54, 55-64, 65 and over). In some cases, findings across age groups have been combined to describe a general trend; for example, ‘between 78% and 88% of people aged 45 and above’ refers to the range of percentages for the three age groups 45-54, 55-64, and 65 and over.
Some of the geographical findings have fluctuated over time. These variations may, in part, be due to the base sizes in specific areas and the wide geographic area covered by regions. This also applies to other subgroup findings that have low base sizes.
Two summary self-reported measures are used in this report:
- ‘Awareness’ encompasses all respondents who said they had heard of a particular concept or technology, including those who said they knew ‘hardly anything but I’ve heard of this’, ‘a little’, ‘a fair amount’, or ‘a lot’.
- ‘Knowledge’ encompasses those who said that they knew ‘a fair amount’ or ‘a lot’ about a topic.
The findings within this report cover the period between Spring 2022 and Summer 2026. The findings should be viewed in light of the changing energy prices over this period.[footnote 1] There was a decrease of 7% in the energy price cap in April 2026, during the Spring fieldwork period. This was, however, more than reversed by a 13% increase in July 2026, with a further increase of 4% planned for October 2026. An additional 9% increase is projected for January 2027. Fieldwork took place during the ongoing conflict in the Middle East which may also have influenced responses, through concerns about energy prices.
Energy saving and wasting behaviours
Figure 5.1 displays both the longer-term trends in the amount of thought given to saving energy in the home (line chart) and the detailed data on this for the two most recent waves alongside the baseline (bar chart).
Between Spring and Summer 2026, overall attention paid to energy saving remained stable: 82% said they paid a lot or a fair amount of attention, and 18% said they paid not very much or no attention. The proportion who reported giving it a lot of thought dropped to 25%, from 29% in Spring 2026.
Fluctuations wave on wave are likely, in part, to reflect the volatility of energy prices, but also seasonal differences in household energy use between Spring and Summer waves. This is clearest in the proportion who reported giving a lot of thought to their energy use. This has consistently been lower in Summer waves than in the preceding Spring waves.
Over the longer term, there has been no sustained change since the Spring 2022 baseline in the proportion who gave saving energy a lot or a fair amount of thought, but there appears to be a decreasing trend in the proportion who reported giving it a lot of thought.
Figure 5.1: Amount of thought given to saving energy in the home (% based on all people), Spring 2022, Spring and Summer 2023 to 2026[footnote 2]
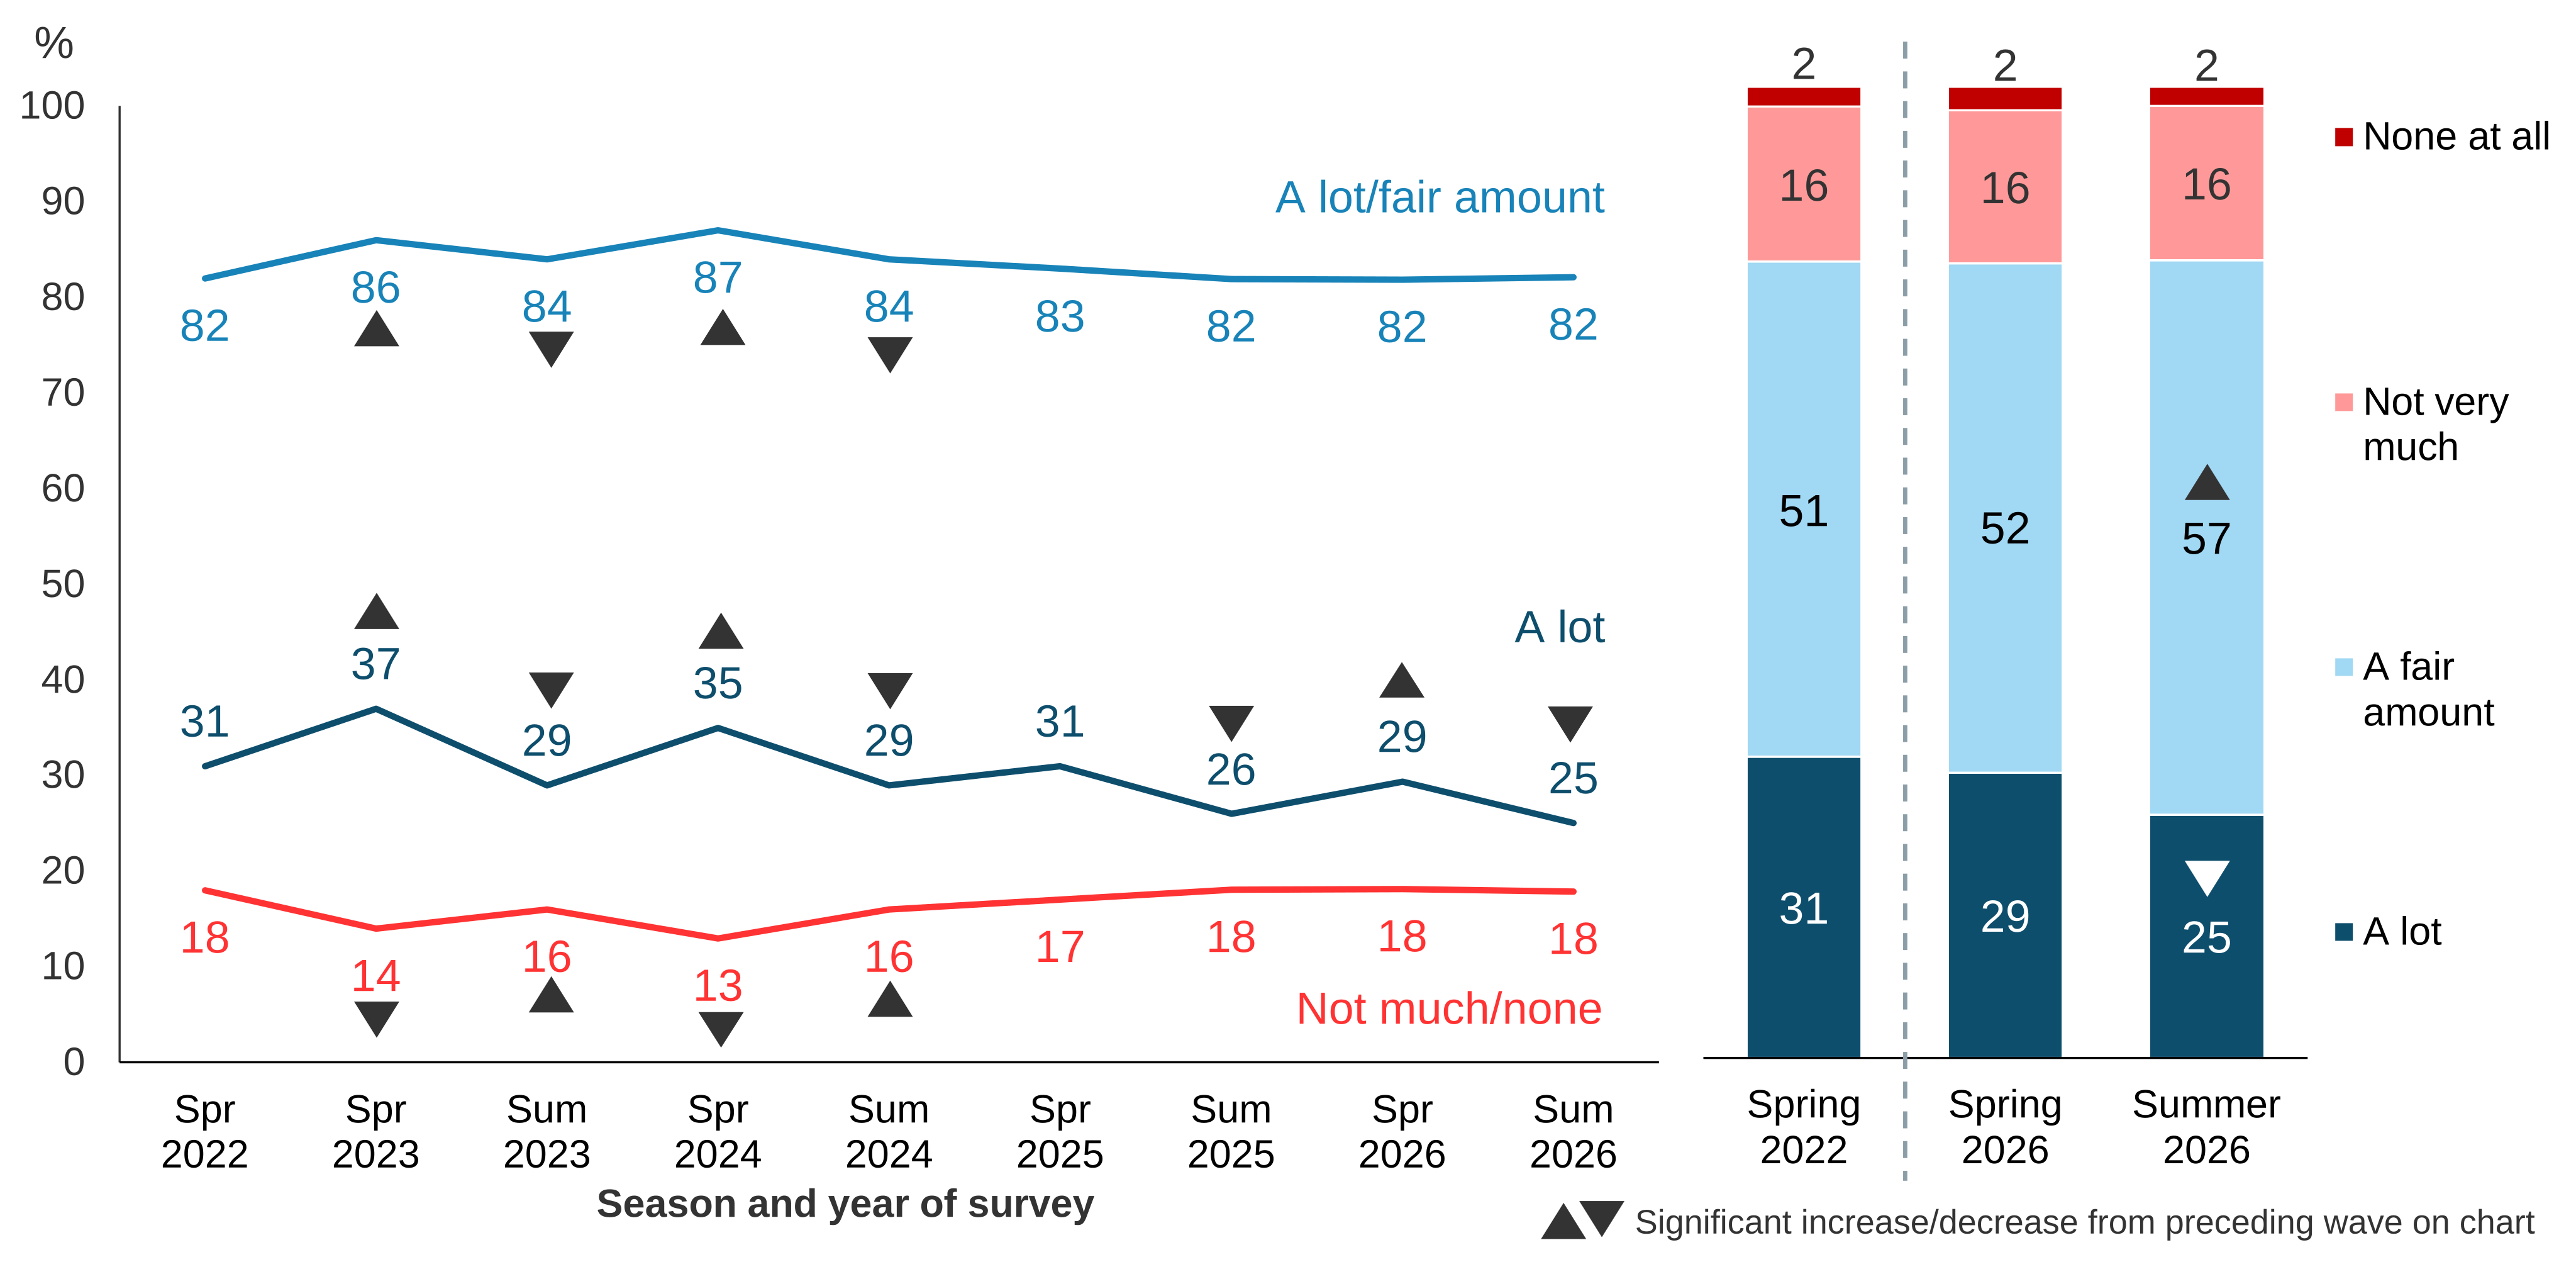
ENERGSAVE. How much thought, if any, would you say you give to saving energy in your home?
Base: All wave respondents – Spring 2022 (4,367), Spring 2023 (4,399), Summer 2023 (3,993), Spring 2024 (4,082), Summer 2024 (3,641), Spring 2025 (3,406), Summer 2025* (3,481), Spring 2026 (3,386), Summer 2026* (3,196). *’Don’t know’ option included in Summer 2025 and 2026; chart data excludes respondents giving a ‘Don’t know’ response.
Note: On the line chart arrows denote a significant difference between one wave and the next. For the bar chart, significant differences are noted between Spring 2022 and Spring 2026, and between Spring 2026 and Summer 2026.
Analysis by subgroups
The proportion paying a lot or a fair amount of attention to energy saving in the home was higher among the following subgroups:
- Older people: between 84% and 86% in age groups 45 and over, compared with between 76% and 81% of those in age groups under 35.
- People with a lower income: 87% of those in annual personal income groups of under £15,000 compared with 76% of those with an income of £45,000 or more.
Knowledge about reducing energy use
In Summer 2026, almost all people (97%) said they had some awareness of the most effective ways to reduce energy use in the home, similar to previous Summer waves (Figure 5.2). The proportion saying they knew a lot or a fair amount was stable at 59% in Summer 2026, remaining above the level recorded in Summer 2024 (54%). There was a similar pattern of change over time in the proportion saying they knew a lot (which remained stable this wave at 14%).
Figure 5.2: Knowledge about most effective ways to reduce energy use in the home (based on all people), Summer 2023 to 2026
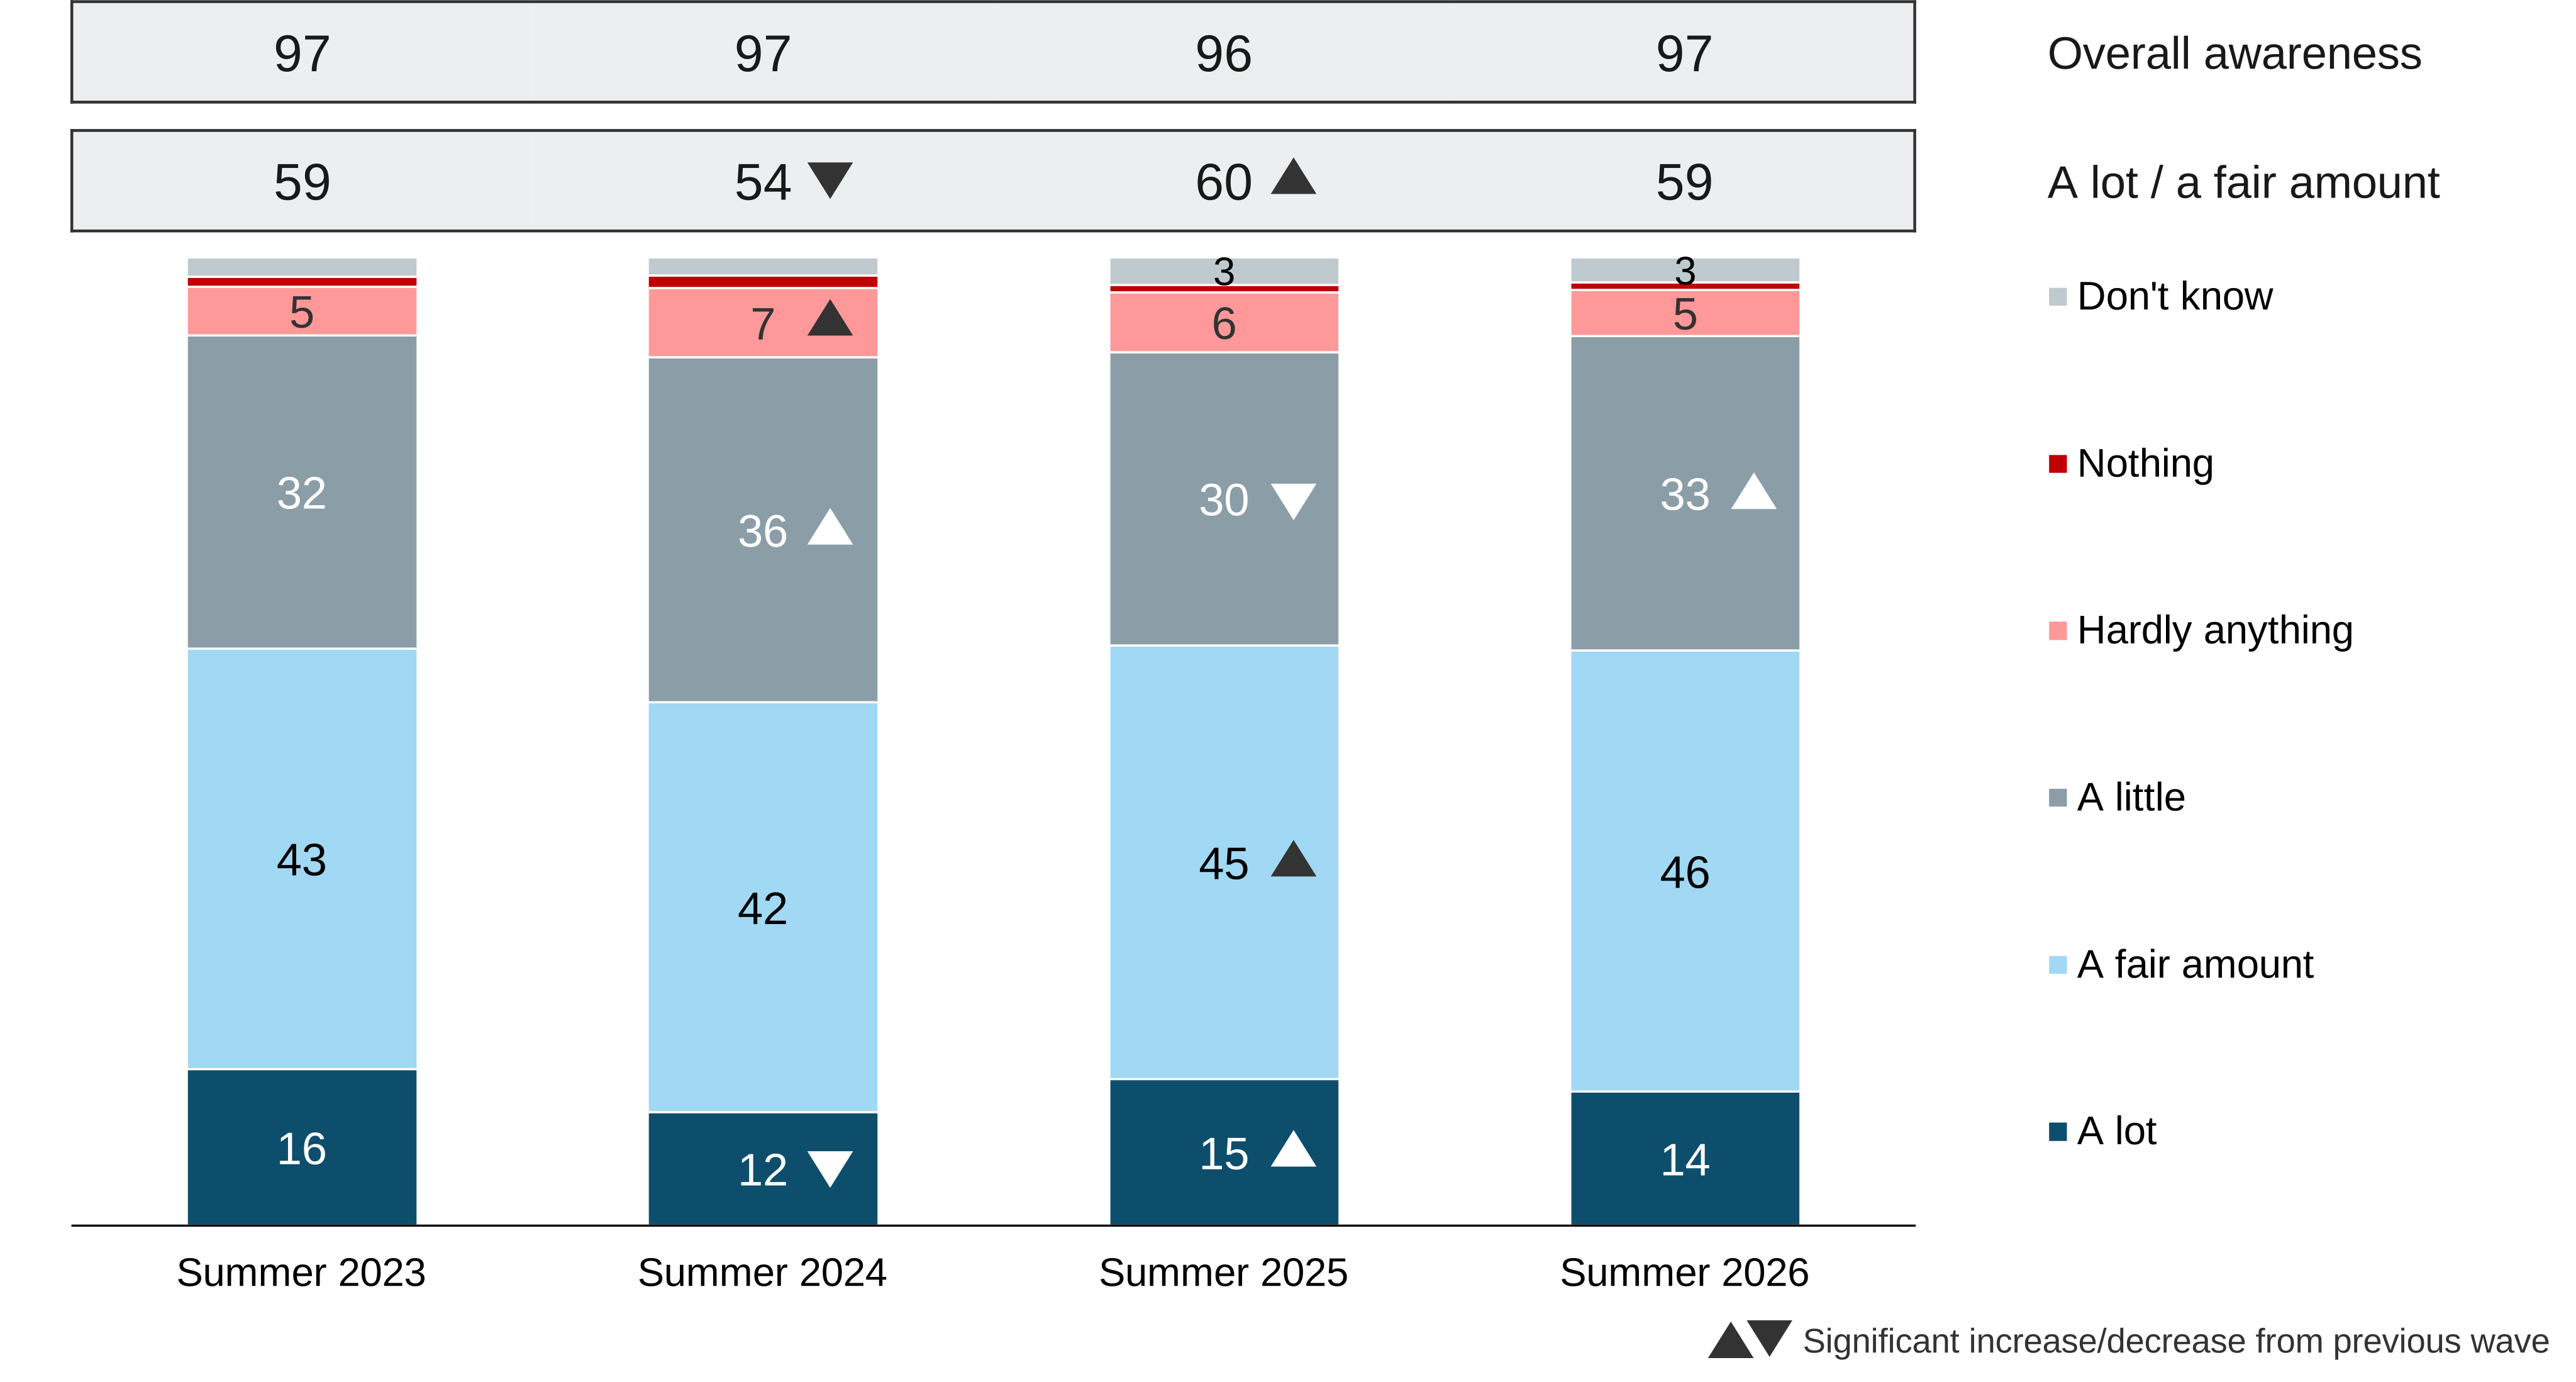
ENEFFKNOW. How much would you say you know about the most effective ways to reduce energy use in your home?
Base: All wave respondents – Summer 2023 (3,990), Summer 2024 (3,635), Summer 2025 (3,528), Summer 2026 (3,237).
Analysis by subgroups
Overall self-reported awareness of the most effective ways to reduce energy use in the home was very high across the board. Knowledge (knowing a lot or a fair amount) about the most effective ways to reduce energy use was higher among the following subgroups:
- People in age groups 45 and over: between 61% and 67% compared with 51% of those aged under 25.
- People in owner-occupied households: 64% compared with 53% of those in rented households.
- People in annual personal income bands of £30,000 or above: between 65% and 67% compared with between 54% and 58% of those in income bands below £30,000.
A further question[footnote 3] asked respondents whether or not they were interested in finding out more about the most effective ways to reduce energy use in their home. In Summer 2026, 51% said they would like to know more, with no change since Summer 2023. Interest was higher among the following subgroups:
- People in age bands 25 to 64: between 51% and 58% compared with 43% of those aged 65 and over.
- People with a degree: 61% compared with 48% of those with another kind of qualification and 41% of those with no qualifications.
- Private renters: 61% compared with 47% of social renters.
Cost of energy bills
Payment method
To provide further context for concerns about paying bills, people were asked in each summer survey wave about how they paid their energy bills[footnote 4].
In Summer 2026, around eight in ten people paid by direct debit or standing order (80%, remaining above 76% in Summer 2023). Around one in ten said they paid on receipt of bills (9%), with a further 9% paying via a prepayment meter, remaining down from 11% in Summer 2023 (Figure 5.3).
Figure 5.3: How household usually pays energy bills (based on all households), Baseline wave (Summer 2023) and two most recent waves (Summer 2025 to 2026)
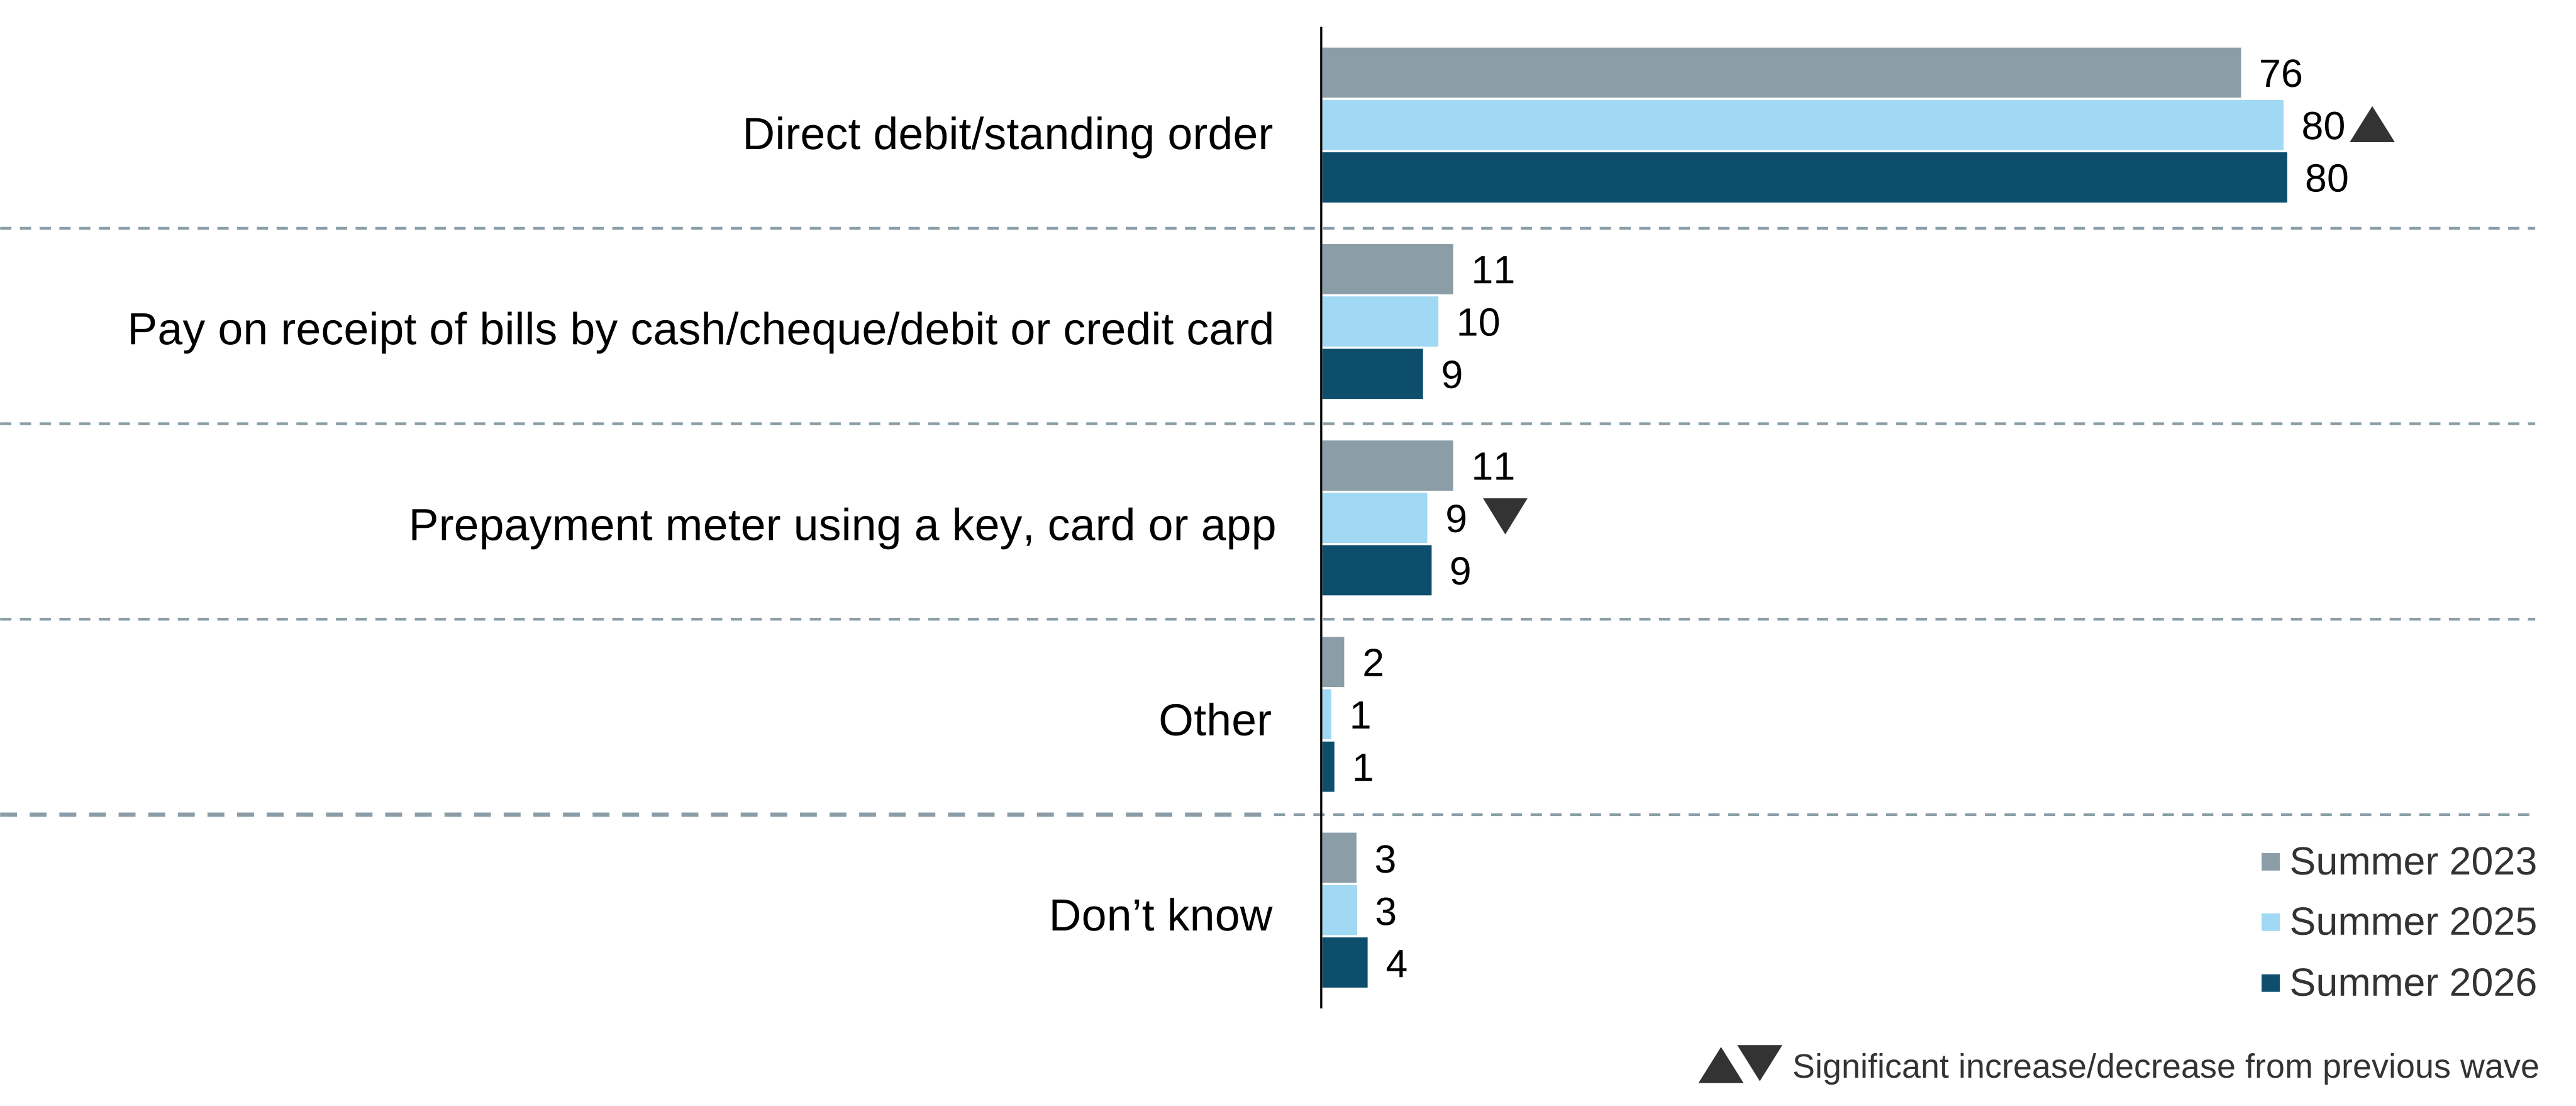
BILLPAY. How does your household usually pay for the energy supplied to your home? If you pay using different methods for electricity and gas, please select both.
Base: All wave respondents – Summer 2023 (3,996), Summer 2025 (3,525), Summer 2026 (3,236).
Note: At this question, results are weighted to households (not individuals).
Analysis by subgroups
By age:
- People aged 16-24 were less likely to report paying by direct debit or standing order: 54%, rising to 86% of those in age groups 55 and over.
- People aged 65 and over were less likely to report having a prepayment meter: 3% compared with between 9% and 15% of those in age groups under 55.
By housing tenure:
- People in owner-occupied households were more likely to report paying by direct debit or standing order: 89% compared with 64% in rented households.
- People in rented households were more likely than those in owner-occupied households to report payment on receipt of bills (12% vs 7%) or via a prepayment meter (23% vs 3%). Social renters were more likely to report a prepayment meter (26%) compared with private renters (16%).
By income:
- People with an annual personal income of £45,000 or more were more likely to report paying by direct debit or standing order: 93% compared with 68% of those with an income below £15,000.
- People with a personal income below £15,000 were more likely to report payment on receipt of bills: 12% compared with between 6% and 7% of those in personal income bands of £15,000 upwards.
- There was a greater difference for prepayment meters: 13% of those with a personal income below £15,000 compared with 2% of those with an income of £45,000 or more. This was reflected in similar differences according to self-reported financial hardship.
Concern about paying energy bills
As with energy saving behaviours, attitudes towards the cost of paying energy bills over time should be viewed in the context of volatile energy prices over the period of tracking, and seasonal differences in energy needs.
In Summer 2026, worry about the cost of energy bills (being very or fairly worried) fell back down to 47% from 55% in Spring 2026. There was a similar decrease in the proportion saying they were very worried (17%, back down from 20%).
Over the longer term, overall worry about the cost of energy bills declined from 64% in Spring 2022 (when energy prices increased following the invasion of Ukraine in 2022[footnote 5]) to 47% in Summer 2026. The proportion who reported being very worried fell from 29% to 17% over the period of tracking. There has been seasonal fluctuation over more recent waves, with lower levels of worry in Summer waves, when household energy needs are lowest (Figure 5.4).
Figure 5.4: Level of worry about paying for energy bills (% based on all people), Spring 2022, Spring and Summer 2023 to 2026
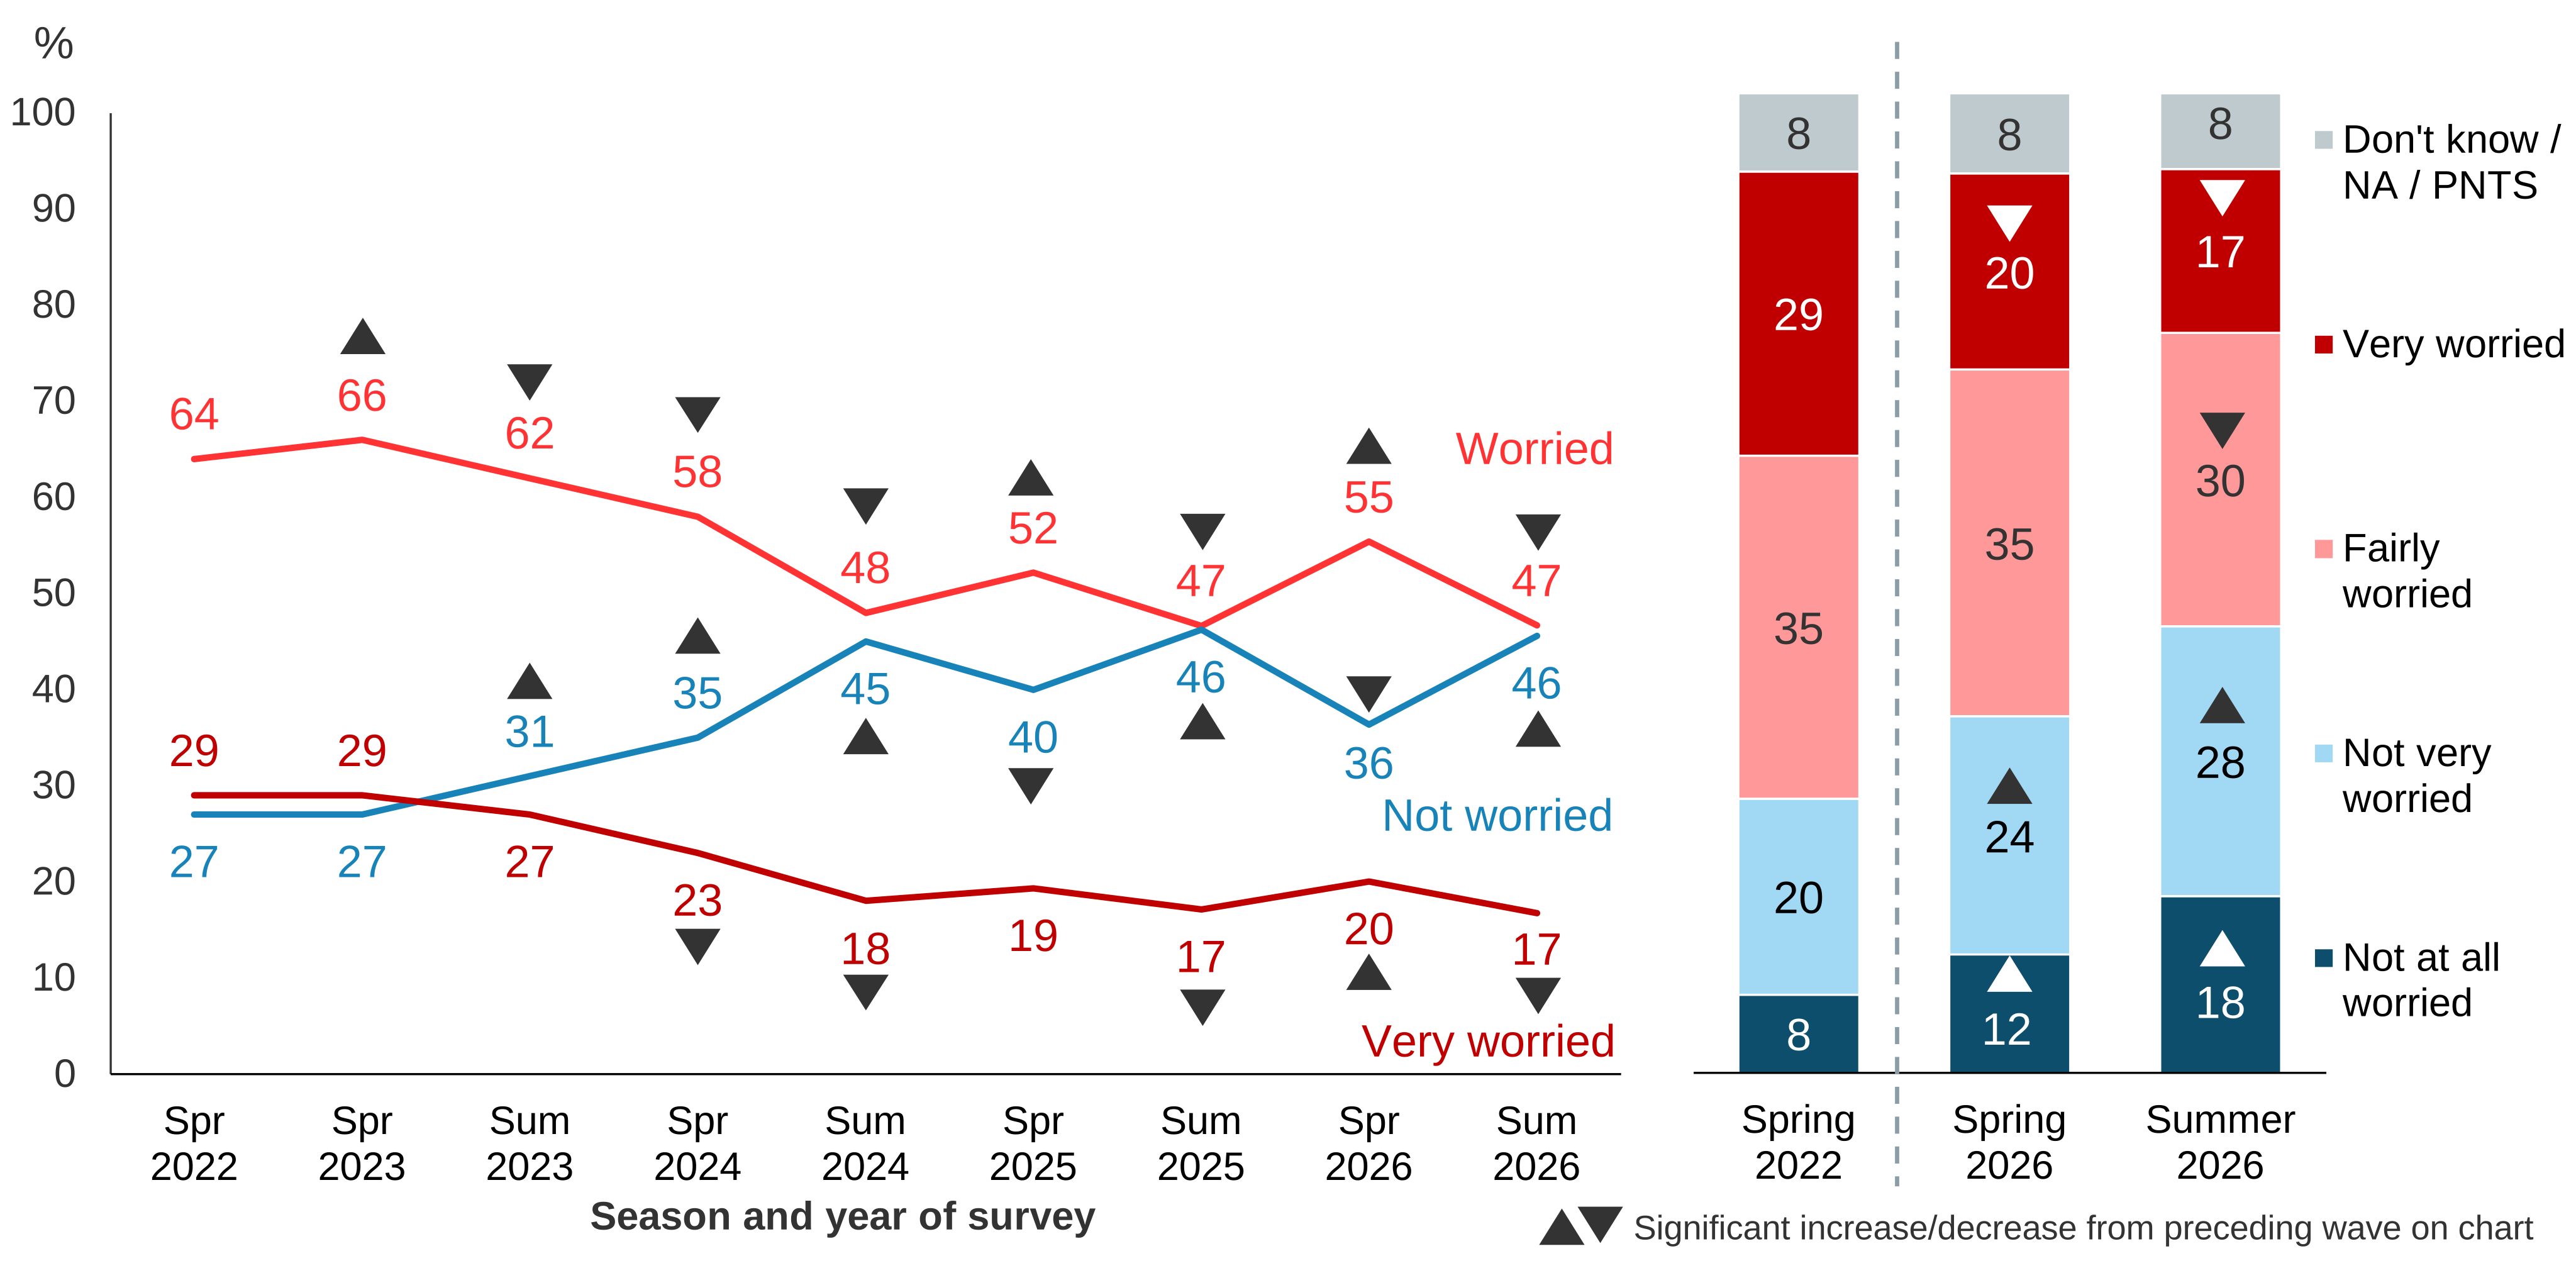
PAYBILLEN. Over the last three months, how worried, if at all, have you been about paying for energy bills (gas/electricity)?
Base: All wave respondents – Spring 2022 (4,369), Spring 2023 (4,408), Summer 2023 (4,003), Spring 2024 (4,081), Summer 2024 (3,640), Spring 2025 (3,412), Summer 2025 (3,522), Spring 2026 (3,388), Summer 2026 (3,235).
Note: On the line chart, arrows denote a significant difference between one wave and the next. For the bar chart, significant differences are noted between Spring 2022 and Spring 2026, and between Spring 2026 and Summer 2026. On the stacked bar chart, the abbreviation PNTS refers to respondents who selected prefer not to say.
Analysis by subgroups
The proportion who felt very worried about paying energy bills was higher among the following subgroups:
- People aged 35 to 44: 24% compared with between 12% and 16% of those in age bands under 35 and between 12% and 17% of those in age bands 55 and over.
- People living in rented accommodation: 26% compared with 13% of those in owner-occupied housing.
- People finding it difficult to get by financially: 53%, compared with 6% of those living comfortably.
Smart appliances
An annual series of updated questions about smart appliances was added in Summer 2024[footnote 6].
Respondents were provided with the following explanation about energy smart appliances before being asked about their awareness of these appliances and their likelihood of purchasing them:
‘Smart appliances are normal household appliances that have built in features enabling them to connect to the internet. This allows them to be controlled and monitored remotely using a smart phone or tablet. Smart appliances can be scheduled to come on at certain times. They can also be linked to smart meters to come on during periods of low electricity prices. This can help to lower customer bills and also manage demand on the electricity grid. Examples of smart appliances include: smart kitchen appliances, smart thermostats to control heating, and other appliances such as smart electric vehicle chargers.’
Awareness of smart appliances
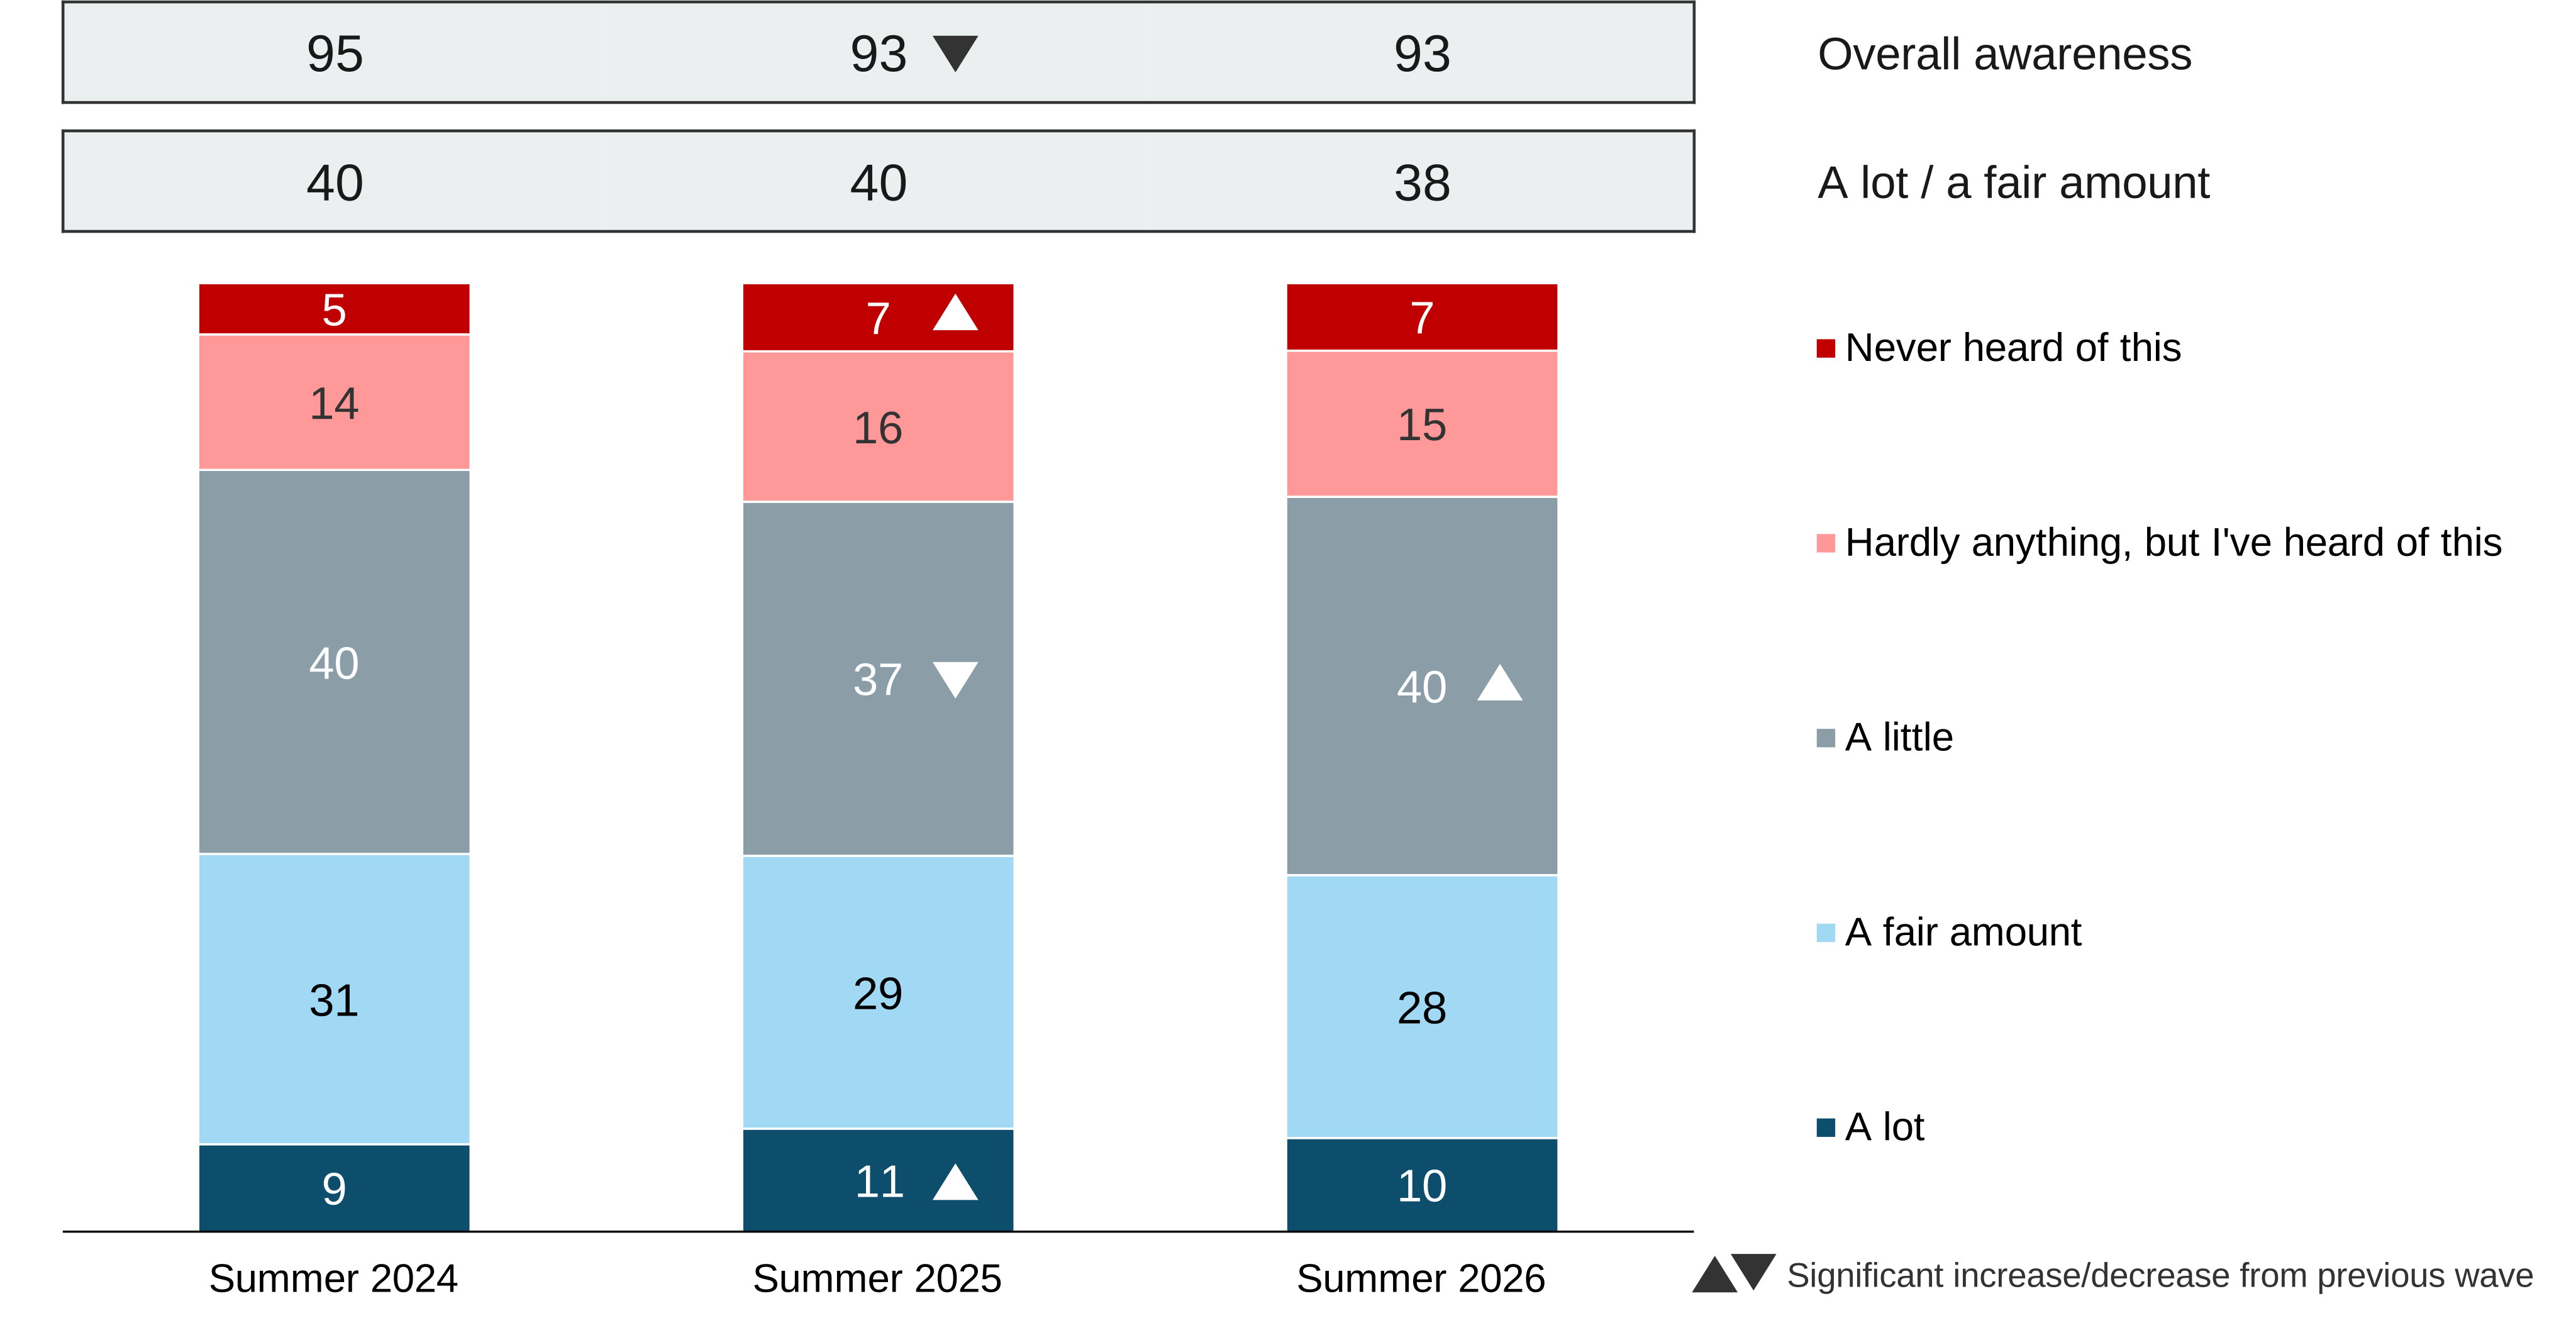
In Summer 2026, 93% of people said that they were aware of smart appliances, stable compared with Summer 2025 and remaining below Summer 2024 levels (95%). Self-reported knowledge (knowing a lot or a fair amount) did not change significantly, at 38%. Just 10% said they knew a lot, in line with earlier waves (Figure 5.5).
Figure 5.5: Awareness of smart appliances (based on all people), Summer 2024 to 2026
SMAPPKNOW. Before today, how much, if anything, did you know about smart appliances?
Base: All wave respondents – Summer 2024 (3,641), Summer 2025 (3,530), Summer 2026 (3,238).
Analysis by subgroups
Self-reported knowledge of smart appliances (the percentage who said they knew a lot or a fair amount) was lower among the following subgroups:
- People aged 65 and over: 22% compared with between 40% and 48% of those in age groups under 55.
- People with no qualifications: 21% compared with 46% of those with a degree.
- People living in social rented accommodation: 32% compared with 38% for those living in owner-occupied households and 46% for those in privately rented accommodation.
Likelihood to replace an appliance with a smart appliance
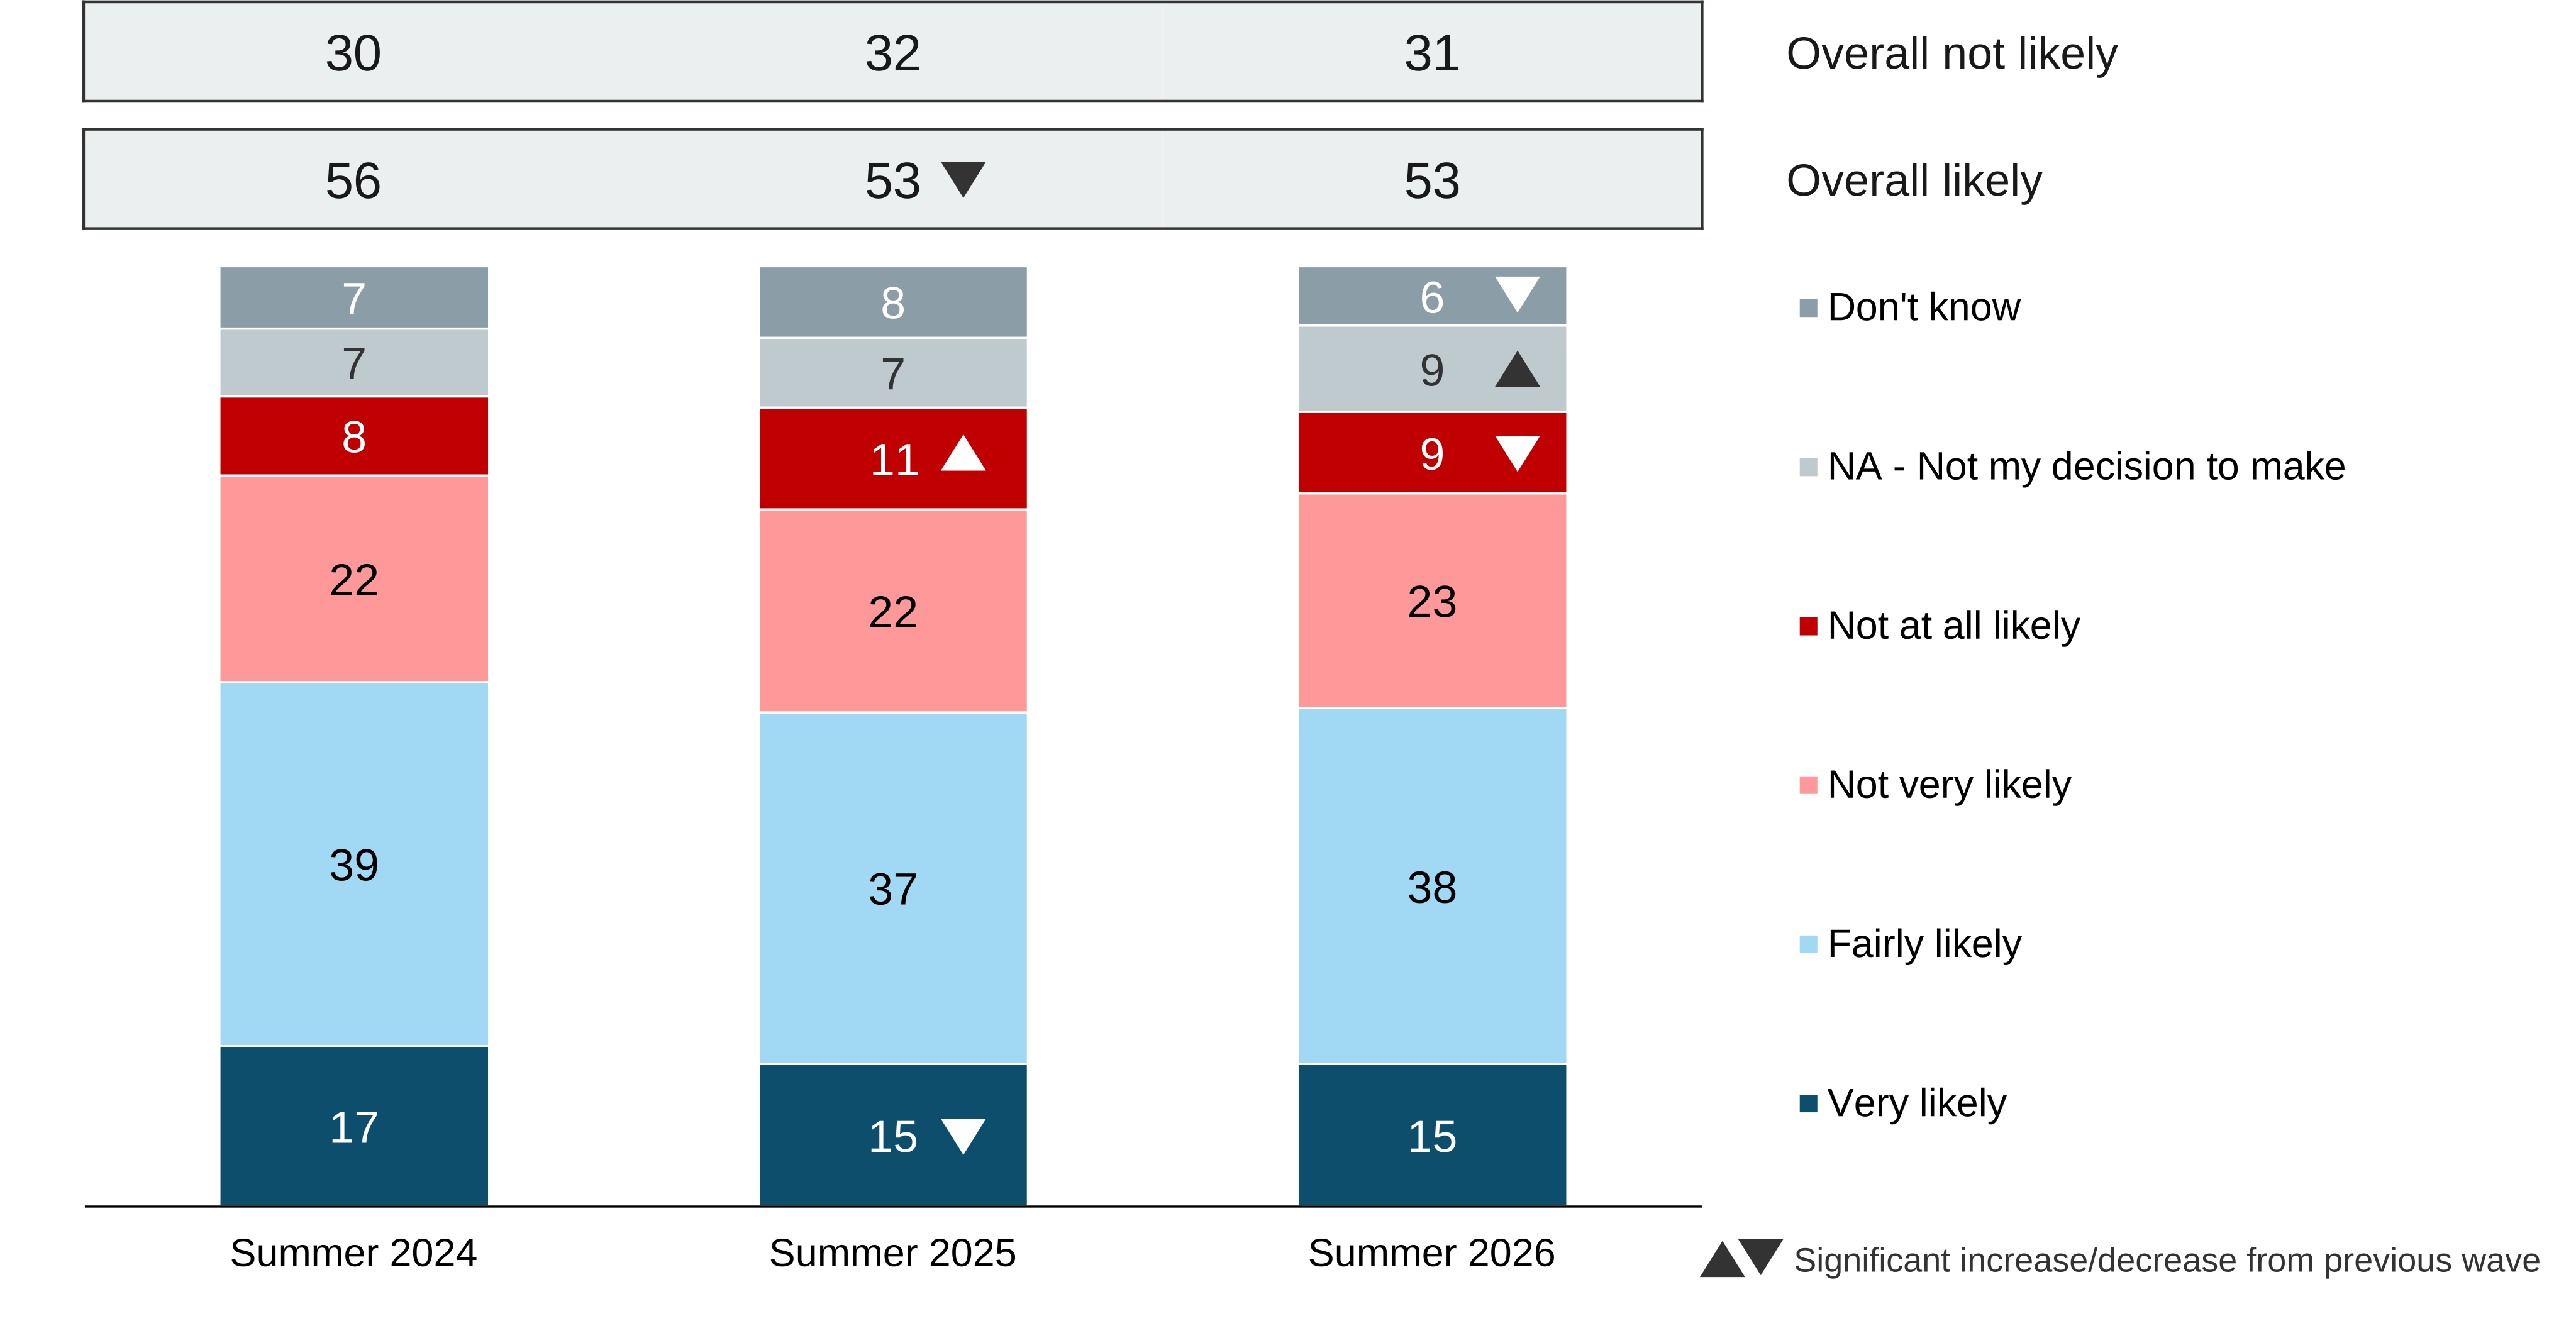
In Summer 2026, 53% of people said that they would be likely to buy a smart appliance next time they needed to buy or replace a large household appliance such as a washing machine or dishwasher. This was stable compared with Summer 2025 and remained lower than the 56% recorded in Summer 2024 (Figure 5.6). Just 15% said this was very likely. Around three in ten (31%) said they would be not very likely or not at all likely to do so.
Figure 5.6: Likelihood of purchasing smart appliance when next need to make a purchase (based on all people), Summer 2024 to 2026
SMAPPLIKWHIT. Thinking about when you next need to buy or replace a large household appliance (for example a washing machine, dishwasher), how likely would you be to purchase a smart appliance?
Base: All wave respondents – Summer 2024 (3,639), Summer 2025 (3,528), Summer 2026 (3,238).
Analysis by subgroups
Overall likelihood to buy a smart appliance was higher for:
- People aged 25 to 44 (between 62% and 65%) compared with people aged 16 to 24 (40%) and 65 and over (45%).
- People in annual personal income bands of £30,000 or above: 61% compared with between 49% and 51% of those in income bands below £30,000.
- People with a smart meter were also more likely to buy a smart appliance next time (56%), compared to those without a smart meter (48%).[footnote 7]
Conversely, a higher proportion of people in owner-occupied households said they were unlikely to buy a smart appliance next time: 35% compared with 24% of those in rented households. Those who were household decision makers, either alone or jointly, were also more likely to say this was unlikely (35%) compared with those not involved in decisions (21%).
Energy supplier control of smart appliances and use of data
A further new question was included annually from Summer 2024 to assess the level of comfort with energy supplier involvement in the use of smart appliances in the home.
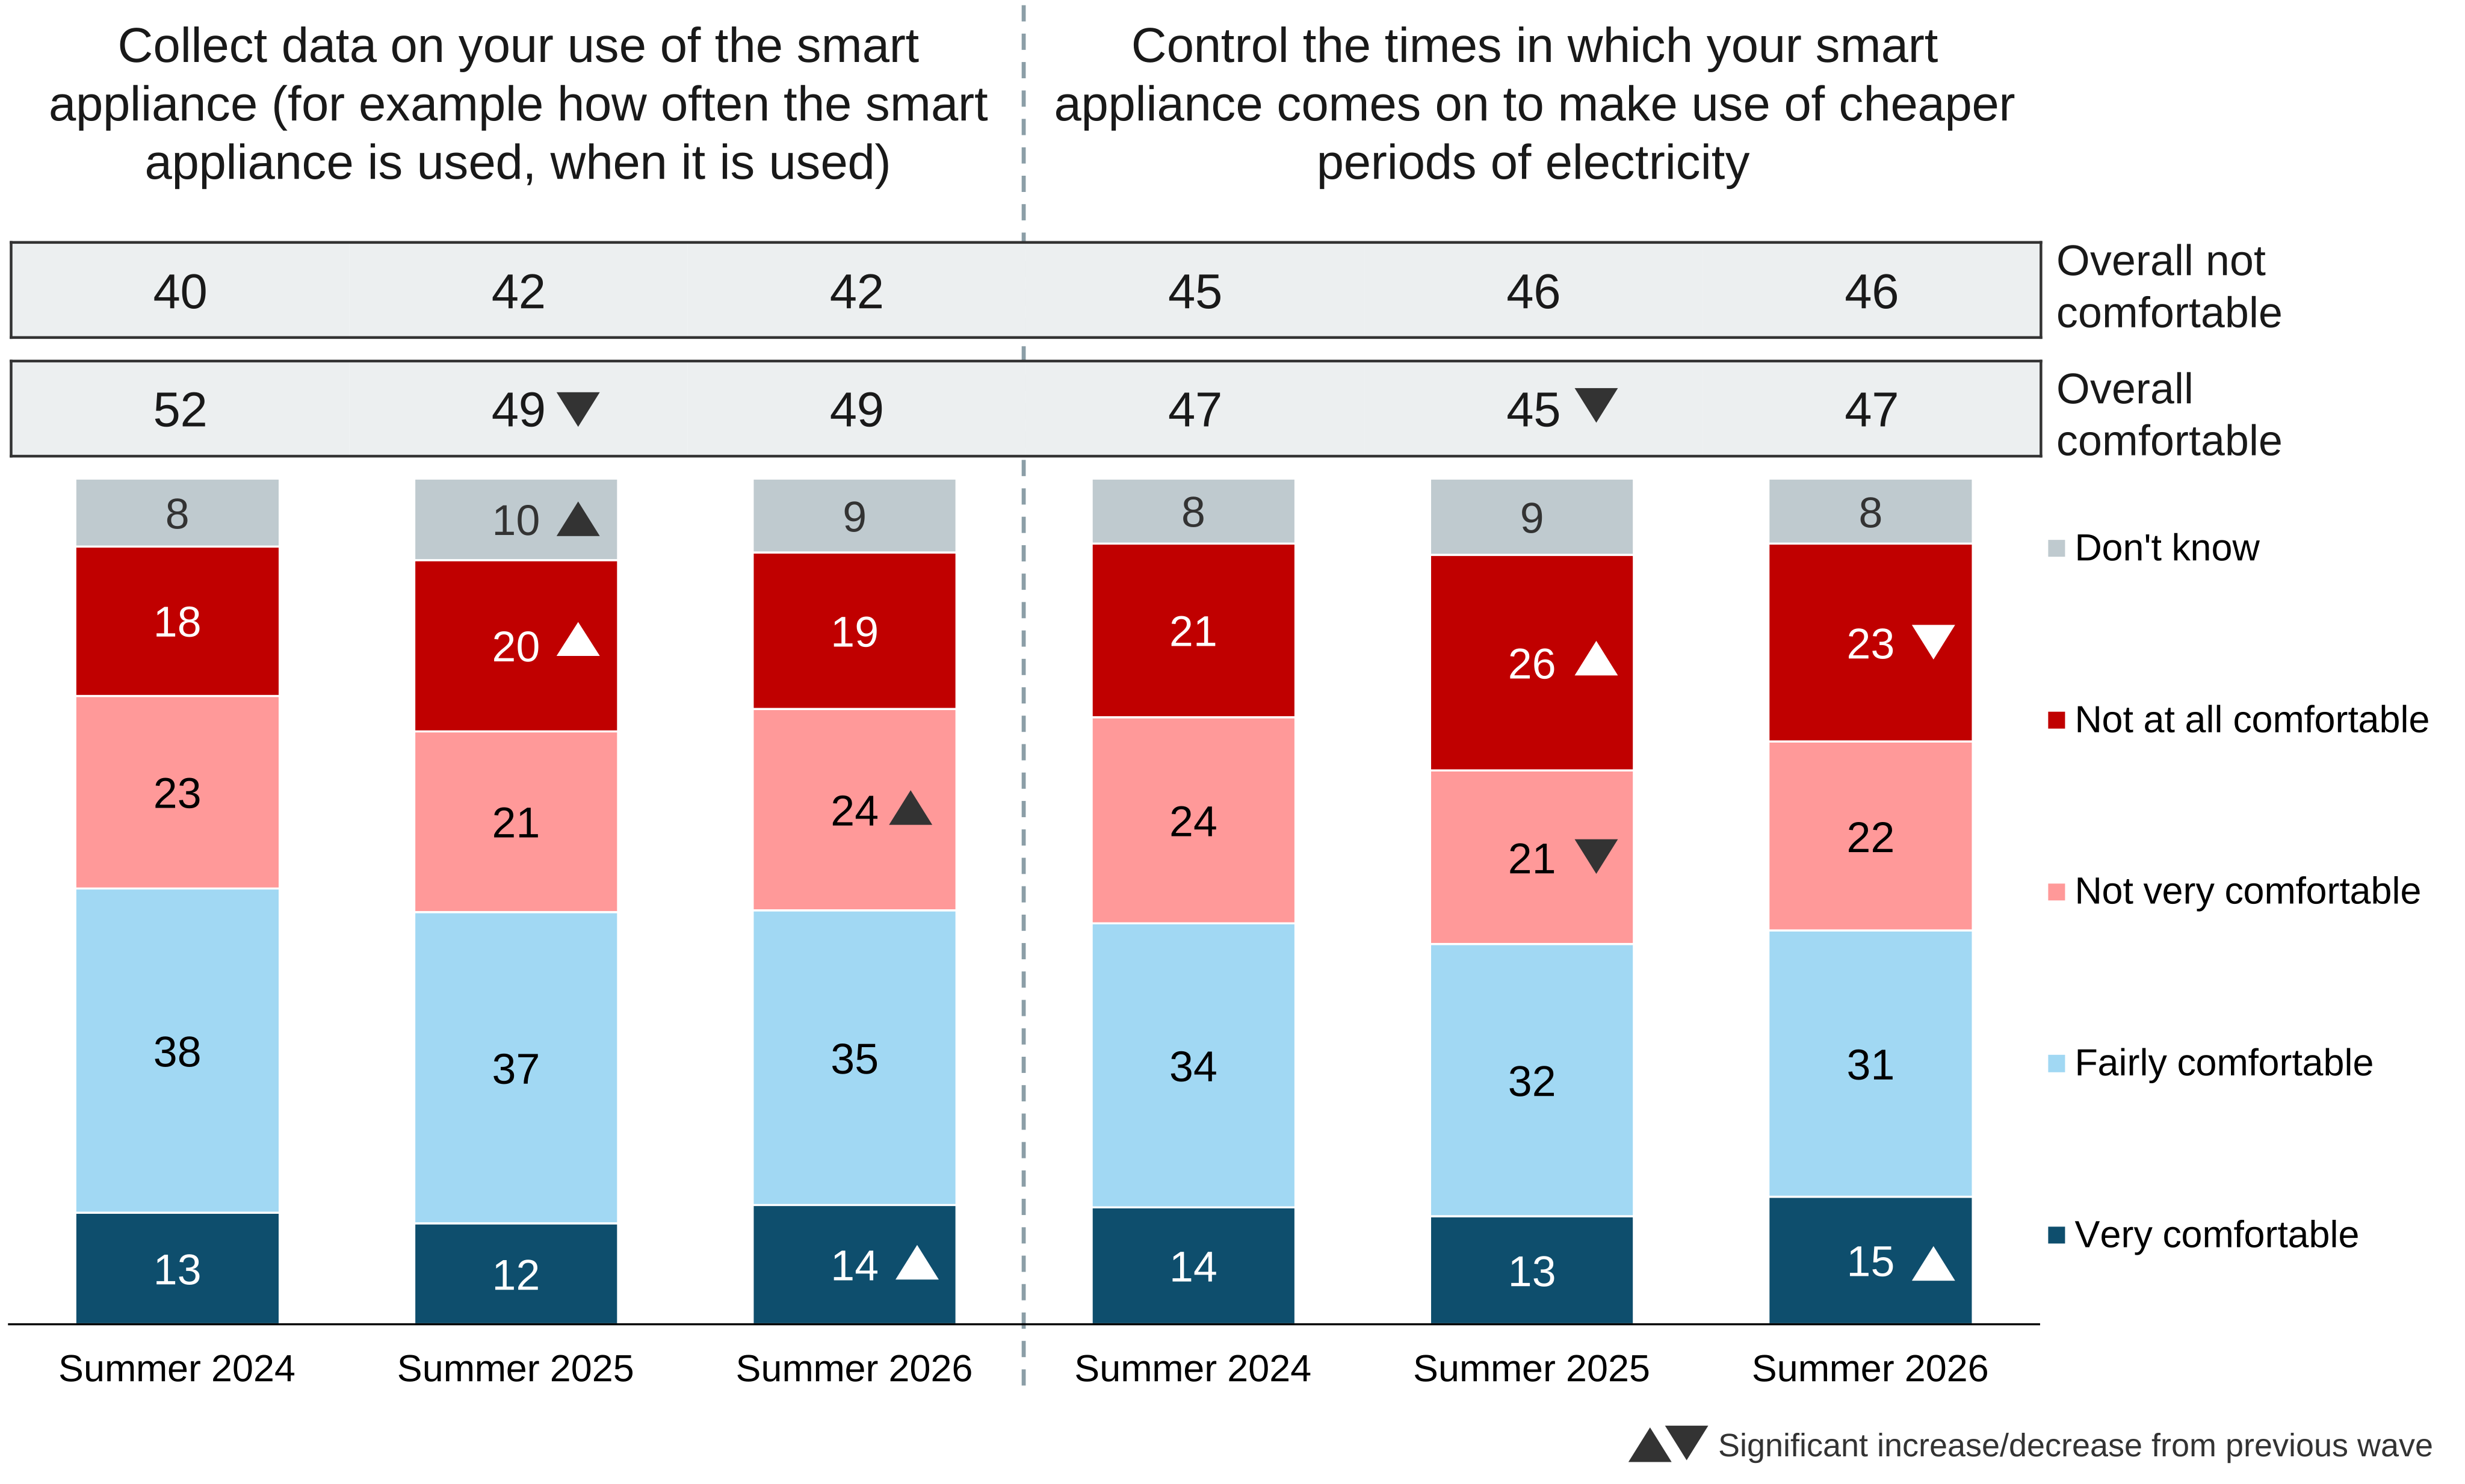
In Summer 2026, 49% of people said that they would be very comfortable or fairly comfortable with their energy supplier ‘collecting data on your use of the smart appliance (for example how often the smart appliance is used, when it is used)’; this was stable compared with Summer 2025 and remained down slightly from 52% in Summer 2024 (Figure 5.7). A similar proportion (47%) said they would be very comfortable or fairly comfortable with their supplier ‘controlling the times in which your smart appliance comes on to make use of cheaper periods of electricity (if you give consent)’.
A small proportion said they would be very comfortable with their supplier collecting data (14%) or controlling times of use (15%). This represented an increase from Summer 2025 for both measures (12% and 13% respectively).
Around two in ten (19%) said they would not be at all comfortable with their supplier collecting data. A slightly higher proportion (23%) would not be at all comfortable with their supplier controlling times of use, although this was back down from 26% in Summer 2025.
Figure 5.7: How comfortable feel with energy supplier involvement in the use of smart appliances in the home to … (based on all people), Summer 2024 to 2026
SMAPPCONTROLA-B. How comfortable, if at all, do you feel about your energy supplier doing each of the following? If you don’t currently own any smart appliances, please imagine how you would feel if you did.
Base: All wave respondents – Summer 2024 / Summer 2025 / Summer 2026: collect data (3,632/3,522/3,231), control times (3,626/3,522/3,231).
Analysis by subgroups
By age:
- People in age groups under 25 (41%) and 65 and over (43%) were less likely to be comfortable with their supplier collecting data compared with those in age groups 25 to 64 (between 52% and 56%).
By housing tenure:
- A higher proportion of people living in owner-occupied households said they would be uncomfortable with their supplier collecting data (44% compared with 39% of those in rented households), and controlling time of use (49% compared with 41% of those in rented households).
By self-reported concern about climate change:
- People who said they were very concerned about climate change were more likely than those who said they were not concerned about it to be comfortable with their supplier collecting data (56% vs 37%) and controlling time of use (53% vs 35%).
Further findings on energy bills and tariffs
In previous waves, questions were included on other topics relating to energy bills and tariffs. The latest findings relating to these topics can be found as follows:
- Attention paid to energy use in the home and ways in which this is monitored, see Winter 2025 report energy bills and tariffs - section on ‘Monitoring energy use’
- Awareness of and likelihood of switching to ‘time of use’ electricity tariffs, see Winter 2025 report energy bills and tariffs - section on ‘Time of use electricity tariffs’
- Electric vehicle ownership and awareness of smart charging, see Winter 2025 report energy bills and tariffs - section on ‘Smart electric vehicle charging’
- Frequency of energy saving and energy wasting behaviours in the home, see Spring 2026 report energy bills and tariffs - section on ‘Energy saving and wasting behaviours’
- Changes made in last two years to reduce energy use, see Summer 2024 report on energy bills and tariffs - section on ‘Changes in energy use made in the last two years’
- Concern about energy bills in the context of other bills, and the impact of increased costs of energy bills, see Spring 2026 report energy bills and tariffs - section on ‘Concern about the costs of energy bills’
- Perceived impact of move to renewable energy sources on energy bills, see Spring 2026 report energy bills and tariffs - section on ‘Attitudes towards the cost of renewable energy’
- Attitudes towards government financial support to households to help with energy bills, see Summer 2024 report on energy bills and tariffs - section on ‘Attitudes towards Government financial support with energy costs’
- Satisfaction with service delivery from energy suppliers, see Spring 2024 report on energy bills and tariffs – section on ‘Energy suppliers’
- Awareness of and the likelihood to use flexible energy reward schemes, see Spring 2026 report energy bills and tariffs - section on ‘Flexible energy schemes’
-
An overview of domestic energy price changes can be found here: Gas and electricity prices during the ‘energy crisis’ and beyond - House of Commons Library ↩
-
The ‘don’t know’ answer code was erroneously added in Summer waves from 2025. To ensure comparability with previous waves, results were rebased on results excluding the 2% of people who answered ‘don’t know’ in Summer 2025 and Summer 2026. ↩
-
ENEFFMORE. And do you feel you know enough about the most effective ways to reduce energy use in your home, or would you like to know more? (Base size: 3,235) ↩
-
For official statistics on energy bills and payment types see: Domestic energy price statistics - GOV.UK. ↩
-
For more information on energy prices during the ‘energy crisis’ and beyond, please see: https://commonslibrary.parliament.uk/research-briefings/cbp-9714/ ↩
-
Although similar questions were asked in Summer 2022, the questions have changed and are therefore no longer comparable with this previous wave. ↩
-
Smart meter ownership data from the Public Attitudes Tracker can be found in the published time series and crosstabulation files. Official statistics for smart meters can be found here: Smart meter statistics - GOV.UK. ↩