DCMS Sectors Economic Estimates 2019: Business Demographics – Technical and quality assurance report
Updated 6 May 2022

© Crown copyright 2022
This publication is licensed under the terms of the Open Government Licence v3.0 except where otherwise stated. To view this licence, visit nationalarchives.gov.uk/doc/open-government-licence/version/3 or write to the Information Policy Team, The National Archives, Kew, London TW9 4DU, or email: psi@nationalarchives.gov.uk.
Where we have identified any third party copyright information you will need to obtain permission from the copyright holders concerned.
This publication is available at https://www.gov.uk/government/statistics/dcms-sectors-economic-estimates-2019-business-demographics/dcms-sectors-economic-estimates-2019-business-demographics-technical-and-quality-assurance-report
This document covers the following topics:
- an overview of the content covered in the statistical release ‘DCMS Economic Estimates 2019: Business Demographics’
- an overview of DCMS Sectors, how they are defined, and limitations of these definitions
- the methodology underlying the statistical release, including data sources
- the processes used to check that the estimates have been produced correctly
- other sources of information for the DCMS sectors
- Further information, including contact details for DCMS statisticians.
1. Overview of release
The statistics release ‘DCMS Economic Estimates 2019: Business Demographics’ provides an estimate of the number and size of businesses within DCMS sectors. These numbers are broken down by:
- The employment size band
- The turnover generated
- UK region and devolved administration
- The ownership status (i.e. UK vs. foreign-owned)
Previous publications have included estimates of the number of enterprises in each DCMS Sector that engage in international trading. These are not included in this year’s release as low response rates mean that detailed industry estimates are likely to be less reliable than previous years. We are exploring options with our data suppliers that would enable us to publish this data in the next DCMS Sectors Economic Estimates 2020: Trade publication, in 2022.
The Office for National Statistics (ONS) is the provider of the underlying data used for the analysis presented within this release. As such, the same data sources are used for DCMS estimates as for national estimates, enabling comparisons to be made on a consistent basis.
1.1 Code of Practice for Statistics
DCMS Sector Economic Estimates 2019: Business Demographics is a National Statistic and has been produced to the standards set out in the Code of Practice for Statistics. In June 2019, the DCMS Sector Economic Estimates were badged as National Statistics. This affirms that the statistics have met the requirements of the Code of Practice for Statistics.
This followed a report by the Office for Statistics Regulation in December 2018, which stated that the series could be designated as National Statistics subject to meeting certain requirements. Since the report, we have striven to improve our publications by providing summaries of other notable sources of data, more detail on the nature and extent of the overlap between the sectors, and further information on the quality and limitations of the data. We will continue to improve the series in the future, in line with the recommendations of the report. We encourage our users to engage with us so that we can improve our statistics and identify gaps in the statistics that we produce.
1.2 Users
The users of these statistics fall into five broad categories:
- Ministers and other political figures
- Policy and other professionals in DCMS and other Government departments
- Industries and their representative bodies
- Charitable organisations
- Academics
The primary use of these statistics is to monitor the performance of the industries in the DCMS sectors, helping to understand how current and future policy interventions can be most effective.
2. Sector definitions
2.1 Overview of DCMS Sectors
Main sector definitions
The sectors for which DCMS has responsibility are:
- Civil Society
- Creative Industries
- Cultural Sector
- Digital Sector
- Gambling
- Sport
- Telecoms
- Tourism
However, DCMS Sector Economic Estimates: Business Demographics does not include Civil Society as the sector cannot be uniquely identified in the Annual Business Survey. Further, the definition for Tourism in this publication is not the same as that used in other Economic Estimates, and the results should not be compared across publications. More details are available in section 2.2.
In order to measure the size of the economy it is important to be able to define it. DCMS uses a range of definitions based on internal or UK agreed definitions. All definitions are based on the Standard Industrial Classification 2007 (SIC) codes. This means nationally consistent sources of data can be used and enables international comparisons.
The development of individual sector definitions in isolation as new sectors have been added to the department’s remit has meant that each sector definition has been designed to be the best possible measure of that sector, rather than being considered as part of a greater whole. This approach has led to overlap between DCMS sectors. For example, the Cultural Sector is defined using SIC codes that are nearly all within the Creative Industries, whilst the Telecoms Sector is completely within the Digital Sector.
Figure 1 below visually shows the overlap between DCMS Sectors in terms of SIC codes. Users should note that this does not give an indication of the magnitude of the value of overlap. For this, users should consult the main report. A list of SIC codes appearing in each sector and subsector can be found in the tables accompanying the release.
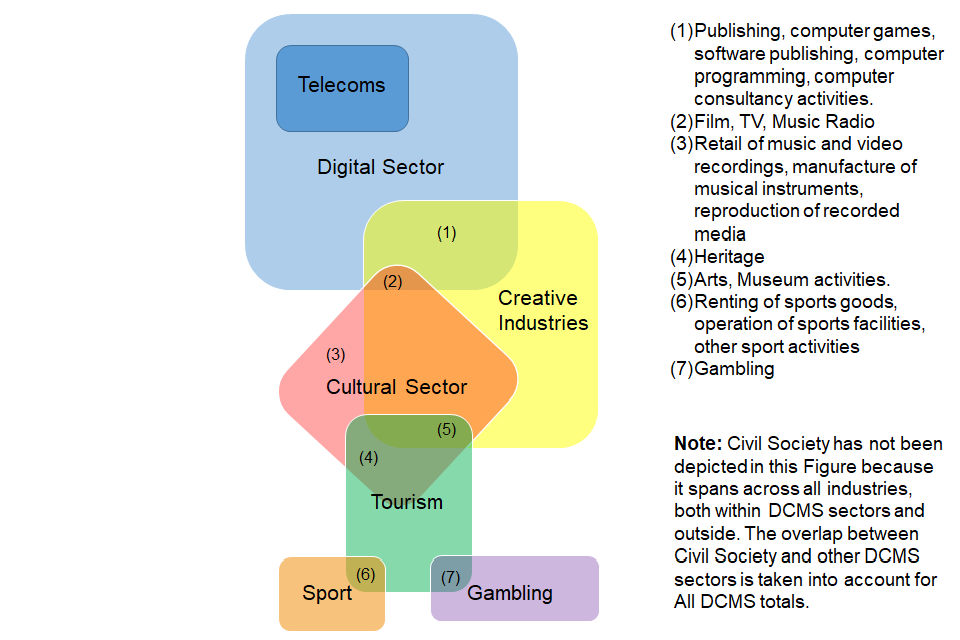
Figure 1. Overlap of SIC codes within DCMS Sectors
2.2 Other sector definitions
Additional analysis is presented in the Business Demographics release for the Audio Visual sector and the Computer Games sector. The definition of the Audio Visual sector (see below) is intended to reflect the sectors covered by the EU Audio Visual Media Services Directive.
- 59.11 - Motion picture, video and television programme production activities
- 59.12 - Motion picture, video and television programme post-production activities
- 59.13 - Motion picture, video and television programme distribution activities
- 59.2 - Sound recording and music publishing activities
- 60.1 - Radio broadcasting
- 60.2 - Television programming and broadcasting activities
- 63.91 - News agency activities
- 63.99 - Other information service activities n.e.c.
- 77.22 - Renting of video tapes and disks
- 77.4 - Leasing of intellectual property and similar products, except copyrighted works
The Computer Games sector combines the 4-digit SIC code 58.21 (Publishing of Computer Games) and 62.01/1 (Ready-made interactive leisure and entertainment software development).
A number of software programming companies in 62.01 – ‘Computer programming activities’ may also contribute to the output of computer games, as part of a range of programming activities. This is not included in these computer games estimates, but will have been implicitly included in the ‘IT, software and computer services’ group in the main estimates.
2.3 Details and limitations of sector definitions
This section looks at sector definitions used in this release in more detail, and provides an overview of limitations.
There are substantial limitations to the underlying classifications. As the balance and make-up of the economy changes, the SIC, finalised in 2007, is less able to provide the detail for important elements of the UK economy related to DCMS Sectors. The SIC codes used to produce these estimates are a ‘best fit’, subject to the limitations described in the following section.
Creative Industries
The Creative Industries were defined in the Government’s 2001 Creative Industries Mapping Document as “those industries which have their origin in individual creativity, skill and talent and which have a potential for wealth and job creation through the generation and exploitation of intellectual property”.
To allow the Creative Industries to be measured, DCMS worked with others to develop a statistical definition of the Creative Industries which reflects this definition. DCMS uses a “Creative Intensity” to determine which industries (at 4 digit SIC) are Creative. The Creative Intensity is the proportion of occupations in an industry that are creative and, if the intensity is above a set threshold, that industry is typically defined as Creative. More information can be found in the 2016 methodology document.
Cultural Sector
There are significant limitations to the DCMS measurement of the cultural sector arising from the lack of detailed disaggregation possible using the standard industrial classifications. There are many cases where culture forms a small part of an industry classification and therefore cannot be separately identified and assigned as culture using standard data sources. DCMS consulted on the definition of Culture and published a response in April 2017.
It is recognised that, due to the limitations associated with SIC codes, the SIC code used in past publications as a proxy for the Heritage sector (91.03 - Operation of historical sites and building and similar visitor attractions) is likely to be an underestimate of this sector’s value. We have changed the name of the Heritage sector to ‘Operation for historical sites and similar visitor attractions’ to reflect this.
Digital Sector
The definition of the Digital sector used by DCMS is based on the OECD definition of the ‘information society’. This is a combination of the OECD definition for the “ICT sector” as well as including the definition of the “content and media sector”. An overview of the SIC codes included in each of these sectors is available in the OECD Guide to Measuring the Information Society 2011 (see Box 7.A1.2 on page 159 and Box 7.A1.3 on page 164).
The definition used for the Digital Sector does not allow consideration of the value added of “digital” to the wider economy e.g. in health care or construction. DCMS policy responsibility is for digital across the economy and therefore this is a significant weakness in the current approach.
Sport
For the purpose of this publication the statistical definition of sport has been used. This incorporates only those 4-digit Standard Industrial Classification (SIC) codes which are predominantly sport (see the definitions table published alongside the methodology note).
DCMS also publishes estimates of sport based on the EU agreed Vilnius definition. The Vilnius definition is a more comprehensive measure of sport which considers the contribution of sport across a range of industries, for example sport advertising, and sport related construction. The methodology for the DCMS Sport Satellite Account is currently being reviewed and therefore has not been used in these estimates.
Tourism
The definition of Tourism in this release differs to that used in other DCMS Sector Economic Estimates releases, and results should not be directly compared. In this release we therefore refer to the tourism industries rather than the tourism sector.
The estimates of Tourism are based on results from the Tourism Satellite Account, which estimates the direct economic impact of tourism (or tourists) on the UK economy. The Tourism Satellite Account does not currently produce estimates of the number of businesses that are directly supported by Tourism. Hence this release is based on a “tourism industries” approach, which counts any establishment for which the principal activity is a tourism characteristic activity. As such, the estimates for Tourism within this release are not comparable to those in other releases, and account for a greater proportion of the DCMS sectors (excluding Civil Society) total. In the majority of the DCMS Economic Estimates publications the estimates of Tourism are based on results from the Tourism Satellite Account, which estimates the direct economic impact of tourism (or tourists) on the economy as a proportion of each standard industrial class.
3. Methodology
This chapter summarises the methodology used to produce Business Demographics estimates.
Definition of a business
Within the Inter-Departmental Business Register (IDBR), information is held about a variety of types of “business unit”. These are described below along with how they are referred to within DCMS Business Demographics releases. Businesses are defined as any Reporting Units held on the IDBR. Meanwhile, business sites (also referred to within DCMS Business Demographics releases) are defined as any local units held on the IDBR. The table below outlines the differences between these types of unit and another high-level grouping – the enterprise. Prior to the February 2018 publication, DCMS provided estimates of the number of enterprises rather than the number of businesses.
In practice, in the vast majority of cases, the local unit and business unit are the same unit - only about 2.2% of businesses operate more than one local unit[footnote 1] . As such, most of the time the terms ‘enterprise’, ‘business’, and ‘local unit’ may be used interchangeably.
Table 1. Types of Units in the IDBR
| Business Unit | Description | Examples | Referred to as… |
|---|---|---|---|
| Enterprise | The smallest combination of legal units (generally based on VAT and/or PAYE records) which has a certain degree of autonomy. An enterprise carries out one or more activities at one or more locations, but may still be a sole legal unit. | Arcadia (who own Topshop, Topman, Dorothy Perkins and Burton among others) | “Enterprise” in the August 2016 publication |
| Reporting Unit | Put simply, the Reporting Unit holds the mailing address to which the survey questionnaires are sent. The questionnaire can cover the enterprise as a whole, or parts of the enterprise identified by lists of local units. | Topshop | “Business” from the February 2018 publication onwards |
| Local Unit | A local unit is an enterprise or part thereof (e.g. a workshop, factory, warehouse, office, mine or depot) situated in a geographically identified place. | An individual Topshop store e.g. on a local high-street or in a shopping mall | “Business site” from the February 2018 publication onwards |
Number of businesses
ONS provide us with data on the number of businesses (reporting units) at the 4-digit SIC level. The relevant SICs are then aggregated to produce estimates for each DCMS sector.
Size of businesses
Business size can be measured either as the number of employees, or turnover generated. For ease of analysis, the number of employees and turnover generated are grouped into bands.
Number of employees (employment band)
The standard definition of a small and medium sized enterprise (SMEs) is any business with fewer than 250 employees. Taking this into account, DCMS have classified employment size in the following categories:
- 0-9 employees (representing micro businesses)
- 10-49 employees (representing small businesses)
- 50-249 employees (representing medium businesses)
- 250+ employees (representing large businesses)
Information on number of employees is collected as part of the ABS. ONS provide DCMS with data on the number of businesses (reporting units) within each of the employment size bands listed above.
Turnover
Turnover refers to the value of sales, work done and services rendered by businesses, excluding VAT. This is different to profit or value added and does not take into account business costs. Businesses that generate a lower turnover can be more profitable/productive than businesses with higher turnover.
Information on turnover is collected as part of the ABS. ONS also provide data on the number of businesses (reporting units) within specified turnover bands. The turnover bands (£000’s) used in this analysis are listed below:
- £0 to £50
- £50 to £100
- £100 to £250
- £250 to £500
- £500 to £1,000
- £1,000+
Region
The regional distribution of DCMS businesses is based on the number of business sites (local units). A local unit represents an individual site (for example a factory or shop) in a business (reporting unit). One business may have many sites, and, where this is true, the location of the business is generally the main operating site or the head office.
Generally, businesses (reporting units) are the same as enterprises (legal entities of the business) but larger enterprises can be split into a number of reporting units based on divisional structure, geographical considerations, type of activity, or other agreed reporting structures. Reporting units return total values that represent one or many local units of that business. To produce these estimates, the reporting unit data must be apportioned amongst the local units of that business. Regional data are apportioned based on local unit industry classification, employment size and regional location. All ABS national results for the UK are produced using reporting unit data, and the UK national total for each variable at the “all industry” level is the figure that the regional estimates for that variable will add up to. ONS provide DCMS with data on the number of business sites (local units) within each region (or devolved administration) for each 4-digit SIC. This information is then aggregated up to produce estimates for DCMS sectors.
Foreign-owned businesses
The ownership status of a business can be determined by the nationality of its parent. Where control of the business is shared, country of ownership is determined by the country of residence of the majority ultimate owner. Where businesses do not belong to an enterprise group (and are therefore not under the control of another institutional unit) they have been classified as UK-owned. Data are split into UK-owned and foreign-owned (EU and non-EU) businesses.
Summary of data sources
In summary, the data presented in this report on Business Demographics
- are based on official statistics data sources
- are based on internationally-harmonised codes
- are based on survey data (Annual Business Survey) and, as with all data from surveys, there will be an associated error margin surrounding these estimates[footnote 2]
This means the estimates are:
- comparable at both a national and international level.
- comparable over time, allowing trends to be measured and monitored
However, this also means the estimates are subject to limitations of the underlying classifications of the make-up of the UK economy. For example, the standard industrial classification (SIC) codes were developed in 2007 and have not been revised since. Emerging sectors, such as Artificial Intelligence, are therefore hard to capture and may be excluded or mis-coded.
4. Validation, accuracy and quality assurance processes
This chapter summarises the validation, accuracy and quality assurance processes applied during the production of the DCMS Economic Estimates 2019: Business Demographics statistics. This includes a detailed account of the quality assurance processes and the data checks carried out by our data providers (Office for National Statistics, ONS) as well as by DCMS.
4.1 Validation, accuracy and quality assurance processes at ONS
Quality assurance at ONS takes place at a number of stages. The validation and accuracy of the source data, as well as the various processes in place to ensure quality for the data sources used in the Business Demographics publication, are outlined in the relevant links below.
Annual Business Survey (ABS)
For more information on quality assurance processes used during the production and analysis of ABS, as well as validation and accuracy of the estimates, see the Annual Business Survey QMI and the Annual Business Survey technical report: August 2018.
Quality Assurance processes at DCMS
The majority of quality assurance of the data underpinning the DCMS Sectors Economic Estimates Business Demographics release takes place at ONS, through the processes described above. However, further quality assurance checks are then carried out within DCMS. Production of the analysis and report is typically carried out by one member of staff, whilst quality assurance is completed by at least one other, to ensure an independent evaluation of the work.
Data requirements and data delivery
For the ABS data, DCMS discussed our data requirements with ONS and these are formalised as a Data Access Agreement (DAA). The DAA covers which data are required, the purpose of the data, and the conditions under which ONS provide the data. Discussions of requirements and purpose with ONS improved the understanding of the data at DCMS, helping us to ensure we receive the correct data and use it appropriately.
DCMS checks that the data delivered by ONS match what is listed in the Data Access Agreement (DAA). For this particular release we check that:
- we have received all regional data at the 4 digit SIC code level, which is required for us to aggregate up to produce estimates for our sectors and sub-sectors
- data at the 4 digit SIC code has not been rounded unexpectedly. This would cause rounding errors when aggregating up to produce estimates for our sectors and subsectors
- where bespoke breakdowns are required (the employment and turnover size bands used by DCMS differ to those used in the ONS publication) that these have been defined correctly.
Data analysis
At the analysis stage, data are aggregated up to produce information about DCMS sectors. The Business Demographics lead builds in the following checks at this stage:
Checks that summing up breakdowns gives the same figure as the total they contribute to. E.g.:
- If you sum together businesses in all employment and turnover bands in each sector do you get the total number of businesses in that sector?
- Does the number of foreign-owned businesses equal the number of EU (excluding UK)-owned businesses plus the number of non-EU-owned businesses?)
“Sense checks” of the data. E.g.:
- Does the number of businesses in DCMS sectors look similar to last year? If not, could this because of changes to the number of businesses in the UK non-financial business economy as a whole (like rapid growth/decline) or changes to the ABS methodology?
- Do the businesses in DCMS sectors have the same/similar distribution in terms of size and geographical location as previous years?
Data analysis quality assurance checks
At the analysis stage, data are aggregated to produce information about DCMS sectors and sub-sectors. The Business Demographics statistics lead checks whether:
- The correct data have been used for the analysis e.g. has the 2019 data been used to derive the 2019 figures for DCMS sectors, or has the 2018 data been used by mistake?
- The correct SIC codes have been aggregated together to form DCMS sector and sub-sector estimates. Are all SIC codes we require included? Are there any non-DCMS SIC codes that have been included by accident?
- The correct statistical disclosure standards have been applied to ensure confidentiality.
Publication quality assurance checks
Finalised figures are disseminated within OpenDocument Format tables and a written headline report, published on GOV.UK. These are produced by the Business Demographics statistics lead. Before publishing, a quality assurer checks the data tables as well as the report to ensure minimal errors. This is checked against a QA log where comments can be fed back and actioned accordingly. The quality assurer also makes sure any statements made about the figures (e.g. regarding trends) are correct according to the analysis and checks for spelling or grammatical errors.
Proofreading and publication checks are done at the final stage, including:
- checking the figures in the publication match the published tables
- checking the footnote numbering is correct
- making sure hyperlinks work
- checking chart/table numbers are in the correct order
- ensuring the publication is signed off by DCMS Head of Profession for Statistics and DCMS Chief Economist
- contacting press office to ensure they are aware of the release date
- checking the published GOV.UK page again after publishing
Post publication
Once the publication is released, DCMS reviews the processes and procedures followed via a wash up meeting. This occurs usually a week after the publication release date and discusses:
- what went well and what issues were encountered
- what improvements can be made for next time
- what feedback have we received from engaging with users
5. External data sources
It is recognised that there were always different ways to define sectors, but their relevance depends on what they are needed for. Government generally favours classification systems which are:
- rigorously measured,
- internationally comparable,
- nationally consistent, and
- ideally applicable to specific policy interventions.
These are the main reasons for DCMS using SIC code based definitions for its sectors. However DCMS accept that there are limitations with this approach (see Annex A), and alternative definitions can be useful where a policy-relevant grouping of businesses crosses existing Standard Industrial Classification (SIC) codes.
DCMS are aware of other estimates of DCMS Sectors. These estimates use varying methodologies and can be useful for serving several purposes, e.g. monitoring progress under specific policy themes such as community health or the environment, or measuring activities subsumed across a range of SICs. While potentially useful, the quality of the data depends on that of the evidence used to estimate the appropriate share of existing SICs.
The table below shows different sources of analysis measuring the economic contribution of different DCMS policy areas from other organisations. It is recognised that there will be many other sources of evidence from industry bodies, for example, which have not been included in this table. This will be developed over time to capture a wider spectrum of stakeholder’s releases.
Table 2. Alternative data sources measuring economic contribution of DCMS sectors
| Sector | Sub-sector | Organisation | Publication | Summary of use |
|---|---|---|---|---|
| Civil Society | Charities | Charity Commission for England and Walesa | Charity Commission annual report and accounts 2019 to 2020 b | The Charity Commission is the registrar and regulator of charities in England and Wales. The registrar is responsible for maintaining an accurate and up-to-date register of charities. This includes determining whether organisations are charitable and therefore should be registered as well as removing those that are no longer considered to be charities, have ceased to exist or do not operate. The commission regulates both registered charities and charities that are not required to be registered. |
| Civil Society | Community Interest Companies | The Office of the Regulator of Community Interest Companiesc | CIC Regulator: Annual Report 2019 to 2020d | This report outlines the activities of the Office of the Regulator of Community Interest Companies (CIC Regulator) during the 2019 to 2020 financial year. |
| Creative Industries | Architecture | Royal Institute of British Architects (RIBA)ae | The List 20f | RIBA holds information about the number of chartered architectural practices in the UK. They publish full contact details of these practices to serve as a directory to help potential clients identify and choose an architect. The numbers differ from DCMS figures as businesses in the Architecture sub-sector may not necessarily be chartered practices. |
| Creative Industries; Cultural Sector | Crafts | Crafts Councilg | Measuring the Craft Economyh | The Crafts Council produce three figures for Craft – one matches the DCMS definition exactly, another (called ‘DCMS+’) consists of some additional SICs identified by the Crafts Council as belonging to the Crafts sector, these are then summed together to produce a total for Craft. They use business counts from the Inter-departmental Business Register, together with data from Department for Business, Energy & Industrial Strategy’s Business Population Estimates, which enables them to include businesses below the VAT/PAYE threshold. In the Crafts Council release, it is these businesses below the VAT/PAYE threshold that are referred to as micro businesses, rather than those with 0-9 employees. |
| Creative Industries; Cultural Sector | Arts | Arts Council England (ACE)i | Contribution of the arts and culture industry to the UK economyj | ACE details the number of enterprises broken down by employment size band in the broad industries from which the Arts and Culture Industry definition is drawn. They use similar SIC codes to DCMS’ Economic Estimates, but they use different employment bands, and draw the data from Department for Business, Energy & Industrial Strategy’s Business Population Estimates rather than from the Annual Business Survey. The analysis uses data at the 2 digit SIC level, rather than the 4 digit level, hence reporting on the broad industries from which the Arts and Culture Industry definition is drawn, rather than the Arts and Culture Industry itself |
| Creative Industries; Cultural Sector; Digital Sector | Film, TV, video, radio and photography; IT, software and computer services | British Film Institute (BFI)k | BFI Statistical Yearbook: The UK Film Economyl | BFI provides an estimate of the number of companies in the Film Industry, including the size (by turnover) and regional distributions. They use similar SIC codes to DCMS’ Economic Estimates, but rather than using results from the Annual Business Survey, they use results from the Inter-Departmental Business Register (IDBR) – the comprehensive list of businesses in the UK from which the ABS sample is drawn. Any variation in estimates from the ABS and IDBR is due to differences in the sources, sample size and the time periods during which the data are collected. The estimates derived from the ABS are National Statistics and considered by the ONS to be the more robust data. They tend to value down turnover compared to the IDBR. |
| Creative Industries; Cultural Sector | Museums and Galleries and Libraries; Museums and Galleries | Arts Council England (ACE)i | The economic impact of museums in Englandm | ACE commissioned a report which looked at the economic impact of museums in England in 2013 and included details of the number of organisations, sites, and the average employment in each organisation. This methodology varies greatly to DCMS’ Economic Estimates. The definition of museums is much wider than is used in DCMS’ estimates, which is based on one SIC code. ACE have identified the limitations with using SIC codes for museums, namely that to be included in the official statistical surveys, the museum needs to be registered for PAYE or VAT, which means some of the small museums would not be included in these official sources. The same applies to local authority delivered museum services which would be coded under the Public Administration SIC code. As a result ACE have used a bottom-up approach of developing a database of museums in England then using various sources to identify the economic measures for each museum. This is for England and was produced in 2013. |
| Gambling | Gambling | Gambling Commissionn | Industry statisticso | Gambling Commission produce industry statistics twice a year covering various economic impacts, including number of businesses (betting shops, bingo premises, casinos). They use a different method to DCMS’ Economic Estimates, reflecting differences in data sources available to the Gambling Commission and their policy needs. The Gambling Commission derive their estimates from returns from their operators - it is a license requirement for operators to submit returns, so essentially the collection is a census. This has benefits over using survey data like DCMS use. In addition, the industry definition by Gambling Commission is wider. DCMS only use SIC 92 to define Gambling; however it is likely that there will be companies outside of SIC 92 included in the Gambling Commission statistics. For example, some working men’s clubs may hold a license but would not be classified under SIC 92 by virtue of their other primary activities. |
a: The Charity Commission
b: Charity Commission annual report and accounts 2019 to 2020
c: The Office of the Regulator of Community
d: CIC Regulator: Annual Report 2019 to 2020
e: Royal Institute of British Architects (RIBA)
f: The List 20
g: The Crafts Council
h: Measuring the Craft Economy
i: Arts Council England (ACE)
j: Contribution of the arts and culture industry to the UK economy
k: British Film Institute (BFI)
l: BFI Statistical Yearbook: The UK Film Economy
m: The economic impact of museums in England
n: Gambling Commission
o: Gambling Industry statistics - May 2021
-
Information taken from: UK Business; Activity, size and location: 2020 ↩
-
Sampling error is the error caused by observing a sample (as in a survey) instead of the whole population (as in a census). While each sample is designed to produce the “best” estimate of the true population value, a number of equal-sized samples covering the population would generally produce varying population estimates. This means we cannot say an estimate of, for example, 20% is very accurate for the whole population. Our best estimates, from the survey sample, suggest that the figure is 20%, but due to the degree of error, the true population figure could perhaps be 18% or 22%. This is not an issue with the quality of the data or analysis; rather it is an inherent principle when using survey data to inform estimates. ↩