DCMS Sector National Economic Estimates: 2011 - 2020
Updated 22 November 2024

© Crown copyright 2024
This publication is licensed under the terms of the Open Government Licence v3.0 except where otherwise stated. To view this licence, visit nationalarchives.gov.uk/doc/open-government-licence/version/3 or write to the Information Policy Team, The National Archives, Kew, London TW9 4DU, or email: psi@nationalarchives.gov.uk.
Where we have identified any third party copyright information you will need to obtain permission from the copyright holders concerned.
This publication is available at https://www.gov.uk/government/statistics/dcms-sector-national-economic-estimates-2011-to-2020/dcms-sector-national-economic-estimates-2011-2020
1. Details
Release date: 23 December 2021
Geographic Coverage: United Kingdom
Responsible statistician: Rachel Moyce
2. Introduction
The purpose of this publication is to report and compare economic measures for the DCMS sectors, where possible, for the past ten calendar years. Estimates covering more recent time periods are summarised in the table below.
| Measure | Most recent data available | Next available data | ||
|---|---|---|---|---|
| Time period covered | Date published | Time period covered | Date to be published | |
| Employment | July 2020 - June 2021 | October 2021 | October 2020 - September 2021 | February 2022 |
| Earnings | April 2020 (provisional) | November 2020 | April 2022 | November 2022 |
| GVA | September 2021 | November 2021 | December 2021 | February 2022 |
Productivity is an experimental measure. We will release further details in due course as we develop it further.
We also produce estimates of international trade, and of business demographics for the DCMS sectors. These can be accessed via the Economic Estimates home page.
3. Sectors
The Economic Estimates measure the economic contribution to the UK of each sector for which DCMS has responsibility:
- Civil Society
- Creative Industries
- Cultural sector
- Digital sector
- Gambling
- Sport
- Telecoms
- Tourism
For details of each sector’s definition, see the associated technical report. Please note, data is not available for all sectors, measures and years:
- Estimates for the Tourism sector are only available for 2016 to 2020 as they rely on the Tourism Satellite Account. Tourism Satellite Account estimates prior to 2016 are not comparable, and were not available for 2021 at the time of publication.
- Estimates of GVA by Civil Society are not available in this release, as we do not have an established method to estimate the type of GVA reported (chained volume measures) for that sector. Please refer to the most recent annual report for estimates of Civil Society GVA in current prices.
- Estimates of productivity are not included for the Tourism sector and Civil Society in this release.
4. Measures
This section outlines the meaning, construction, and limitations of the measures reported in this release.
In some cases, measures have been provided as an index. The index year has been chosen as 2016 because this is the earliest year common to all reported measures, with the exception of productivity, for which no time series is currently available.
4.1 Gross Value Added (GVA)
GVA measures the monetary value of all goods and services in an economy, minus the value of any intermediates, within a defined period of time. It is useful as a measure of the increase in the value of the economy due to the production of goods and services, however it is limited in that it excludes anything which does not have a market price. Its relationship to GDP is as follows:
GVA = GDP + Subsidies - Taxes
GVA is measured either in:
- current basic prices (‘nominal GVA’), which give the best ‘instantaneous’ measure of the value to the economy, but are not adjusted for the effect of inflation
- chained volume measures (‘real terms GVA’), where the effect of inflation is removed
We use current prices to report current sector estimates and chained volume measures for any comparisons over time.
This report includes two estimates of GVA in chained volume measures; our previously published annual estimates, and an interim measure based on our monthly GVA that we have developed for this release. We have used the monthly GVA to construct an annual estimate for 2020 due to delays in production of the data that we would normally use. Our usual estimate of GVA for 2020 will be published once data become available. Estimates for 2019 for both measures show good comparability, however as even small percentage differences in level estimates can affect year to year percentage changes, users are advised to be cautious when comparing the two series.
4.2 Employment
DCMS employment estimates provide an overview of those working in the DCMS sectors and the UK overall. They provide a measure of the number of jobs supported by industries within DCMS’s remit, and of the characteristics of the workforce by demographic group. This enables assessment of the contribution of DCMS industries to the UK economy, and a greater understanding of access to employment in the DCMS sectors.
Headline measures of employment (number of filled jobs) are calculated based on the Office for National Statistics Annual Population Survey (APS). The data in this publication represents a revised back series, using a new approach to calculate employment in Civil Society, as well as including the latest Tourism estimates.
The headline measures of employment are based on annual, calendar year data. While this release will primarily focus on the 2016 to 2020 estimates, the accompanying data tables will stretch from 2011 to 2020. We have also released estimates covering more recent, non-calendar years.
Employment estimates for social mobility and socio-economic background are based on the Office for National Statistics Labour Force Survey (LFS). Data on social mobility is only available for one quarter per year from 2016 onwards, therefore estimates in this release (and accompanying data tables) will be based on data collected between July and September each year from 2016 to 2020.
Following a move to more machine-readable outputs, employment estimates for previous years have tended to be released as single year files, sometimes with slightly different demographic disaggregations as we have responded to new user needs. This release aims to make it easier for users to compare changes over time by releasing a coherent calendar year time series. The 2021 calendar year data will be available in summer 2022.
4.3 Earnings
Earnings can provide a proxy measure for a person’s total disposable income. Increased income enables people to purchase more goods and services and is associated with an improved standard of living. Estimates of earnings across sectors and between different groups, including over time, are important to understand how DCMS sector industries contribute to the economic wellbeing of the workforce, and whether inequalities exist between workers with different characteristics.
Our headline measure of earnings is nominal median annual earnings for all employees i.e. earnings of the self employed are not included.
Estimates of Annual Gross Pay, are based on data from the Annual Survey of Hours and Earnings (ASHE). This survey uses employee data sampled from the PAYE system, but does not provide detailed employee characteristics. The ASHE dataset is a snapshot of earnings in the UK at a reference date in April each year. In 2020, the reference date was 22 April, during national lockdown. The data for both 2020 and 2021 includes furloughed employees.
Estimates of employee gross hourly pay in main jobs, for more detailed demographic breakdowns, are based on data from the Annual Population Survey. This has a smaller sample size and provides self-reported income, hence the ASHE is the preferred source of earnings data where possible.
The gender pay gap is calculated using hourly earnings excluding overtime. It is presented as the difference in median earnings for men and women as a percentage of the figure for men.
Estimates for pay whilst on furlough are available from the ASHE dataset. These are based on whether an individual was furloughed as part of the Coronavirus Job Retention Scheme (CJRS) on the survey reference date (this is always in April of the survey year). The estimates of pay to furloughed employees are based on actual payments made to the employee from company payrolls and the hours on which this pay was calculated, which in the case of furloughed employees are their usual hours. As employers could claim up to 80% of employees’ usual wages, we would expect earnings by furloughed employees to be lower than those of non-furloughed employees.
Unless otherwise stated, changes over time are reported in nominal terms, i.e., comparing earnings in the prices they were for the relevant year, rather than adjusting for inflation.
No data is available in either source for the self-employed.
4.4 Productivity
Productivity is a measure of how much output can be produced per unit of input. Raising productivity enables an economy to produce and consume more from a certain amount of input, so understanding how and why productivity increases is important to raise the country’s standard of living.
Labour Productivity is defined as output per unit of labour input and effectively shows changes in output over time for the same amount of labour input.
GVA / Employment = Labour Productivity
This release reports Labour productivity expressed in GVA per job. This was calculated by output (Gross Value Added) divided by the number of jobs. The recommended measure of jobs is productivity jobs, not the number of filled jobs in this release[footnote 1]; combining the GVA and employment figures in this release will not provide a measure of productivity that is consistent with best practice, or the ONS figures, and is not recommended.
Estimates of productivity are based on ONS figures for productivity jobs, apportioned to DCMS sectors using BRES and APS employment data. These figures are consistent with ONS estimates, but are considered experimental for DCMS sectors. Feedback on their use and development should be sent to evidence@dcms.gov.uk.
All productivity figures are annual totals presented in 2019 prices and are rounded to the nearest £100.
5. All DCMS Sectors
The ‘All DCMS sector’ total is the combined result for all the sectors for which DCMS is responsible. These are Civil Society, Creative Industries, the Cultural sector, the Digital sector, Gambling, Sport, Telecoms, and Tourism. Due to the way the sectors are defined, a particular industry can be included in more than one sector. For example, ‘Performing Arts’ is included in both the Creative Industries and the Cultural sector. Overlaps like these between the sectors, mean that the ‘All DCMS sector’ total does not equal the sum of the sectors. For more detail, please see the technical report.
In some cases, the DCMS sector total will exclude specific sectors. This is because data is not available for those sectors. If this is the case, the missing sector will be noted as in the following example: ‘all DCMS sectors (excluding Tourism)’.
5.1 Gross Value Added (GVA)
Latest estimate - leading indicator
We have published monthly estimates of the GVA in DCMS sectors (excluding Tourism and Civil Society) up to September 2021. These suggest that DCMS sector (excluding Tourism and Civil Society) monthly GVA in September 2021:
- was 5.7% larger compared to January 2021, primarily due to the Sport and Creative Industries sectors, which grew by 45.1% and 4.8% respectively
- was still 2.7% smaller than in February 2020 (the last month unaffected by pandemic measures).
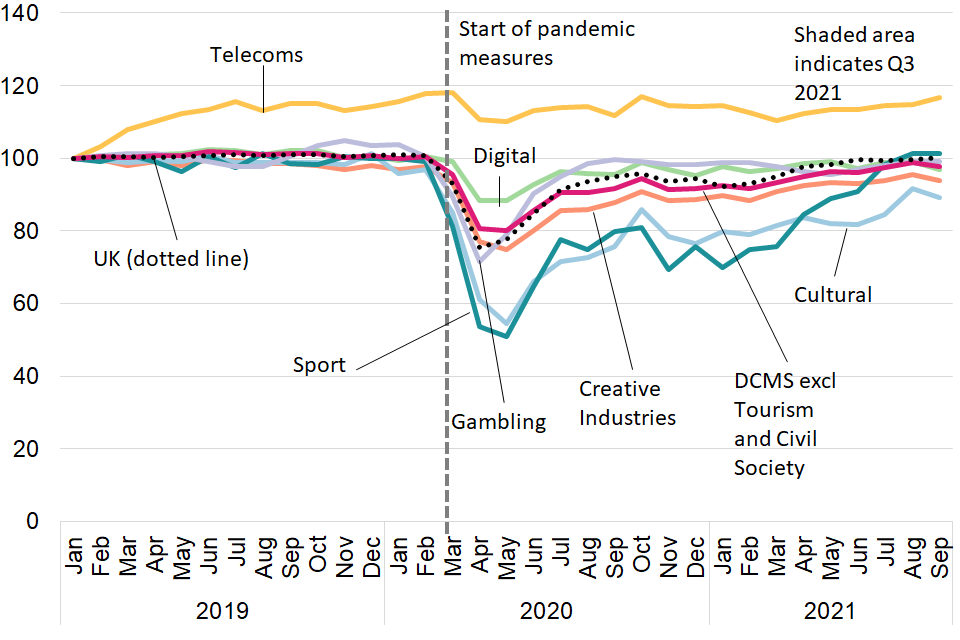
Figure 1. Monthly GVA, seasonally adjusted, UK, January 2019 to September 2021 Base year = 2019
Annual measure for 2020
The leading indicator is more timely but less robust than our annual estimate, for which the latest available data is 2019. We typically publish our annual GVA estimate towards the end of the following year, however we are unable to do so for 2020 as release of the underlying data has been postponed to summer 2022. Instead, for this release, we have constructed an interim measure based on the monthly GVA, and we will publish a revised annual figure based on our standard methodology when the necessary data is available.
Estimates for 2020
Using our interim measure, we estimate[footnote 2] that:
- In 2020, GVA by DCMS sectors (excluding Civil Society and Tourism) was £179.6 billion, 9.7% lower in real terms than in 2019, a slightly larger fall than for the UK economy as a whole (-9.2%).
- Prior to 2020, DCMS sector GVA grew faster than the UK economy as a whole, increasing by 25.4% in real terms between 2011 and 2019 compared to 15.9% for the UK economy.
The DCMS sector (excluding Civil Society and Tourism) GVA growth between 2011 and 2020 was primarily due to growth in the Creative Industries and the Digital sector.
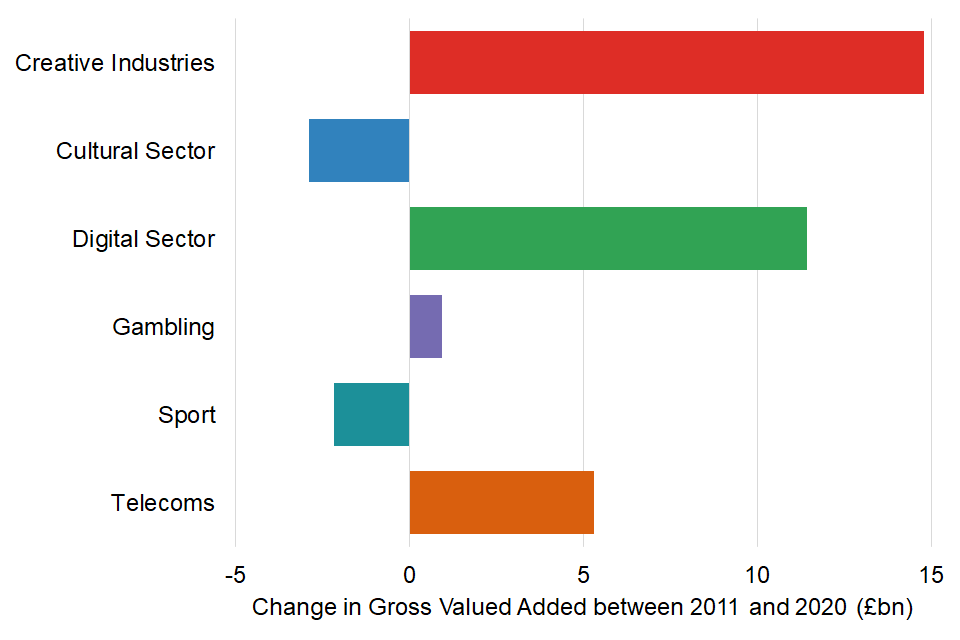
Figure 2: Change in DCMS and sectors (excl. Civil Society and Tourism) from 2011 to 2020
5.2 Employment
Latest estimates - year to June 2021
We publish annual employment figures on a rolling quarterly basis. The latest published employment estimates cover the period July 2020 to June 2021, and show that the number of filled jobs in the DCMS sectors (excluding Tourism) was 4.2 million.
The last decade (calendar years) - 2011 to 2020
This publication includes a re-release of calendar year employment estimates for 2011 to 2020. It updates and develops aspects of the back series and provides a single, coherent, set of reference tables for users.
The number of filled jobs in the DCMS sectors (excluding Tourism) was 4.1 million in 2020 an increase of 23.6% since 2011, primarily due to growth in the Creative Industries and the Digital sector.
In 2020, the DCMS sectors had a lower proportion of filled jobs held by women, people from ethnic minority groups, and people with disabilities than the UK average. The proportion of DCMS sector (excluding Tourism) jobs held by people from ethnic minority groups, and people with disabilities, increased in line with the general UK workforce between 2011 and 2020, however the proportion of filled jobs held by women decreased.
Socio-economic background and social mobility
In addition to our standard range of demographic breakdowns, we have published analysis of filled jobs by socio-economic background.
In 2020 people from more advantaged backgrounds held the largest share of filled jobs in the DCMS sectors (54.5%). People from less advantaged backgrounds and unknown backgrounds held 25.1% and 20.4% of the sector’s filled jobs, respectively. In 2020, the DCMS sectors had a larger proportion of filled jobs taken by those from a more advantaged background than the UK average (46.8%).
Upward social mobility, defined here as the proportion of those in higher class occupations from less advantaged backgrounds, is lower in the DCMS sectors (23.2%) compared to the UK overall (26.5%). More detail on the relation between socio-economic background and current occupation is shown in figure 3.
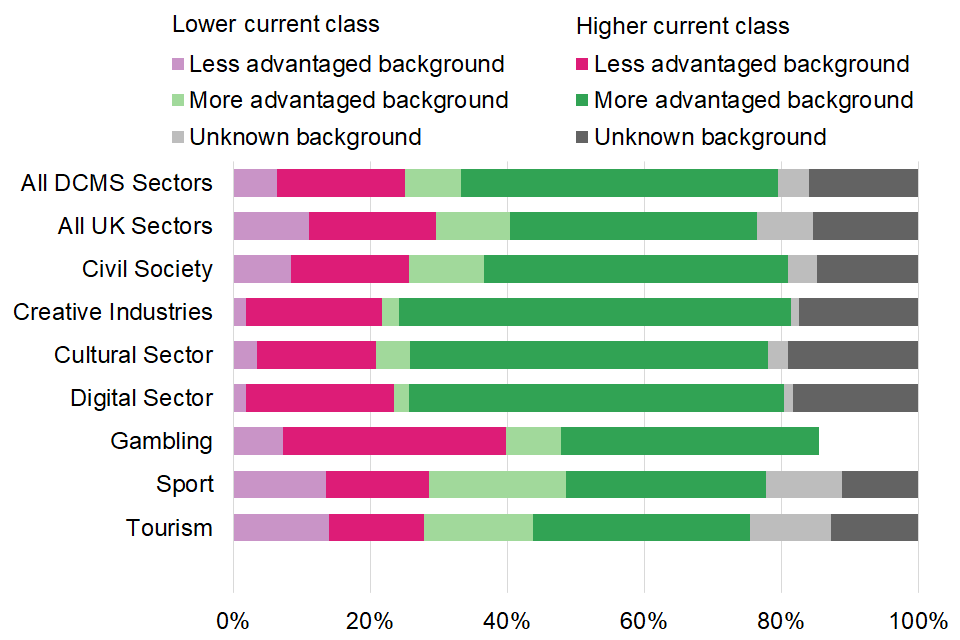
Figure 3: Proportion of jobs in DCMS sectors, and the UK, by current and former socio-economic status, 2020
Note: In 2020, a portion of the Gambling sector data and all of the Telecoms sector data have not been reported to protect the identities of respondents.
5.3 Earnings
We have updated our usual earnings estimates (calculated from ONS’s Annual Survey of Hours and Earnings) with provisional 2021 and final 2020 data. These show that:
- In 2021, median annual earnings in DCMS sectors (excl. Tourism) were £31,375, 19.4% higher than the UK average (£26,280).
-
Earnings for employees in DCMS sectors (excl. Tourism) grew by less (5.6%) in nominal terms between 2016 and 2021 than the UK as a whole (11.7%).
- On average, workers in DCMS sectors (excl.Tourism) who were on furlough in April 2021 earned £17,078, 53.1% less than those who were not furloughed (£36,388).
- Median annual gross pay for DCMS (excl. Tourism) was highest in London (£39,375), followed by the South East (£36,000), similar to the pattern for all UK sectors. It was lowest in Wales (£23,666) and the North East (£24,338).
- In 2021, the gender pay gap for DCMS sectors (excl. Tourism) was 22.6%, compared to 15.4% for the whole of the UK economy. In other words, women were paid 77p for every £1 earned by men in DCMS sectors, lower than the UK average of 85p.
We have also published a new set of earnings estimates based on Annual Population Survey data to 2020. These allow us to explore earnings for demographic groups not identifiable in the ASHE datasets. These new estimates showed that:
- Looking across the years between 2016 and 2020 the pattern of earnings by ethnicity in DCMS sectors is similar to the UK as a whole; employees in the ‘Asian/Asian British’ ethnic group are estimated to have the highest earnings on average, and employees in the ‘Black/ African/Caribbean/Black British’ group were estimated to have the lowest. There is low confidence in some of the estimates due to small sample sizes. For this reason we have only provided summaries of earnings by ethnicity for the two largest DCMS sectors: Creative Industries, and the Digital sector.
- Disabled employees in DCMS sectors earned £12.66 per hour on average, 15.6% less than non-disabled workers (£15.00). This was a larger difference than for the UK as a whole (-13.6%).
Productivity
We have produced this experimental measure for 2019 because this was the latest year for which data were available whilst the measure was being developed. We welcome user feedback.
In 2019, output per filled job in the DCMS sectors (excluding Civil Society) was £64,200, above the UK average (£58,100). The sectors with the highest output per filled job were Telecoms (£156,900), Digital sector (£93,300) and Gambling (£89,200). The sector with the lowest output per filled job was the Sport sector (£25,900).
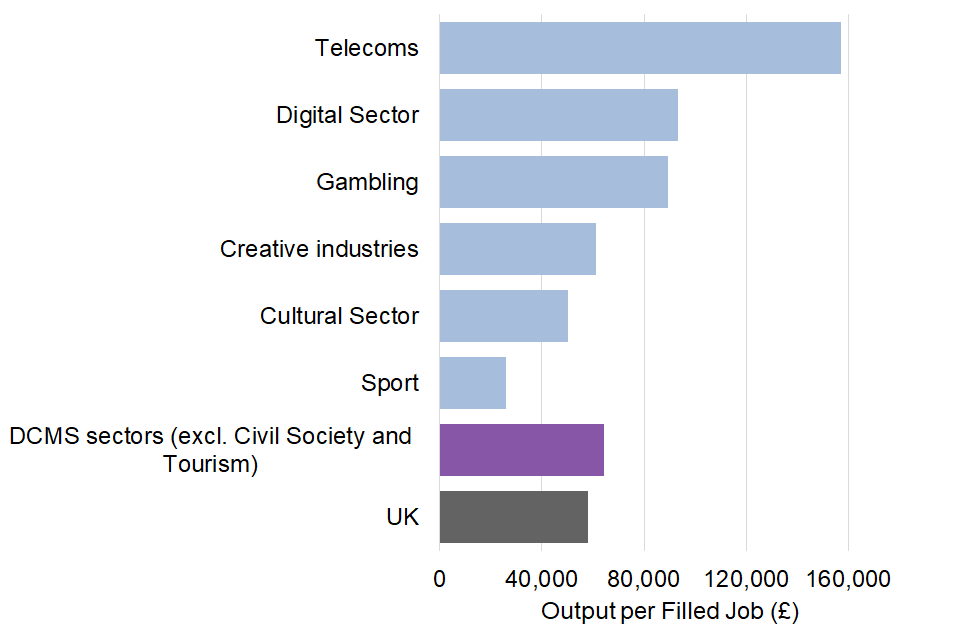
Figure 4: Output per filled job (£) in each of the DCMS sectors (excluding Civil Society and Tourism), and the UK, 2019
6. Creative Industries
The Creative Industries consists of all industries that match the definition in the government’s 2001 Creative Industries Mapping Document. Specifically, “those industries which have their origin in individual creativity, skill and talent and which have a potential for wealth and job creation through the generation and exploitation of intellectual property”. A more detailed definition is available in the methodology document.
According to this definition, the following sub sectors are included: ‘Crafts’, ‘Film, TV, video and photography’, ‘IT, software and computer services’, ‘publishing’, ‘Museums, galleries and libraries and Music’, ‘performing and visual arts’.
6.1 Gross value added (GVA)
Latest estimate - leading indicator
We have published monthly estimates of the GVA in DCMS sectors (excl Tourism and Civil Society) up to September 2021. These suggest that monthly GVA for the Creative Industries in September 2021:
- was 4.8% larger compared to January 2021, primarily due to the ‘Music, performing and visual arts’ and ‘Advertising’ subsectors, which grew by 47.8% and 11.9% respectively
- was still 3.9% smaller than in February 2020 (the last month unaffected by pandemic measures).
Annual measure for 2020
The leading indicator is more timely but less robust than our annual estimate, for which the latest available data is 2019. We typically publish our annual GVA estimate towards the end of the following year, however we are unable to do so for 2020 as release of the underlying data has been postponed to summer 2022. Instead, for this release, we have constructed an interim measure based on the monthly GVA, and we will publish a revised annual figure based on our standard methodology when the necessary data is available.
Estimates for 2020
Using our interim measure, we estimate[footnote 2] that:
- In 2020, GVA by the Creative Industries was £95.2 billion, 11.6% lower in real terms than in 2019, a slightly larger fall than for the UK economy as a whole (-9.2%).
- Prior to 2020, GVA by the Creative Industries grew faster than GVA by the UK economy as a whole, increasing by 41.4% in real terms between 2011 and 2019 compared to 15.9% for the UK economy.

Figure 5: Index of Gross Value Added for Creative Industries, DCMS sectors and the UK from 2011 to 2020 Base year = 2016
The break between 2019 and 2020 distinguishes between values taken from the DCMS annual GVA publication, and those derived from the DCMS monthly GVA estimates, with both series initially indexed to 2019 to remove any systematic differences in the absolute value of the GVA.
The main driver of this change was the ‘IT, software and computer services’ subsector and to a lesser extent the ‘Advertising’ subsector, which accounted for 68.2% and 17.4% respectively of the growth in this sector between 2011 and 2020.
6.2 Employment
Latest estimates - year to June 2021
We publish annual employment figures on a rolling quarterly basis. The latest published employment estimates cover the period July 2020 to June 2021, and show that the number of filled jobs in the Creative industries was 2.3 million.
The last decade (calendar years) - 2011 to 2020
This publication includes a re-release of calendar year employment estimates for 2011 to 2020. It updates and develops aspects of the back series and provides a single, coherent, set of reference tables for users.
The number of filled jobs in the Creative Industries was 2.2 million in 2020, an increase of 42.2% compared to 2011, predominantly due to growth in the ‘IT, software and computer services’ industry.
In 2020, the Creative Industries had lower proportions of filled jobs held by women, people with disabilities, and people from ethnic minorities, compared to the UK average. The proportion of Creative Industry jobs filled by people from ethnic minority groups, and people with disabilities, increased in line with the general UK workforce between 2011 and 2020, however the proportion of filled jobs held by women decreased.
Socio-economic background and social mobility
In addition to our standard range of demographic breakdowns, we have published analysis of filled jobs by socio-economic background.
In 2020, people from more advantaged backgrounds held the largest share of filled jobs in the Creative Industries (59.7%), with people from less advantaged backgrounds and unknown backgrounds holding the remaining 21.7% and 18.6%, respectively. This is a higher proportion of workers from a more advantaged background compared to the UK overall (47%) and the DCMS sector average (54.4%).
In 2020, the Creative industries had the largest proportion of filled jobs occupied by people from a more advantaged socio-economic background of any DCMS sector.
Upward social mobility, defined here as the proportion of those in higher class occupations from less advantaged backgrounds, is lower in the Creative industries (21.1%) compared to all UK sectors (26.5%) and all DCMS sectors (23.2%).
Earnings
We have updated our usual earnings estimates (calculated from ONS’s Annual Survey of Hours and Earnings) with provisional 2021 and final 2020 data. These show that:
- In 2021, median annual earnings in the Creative Industries were £35,000. This was 11.6% higher than the DCMS sector (excl. Tourism) average (£31,375) and 33.2% higher than the UK average (£26,280).
-
Earnings in the Creative Industries grew more slowly in nominal terms between 2016 and 2021 (5.4%) than both DCMS sectors overall (5.6%) and the UK (11.7%).
- On average, workers in the Creative Industries who were on furlough in April 2021 earned £22,384, 40.3% less than those who were not furloughed (£37,500).
-
Median annual gross pay in the Creative Industries was highest in London (£40,065), followed by the South East (£38,432) and the North West (£32,931). It was lowest in Wales (£25,842) and the East Midlands (£26,640).
- In 2021, the gender pay gap for Creative Industries was 19.7%, compared to 15.4% for the whole of the UK economy. In other words, women were paid 80p for every £1 earned by men in Creative Industries, compared to the UK average of 85p.
We have also published a new set of earnings estimates based on Annual Population Survey data to 2020. These allow us to explore earnings for demographic groups not identifiable in the ASHE datasets. These new estimates show that:
- although sample sizes for individual years are relatively low and the estimates variable, there are some persistent trends in average earnings by ethnic group for employees in the Creative Industries. Between 2016 and 2020, employees in the ‘Asian/Asian British’ ethnic group tended to have the highest average hourly wage, whereas those in the ‘Black/ African/Caribbean/Black British’ tended to have the lowest.
- disabled employees in Creative Industries earned £15.18 per hour on average, 21.7% less than non-disabled workers (£19.38). This was a larger difference than for the UK as a whole (-13.6%) or DCMS sectors (-15.6%).
Productivity
We have produced this experimental measure for 2019 because this was the latest year for which data were available whilst the measure was being developed. We welcome user feedback.
In 2019, output per filled job in the Creative Industries was £61,100, above the UK average (£58,100), but below the DCMS sector (excl. Civil Society and Tourism) average (£64,200).
The subsectors with the highest output per filled job were ‘Advertising and marketing’ (£100,200) and ‘Film, TV, video, radio and photography’ (£89,000). The subsectors with the lowest output per filled job were ‘Museums, galleries and libraries’ (£18,100) and ‘Design and designer fashion’ (£26,200).
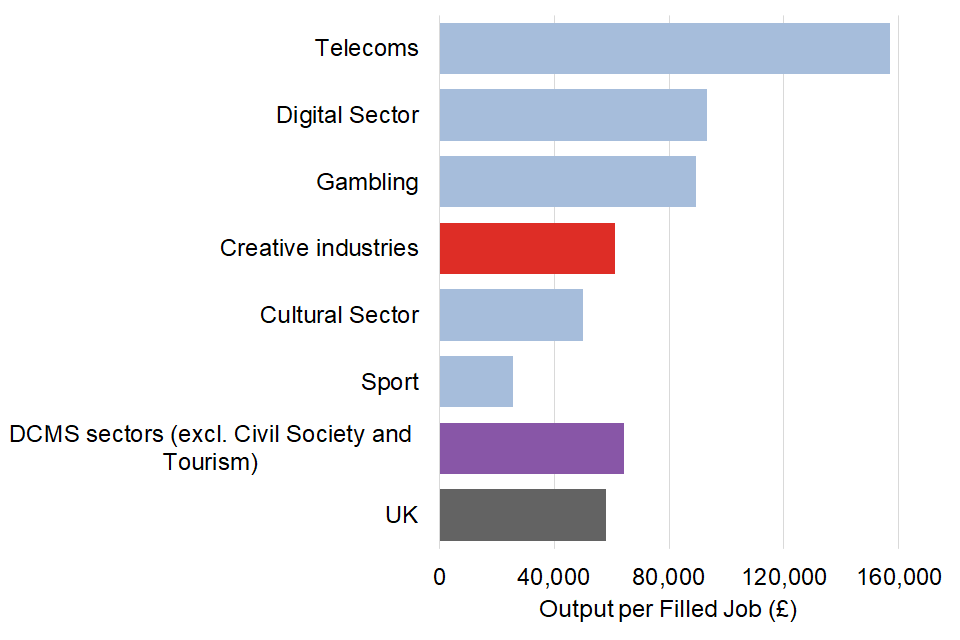
Figure 6: Output per filled job (£) in the Creative Industries sector, all DCMS sectors (excluding Civil Society and Tourism), and the UK, 2019
6.3 Cultural Sector
The DCMS Economic Estimates definition of the Cultural sector is industries centred on a cultural object. The industrial classes in this definition were agreed following consultation and are listed in the tables published alongside this release.
The Cultural sector includes the following subsectors: ‘Arts’, ‘Film, TV and Music’, ‘Radio’, ‘Photography, Crafts, Museums and Galleries’, ‘Library and archives’, ‘Cultural education’, ‘Operation of historical sites and similar visitor attractions’.
6.4 Gross Value Added (GVA)
Latest estimate - leading indicator
We have published monthly estimates of the GVA in DCMS sectors (excluding Tourism and Civil Society) up to September 2021. These suggest that Cultural sector monthly GVA in September 2021:
- was 11.8% larger compared to January 2021, primarily due to the ‘Arts’ subsector which grew by 73.1%.
- was still 8.0% smaller than in February 2020 (the last month unaffected by pandemic measures).
Annual measure for 2020
The leading indicator is more timely but less robust than our annual estimate, for which the latest available data is 2019. We typically publish our annual GVA estimate towards the end of the following year, however we are unable to do so for 2020 as release of the underlying data has been postponed to summer 2022. Instead, for this release, we have constructed an interim measure based on the monthly GVA, and we will publish a revised annual figure based on our standard methodology when the necessary data is available.
Estimates for 2020
Using our interim measure, we estimate[footnote 2] that:
- In 2020, GVA by the Cultural sector was £24.1 billion, 22.8% lower in real terms than in 2019, a larger fall than for the UK economy as a whole (-9.2%).
- Prior to 2020, GVA by the Cultural sector grew faster than the UK economy as a whole, increasing by 26.6% in real terms between 2011 and 2019 compared to 15.9% for the UK economy.
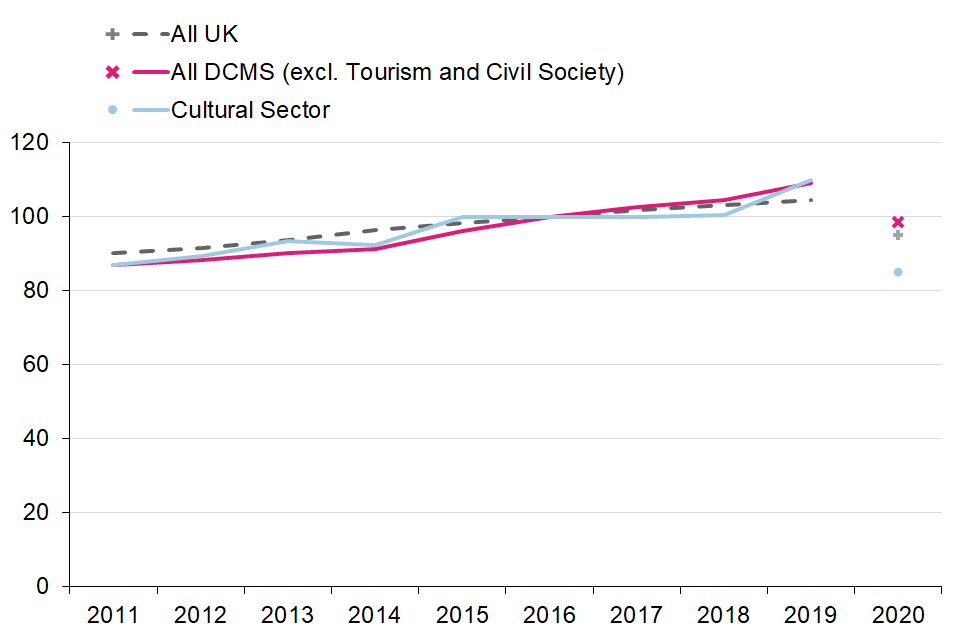
Figure 7: Index of Gross Value Added for the Cultural sector, DCMS s and the UK Base year = 2016
The break between 2019 and 2020 distinguishes between values taken from the DCMS annual GVA publication, and those derived from the DCMS monthly GVA estimates, with both series initially indexed to 2019 to remove any systematic differences in the absolute value of the GVA.
Employment Latest estimates - year to June 2021 We publish annual employment figures on a rolling quarterly basis. The latest published employment estimates cover the period July 2020 to June 2021, and show that the number of filled jobs in the Cultural sector was 0.7 million.
The last decade (calendar years) - 2011 to 2020 This publication includes a re-release of calendar year employment estimates for 2011 to 2020. It updates and develops aspects of the back series and provides a single, coherent, set of reference tables for users.
The number of filled jobs in the Cultural sector was 0.7 million in 2020, a 28.7% increase since 2011, predominantly due to growth in the ‘Arts’ and ‘Film, TV and Music’ subsectors.
Compared to the UK average, the Cultural sector had a high proportion of filled jobs held by disabled people, a similar proportion held by women, and a lower proportion held by people from ethnic minority groups in 2020. The proportion of Cultural sector jobs held by women did not change between 2011 and 2020, however the proportions held by people from minority ethnic groups, and by people with disabilities, increased.
Socio-economic background and social mobility
In addition to our standard range of demographic breakdowns, we have published analysis of filled jobs by socio-economic background.
In 2020, people from more advantaged backgrounds held the largest share of filled jobs in the Cultural (57.2%), with people from less advantaged backgrounds and unknown backgrounds holding 20.8% and 22.0% of the sector’s filled jobs, respectively. This is a higher proportion of workers from a more advantaged background compared to the UK overall (46.8%) and the DCMS sector average (54.5%).
Upward social mobility, defined here as the proportion of those in higher class occupations from less advantaged backgrounds, is lower in the Cultural sector (19.6%) compared to the UK overall (26.5%) and all DCMS sectors (23.2%).
Earnings
We have updated our usual earnings estimates (calculated from ONS’s Annual Survey of Hours and Earnings) with provisional 2021 and final 2020 data. These show that:
- In 2021, median annual earnings in the Cultural sector were £27,283. This was 13.0% lower than DCMS overall (£31,375) and 3.8% higher than the UK as a whole (£26,280).
-
Earnings by employees in the Cultural sector fell by 4.2% in nominal terms between 2016 and 2021 whilst those for the UK as a whole rose by 11.7%.
- On average, workers in the Cultural sector who were on furlough in April 2021 earned £18,000, 43.8% less than those who were not furloughed (£32,018).
- Median annual gross pay in the Cultural was highest in London (£36,400), followed by the West Midlands (£23,806). It was lowest in Wales (£13,800) and the North West (£15,305).
- In 2021, the gender pay gap for the Cultural was 11.1%, compared to 15.4% for the whole of the UK economy. In other words, women were paid 89p for every £1 earned by men in the Cultural sector, compared to the UK average of 85p.
We have also published a new set of earnings estimates based on Annual Population Survey data to 2020. These allow us to explore earnings for demographic groups not identifiable in the ASHE datasets. These new estimates showed that disabled employees in the Cultural sector earned £11.13 per hour on average, 29.9% less than non-disabled workers (£15.88). This was a larger difference than for the UK as a whole (-13.6%) or DCMS sectors (-15.6%).
Productivity
We have produced this experimental measure for 2019 because this was the latest year for which data were available whilst the measure was being developed. We welcome user feedback.
In 2019 output per filled job in the Cultural sector was £50,200, lower than the UK average (£58,100), and lower than the DCMS sector (excl. Civil Society and Tourism) average (£64,200).
The subsectors with the highest output per filled job were ‘Radio’ (£167,100) and ‘Film, TV and Music (£102,700). The subsectors with the lowest output per filled job were ‘Cultural Education’ (£7,800) and ‘Library and archives’ (£11,300). The difference between the subsectors with the highest and lowest output per filled job was £159,300.
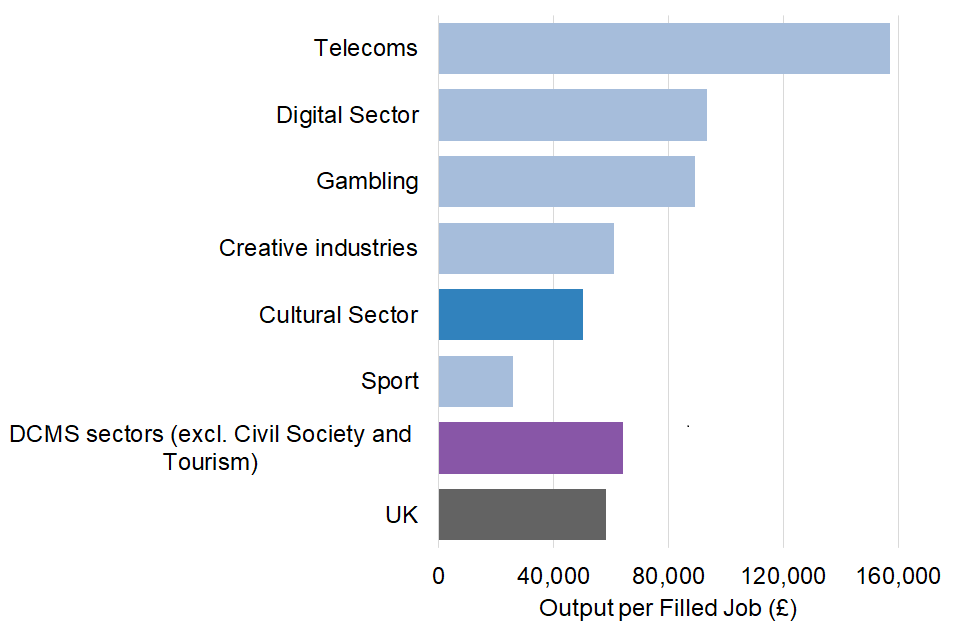
Figure 8: Output per filled job (£) in the Cultural sector, all DCMS sectors (excluding Civil Society and Tourism), and the UK, 2019
7. Digital Sector
The definition of the Digital sector used here is based on the OECD definition of the ‘information society’. This is a combination of the OECD definition for the “ICT sector” as well as including the definition of the “content media sector”. An outline of the SIC (Standard Industrial classification) codes included is available in the OECD Guide to Measuring the Information Society 2011.
According to this definition, the following sub sectors are included: ‘Manufacturing of electronics and computers’, ‘Wholesale of computers and electronics’, ‘Publishing (excluding translation and interpretation activities)’, ‘Software publishing’, ‘Film, TV, video, radio and music’, ‘Telecommunications’, ‘Computer programming, consultancy and related activities’, ‘Information service activities’ and ‘Repair of computers and communication equipment’.
7.1 Gross Value Added (GVA)
Latest estimate - leading indicator
We have published monthly estimates of the GVA in DCMS sectors (excl Tourism and Civil Society) up to September 2021. These suggest that Digital sector monthly GVA in September 2021:
- was 0.7% smaller compared to January 2021, primarily due to a combination of the 5.0% decrease in the ‘Film, TV, video, radio and music’ subsector and the 2.0% increase in the ‘Telecommunications’ subsector
- was still 3.5% smaller than in February 2020 (the last month unaffected by pandemic measures).
Annual measure for 2020
The leading indicator is more timely but less robust than our annual estimate, for which the latest available data is 2019. We typically publish our annual GVA estimate towards the end of the following year, however we are unable to do so for 2020 as release of the underlying data has been postponed to summer 2022. Instead, for this release, we have constructed an interim measure based on the monthly GVA, and we will publish a revised annual figure based on our standard methodology when the necessary data is available.
Estimates for 2020
Using our interim measure, we estimate[footnote 2] that:
- In 2020, GVA by the Digital sector was £131.4 billion, 5.5% lower in real terms than in 2019, a smaller fall than for the UK economy as a whole (-9.2%).
- Prior to 2020, GVA by the Digital sector grew faster than the UK economy as a whole, increasing by 23.0% in real terms between 2011 and 2019 compared to 15.9% for the UK economy.
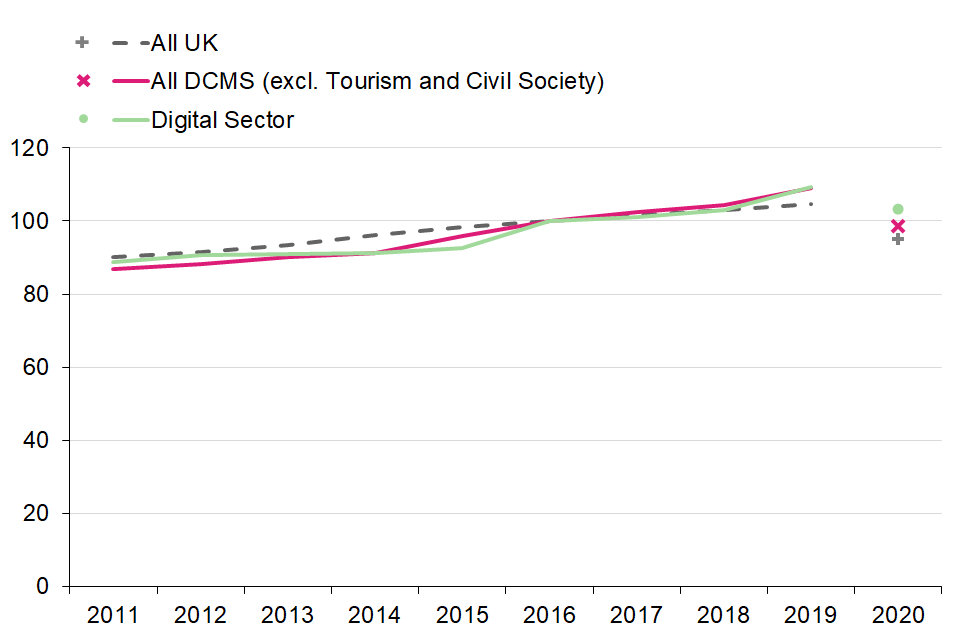
Figure 9: Index of Gross Value Added for the Digital sector, DCMS sectors and the UK Base year = 2016
The break between 2019 and 2020 distinguishes between values taken from the DCMS annual GVA publication, and those derived from the DCMS monthly GVA estimates, with both series initially indexed to 2019 to remove any systematic differences in the absolute value of the GVA.
The main driver of this change was the ‘Computer programming, consultancy and related activities’ subsector, which accounted for 64.7% of the growth in this sector between 2011 and 2020.
7.2 Employment
Latest estimates - year to June 2021
We publish annual employment figures on a rolling quarterly basis. The latest published employment estimates cover the period July 2020 to June 2021. They show that the number of filled jobs in the Digital sector was 1.8 million.
The last decade (calendar years) - 2011 to 2020
This publication includes a re-release of calendar year employment estimates for 2011 to 2020. It updates and develops aspects of the back series and provides a single, coherent, set of reference tables for users.
The number of filled jobs in the Digital sector was 1.7 million in 2020, a 31.5% increase since 2011, predominantly due to growth in the ‘Computer programming, consultancy and related activities’ industries, which accounted for the majority (52.2%) of the Digital sector’s filled jobs in 2020.
In 2020, the Digital sector had the joint lowest proportion of filled jobs held by women of any DCMS sector (with Telecoms, which sits wholly within the Digital sector). It also had fewer filled jobs held by people with a disability than the UK average, but had the highest proportion of jobs held by people from ethnic minority groups. The proportion of filled jobs in the Digital sector held by people from ethnic minority groups grew faster between 2011 and 2020 than in the wider UK economy, the proportion held by people with disabilities increased by slightly less than the UK average, and the proportion held by women remained the same.
Socio-economic background and social mobility
In addition to our standard range of demographic breakdowns, we have published analysis of filled jobs by socio-economic background.
In 2020 people from more advantaged backgrounds held the largest share of filled jobs in the Digital sector (57.0%). People from less advantaged backgrounds and unknown backgrounds held 23.4% and 19.6% of the sector’s filled jobs, respectively.
In 2020, the Digital sector had a larger proportion of filled jobs held by those from a more advantaged background than the UK average (46.8%) and the DCMS sector average (54.5%).
Upward social mobility, defined here as the proportion of those in higher class occupations from less advantaged backgrounds, is lower in the Digital sector (22.8%) compared to the UK overall (26.5%) and is similar to the all DCMS sector average (23.2%).
7.3 Earnings
We have updated our usual earnings estimates (calculated from ONS’s Annual Survey of Hours and Earnings) with provisional 2021 and final 2020 data. These show that:
- In 2021, median annual earnings in the Digital sector were £37,925. This was 20.9% higher than the DCMS sector average (£31,375) and 44.3% higher than the UK average (£26,280).
-
Earnings in the Digital sector grew faster in nominal terms between 2016 and 2021 (7.5%) than the DCMS sector average (5.6%) but more slowly than the UK as a whole (11.7%).
- On average, workers in the Digital sector who were on furlough in April 2021 earned £22,370, 43.3% less than those who were not furloughed (£39,476).
- Median annual gross pay in the Digital sector was highest in London (£48,000), followed by the South East (£42,610). It was lowest in the East Midlands (£28,620) and the North East (£29,915).
- In 2021, the gender pay gap for the Digital sector was 21.9%, compared to 15.4% for the whole UK economy. In other words, women were paid 78p for every £1 earned by men in the Digital sector, compared to the UK average of 85p.
We have also published a new set of earnings estimates based on Annual Population Survey data to 2020. These allow us to explore earnings for demographic groups not identifiable in the ASHE datasets. These new estimates show that:
- although sample sizes for individual years are relatively low and the estimates variable, there are some persistent trends in average earnings by ethnic group for employees in the Digital sector. Between 2016 and 2020, employees in the ‘Other’ ethnic group tended to have the highest average hourly wage, whereas those in the ‘Black/ African/Caribbean/Black British’ tended to have the lowest.
- disabled employees in the Digital sector earned £15.95 per hour on average, 22.6% less than non-disabled workers (£20.60), this was a larger difference than for the UK as a whole (-13.6%) or DCMS sectors (-15.6%).
7.4 Productivity
We have produced this experimental measure for 2019 because this was the latest year for which data were available whilst the measure was being developed. We welcome user feedback.
In 2019 output per filled job in the Digital sector was £93,300, above the UK average (£58,100) and the DCMS sector (excl. Civil Society and Tourism) average (£64,200).
The subsectors with the highest output per filled job were ‘Telecoms’ (£156,900) and ‘Information service activities’ (£127,800). The subsectors with the lowest output per filled job were ‘Wholesale of computers and electronics’ (£70,700) and ‘Computer programming, consultancy and related activities’ (£72,500). The Digital subsector with the lowest output per job was still £12,600 greater than the UK average.
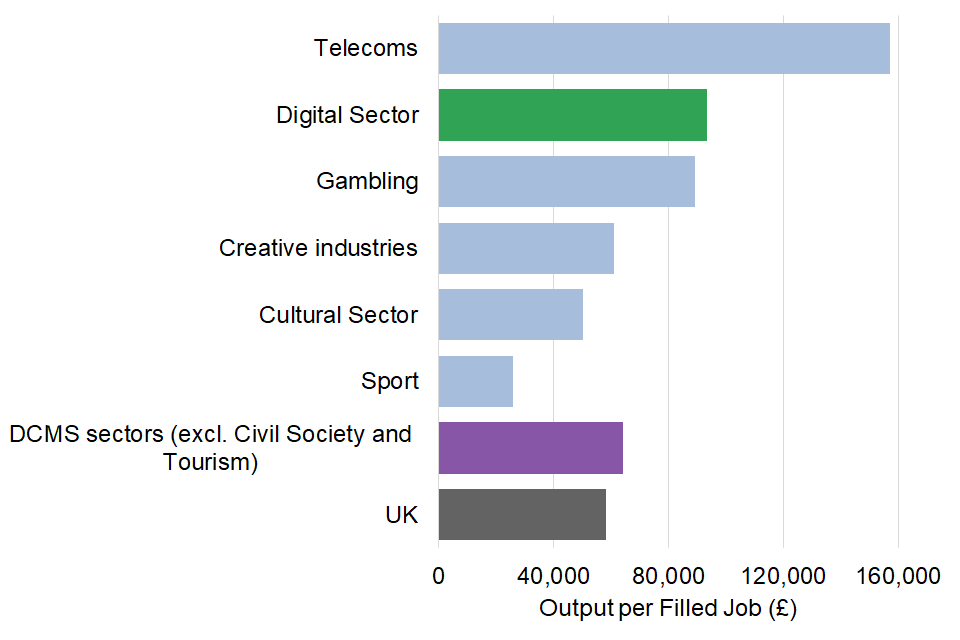
Figure 10: Output per filled job (£) in the Digital sector, all DCMS sectors (excluding Civil Society and Tourism), and the UK, 2019
8. Gambling
The definition of gambling used in DCMS Sector Economic Estimates is consistent with the internationally agreed definition; division 92 of the standard industrial classification (‘Gambling and betting activities’).
8.1 Gross Value Added (GVA)
Latest estimate - leading indicator
We have published monthly estimates of the GVA in DCMS sectors (excl. Tourism and Civil Society) up to September 2021. These suggest that monthly GVA for the Gambling sector in September 2021:
- was 0.4% larger than in January 2021
- was 1.3% smaller than in February 2020 (the last month unaffected by pandemic measures) decreased in March and April 2020, but had returned to approximately pre-pandemic levels by August 2020 and remained relatively stable at this level since.
Annual measure for 2020
The leading indicator is more timely but less robust than our annual estimate, for which the latest available data is 2019. We typically publish our annual GVA estimate towards the end of the following year, however we are unable to do so for 2020 as release of the underlying data has been postponed to summer 2022. Instead, for this release, we have constructed an interim measure based on the monthly GVA, and we will publish a revised annual figure based on our standard methodology when the necessary data is available.
Estimates for 2020
Using our interim measure, we estimate[footnote 2] that:
- In 2020, GVA by the Gambling sector was £7.7 billion, 7.2% lower in real terms than in 2019, a smaller fall than for the UK economy as a whole (-9.2%).
- Prior to 2020, GVA by the Gambling sector grew faster than the UK economy as a whole, increasing by 19.1% in real terms between 2011 and 2019 compared to 15.9% for the UK economy.
- As Gambling is a small sector, GVA estimates will be based on responses from a relatively small sample of businesses. This means the impact of any one particular business on the overall result is much larger, so estimates tend to be more variable between years.
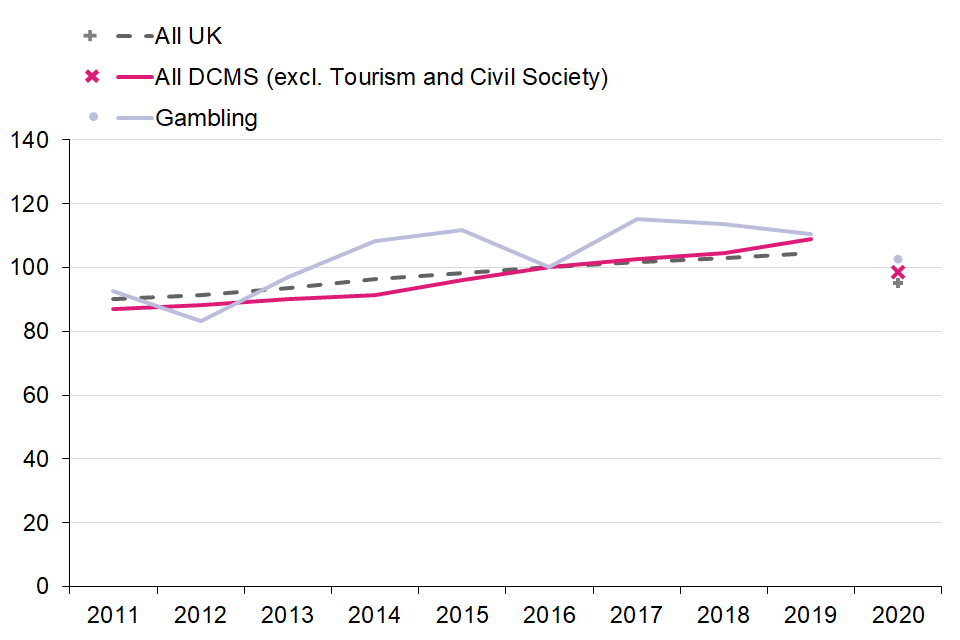
Figure 11: Index of Gross Value Added for the Gambling sector, DCMS sectors and the UK Base year = 2016
The break between 2019 and 2020 distinguishes between values taken from the DCMS annual GVA publication, and those derived from the DCMS monthly GVA estimates, with both series initially indexed to 2019 to remove any systematic differences in the absolute value of the GVA.
8.2 Employment
Latest estimates - year to June 2021
We publish annual employment figures on a rolling quarterly basis. The latest published employment estimates cover the period July 2020 to June 2021. They show that the number of filled jobs in the Gambling sector was 0.1 million.
The last decade (calendar years) - 2011 to 2020
This publication includes a re-release of calendar year employment estimates for 2011 to 2020. It updates and develops aspects of the back series and provides a single, coherent, set of reference tables for users.
The number of filled jobs in the Gambling sector was 0.1 million in 2020, a decrease of 18.9% compared to 2011.
In 2020, the Gambling sector had a lower proportion of filled jobs held by women, and people from ethnic minority groups, than the UK average, but had a substantially higher proportion of jobs held by disabled people. This followed an appreciable increase in the proportion of filled jobs in the Gambling sector held by people with disabilities between 2011 and 2020. We observe a substantial decrease in the proportion of filled jobs in the Gambling sector held by women over the same period, and a smaller decrease in the proportion held by people from ethnic minority groups. Estimates like these, which are based on survey data, can have a high variation between years for small sectors like Gambling due to the effects of a small sample size.
Socio-economic background and social mobility
In addition to our standard range of demographic breakdowns, we have published analysis of filled jobs by socio-economic background.
In 2020 45.7% of filled jobs in the Gambling sector were held by people from more advantaged backgrounds, while people from less advantaged backgrounds and unknown backgrounds held 39.7% and 14.5% of the sector’s filled jobs, respectively. This was lower than the proportion of filled jobs held by those from a more advantaged background in the UK overall (46.8%) and the DCMS sector average (54.5%).
Upward social mobility, defined here as the proportion of those in higher class occupations from less advantaged backgrounds, has not been reported in the Gambling sector in order to protect the identities of respondents.
Earnings
We have updated our usual earnings estimates (calculated from ONS’s Annual Survey of Hours and Earnings) with provisional 2021 and final 2020 data. These show that:
- In 2021, median annual earnings in the Gambling sector were £20,229. This was 35.5% lower than DCMS (excluding Tourism) (£31,375) and 23.0% lower than the UK as a whole (£26,280).
-
Earnings in the Gambling sector in 2021 were 18.9% higher than in 2016 (£17,012), whereas earnings grew in nominal terms between 2016 and 2021 in both DCMS sectors overall (5.6%) and the UK (11.7%).
- On average, workers in the Gambling sector who were on furlough in April 2021 earned £17,666, 51.4% less than those who were not furloughed (£36,345).
- Median annual gross pay in the Gambling sector was highest in the East of England (£40,442), followed by the West Midlands (£29,340). It was lowest in the South West (£16,085) and the North West (£16,817).
- In 2021, the gender pay gap for the Gambling sector was 5.0%, compared to 15.4% for the whole of the UK economy. In other words, women were paid 95p for every £1 earned by men in the Gambling sector, the smallest pay gap of any DCMS sector and much lower than the UK average of 85p.
We have also published a new set of earnings estimates based on Annual Population Survey data to 2020. These allow us to explore earnings for demographic groups not identifiable in the ASHE datasets. These new estimates showed that disabled employees in Gambling earned £8.63 per hour on average, 19.7% less than non-disabled workers (£10.75). This was a larger difference than for the UK as a whole (-13.6%) or DCMS sectors (-15.6%).
Productivity
We have produced this experimental measure for 2019 because this was the latest year for which data were available whilst the measure was being developed. We welcome user feedback.
In 2019 output per filled job in the Gambling sector was £89,200, above the UK average (£58,100), and the DCMS sector (excl. Civil Society and Tourism) average (£64,200).
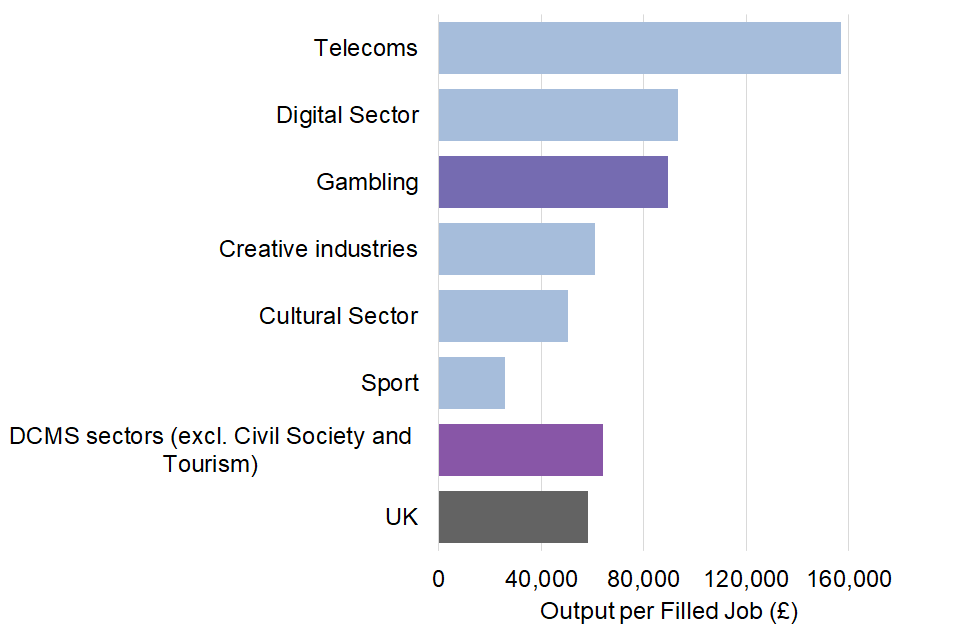
Figure 12: Output per filled job (£) in the Gambling sector, all other DCMS sectors (excluding Civil Society and Tourism), and the UK, 2019
9. Sport
This report uses the EU agreed core/statistical Vilnius definition of sport as the definition of the Sport sector. This incorporates only those industries which are predominately sport. For the full list, please see the tables published alongside this report.
9.1 Gross Value Added (GVA)
Latest estimate - leading indicator
We have published monthly estimates of the GVA in DCMS sectors (excl. Tourism and Civil Society) up to September 2021. These suggest that Sport sector monthly GVA in September 2021:
- was 45.1% larger than in January 2021. Sport was the DCMS sector with the lowest monthly GVA in January 2021 compared to before the pandemic, so this largely, but not wholly, represents a return towards the baseline rather than additional growth.
- was 2.2% larger than in February 2020 (the last month unaffected by pandemic measures).
Annual measure for 2020
The leading indicator is more timely but less robust than our annual estimate, for which the latest available data is 2019. We typically publish our annual GVA estimate towards the end of the following year, however we are unable to do so for 2020 as release of the underlying data has been postponed to summer 2022. Instead, for this release, we have constructed an interim measure based on the monthly GVA, and we will publish a revised annual figure based on our standard methodology when the necessary data is available.
Estimates for 2020
Using our interim measure, we estimate[footnote 2] that:
- In 2020, GVA by the Sport sector was £12.3 billion, 23.8% lower in real terms than in 2019, a larger fall than for the UK economy as a whole (-9.2%).
- Prior to 2020, GVA by the Sport sector grew slightly slower than the UK economy as a whole, increasing by 14.7% in real terms between 2011 and 2019 compared to 15.9% for the UK economy. GVA for the Sport sector declined between 2011 and 2013, but grew more rapidly than the wider UK economy thereafter.
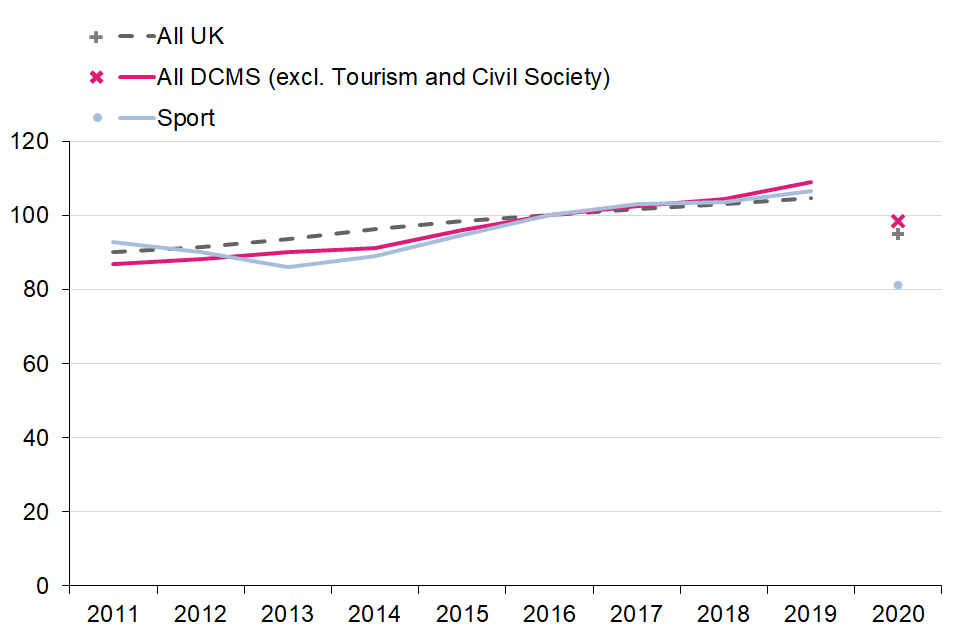
Figure 13: Index of Gross Value Added for the Sport sector, DCMS sectors and the UK Base year = 2016
The break between 2019 and 2020 distinguishes between values taken from the DCMS annual GVA publication, and those derived from the DCMS monthly GVA estimates, with both series initially indexed to 2019 to remove any systematic differences in the absolute value of the GVA.
9.2 Employment
Latest estimates
We publish annual employment figures on a rolling quarterly basis. The latest published employment estimates cover the period July 2020 to June 2021. They show that the number of filled jobs in the Sport sector was 0.5 million.
The last decade (calendar years) - 2011 to 2020
This publication includes a re-release of calendar year employment estimates for 2011 to 2020. It updates and develops aspects of the back series and provides a single, coherent, set of reference tables for users.
The number of filled jobs in the Sport sector was 0.5 million in 2020, an increase of 8.3% since 2011, predominantly due to growth in the ‘Sports and recreation education’ industry. Compared to the UK average, people working in the Sport sector in 2020 were less likely to be from an ethnic minority group, disabled, or female. The proportion of filled jobs in the Sport sector held by people from ethnic minority groups increased between 2011 and 2020, however the proportions held by women, and by people with disabilities, decreased.
Socio-economic background and social mobility
In addition to our standard range of demographic breakdowns, we have published analysis of filled jobs by socio-economic background.
In 2020, 49.2% of filled jobs in the Sport sector were held by people from more advantaged backgrounds. People from less advantaged backgrounds and unknown backgrounds held 28.5% and 22.3% of the sector’s filled jobs, respectively. The proportion of filled jobs in the Sport sector held by those from a more advantaged background was higher than the UK average (46.8%) but lower than the DCMS sector average (54.5%).
Upward social mobility, defined here as the proportion of those in higher class occupations from less advantaged backgrounds, is greater in the Sport sector (27.0%) compared to the UK overall (26.5%) and all DCMS sectors (23.2%).
9.3 Earnings
We have updated our usual earnings estimates (calculated from ONS’s Annual Survey of Hours and Earnings) with provisional 2021 and final 2020 data. These show that:
- In 2021, median annual earnings in the Sport sector were £17,776. This was 43.3% lower than DCMS overall (£31,375) and 32.4% lower than the UK as a whole (£26,280).
-
Earnings in the Sport sector grew faster in nominal terms between 2016 and 2021 (18.1%) than both the DCMS sectors overall (5.6%) and the UK (11.7%).
- On average, workers in the Sport sector who were on furlough in April 2021 earned £11,056, 54.8% less than those who were not furloughed (£24,439).
- Median annual gross pay in the Sport sector was highest in London (£21,156), followed by Northern Ireland (£20,270). It was lowest in the North East (£11,816) and in Yorkshire and the Humber (£13,000).
- In 2021, the gender pay gap for the Sport sector was 10.8%, compared to 15.4% for the whole of the UK economy. In other words, women were paid 89p for every £1 earned by men in the Sport sector, compared to the UK average of 85p.
We have also published a new set of earnings estimates based on Annual Population Survey data to 2020. These allow us to explore earnings for demographic groups not identifiable in the ASHE datasets. These new estimates showed that disabled employees in Sport earned £8.80 per hour on average, 10.8% less than non-disabled workers (£9.86). This was a smaller difference than for the UK as a whole (-13.6%) or DCMS sectors (-15.6%).
9.4 Productivity
We have produced this experimental measure for 2019 because this was the latest year for which data were available whilst the measure was being developed. We welcome user feedback.
In 2019 output per filled job in the Sport sector was £25,900, far below the UK average (£58,100), and £38,300 below the DCMS sector (excl. Civil Society and Tourism) average (£64,200).
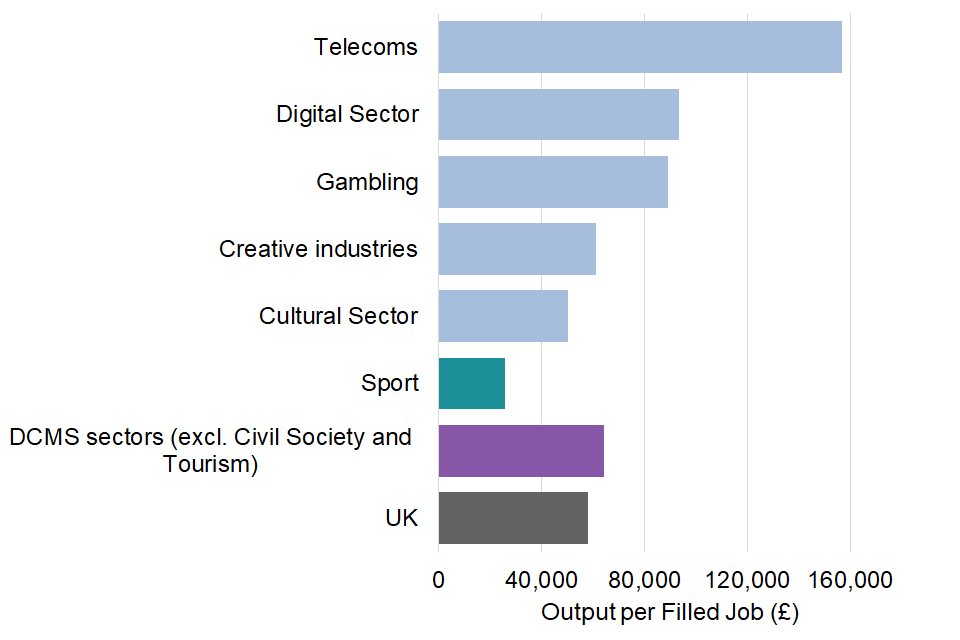
Figure 14: Output per filled job (£) in the Sport sector, all other DCMS sectors (excluding Civil Society and Tourism), and the UK, 2019
10. Telecoms
DCMS uses the internationally agreed definition of the Telecoms sector; divisions 61 of the standard industrial classification, Telecommunications. In addition to being reported as a sector on its own, Telecoms is also entirely included within the Digital sector as one of the subsectors.
10.1 Gross Value Added (GVA)
Latest estimate - leading indicator
We have published monthly estimates of the GVA in DCMS sectors (excl. Tourism and Civil Society) up to September 2021. These suggest that Telecoms sector monthly GVA in September 2021:
- was 2.0% larger than in January 2021
- was still 1.0% smaller than in February 2020 (the last month unaffected by pandemic measures).
Annual measure for 2020
The leading indicator is more timely but less robust than our annual estimate, for which the latest available data is 2019. We typically publish our annual GVA estimate towards the end of the following year, however we are unable to do so for 2020 as release of the underlying data has been postponed to summer 2022. Instead, for this release, we have constructed an interim measure based on the monthly GVA, and we will publish a revised annual figure based on our standard methodology when the necessary data is available.
Estimates for 2020
Using our interim measure, we estimate[footnote 2] that:
- In 2020, GVA by the Telecoms sector was £35.3 billion, 2.9% higher in real terms than in 2019. By comparison, GVA for the UK economy as a whole fell by 9.2% over the same period.
- Prior to 2020, GVA by the Telecoms sector grew slightly slower than GVA by the UK economy as a whole, increasing by 14.6% in real terms between 2011 and 2019 compared to 15.9% for the UK economy.

Figure 15: Index of Gross Value Added for the Telecoms sector, DCMS sectors and the UK Base year = 2016
The break between 2019 and 2020 distinguishes between values taken from the DCMS annual GVA publication, and those derived from the DCMS monthly GVA estimates, with both series initially indexed to 2019 to remove any systematic differences in the absolute value of the GVA.
10.2 Employment
Latest estimates
We publish annual employment figures on a rolling quarterly basis. The latest published employment estimates cover the period July 2020 to June 2021. They show that the number of filled jobs in the Telecoms sector was 0.2 million.
The last decade (calendar years) - 2011 to 2020
This publication includes a re-release of calendar year employment estimates for 2011 to 2020. It updates and develops aspects of the back series and provides a single, coherent, set of reference tables for users.
The number of filled jobs in the Telecoms sector was 0.2 million as of 2020, a 1.9% increase since 2011. The composition and size of the Telecoms sector has been relatively stable between 2011 and 2020; the largest difference has been a decrease of 6000 filled jobs in the ‘Wired telecommunications activities’ industry.
The Telecoms sector has the joint lowest proportion for filled jobs held by women, with the Digital sector, substantially below the UK average. In 2020, the proportion of jobs held by people with disabilities was slightly below the UK average, whilst the proportion of jobs held by people from ethnic minority groups was in line with the wider UK economy. The proportions of filled jobs in the Telecoms sector held by women, and by people from ethnic minority groups, were unchanged between 2011 and 2020, however the proportion held by people with disabilities increased.
Socio-economic background and social mobility
In addition to our standard range of demographic breakdowns, we have published analysis of filled jobs by socio-economic background.
In 2020 42.2% of filled jobs in the Telecoms sector were held by people from more advantaged backgrounds, while people from less advantaged backgrounds and unknown backgrounds held 28.6% and 29.3% of the sector’s filled jobs, respectively. This is lower than the of filled jobs held by those from a more advantaged background in the UK overall (46.8%) and the DCMS sector average (54.5%).
Upward social mobility is defined here as the proportion of those in higher class occupations from less advantaged backgrounds. This data has not been reported for the Telecoms sector in 2020 to protect respondents’ identities.
Earnings
We have updated our usual earnings estimates (calculated from ONS’s Annual Survey of Hours and Earnings) with provisional 2021 and final 2020 data. These show that:
- In 2021, median annual earnings in the Telecoms sector were £39,768. This was 26.8% higher than the DCMS average (£31,375) and 51.3% higher than the UK as a whole (£26,280).
-
Earnings by employees in the Telecoms sector grew faster in nominal terms (10.4%) between 2016 and 2021 than for DCMS sectors overall (5.6%), but slower than for the UK overall (11.7%).
- On average, workers in the Telecoms sector who were on furlough in April 2021 earned £22,370, 46.4% less than those who were not furloughed (£41,730).
-
Median annual gross pay in the Telecoms sector was highest in the South East (£55,403), followed by London (£44,327). It was lowest in the North East (£23,164) and Wales (£23,617).
- In 2021, the gender pay gap for the Telecoms sector was 19.7%, compared to 15.4% for the whole of the UK economy. In other words, women were paid 80p for every £1 earned by men in the Telecoms sector, compared to the UK average of 85p.
We have also published a new set of earnings estimates based on Annual Population Survey data to 2020. These allow us to explore earnings for demographic groups not identifiable in the ASHE datasets. These new estimates showed that disabled employees in Telecoms earned £15.38 per hour on average, 17.7% less than non-disabled workers (£18.69), this was a larger difference than for the UK as a whole (-13.6%) or DCMS sectors (-15.6%).
Productivity
We have produced this experimental measure for 2019 because this was the latest year for which data were available whilst the measure was being developed. We welcome user feedback.
In 2019 output per filled job in the Telecoms sector was £156,900, more than double the UK average (£58,100), and £92,700 greater than the DCMS sector (excl. Civil Society and Tourism) average (£64,200).
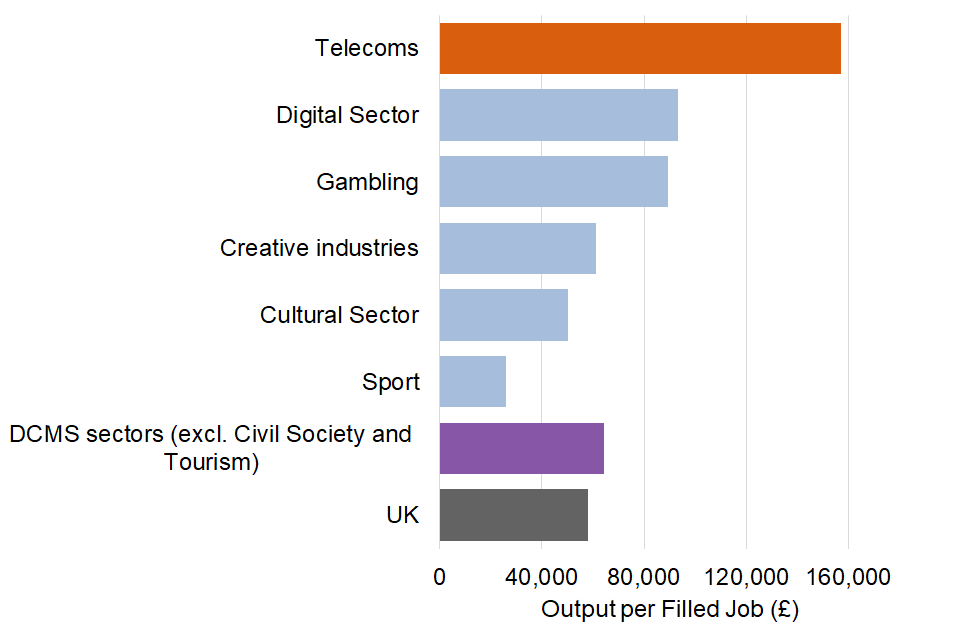
Figure 16: Output per filled job (£) in the Telecoms sector, all other DCMS sectors (excluding Civil Society and Tourism), and the UK, 2019
11. Tourism
Tourism is defined by the characteristics of the consumer in terms of whether they are a tourist or resident. It differs from “traditional” sectors, such as Gambling or Telecoms, which are defined by the goods and services produced themselves, meaning that a different approach to defining the industry must be used. The UK estimates are based on the methodology and definition set out in the UN International Recommendations for Tourism Statistics 2008 (IRTS 2008).
Estimates for the Tourism sector are only available for 2016 to 2020 as they rely on the Tourism Satellite Account. Tourism Satellite Account estimates prior to 2016 are not comparable, and were not available for 2021 at the time of publication.
11.1 Gross Value Added (GVA)
Latest estimate - leading indicator
It was not possible to calculate the GVA by the Tourism sector for any part of 2021 due to lack of available data.
Annual measure for 2020
The Tourism Satellite Account for 2019 includes a ‘nowcast’ for 2020. This is a provisional estimate that will be revised the following year.
The Tourism Satellite Account shows that:
- In 2020, GVA by the Tourism sector was £34.4 billion, 53.3% lower in nominal terms than in 2019, a substantially larger fall than for the UK economy as a whole (-3.4%)[footnote 3].
- Prior to 2020, GVA by the Tourism sector grew faster than GVA by the UK economy as a whole, increasing by 23.0% in nominal terms between 2016 and 2019 compared to 12.1% for the UK economy.
- The majority of the growth in Tourism sector GVA between 2016 and 2019 was due to increases in ‘Other consumption products’[footnote 4], ‘Accommodation services for visitors’, and ‘Travel agencies and other reservation services’, which grew by 12.2%, 17.6%, and 27.1%, respectively. ‘Other consumption products’ and ‘Accommodation services for visitors’ also accounted for the majority of the decrease in Tourism sector GVA between 2019 and 2020, falling by 53.3% and 46.7%, respectively.
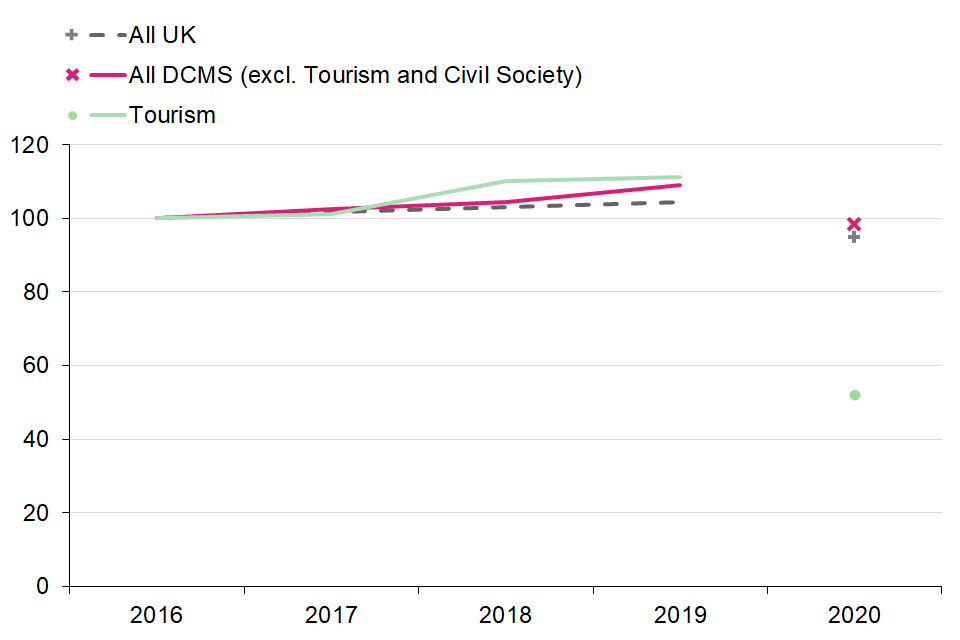
Figure 17: Index of Gross Value Added for the Tourism sector, DCMS sectors and the UK Base year = 2016
The break between 2019 and 2020 for DCMS (excl. Tourism and Civil Society) and for the UK, distinguishes between values taken from the DCMS annual GVA publication, and those derived from the DCMS monthly GVA estimates, with both series initially indexed to 2019 to remove any systematic differences in the absolute value of the GVA. For Tourism, the break distinguishes between the final data and the provisional 2020 nowcast.
11.2 Employment (calendar years 2016 - 2020)
This publication includes a re-release of calendar year employment estimates for 2011 to 2020. It updates and develops aspects of the back series and provides a single, coherent, set of reference tables for users.
The latest available figures for the number of filled jobs in the Tourism sector are for the 2020 calendar year. These show that there were 0.8 million filled jobs in the Tourism sector in 2020, a decrease of 44.3% since 2016.
Tourism was one of only two DCMS sectors (the other being Civil Society) where the majority of jobs were occupied by women in 2020. The proportions of filled jobs held by disabled people and by people from ethnic minority groups were in line with the wider UK economy. The proportion of filled jobs in the Tourism sector held by women, and by people with disabilities, increased between 2016 and 2020 at approximately the same rate as the wider UK economy, whilst the proportion held by people from ethnic minority groups remained the same.
Socio-economic background and social mobility
In addition to our standard range of demographic breakdowns, we have published analysis of filled jobs by socio-economic background.
In 2020 47.5% of filled jobs in the Tourism sector were held by those from a more advantaged background. People from less advantaged backgrounds and unknown backgrounds both held 27.8% and 24.6% of the sector’s filled jobs, respectively. The proportion of filled jobs in the Tourism sector held by those from a more advantaged background was higher than the UK average (46.8%) but lower than the DCMS sector average (54.5%).
Upward social mobility, defined here as the proportion of those in higher class occupations from less advantaged backgrounds, is higher in the Tourism sector (23.9%) compared to that of all DCMS sectors (23.2%), but lower than the UK overall (26.5%).
11.3 Earnings
Earnings estimates for the Tourism sector are only available up to 2020, as the Tourism Satellite Account for 2021 was not published at the time of this release.
Our usual earnings estimates (calculated from ONS’s Annual Survey of Hours and Earnings) show that:
- In 2020, median annual earnings in the Tourism sector were £18,428. This was 29.1% lower than DCMS overall (£25,981) and 29.9% lower than the UK as a whole (£26,285).
-
Earnings in the Tourism sector grew more slowly in nominal terms between 2016 and 2020 (2.0%) than both DCMS sectors overall (2.7%) and the UK (3.6%).
- Those on furlough in April 2020 earned £15,868, 40.3% less than those who were not furloughed in 2020 (£26,599).
- Median annual gross pay in the Tourism sector in 2020 was highest in London (£24,092), followed by the South East (£19,815). It was lowest in Northern Ireland (£14,942) and Yorkshire and the Humber (£15,767).
- In 2020, the gender pay gap for the Tourism sector was 7.0%, compared to 15.4% for the whole of the UK economy. In other words, women were paid 93p for every £1 earned by men in the Tourism sector, compared to the UK average of 85p.
We have also published a new set of earnings estimates based on Annual Population Survey data to 2020. These allow us to explore earnings for demographic groups not identifiable in the ASHE datasets. These new estimates showed that in 2020, disabled employees in Tourism earned £9.33 per hour on average, 9.3% less than non-disabled employees (£10.28), this was a smaller difference than for the UK as a whole (-13.6%) or DCMS sectors (-15.6%).
12. Civil Society
Civil Society covers charities, voluntary organisations or trusts, social enterprises, mutuals and community interest companies. The Civil Society sector is not like a traditional industry and data from official sources are unlikely to completely cover the sector’s remit.
12.1 Employment
In the employment estimates, respondents are considered to be part of the Civil Society sector if the organisation they work for is not “a private firm or business, a limited company”, and is a “charity, voluntary organisation or trust”. As this is only collected for respondents’ first jobs, estimates of the number of filled jobs in Civil Society are based on main jobs only, and do not include second jobs (unlike estimates for all other sectors). This estimate is therefore an under-estimate on two counts: it does not include second jobs, and it does not include volunteers, social enterprises and mutuals.
Latest estimates
We publish annual employment figures on a rolling quarterly basis. The latest published employment estimates cover the period July 2020 to June 2021, and show that the number of filled jobs in Civil Society was 0.9 million. The last decade (calendar years) - 2011 to 2020 This publication includes a re-release of calendar year employment estimates for 2011 to 2020. It updates and develops aspects of the back series and provides a single, coherent, set of reference tables for users.
The number of filled jobs in Civil Society was 0.9 million in 2020, a growth of 20.9% since 2011. For comparison, the number of filled jobs in the UK as a whole grew by 10.7% over the same period. In 2020, compared to the UK average, people working in Civil Society were much more likely to be female, more likely to be disabled, and slightly less likely to be from an ethnic minority group. The proportion of filled jobs in Civil Society held by people with disabilities increased substantially between 2011 and 2020, the proportion held by people from ethnic minority groups also increased, whilst the proportion held by women decreased over the same period.
Socio-economic background and social mobility
In addition to our standard range of demographic breakdowns, we have published analysis of filled jobs by socio-economic background.
In 2020, 55.3% of filled jobs in Civil Society were held by people from more advantaged backgrounds, while people from less advantaged backgrounds and unknown backgrounds held 25.7% and 19.1% of the sector’s filled jobs, respectively. The proportion of filled jobs in Civil Society held by those from a more advantaged background was higher than the UK average (46.8%) but similar to the DCMS sector average (54.5%).
Upward social mobility, defined here as the proportion of those in higher class occupations from less advantaged backgrounds, is lower in Civil Society (22.5%) compared to the UK overall (26.5%) and all DCMS sectors (23.2%).
12.2 Earnings
In the earnings estimates based on Annual Population Survey data, the definition of Civil Society used in this release is the same as for the employment estimate. As hourly pay is only available for first jobs, Civil Society earnings are more comparable to those for other sectors.
Jobs are included in the Civil Society earnings estimates based on the Annual Survey of Hours and Earnings (ASHE) if they are classified as ‘Not for Profit’ in the ASHE dataset.
We have updated our usual earnings estimates (calculated from ONS’s ASHE) with provisional 2021 and final 2020 data. These show that:
- In 2021, median annual earnings for Civil Society were £24,778, 21.0% lower than DCMS (excl. Tourism) (£31,375).
-
Earnings for employees in Civil Society grew by less in nominal terms between 2016 and 2021(10.4%) than the UK as a whole (11.7%).
- On average, workers in Civil Society who were on furlough in April 2021 earned £12,739, 51.9% less than those who were not furloughed (£26,455).
- Median annual gross pay for Civil Society was highest in London (£31,936), followed by the East of England (£25,754). It was lowest in The South West (£20,974) and Northern Ireland (£22,041).
- In 2021, the gender pay gap for Civil Society was 20.8%, compared to 15.4% for the whole of the UK economy. In other words, women were paid 79p for every £1 earned by men in Civil Society, compared to the UK average of 85p.
We have also published a new set of earnings estimates based on Annual Population Survey data to 2020. These allow us to explore earnings for demographic groups not identifiable in the ASHE datasets. These new estimates showed that disabled employees in Civil Society earned £12.16 per hour on average, 9.5% less than non-disabled workers (£13.43), this was a smaller difference than for the UK as a whole (-13.6%) or DCMS sectors (-15.6%).
13. Data
The DCMS sectors are not mutually exclusive; industries may contribute to and be classified as more than one sector. Due to these overlaps, summing over the number of businesses in individual sectors would give a total greater than the actual value. When calculating the DCMS sector total, these overlaps are accounted for and businesses are only counted once rather than multiple times.

Figure 18: Proportions of DCMS sector employment that are included in multiple sectors, 2020
There is substantial overlap between sectors, and growth in certain sub-sectors can drive these sectors in the same direction. Notably:
- 57.0% of Creative Industries, 32.4% of the Cultural sector, and all of the Telecoms sector overlap with the Digital sector.
- 97.6% of the Cultural sector and 74.5% of the Digital sector overlap with Creative Industries.
Measuring the data Data sources, quality and methodology Information on data sources, sector definitions and how the data were produced is available in the technical report.
The Office for National Statistics (ONS) is the provider of the underlying data used for the analysis presented within this release.
The DCMS Sector Economic Estimates were designated as National Statistics on 26 June 2019. This followed a report by the Office for Statistics Regulation in December 2018 which stated that the series could be designated as National Statistics, subject to meeting certain requirements.
Other organisations, including some of DCMS’ arm’s length bodies, produce alternative economic measures of DCMS sectors. These alternative measures can be found in the technical report.
14. Glossary
14.1 UK non-financial business economy
The UK non-financial business economy accounts for approximately two thirds of the UK economy in terms of Gross Value Added. The industries covered are non-financial services, agriculture, production, communication and distribution industries. See the technical report for further information.
14.2 Median
The median is a type of average, found by taking the middle value of the variable of interest. In this report, we are interested in earnings, so we look at all of the surveyed earnings responses in order of size, and take the one that falls in the middle. This avoids the average being skewed by just a few people with very large or very small earnings, so the median is more reflective of earnings for the majority.
Further information DCMS has developed a suite of Economic Estimates to understand the economic impact its sectors have on the UK economy. Upcoming work in the DCMS Economic Estimates series include:
- Employment
- Monthly GVA
- International trade in goods, services and tourism
For general enquiries contact:
Department for Digital, Culture, Media and Sport
100 Parliament Street
London
SW1A 2BQ
For media enquiries contact: 020 7211 2210. DCMS statisticians can also be followed on Twitter via @DCMSInsight.
-
The number of jobs used for the calculation of productivity is different to our employment estimates. Our employment estimates are based on a household survey and use self-reported industry classification. Productivity jobs are based on data from various surveys, providing better coverage of those in e.g. short term work or the armed forces, and better industry assignment for employees. ↩
-
A provisional GVA figure has been calculated for 2020 based on our monthly GVA estimates due to a delay to the Annual Business Survey. For full details see the technical report. ↩ ↩2 ↩3 ↩4 ↩5 ↩6 ↩7
-
The Tourism Satellite Account is reported in current prices, i.e., without accounting for inflation. Unlike our approach in all other chapters, we have therefore given the UK difference here in nominal terms, based on the ONS estimates of UK Gross Value Added in basic prices. ↩
-
‘Other consumption products’ includes expenditure on goods and services not formally evaluated elsewhere in the Tourism Satellite Account, for example personal transport costs. ↩