Vaccination coverage statistics for children aged up to 5 years, England (COVER programme) report: April 2025 to March 2026
Updated 4 September 2026
Applies to England

© Crown copyright 2026
This publication is licensed under the terms of the Open Government Licence v3.0 except where otherwise stated. To view this licence, visit nationalarchives.gov.uk/doc/open-government-licence/version/3 or write to the Information Policy Team, The National Archives, Kew, London TW9 4DU, or email: psi@nationalarchives.gov.uk.
Where we have identified any third party copyright information you will need to obtain permission from the copyright holders concerned.
This publication is available at https://www.gov.uk/government/statistics/cover-of-vaccination-evaluated-rapidly-cover-programme-april-2025-to-march-2026/vaccination-coverage-statistics-for-children-aged-up-to-5-years-england-cover-programme-report-april-2025-to-march-2026
Health Protection Report, Volume 20 Number 8
Published 27 August 2026
This report of the cover of vaccination evaluated rapidly (COVER) programme presents annual coverage data for children in the UK who reached their first, second, or fifth birthday during the evaluation year (April 2025 to March 2026).
The full coverage data by country, region, and upper tier local authority (UTLA) is contained in the supplementary data tables accompanying this report.
Corrections
This report was corrected on 1 September 2026. The caption for Figure 24 was corrected from ‘measured at 24 months’ to ‘measured at 5 years’.
Main points
When compared with the previous financial year:
-
coverage in the UK measured in children aged 12 months decreased for all vaccines: by 0.9 percentage points for the 6-in-1 vaccine; by 1.0 percentage points for the pneumococcal conjugate vaccine (PCV1) vaccine; by 0.4 percentage points for the rotavirus vaccine; and by 0.5 percentage points for the meningococcal group B (MenB) vaccine
-
coverage in the UK for the pre-school booster (diphtheria, tetanus, pertussis and polio: dTaP/IPV) increased by 0.5 percentage points and the second dose of measles, mumps, and rubella (MMR2) remained stable when measured at 5 years of age, reflecting vaccinations that should have been delivered between August 2023 to July 2024
-
coverage in both Scotland and Wales exceeded the 95% World Health Organization (WHO) target for coverage for the 6-in-1 measured at 5 years. Coverage in Scotland also exceeded the target for the first dose of measles, mumps, and rubella (MMR1) vaccine measured at 5 years
-
coverage in Wales fell short by 0.1 percentage point for MMR1 at 5 years, while coverage in Northern Ireland was 94.0% for the 6-in-1 and 92.7% for MMR1
-
coverage in England measured in children aged 12 months decreased for all vaccines: by 0.8 percentage points for the 6-in-1 vaccine; by 0.9 percentage points for the PCV1 vaccine; by 0.4 percentage points for the rotavirus vaccine; and by 0.4 percentage points for the MenB vaccine
-
coverage in England of the MMR1 measured at 24 months (in children who first became eligible between April 2024 and March 2025) decreased by 1.0 percentage points in England. In children aged 5 years, coverage increased by 0.3 percentage points in England, largely reflecting vaccinations delivered in April 2021 to March 2022 and MMR catch-up campaigns in 2023 to 2024
-
in England, vaccination coverage varies by geography, with lower coverage in London and in more deprived areas
Note that coverage may be underestimated in highly urbanised areas. See data sources and methodology for more details.
Coverage in UK countries
Coverage in children aged 12 months
Compared with the previous year, for antigens measured in children aged 12 months, UK coverage:
-
decreased by 0.9 percentage points to 90.8% for the 6-in-1
-
decreased by 0.4 percentage points to 88.7% for rotavirus
-
decreased by 1.0 percentage points to 92.4% for PCV1
-
decreased by 0.5 percentage points to 90.8% for MenB
In Scotland and Wales, coverage in children aged 12 months was at or above 93% for all antigens except for rotavirus, which was 91.8% in Scotland and 90.9% in Wales. In Northern Ireland coverage was above 89% for all antigens except for rotavirus, which was 86.3%.
Coverage in children aged 24 months
Compared with the previous year, for antigens measured in children aged 24 months, UK coverage:
-
decreased by 0.2 percentage points to 92.6% for the 6-in-1
-
decreased by 1.0 percentage points to 88.3% for MMR1
-
decreased by 0.6 percentage points to 88.0% for the PCV booster
-
decreased by 0.5 percentage points to 87.4% for the MenB booster
In Scotland and Wales, coverage in children aged 24 months was above 91% for all antigens. In Northern Ireland coverage was above 85% for all antigens.
Coverage in children aged 5 years
Compared with the previous year, for antigens measured in children aged 5 years, UK coverage:
-
increased by 0.1 percentage points to 93.3% for the 6-in-1
-
increased by 0.5 percentage points to 82.9% for the dTaP/IPV booster
-
increased by 0.2 percentage points to 92.5% for MMR1
-
remained stable at 84.4% for MMR2
In Scotland and Wales, coverage in children aged 5 years was above 89% for all antigens. In Northern Ireland coverage was at or above 92% for the 6-in-1 and MMR1 and above 84% for the dTaP/IPV booster and MMR2 (Table 1).
Table 1. Coverage of routine childhood immunisations in the UK, 2025 to 2026
| Age at measurement | Vaccine | England (%) | Wales (%) | Scotland (%) | Northern Ireland (%) | United Kingdom (%) |
|---|---|---|---|---|---|---|
| 12 months | DTaP/IPV/Hib/HepB | 90.5 | 93.1 | 93.8 | 89.2 | 90.8 |
| 12 months | PCV | 92.2 | 94.6 | 94.7 | 91.8 | 92.4 |
| 12 months | Rota | 88.4 | 90.9 | 91.8 | 86.3 | 88.7 |
| 12 months | MenB | 90.6 | 93.0 | 93.6 | 89.5 | 90.8 |
| 24 months | DTaP/IPV/Hib/HepB | 92.3 | 95.1 | 95.3 | 92.2 | 92.6 |
| 24 months | MMR1 | 87.9 | 92.5 | 92.0 | 86.1 | 88.3 |
| 24 months | PCV booster | 87.5 | 92.4 | 92.1 | 86.3 | 88.0 |
| 24 months | MenB booster | 86.8 | 92.2 | 91.8 | 85.6 | 87.4 |
| 5 years | DTaP/IPV/Hib/HepB | 92.9 | 95.3 | 96.6 | 94.0 | 93.3 |
| 5 years | MMR1 | 92.1 | 94.9 | 95.4 | 92.7 | 92.5 |
| 5 years | dTaP/IPV booster | 81.9 | 89.2 | 90.2 | 84.5 | 82.9 |
| 5 years | MMR2 | 83.8 | 89.3 | 89.7 | 84.3 | 84.4 |
6-in-1 vaccine in England
Coverage in children aged 12 months
In England, 12-month coverage of the 6-in-1 decreased by 0.8 percentage points to 90.5%.
Across England excluding London (as the region with the lowest coverage), 6-in-1 coverage at 12 months was 91.7%, which is 1.2 percentage points higher than the overall England coverage.
In England over the last 10 years, coverage for the 6-in-1 peaked in 2016 to 2017 at 93.4%, 2.9 percentage points higher than the reporting year’s coverage of 90.5% (Figure 1).
Figure 1. Coverage of the primary course of the 6-in-1 vaccine in England measured at 12 months from financial year (FY) ending 2017 to financial year (FY) ending 2026 [note 1]
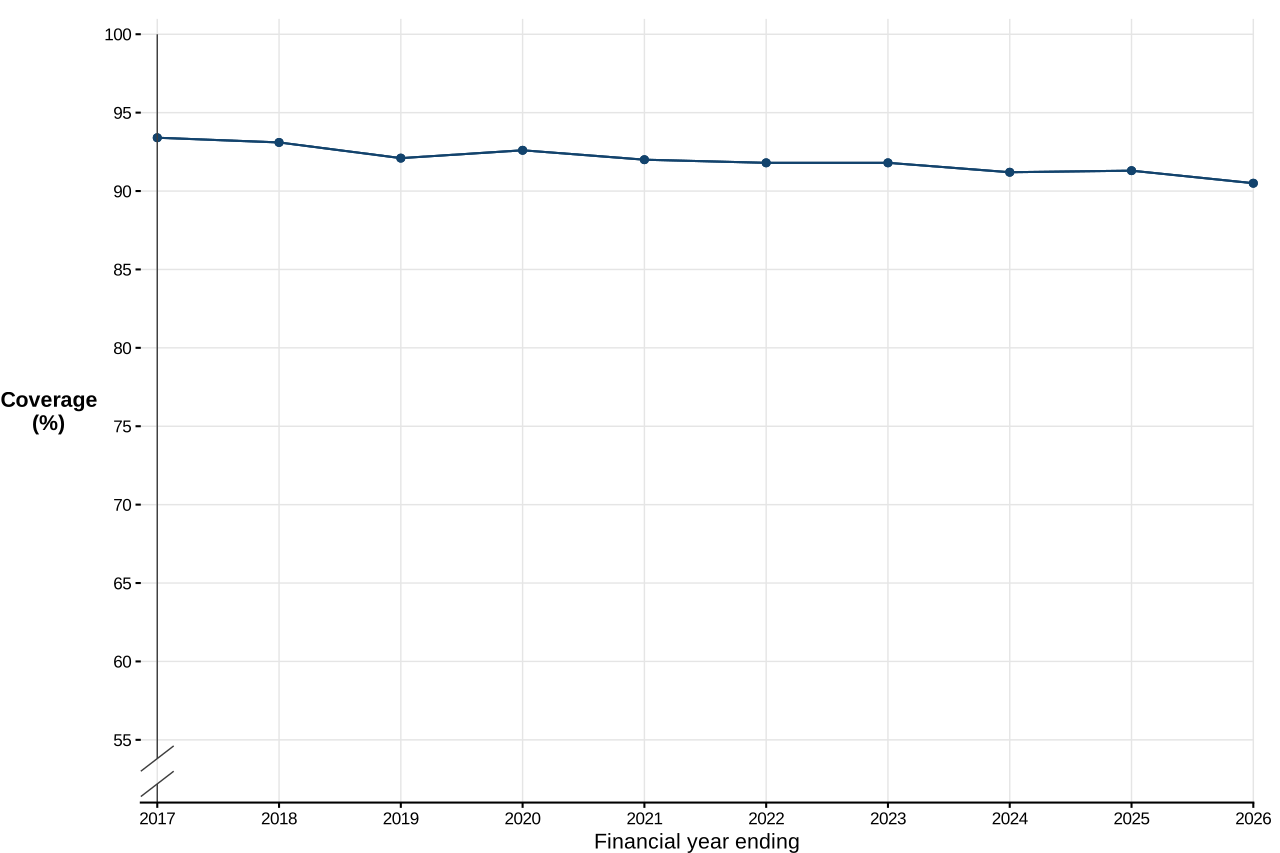
Note 1: the 5-in-1 (DTaP/IPV/Hib3) vaccine was used prior to August 2017 when it was replaced with the 6-in-1 vaccine (DTaP/IPV/Hib3/HepB). As a result, from quarter 4 of 2018 to 2019, coverage of the 6-in-1 vaccine is reported rather than 5-in-1.
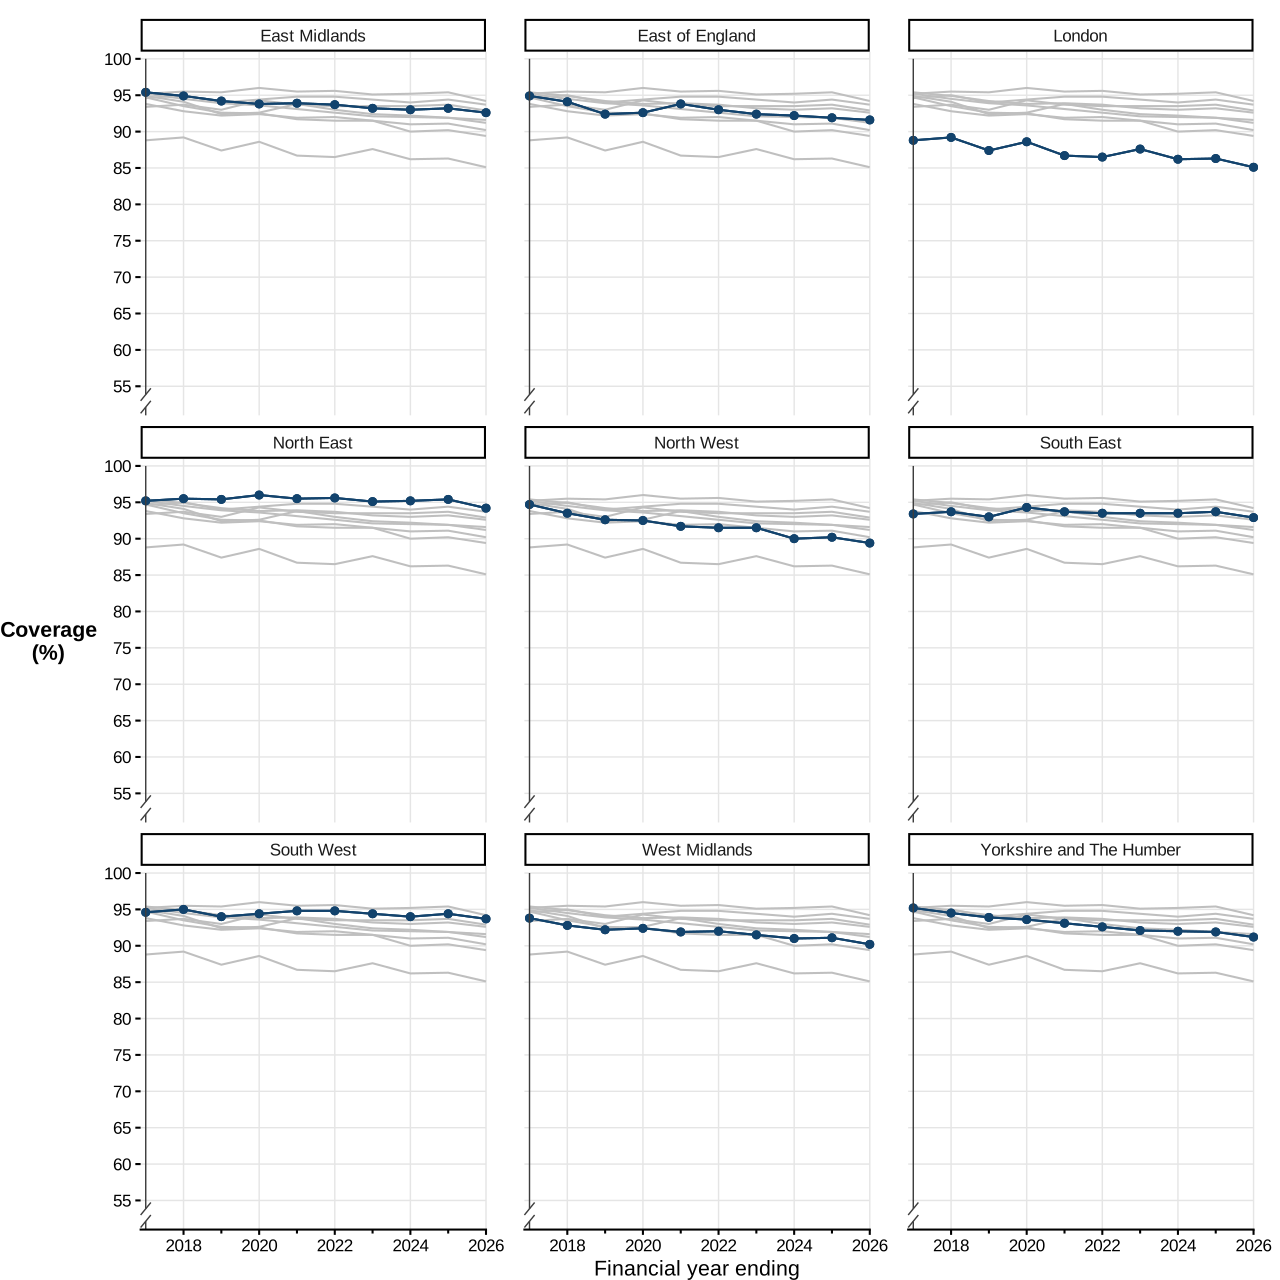
Compared with the previous year, 6-in-1 coverage decreased in all regions:
-
the East Midlands (0.6 percentage points)
-
the East of England (0.3 percentage points)
-
London (1.2 percentage points)
-
the North East (1.2 percentage points)
-
the North West (0.8 percentage points)
-
the South East (0.8 percentage points)
-
the South West (0.7 percentage points)
-
the West Midlands (0.9 percentage points)
-
Yorkshire and the Humber (0.7 percentage points).
Figure 2. Coverage of the primary course of the 6-in-1 vaccine by region measured at 12 months from FY ending 2017 to FY ending 2026
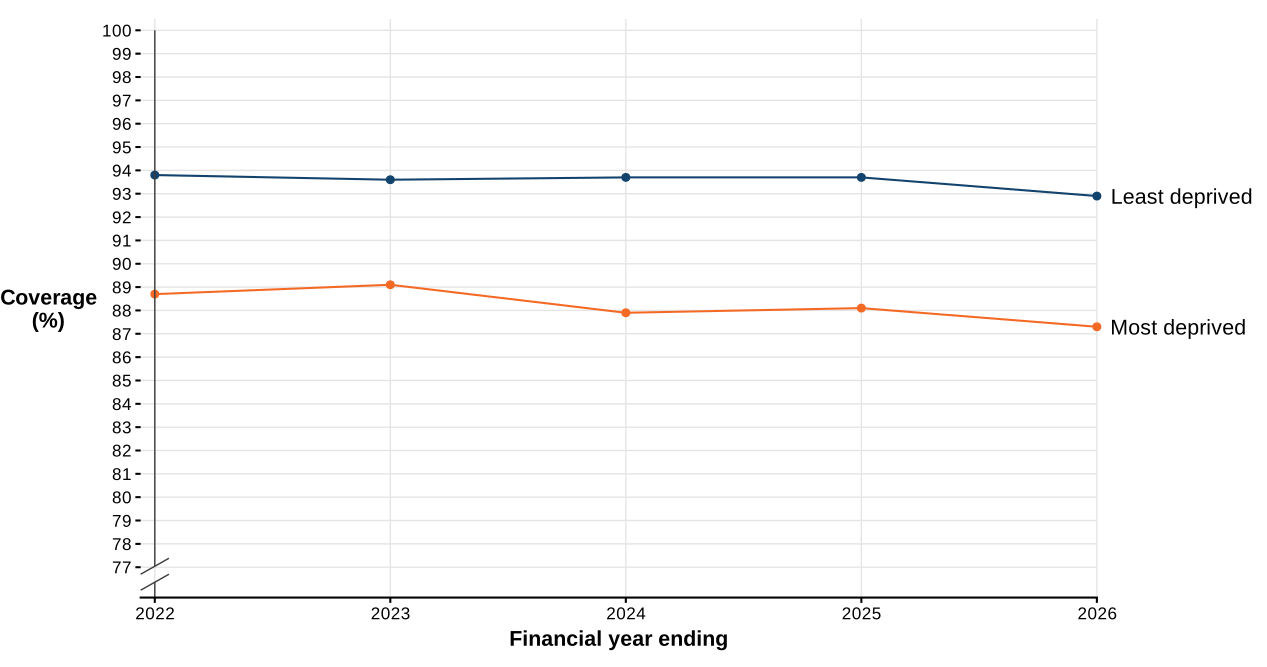
Based on the 2025 Index of Multiple Deprivation (IMD) scores at the UTLA level, in the 30 least deprived UTLAs, compared with the previous year, coverage of the 6-in-1 decreased by 0.8 percentage points to 92.9%. In the 30 most deprived UTLAs, coverage of the 6-in-1 also decreased by 0.8 percentage points to 87.3%, which is 5.6 percentage points lower than the 30 least deprived UTLAs (Figure 3).
Figure 3. Coverage of the primary course of the 6-in-1 vaccine in the 30 most and least deprived local authorities in England, measured at 12 months
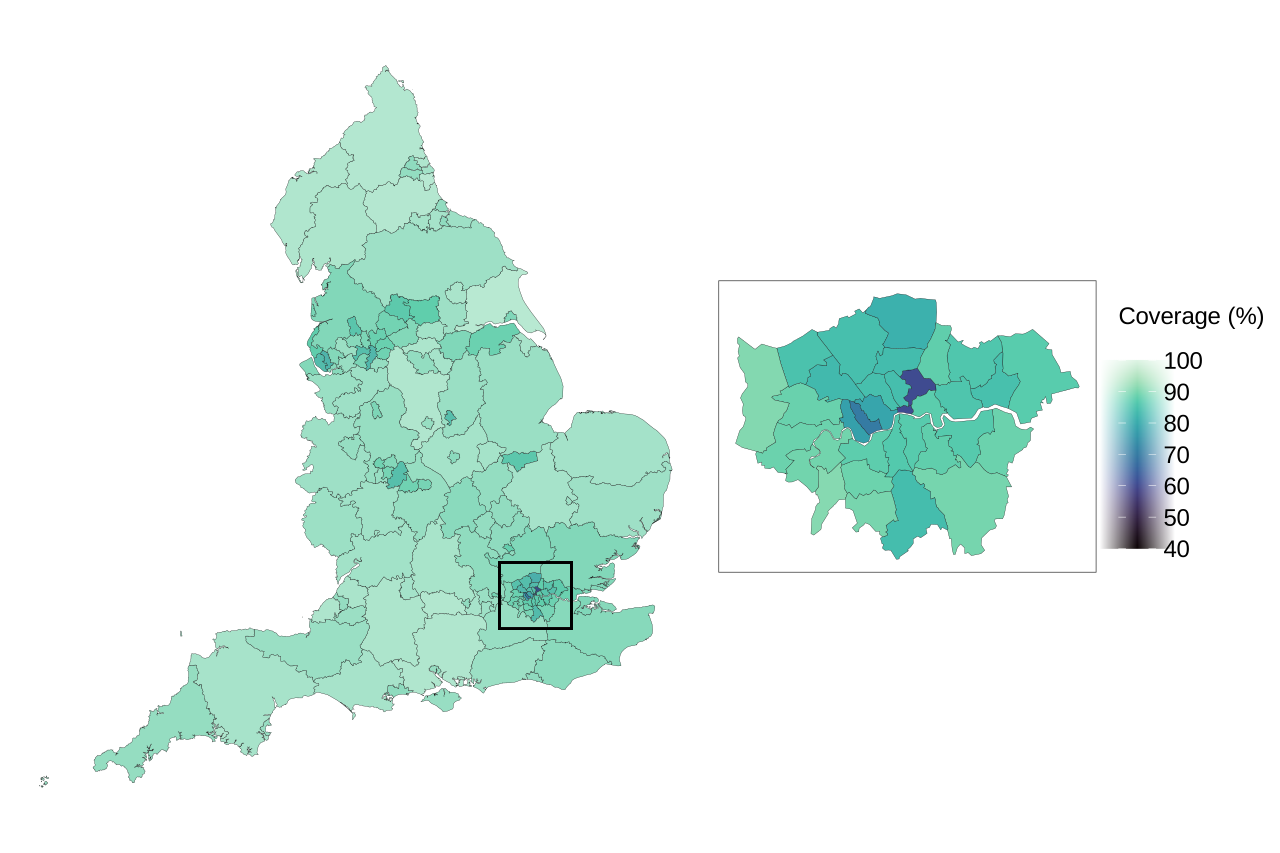
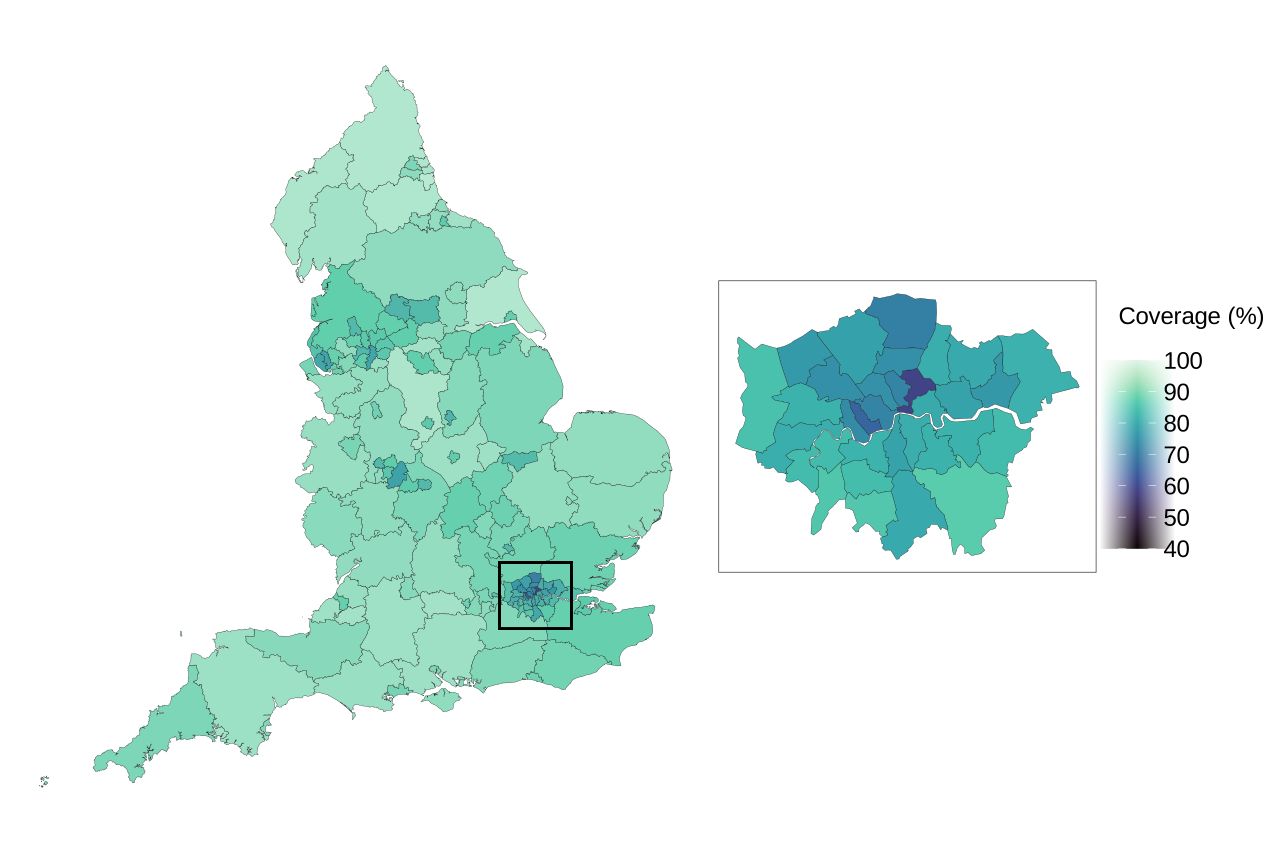
Coverage varies by geography. Full coverage data by country, region, and UTLA is contained in the supplementary data tables accompanying this report. Coverage for the 6-in-1 vaccine for 2025 to 2026 by UTLA measured in children aged 12 months is presented in Figure 4.
Figure 4. Coverage of the 6-in-1 vaccine measured in children aged 12 months in England for 2025 to 2026 by UTLA
Source of vaccine coverage data: UK Health Security Agency.
Source of boundaries: Office for National Statistics licensed under the Open Government Licence v.3.0 Contains OS data © Crown copyright and database right 2025.
Coverage of the 6-in-1 vaccine measured at 12 months varies by UTLA. The data underlying Figure 4 is available in the supplementary data tables accompanying this report.
Coverage in children aged 24 months
In England, 24-month coverage of the 6-in-1 decreased by 0.2 percentage points to 92.3%.
Across England excluding London (as the region with the lowest coverage), 6-in-1 coverage at 24 months was 93.4%, which is 1.1 percentage points higher than the overall England coverage.
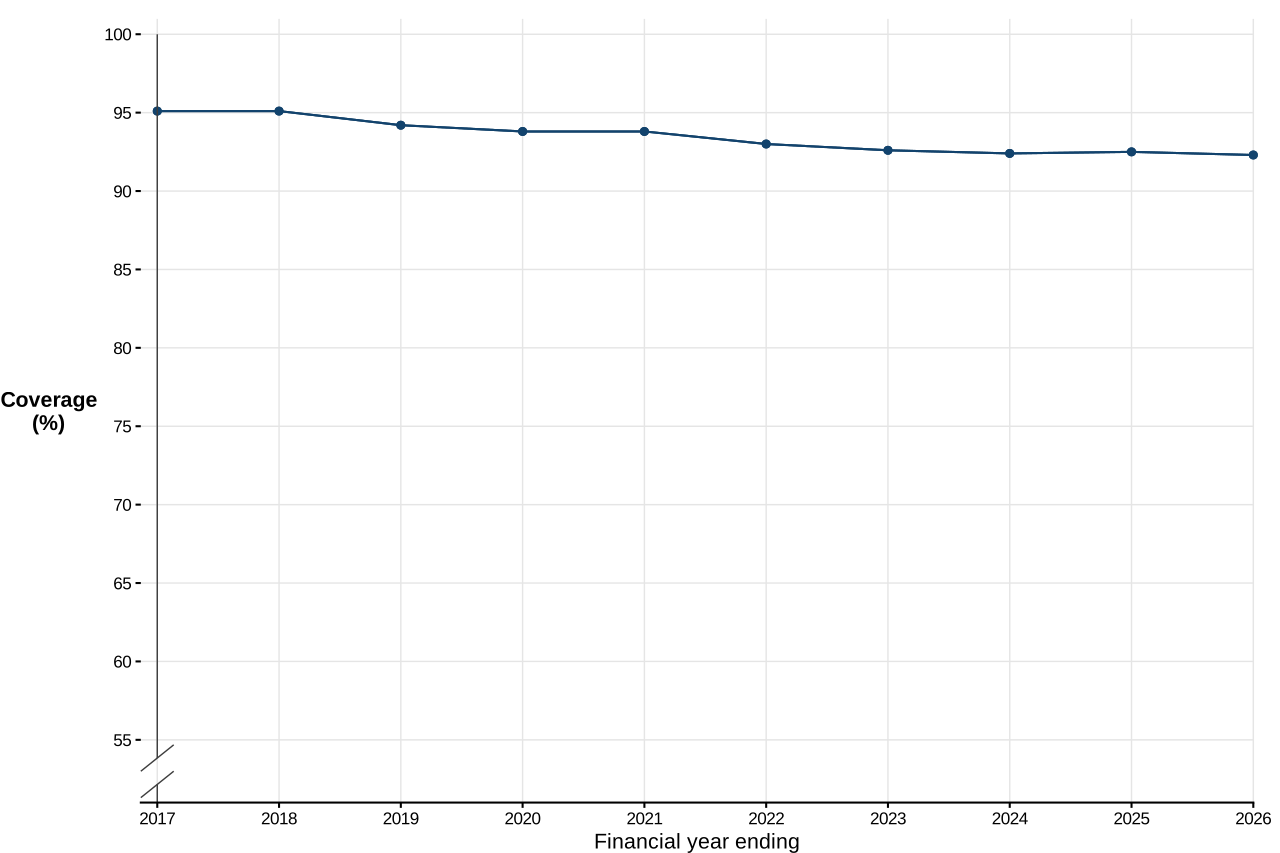
In England over the last 10 years, coverage for the 6-in-1 peaked in 2017 to 2018 at 95.1%, 2.8 percentage points higher than the reporting year’s coverage of 92.3% (Figure 5).
Figure 5. Coverage of the primary course of the 6-in-1 vaccine in England measured at 24 months from FY ending 2017 to FY ending 2026 [note 1]
Note 1: the 5-in-1 (DTaP/IPV/Hib3) vaccine was used prior to August 2017 when it was replaced with the 6-in-1 vaccine (DTaP/IPV/Hib3/HepB). As a result, from quarter 4 of 2018 to 2019, coverage of the 6-in-1 vaccine is reported rather than 5-in-1.
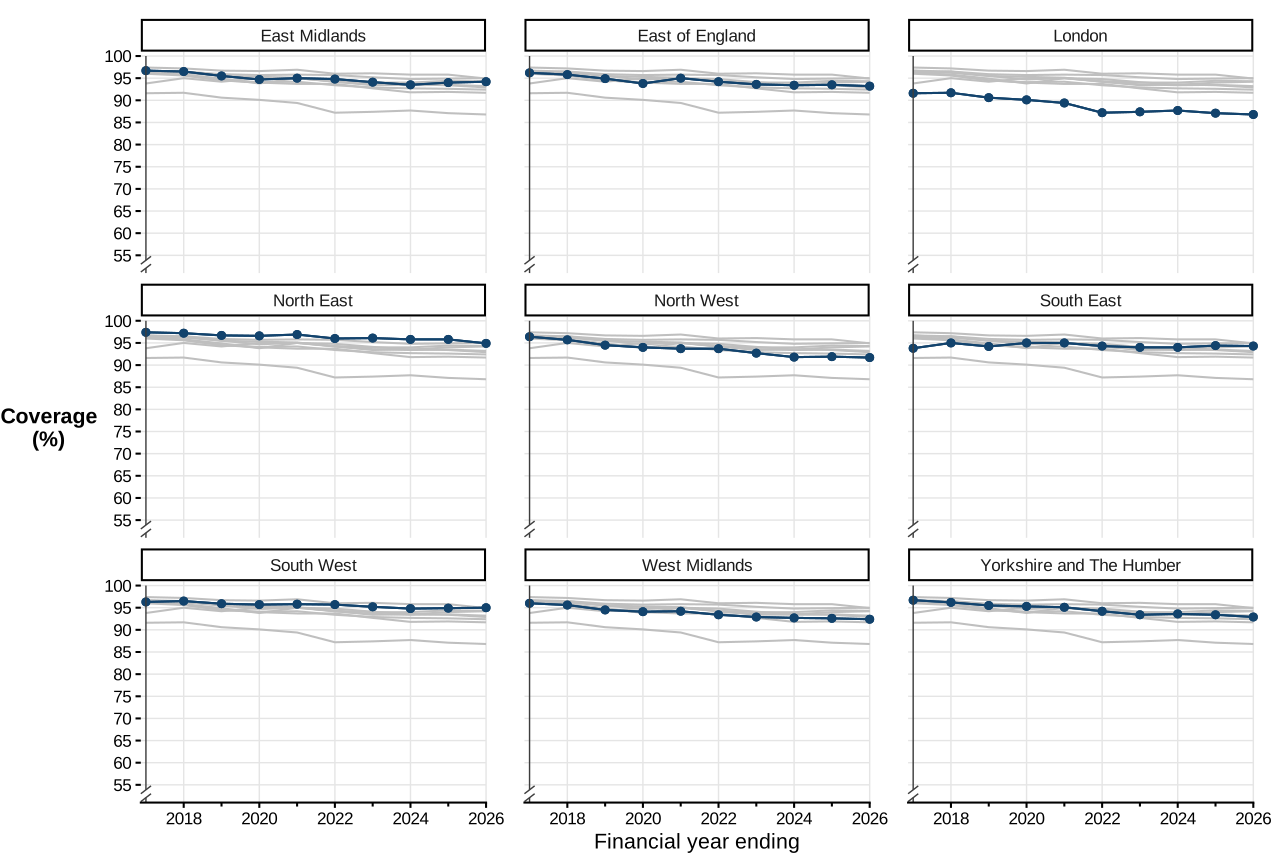
Compared with the previous year, 6-in-1 coverage decreased in:
-
the East of England (0.3 percentage points)
-
London (0.3 percentage points)
-
the North East (0.9 percentage points)
-
the North West (0.2 percentage points)
-
the South East (0.1 percentage points)
-
the West Midlands (0.2 percentage points)
-
Yorkshire and the Humber (0.5 percentage points).
There was an increase in 6-in-1 coverage in:
-
the East Midlands (0.2 percentage points)
-
the South West (0.1 percentage points).
Figure 6. Coverage of the 6-in-1 vaccine by region measured at 24 months from FY ending 2017 to FY ending 2026
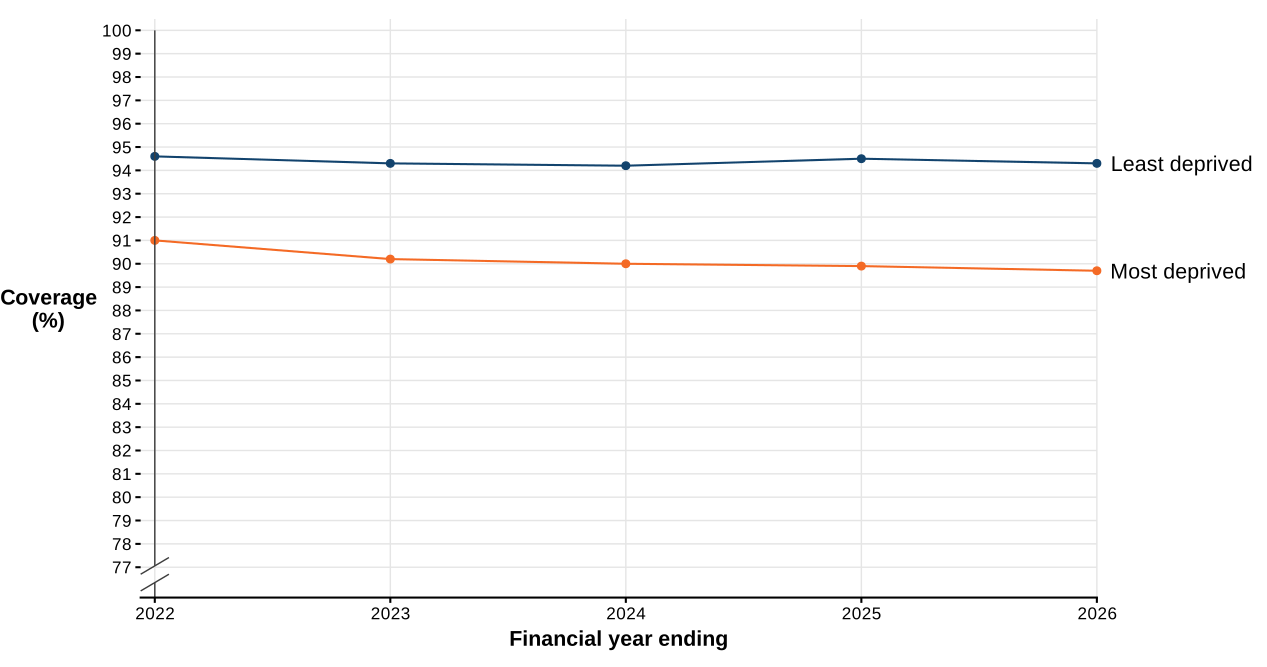
Based on the 2025 IMD scores at the UTLA level, in the 30 least deprived UTLAs, compared with the previous year, coverage of the 6-in-1 decreased by 0.2 percentage points to 94.3%. In the 30 most deprived UTLAs, coverage of the 6-in-1 also decreased by 0.2 percentage points to 89.7%, which is 4.6 percentage points lower than the 30 least deprived UTLAs (Figure 7).
Figure 7. Coverage of the primary course of the 6-in-1 vaccine in the 30 most and least deprived local authorities in England, measured at 24 months
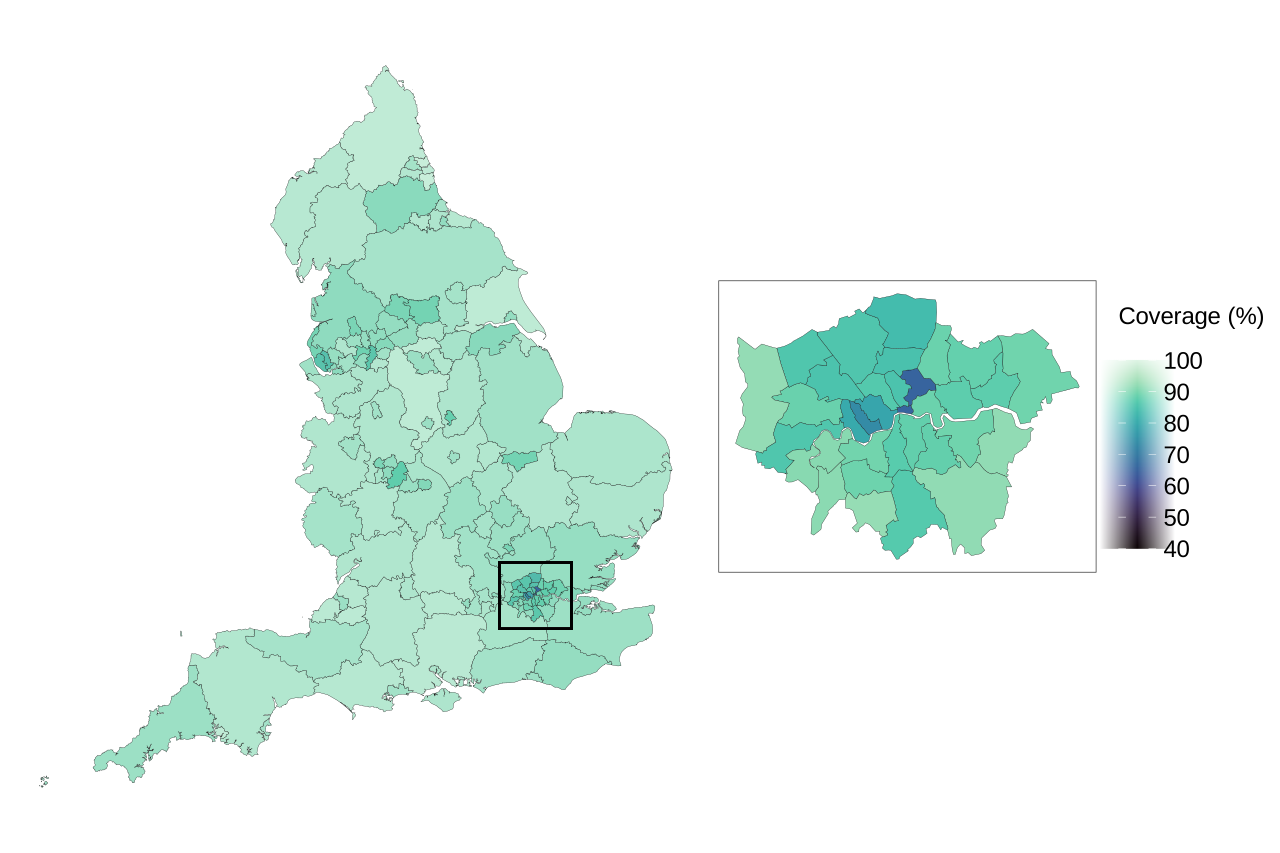
Coverage varies by geography. Full coverage data by country, region, and UTLA is contained in the supplementary data tables accompanying this report. Coverage for the 6-in-1 vaccine for 2025 to 2026 by UTLA measured in children aged 24 months is presented in Figure 8.
Figure 8. Coverage of the 6-in-1 vaccine measured in children aged 24 months in England for 2025 to 2026 by UTLA
Source of vaccine coverage data: UK Health Security Agency.
Source of boundaries: Office for National Statistics licensed under the Open Government Licence v.3.0 Contains OS data © Crown copyright and database right 2025.
Coverage of the 6-in-1 vaccine measured at 24 months varies by UTLA. The data underlying Figure 8 is available in the supplementary data tables accompanying this report.
Coverage in children aged 5 years
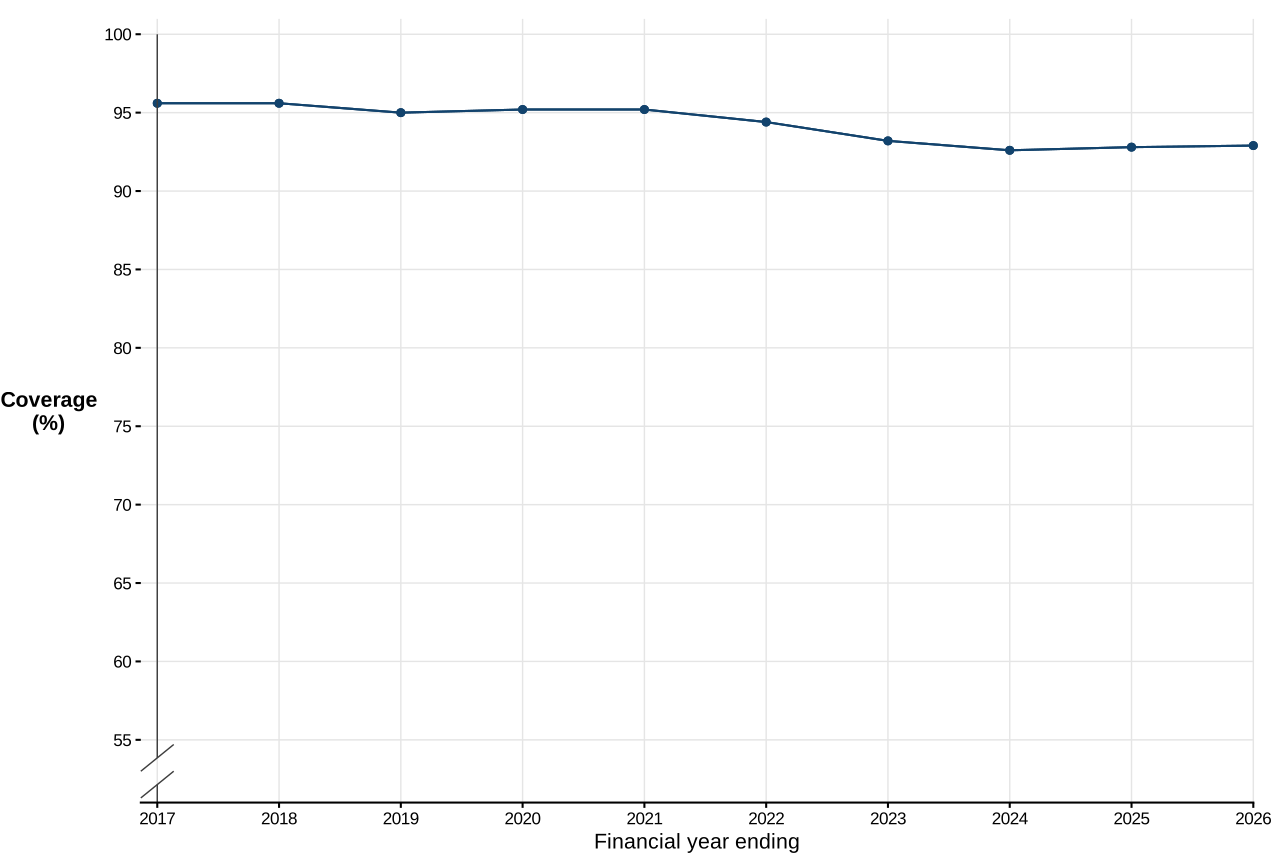
In England, 5-year coverage of the 6-in-1 increased by 0.1 percentage points to 92.9%.
Across England excluding London (as the region with the lowest coverage), 6-in-1 coverage at 5 years was 94.2%, which is 1.3 percentage points higher than the overall England coverage.
In England over the last 10 years, coverage for the 6-in-1 peaked in 2017 to 2018 at 95.6%, 2.7 percentage points higher than the reporting year’s coverage of 92.9% (Figure 9).
Figure 9. Coverage of the primary course of the 6-in-1 vaccine in England measured at 5 years from FY ending 2017 to FY ending 2026 [note 1]
Note 1: the 5-in-1 (DTaP/IPV/Hib3) vaccine was used prior to August 2017 when it was replaced with the 6-in-1 vaccine (DTaP/IPV/Hib3/HepB). As a result, from quarter 4 of 2018 to 2019, coverage of the 6-in-1 vaccine is reported rather than 5-in-1.
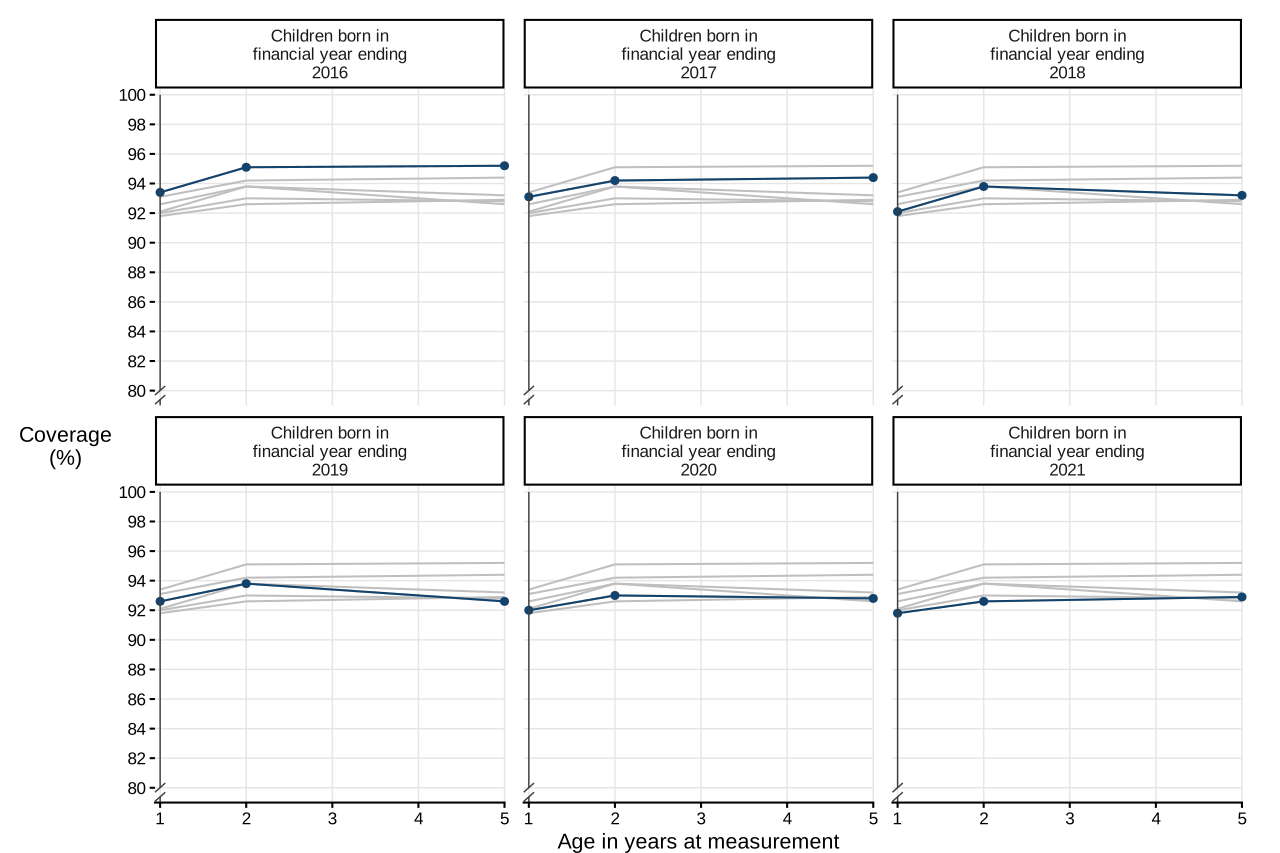
Children aged 5 years in this year were born from April 2020 to March 2021. As compared to birth cohorts from the previous 5 years, coverage for the 6-in-1 in this group has been lower at all age points. When they were aged 12 months, coverage for the 6-in-1 was 91.8%. By 24 months it was 92.6%. This year, at 5 years it is 92.9%.
As a note, birth cohorts over time do not necessarily include the same children due to population movement. The denominator for this birth cohort was 587,950 at 12 months, 602,599 at 24 months, and 628,371 at 5 years.
Figure 10. Coverage of the 6-in-1 vaccine across England measured in children aged 5 years when they were aged 12 months, 24 months, and 5 years
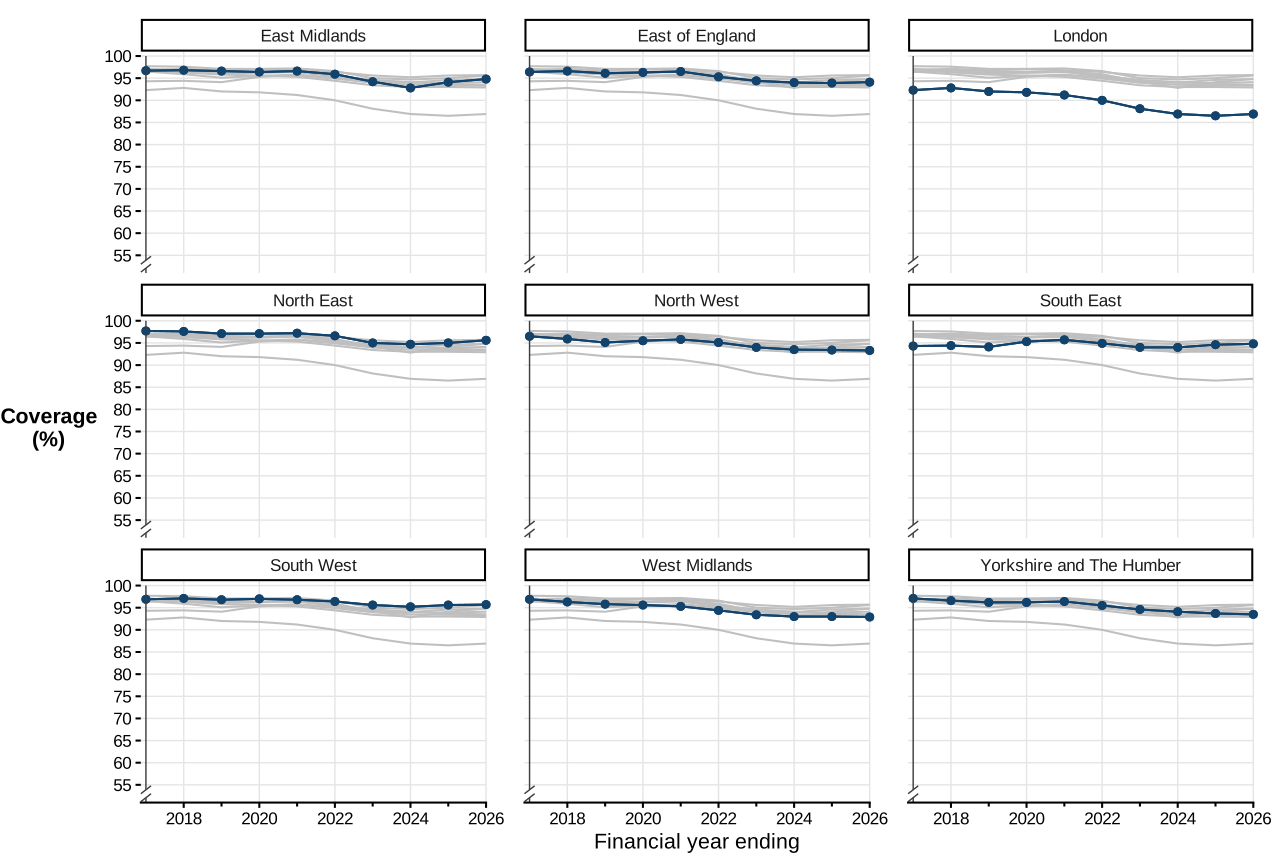
Compared with the previous year, 6-in-1 coverage decreased in:
-
the North West (0.1 percentage points)
-
the West Midlands (0.1 percentage points)
-
Yorkshire and the Humber (0.2 percentage points).
There was an increase in 6-in-1 coverage in:
-
the East Midlands (0.7 percentage points)
-
the East of England (0.2 percentage points)
-
London (0.4 percentage points)
-
the North East (0.6 percentage points)
-
the South East (0.2 percentage points)
-
the South West (0.1 percentage points).
Figure 11. Coverage of the 6-in-1 vaccine by region measured at 5 years from FY ending 2017 to FY ending 2026
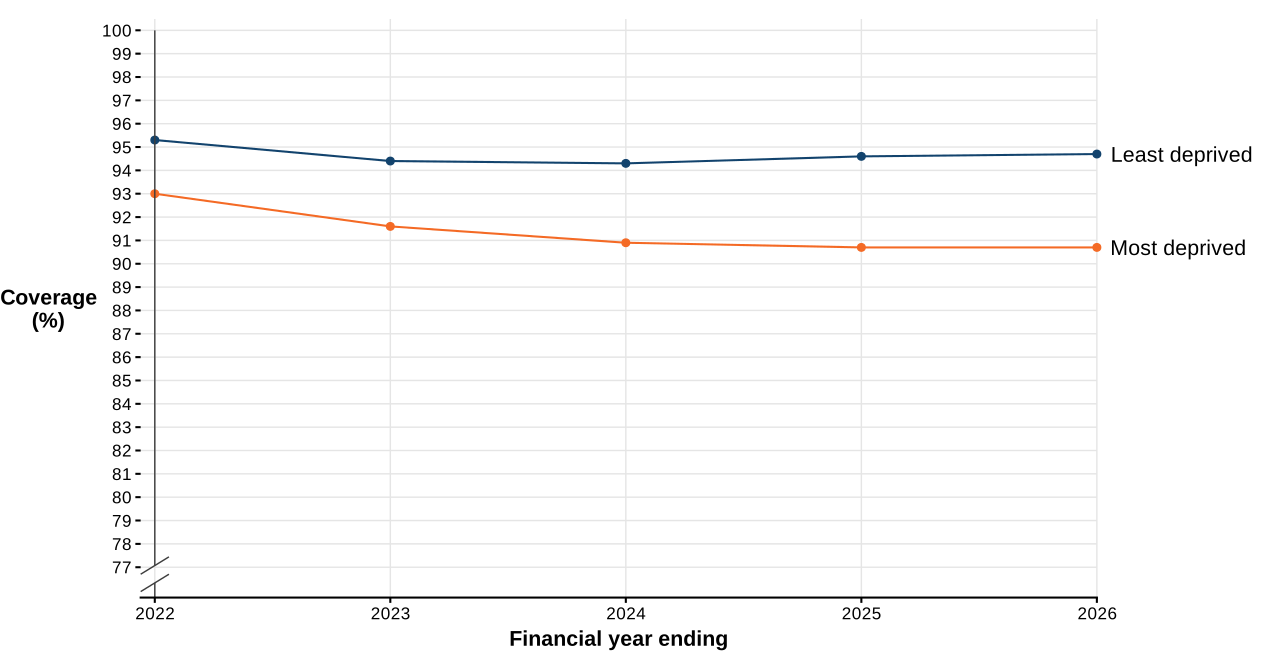
Based on the 2025 IMD scores at the UTLA level, in the 30 least deprived UTLAs, compared with the previous year, coverage of the 6-in-1 increased by 0.1 percentage points to 94.7%. In the 30 most deprived UTLAs, coverage of the 6-in-1 remained stable at 90.7%, which is 4.0 percentage points lower than the 30 least deprived UTLAs. The difference in coverage between the most and the least deprived groups has been widening in the last 5 years, with coverage increasing slightly in the least deprived group, and remaining stable or decreasing in the most deprived group (Figure 12).
Figure 12. Coverage of the primary course of the 6-in-1 vaccine in the 30 most and least deprived local authorities in England, measured at 5 years
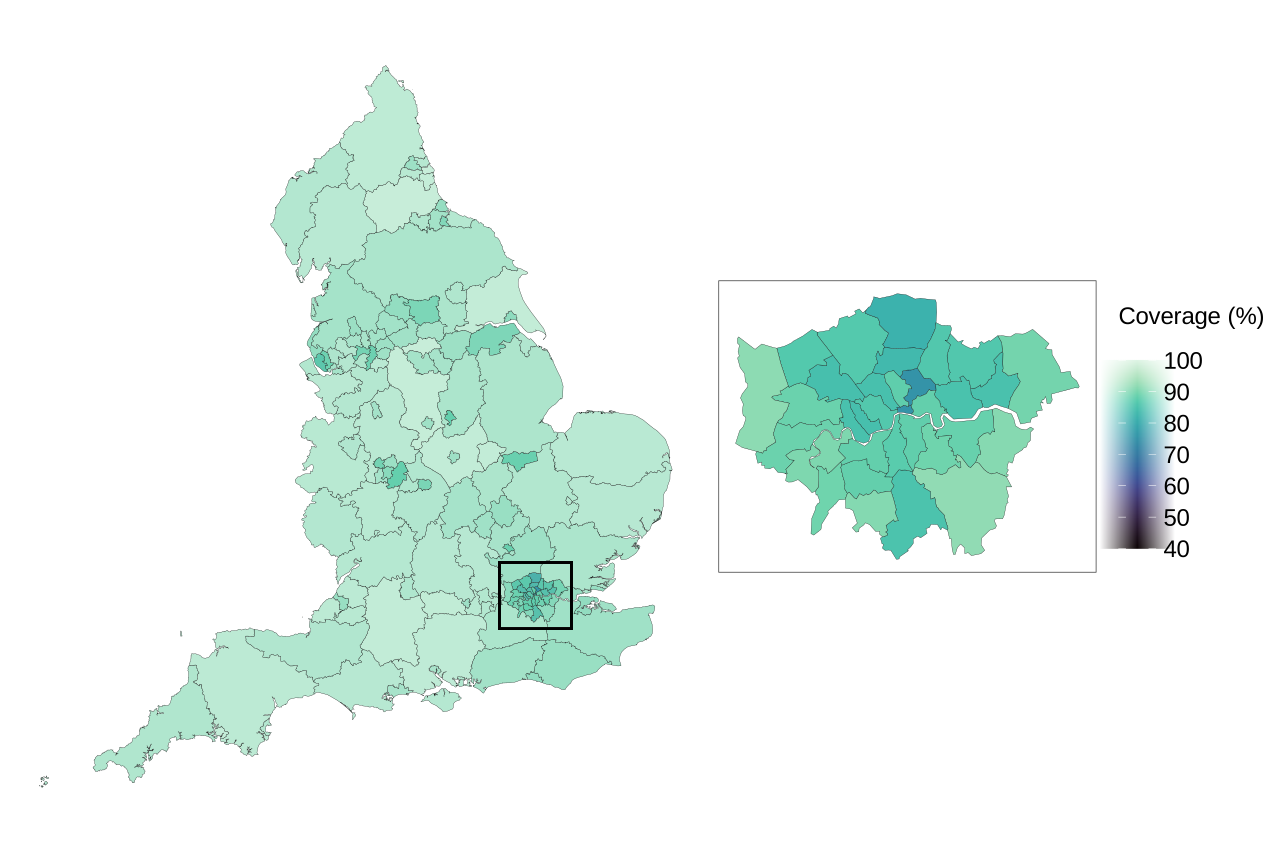
Coverage varies by geography. Full coverage data by country, region, and UTLA is contained in the supplementary data tables accompanying this report. Coverage for the 6-in-1 vaccine for 2025 to 2026 by UTLA measured in children aged 5 years is presented in Figure 13.
Figure 13. Coverage of the 6-in-1 vaccine measured in children aged 5 years in England for 2025 to 2026 by UTLA
Source of vaccine coverage data: UK Health Security Agency.
Source of boundaries: Office for National Statistics licensed under the Open Government Licence v.3.0 Contains OS data © Crown copyright and database right 2025.
Coverage of the 6-in-1 vaccine measured at 5 years varies by UTLA. The data underlying Figure 13 is available in the supplementary data tables accompanying this report.
dTaP/IPV booster in England
Coverage in children aged 5 years
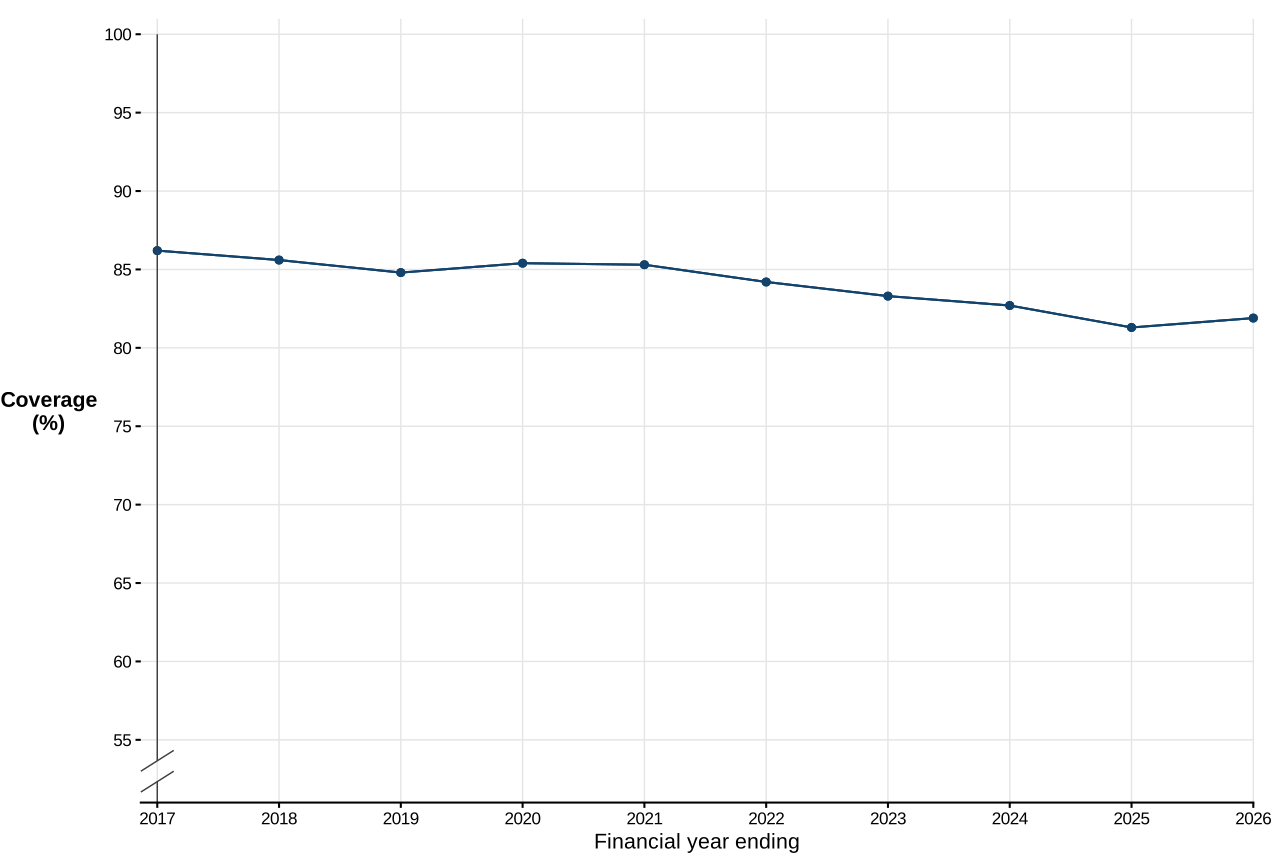
In England, 5-year coverage of the dTaP/IPV booster increased by 0.6 percentage points to 81.9%.
Across England excluding London (as the region with the lowest coverage), dTaP/IPV booster coverage at 5 years was 85.0%, which is 3.1 percentage points higher than the overall England coverage.
In England over the last 10 years, coverage for the dTaP/IPV booster peaked in 2016 to 2017 at 86.2%, 4.3 percentage points higher than the reporting year’s coverage of 81.9% (Figure 14).
Figure 14. Coverage of the dTaP/IPV booster in England measured at 5 years from FY ending 2017 to FY ending 2026
Compared with the previous year, dTaP/IPV booster coverage decreased in:
-
the North West (0.6 percentage points)
-
the West Midlands (0.5 percentage points)
-
Yorkshire and the Humber (0.5 percentage points)
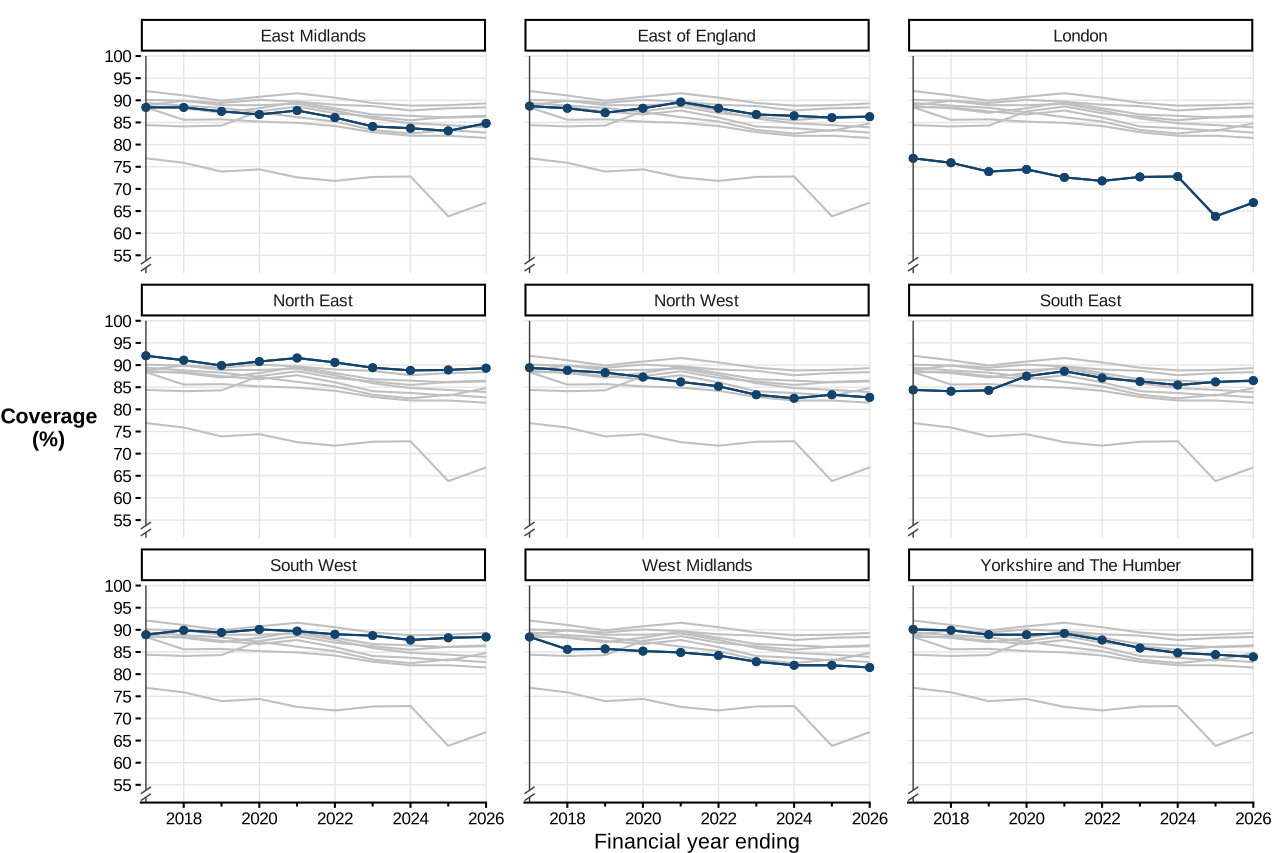
There was an increase in dTaP/IPV booster coverage in:
-
the East Midlands (1.7 percentage points)
-
the East of England (0.2 percentage points)
-
London (3.1 percentage points)
-
the North East (0.4 percentage points)
-
the South East (0.3 percentage points)
-
the South West (0.2 percentage points).
Figure 15. Coverage of the dTaP/IPV booster by region measured at 5 years from FY ending 2017 to FY ending 2026
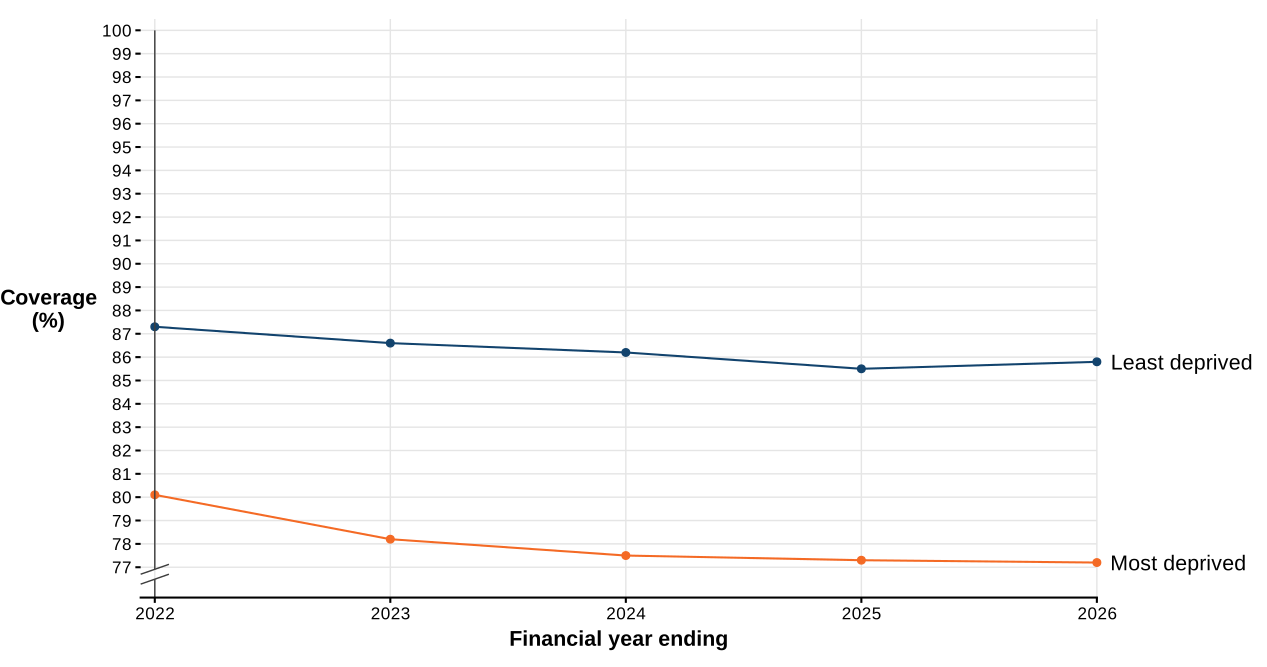
Based on the 2025 IMD scores at the UTLA level, in the 30 least deprived UTLAs, compared with the previous year, coverage of the dTaP/IPV booster increased by 0.3 percentage points to 85.8%. In comparison, in the 30 most deprived UTLAs, coverage of the dTaP/IPV booster decreased by 0.1 percentage points to 77.2% , which is 8.6 percentage points lower than the 30 least deprived UTLAs. The difference in coverage between these groups has been increasing in the last 5 years, with coverage in the least deprived group remaining relatively stable and coverage in the most deprived group decreasing (Figure 16).
Figure 16. Coverage of the primary course of the dTaP/IPV booster vaccine in the 30 most and least deprived local authorities in England, measured at 5 years
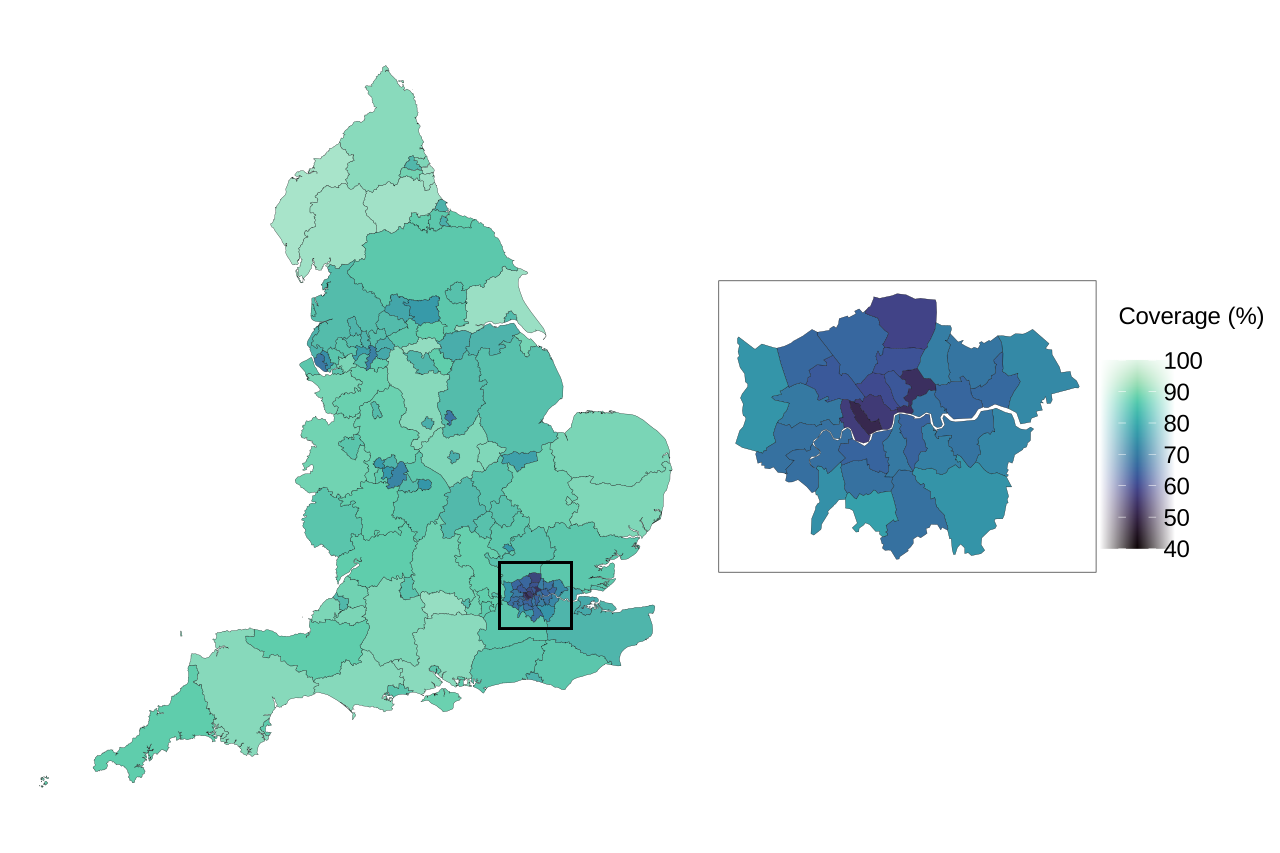
Coverage varies by geography. Full coverage data by country, region, and UTLA is contained in the supplementary data tables accompanying this report. Coverage for the dTaP/IPV booster for 2025 to 2026 by UTLA measured in children aged 5 years is presented in Figure 17.
Figure 17. Coverage of the dTaP/IPV booster measured in children aged 5 years in England for 2025 to 2026 by UTLA
Source of vaccine coverage data: UK Health Security Agency.
Source of boundaries: Office for National Statistics licensed under the Open Government Licence v.3.0 Contains OS data © Crown copyright and database right 2025.
Coverage of the dTaP/IPV booster measured at 5 years varies by UTLA. The data underlying Figure 17 is available in the supplementary data tables accompanying this report.
MMR1 vaccine in England
Coverage in children aged 24 months
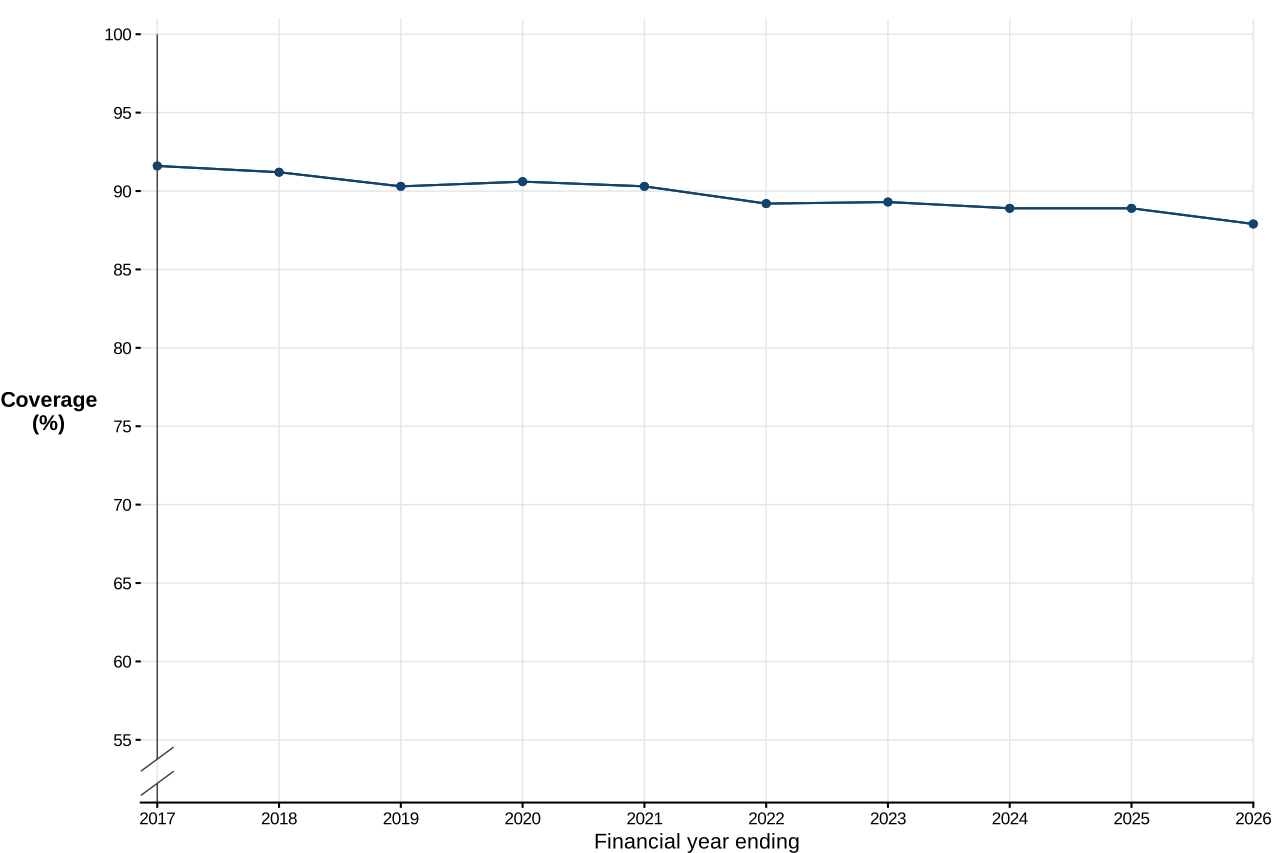
In England, 24-month coverage of the MMR1 vaccine decreased by 1.0 percentage point to 87.9%.
Across England excluding London (as the region with the lowest coverage), MMR1 vaccine coverage at 24 months was 89.7%, which is 1.8 percentage points higher than the overall England coverage.
In England over the last 10 years, coverage for the MMR1 vaccine peaked in 2016 to 2017 at 91.6%, 3.7 percentage points higher than the reporting year’s coverage of 87.9% (Figure 18).
Figure 18. Coverage of the MMR1 vaccine in England measured at 24 months from FY ending 2017 to FY ending 2026
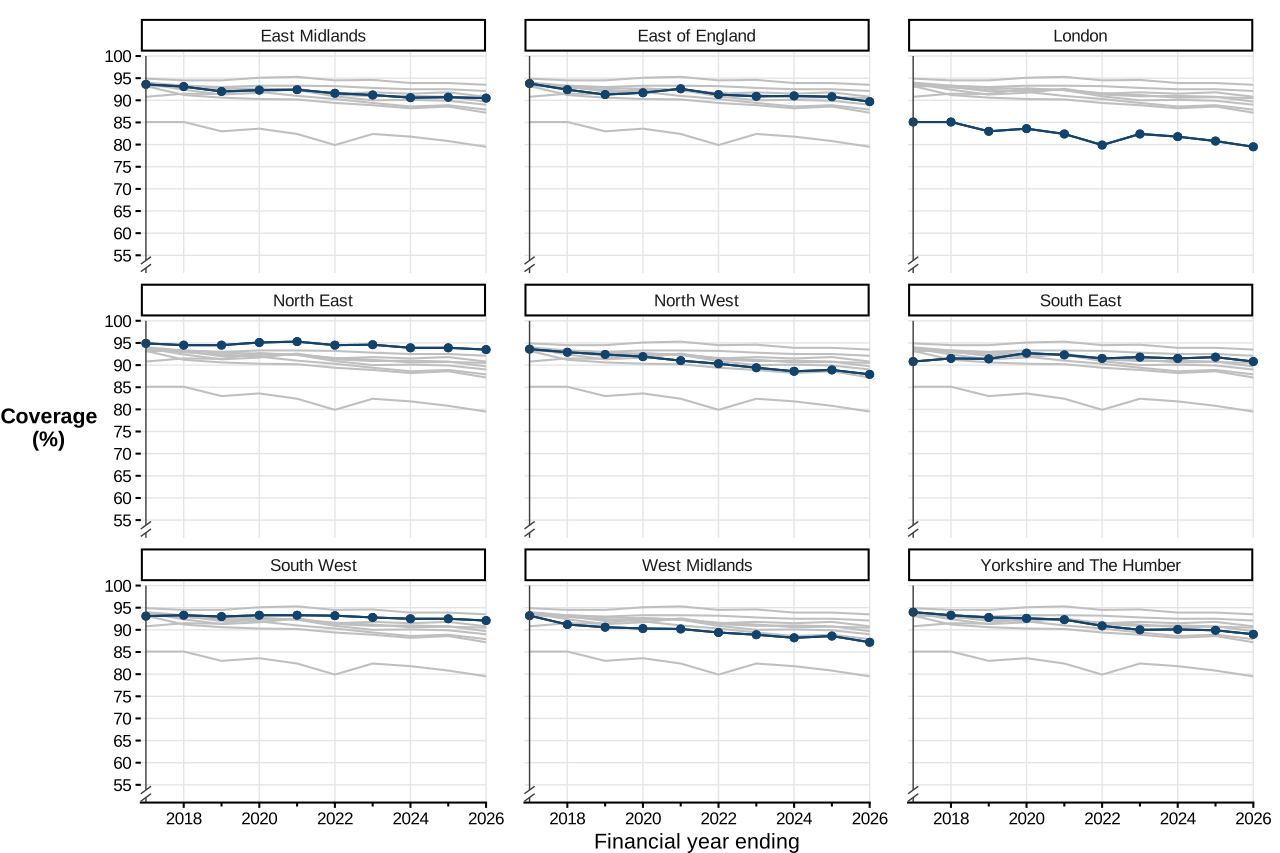
Compared with the previous year, MMR1 vaccine coverage decreased in:
-
the East Midlands (0.2 percentage points)
-
the East of England (1.1 percentage points)
-
London (1.3 percentage points)
-
the North East (0.4 percentage points)
-
the North West (1.0 percentage points)
-
the South East (1.0 percentage points)
-
the South West (0.4 percentage points)
-
the West Midlands (1.4 percentage points)
-
Yorkshire and the Humber (0.9 percentage points).
Figure 19. Coverage of the MMR1 vaccine by region measured at 24 months from FY ending 2017 to FY ending 2026
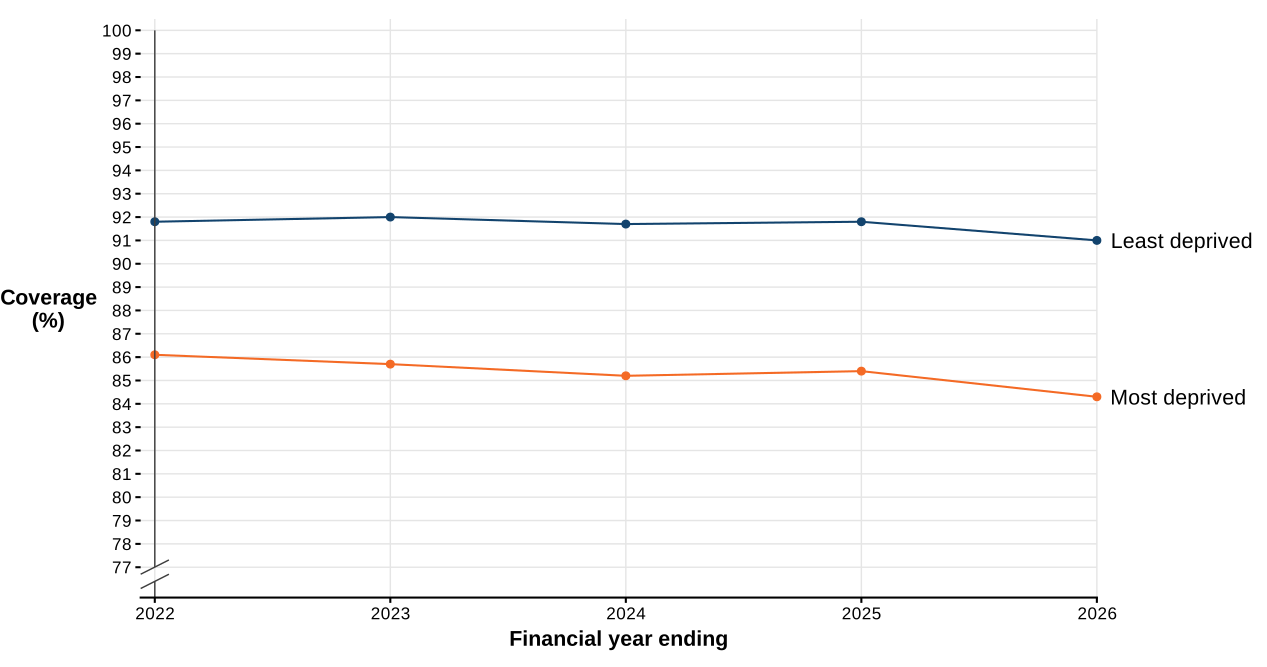
Based on the 2025 IMD scores at the UTLA level, in the 30 least deprived UTLAs, compared with the previous year, coverage of the MMR1 decreased by 0.8 percentage points to 91.0%. In comparison, in the 30 most deprived UTLAs, coverage of the MMR1 decreased by 1.1 percentage points to 84.3%, which is 6.7 percentage points lower than the 30 least deprived UTLAs (Figure 20).
Figure 20. Coverage of the primary course of the MMR1 vaccine in the 30 most and least deprived local authorities in England, measured at 24 months
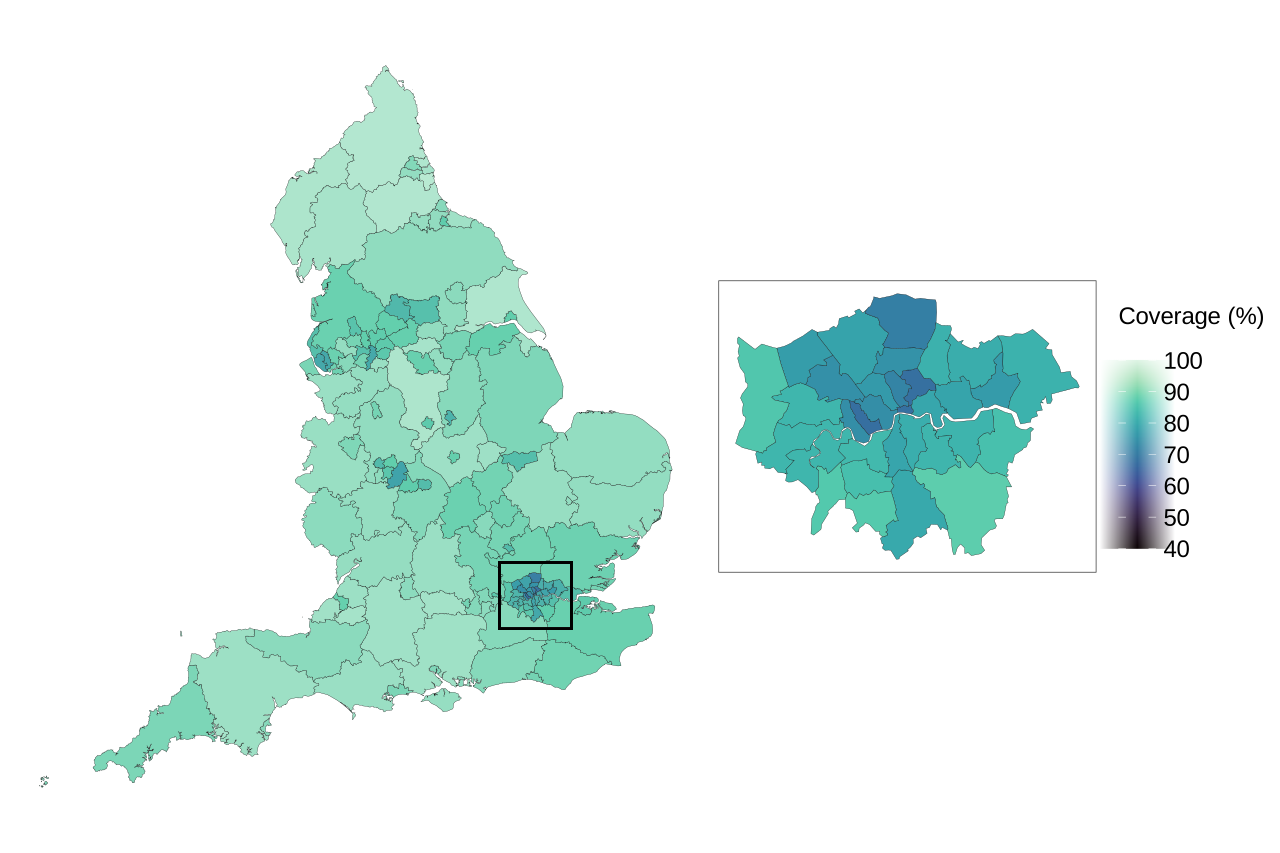
Coverage varies by geography. Full coverage data by country, region, and UTLA is contained in the supplementary data tables accompanying this report.
Coverage for the MMR1 vaccine for 2025 to 2026 by UTLA measured in children aged 24 months is presented in Figure 21.
Figure 21. Coverage of the MMR1 vaccine measured in children aged 24 months in England for 2025 to 2026 by UTLA
Source of vaccine coverage data: UK Health Security Agency.
Source of boundaries: Office for National Statistics licensed under the Open Government Licence v.3.0 Contains OS data © Crown copyright and database right 2025.
Coverage of the MMR1 vaccine measured at 24 months varies by UTLA. The data underlying Figure 21 is available in the supplementary data tables accompanying this report.
Coverage in children aged 5 years
In England, 5-year coverage of the MMR1 increased by 0.3 percentage points to 92.1%.
Across England excluding London (as the region with the lowest coverage), MMR1 coverage at 5 years was 93.6%, which is 1.5 percentage points higher than the overall England coverage.
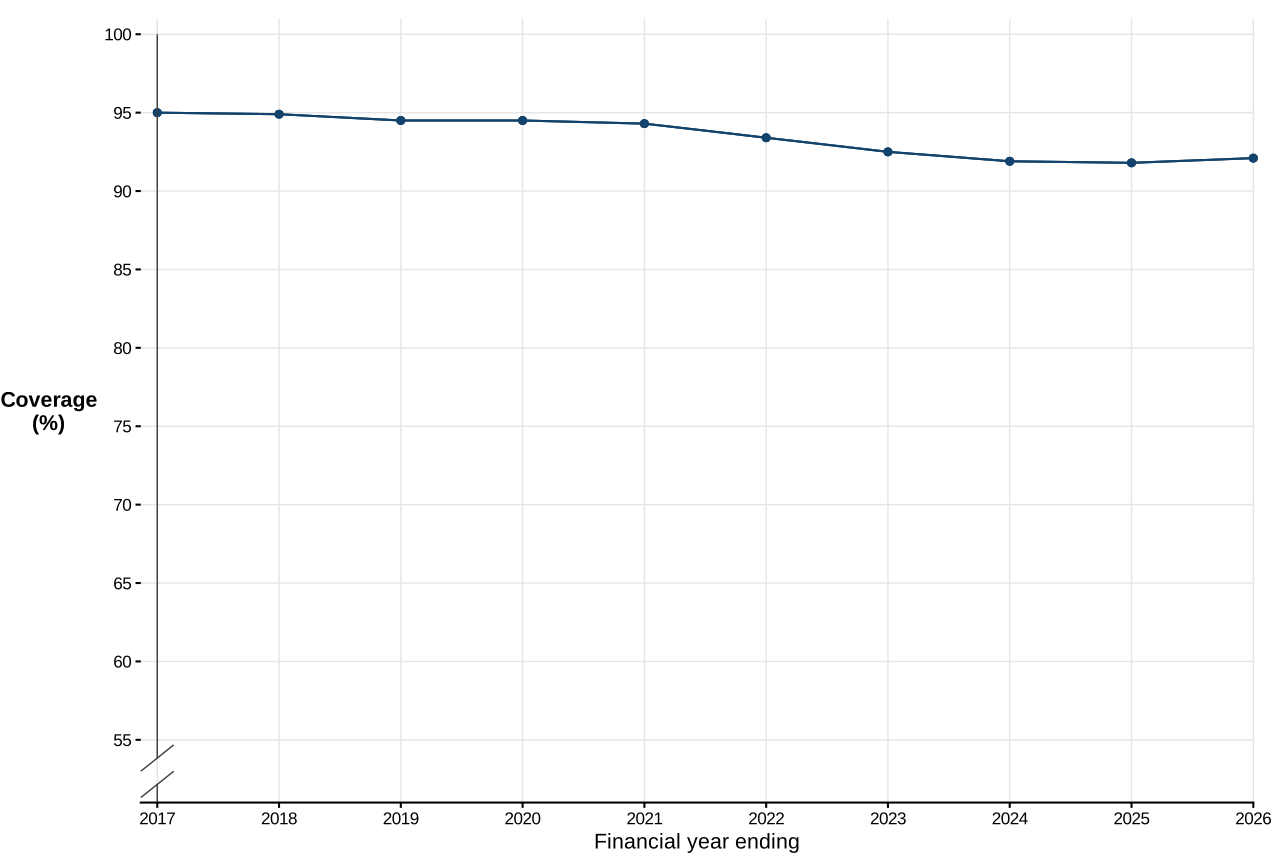
In England over the last 10 years, coverage for the MMR1 vaccine peaked in 2016 to 2017 at 95.0%, 2.9 percentage points higher than the reporting year’s coverage of 92.1% (Figure 22).
Figure 22. Coverage of the MMR1 vaccine in England measured at 5 years from FY ending 2017 to FY ending 2026
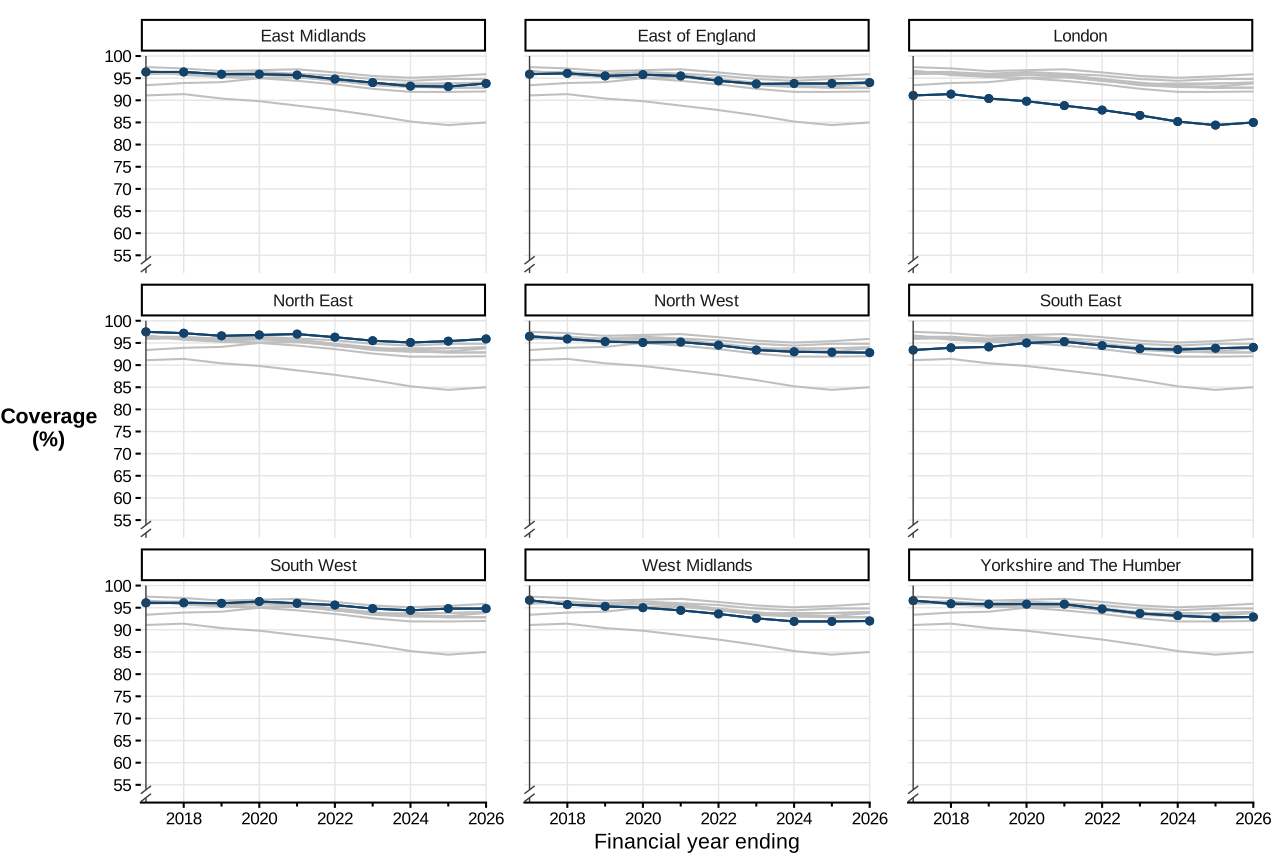
Compared with the previous year, MMR1 coverage decreased in the North West (0.1 percentage points).
There was an increase in MMR1 coverage in:
-
the East Midlands (0.7 percentage points)
-
the East of England (0.2 percentage points)
-
London (0.6 percentage points)
-
the North East (0.5 percentage points)
-
the South East (0.2 percentage points)
-
the West Midlands (0.1 percentage points)
-
Yorkshire and the Humber (0.1 percentage points).
In the South West, MMR1 coverage remained stable.
Improvements in coverage may reflect national and regional MMR catch-up activities conducted in England between November 2023 and April 2024.
Figure 23. Coverage of the MMR1 vaccine by regions measured at 5 years from FY ending 2017 to FY ending 2026
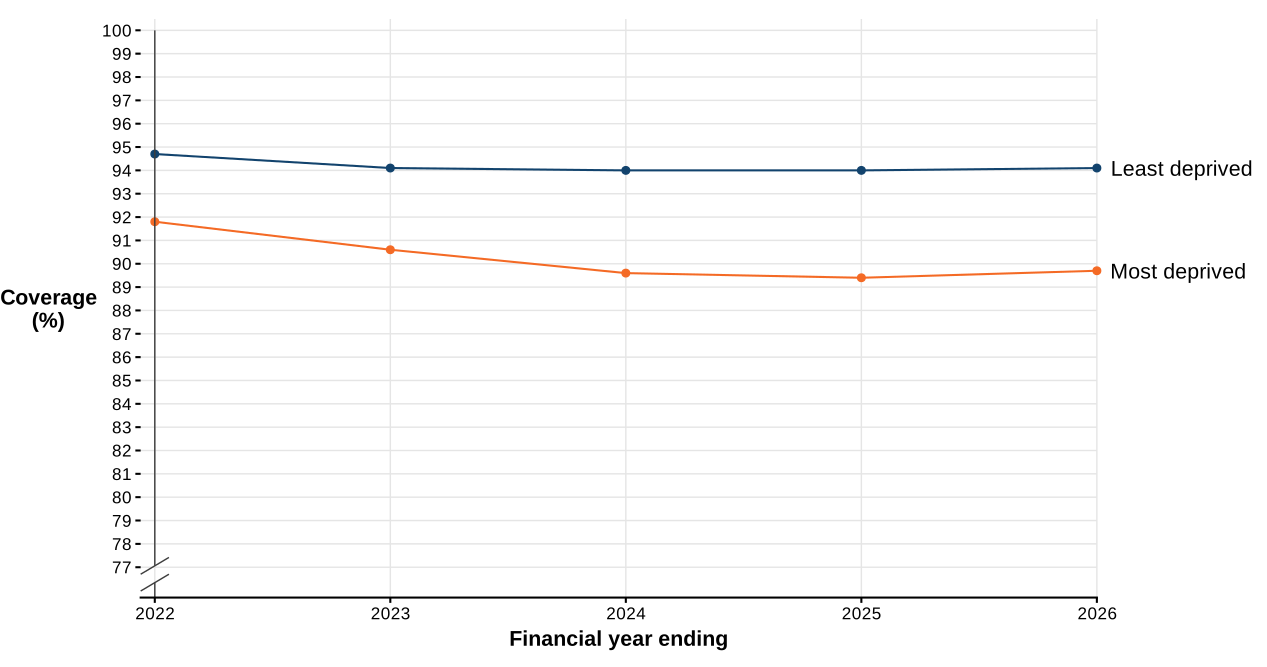
Based on the 2025 IMD scores at the UTLA level, in the 30 least deprived UTLAs, compared with the previous year, coverage of the MMR1 increased by 0.1 percentage points to 94.1%. Similarly, in the 30 most deprived UTLAs, coverage of the MMR1 increased by 0.3 percentage points to 89.7%, which is 4.4 percentage points lower than the 30 least deprived UTLAs (Figure 24).
Figure 24. Coverage of the primary course of the MMR1 vaccine in the 30 most and least deprived local authorities in England, measured at 5 years
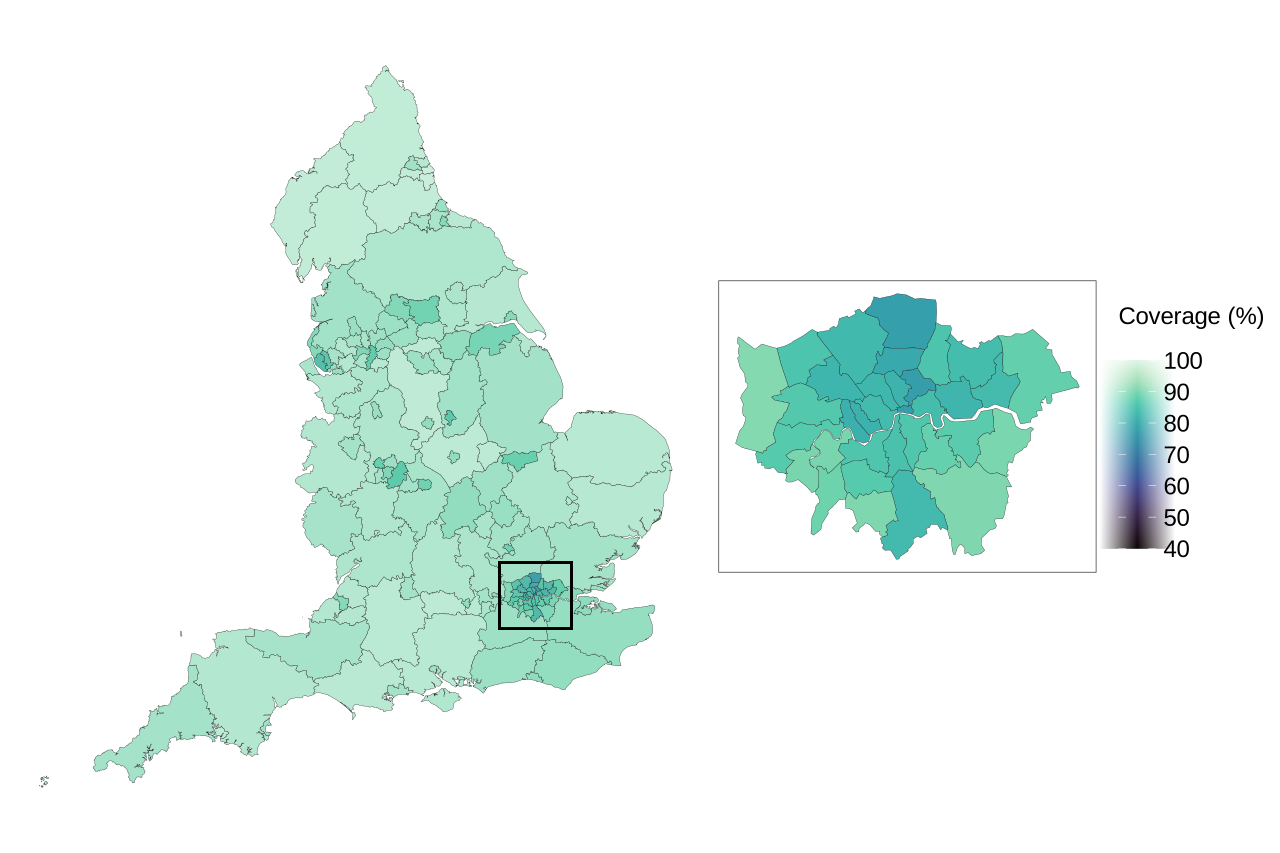
Coverage varies by geography. Full coverage data by country, region, and UTLA is contained in the supplementary data tables accompanying this report. Coverage for the MMR1 vaccine for 2025 to 2026 by UTLA measured in children aged 5 years is presented in Figure 25.
Figure 25. Coverage of the MMR1 vaccine measured in children aged 5 years in England for 2025 to 2026 by UTLA
Source of vaccine coverage data: UK Health Security Agency.
Source of boundaries: Office for National Statistics licensed under the Open Government Licence v.3.0 Contains OS data © Crown copyright and database right 2025.
Coverage of the MMR1 vaccine measured at 5 years varies by UTLA. The data underlying Figure 25 is available in the supplementary data tables accompanying this report.
MMR2 vaccine in England
Coverage in children aged 5 years
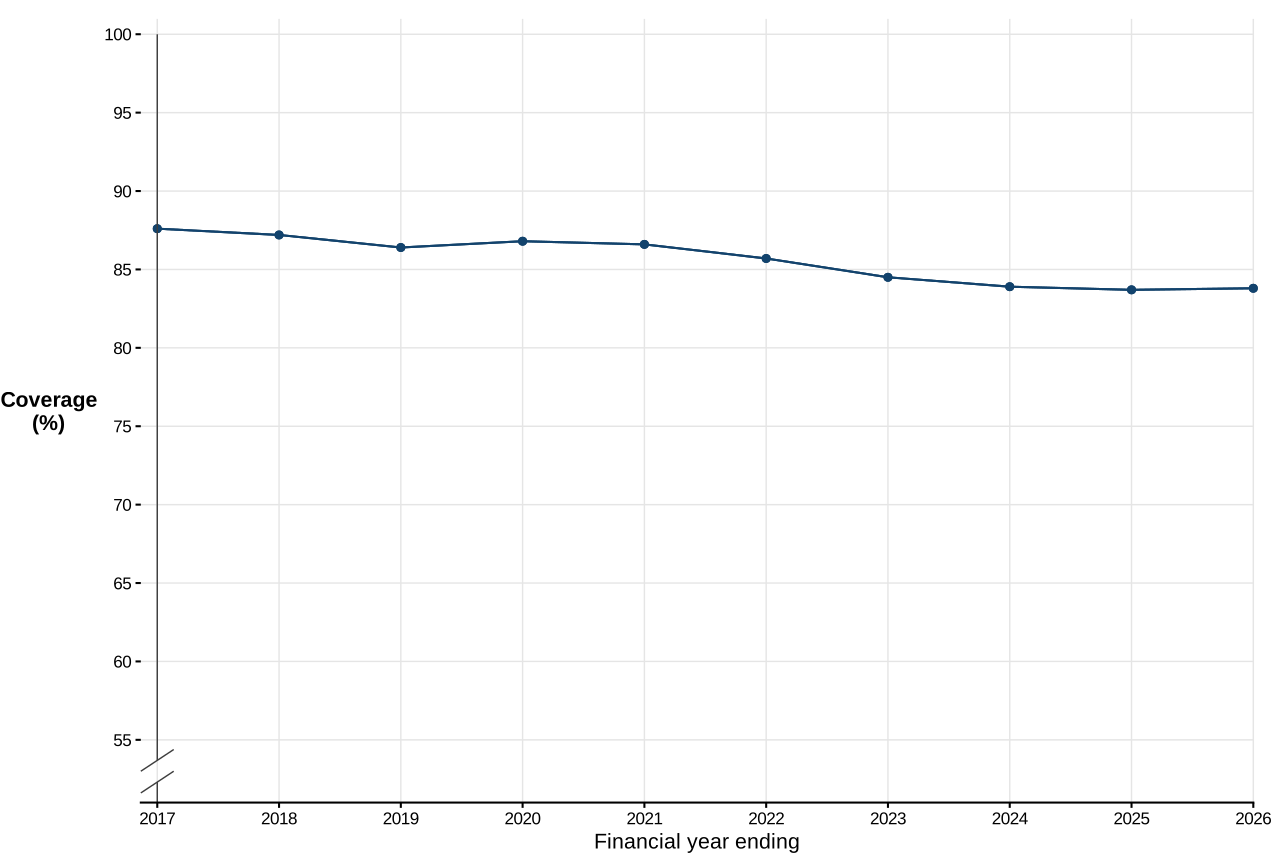
In England, 5-year coverage of the MMR2 vaccine increased by 0.1 percentage points to 83.8%.
Across England excluding London (as the region with the lowest coverage), MMR2 vaccine coverage at 5 years was 86.5%, which is 2.7 percentage points higher than the overall England coverage.
In England over the last 10 years, coverage for the MMR2 vaccine peaked in 2016 to 2017 at 87.6%, 3.8 percentage points higher than the reporting year’s coverage of 83.8%.
Figure 26. Coverage of the MMR2 vaccine in England measured at 5 years from FY ending 2017 to FY ending 2026
Compared with the previous year, MMR2 vaccine coverage decreased in:
-
the North West (0.7 percentage points)
-
the South West (0.1 percentage points)
-
the West Midlands (0.6 percentage points)
-
Yorkshire and the Humber (0.7 percentage points).
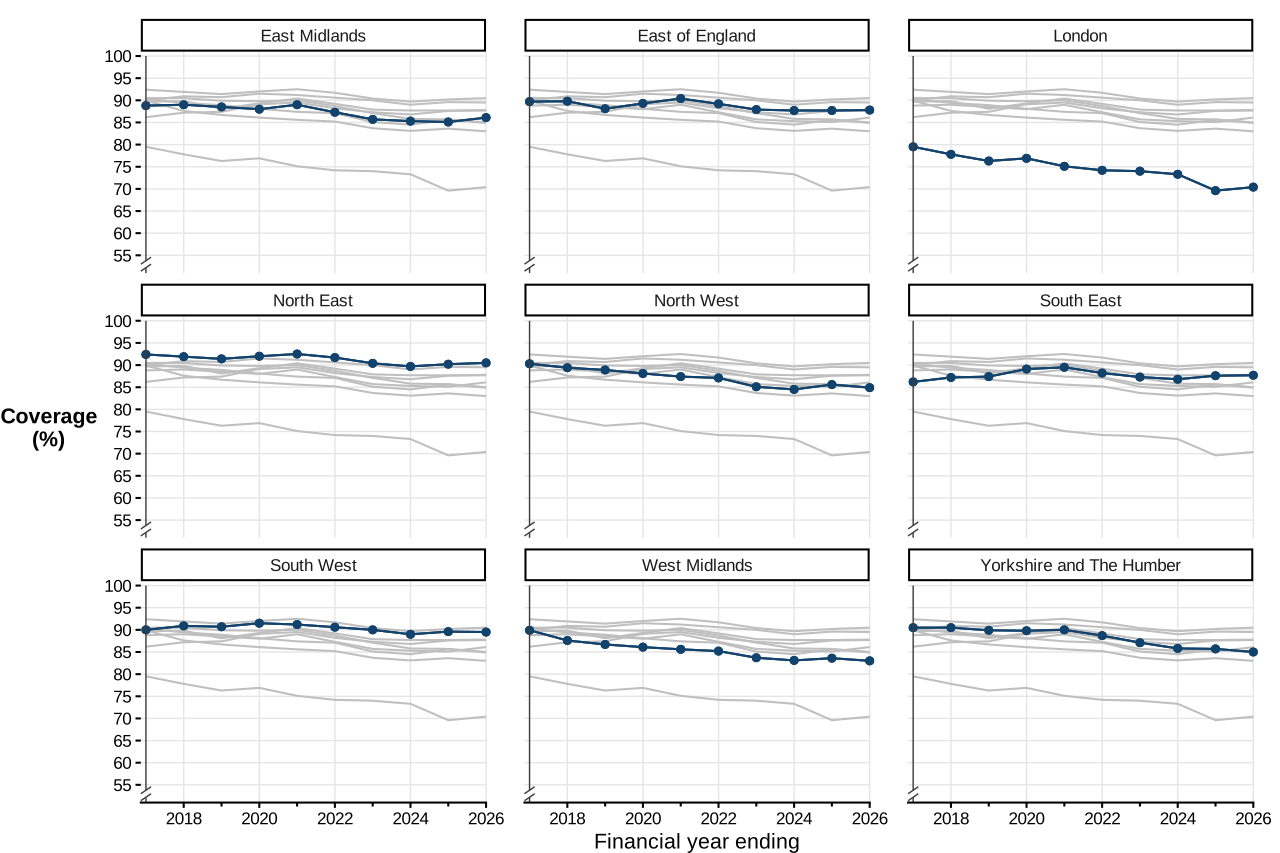
There was an increase in MMR2 vaccine coverage in:
-
the East Midlands (1.0 percentage point)
-
the East of England (0.1 percentage points)
-
London (0.8 percentage points)
-
the North East (0.3 percentage points)
-
the South East (0.1 percentage points).
Improvements in coverage may reflect national and regional MMR catch-up activities conducted in England between November 2023 and April 2024.
Figure 27. Coverage of the MMR2 vaccine by region measured at 5 years from FY ending 2017 to FY ending 2026
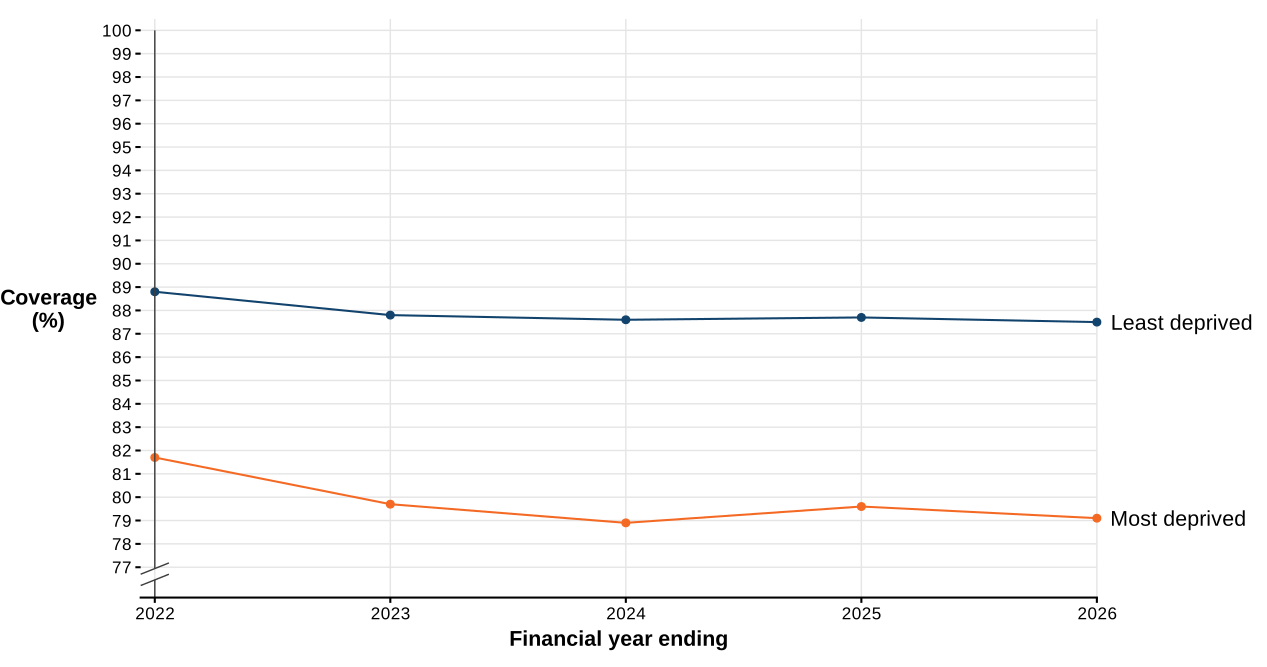
Based on the 2025 IMD scores at the UTLA level, in the 30 least deprived UTLAs, compared with the previous year, coverage of the MMR2 decreased by 0.2 percentage points to 87.5% . In comparison, in the 30 most deprived UTLAs, coverage of the MMR2 decreased by 0.5 percentage points to 79.1%, which is 8.4 percentage points lower than the 30 least deprived UTLAs (Figure 28).
Figure 28. Coverage of the primary course of the MMR2 vaccine in the 30 most and least deprived local authorities in England, measured at 24 months
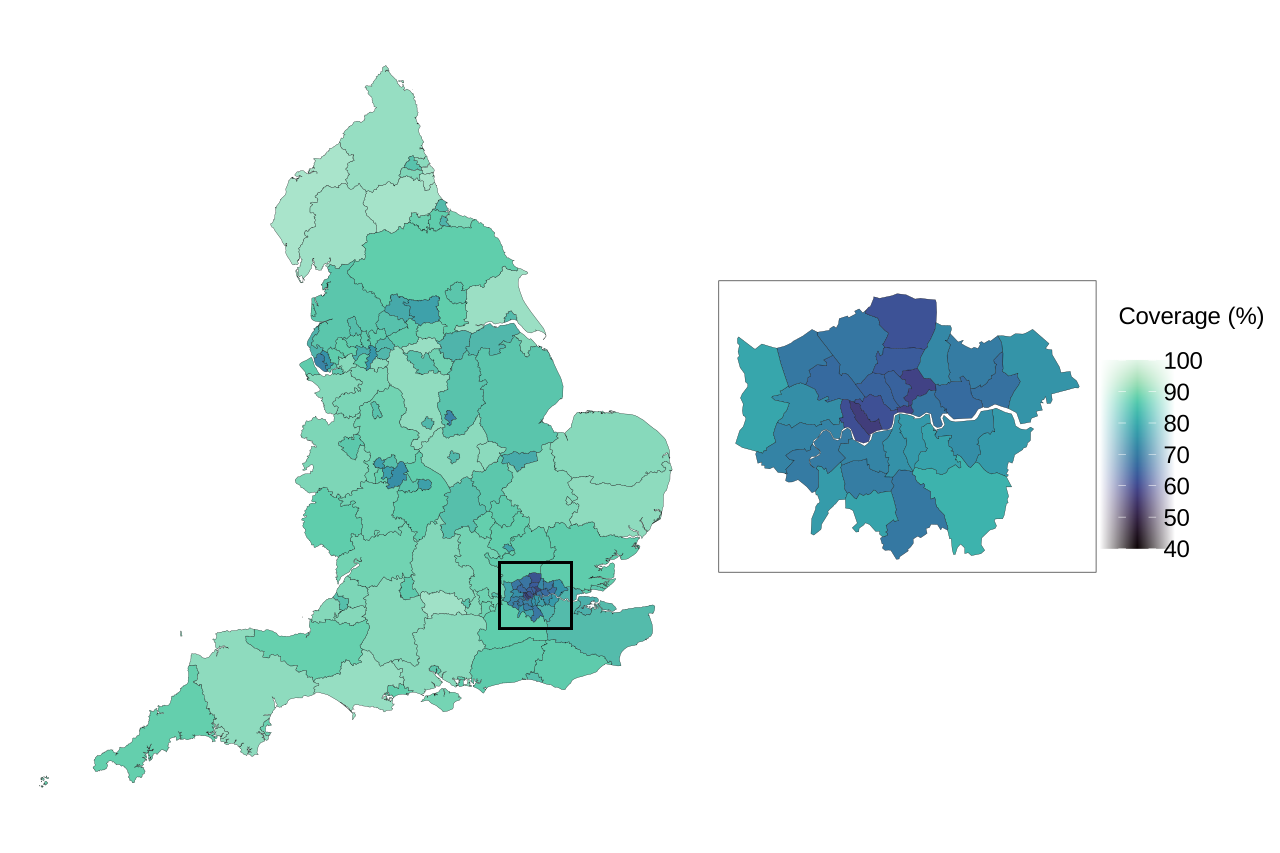
Coverage varies by geography. Full coverage data by country, region, and UTLA is contained in the supplementary data tables accompanying this report. Coverage for the MMR2 vaccine for 2025 to 2026 by UTLA measured in children aged 5 years is presented in Figure 29.
Figure 29. Coverage of the MMR2 vaccine measured in children aged 5 years in England for 2025 to 2026 by UTLA
Source of vaccine coverage data: UK Health Security Agency.
Source of boundaries: Office for National Statistics licensed under the Open Government Licence v.3.0 Contains OS data © Crown copyright and database right 2025.
Coverage of the MMR2 vaccine measured at 5 years varies by UTLA. The data underlying Figure 29 is available in the supplementary data tables accompanying this report.
Rotavirus vaccine in England
Coverage in children aged 12 months
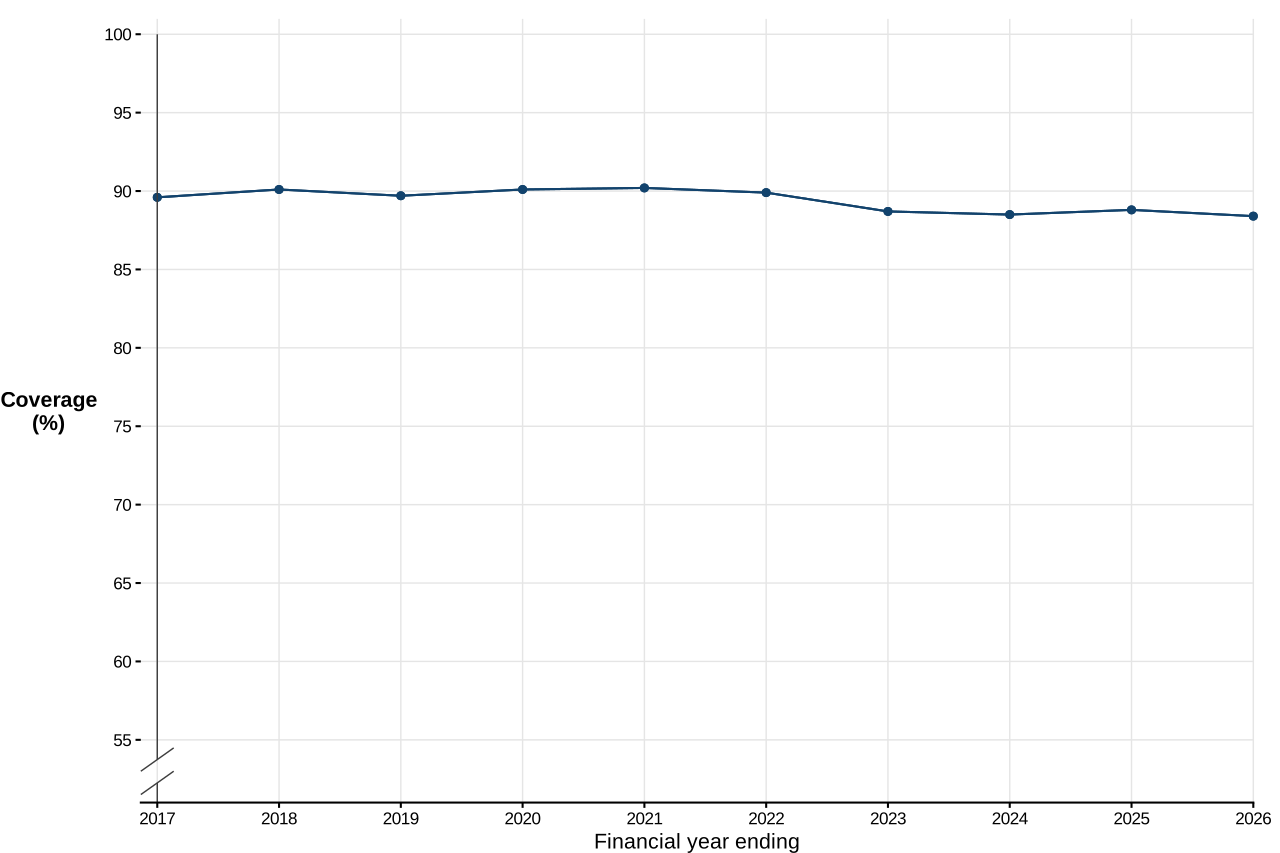
In England, 12-month coverage of the rotavirus vaccine decreased by 0.4 percentage points to 88.4%.
Across England excluding London (as the region with the lowest coverage), rotavirus vaccine coverage at 12 months was 89.5%, which is 1.1 percentage points higher than the overall England coverage.
In England over the last 10 years, coverage for the rotavirus vaccine peaked in 2020 to 2021 at 90.2%, 1.8 percentage points higher than the reporting year’s coverage of 88.4% (Figure 30).
Figure 30. Coverage of the rotavirus vaccine in England measured at 12 months from FY ending 2017 to FY ending 2026
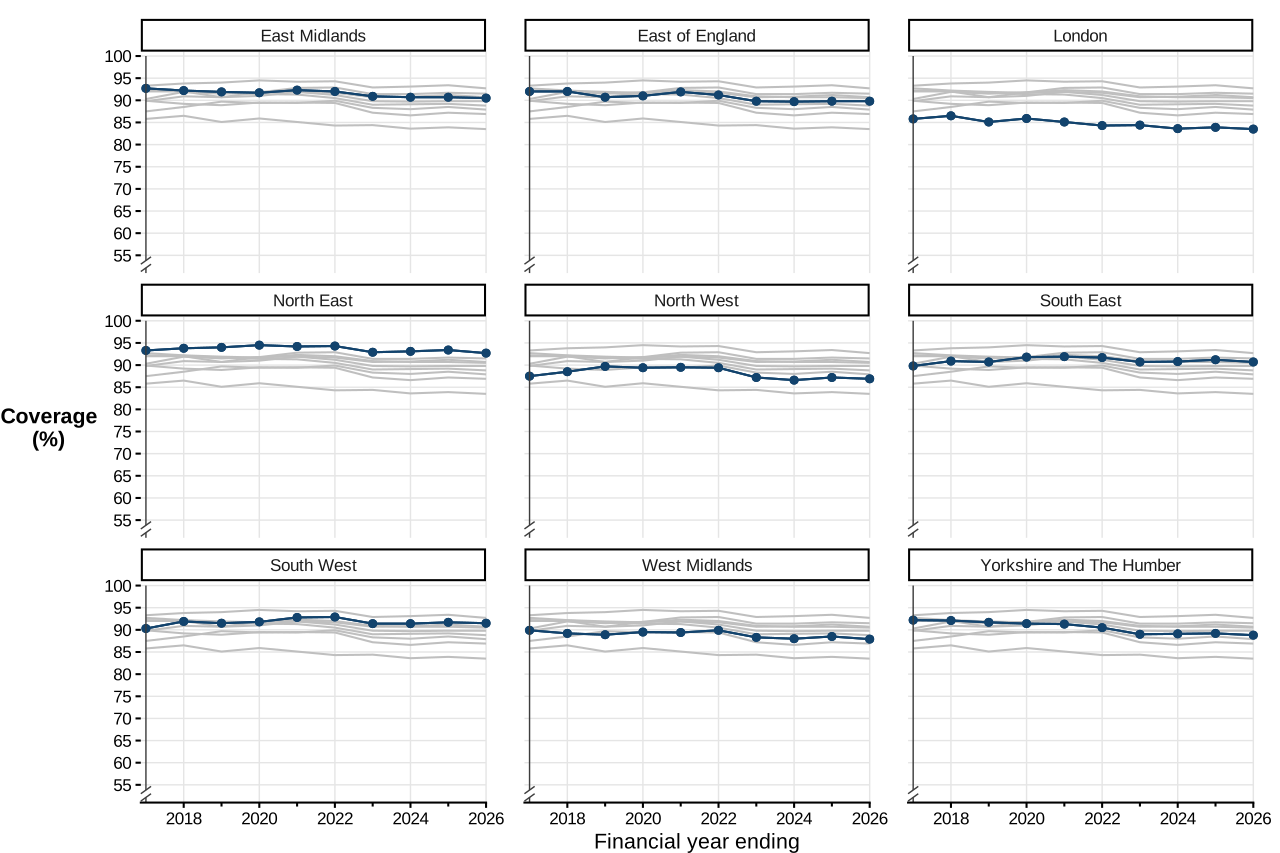
Compared with the previous year, rotavirus vaccine coverage decreased in:
-
the East Midlands (0.2 percentage points)
-
London (0.4 percentage points)
-
the North East (0.7 percentage points)
-
the North West (0.3 percentage points)
-
the South East (0.5 percentage points)
-
the South West (0.2 percentage points)
-
the West Midlands (0.6 percentage points)
-
Yorkshire and the Humber (0.4 percentage points).
In the East of England, rotavirus coverage remained stable.
Figure 31. Coverage of the rotavirus vaccine by region measured at 12 months from FY ending 2017 to FY ending 2026
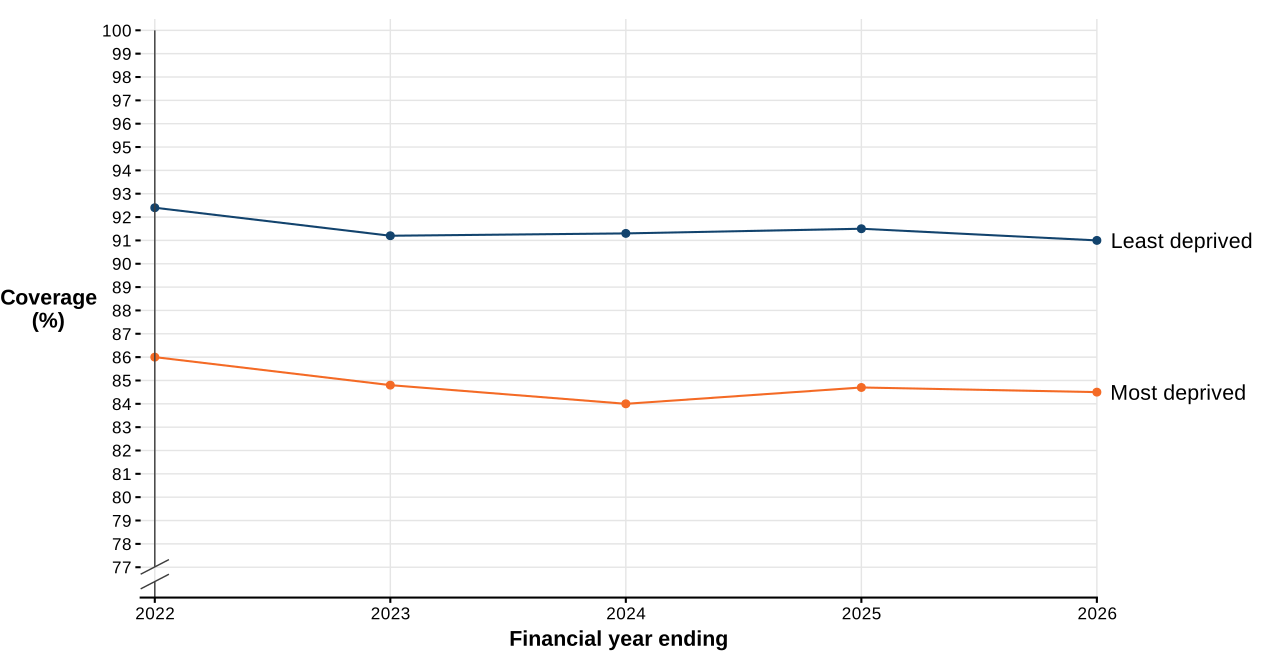
Based on the 2025 IMD scores at the UTLA level, in the 30 least deprived UTLAs, compared with the previous year, coverage of the rotavirus decreased by 0.5 percentage points to 91.0%. In comparison, in the 30 most deprived UTLAs, coverage of the rotavirus decreased by 0.2 percentage points to 84.5%, which is 6.5 percentage points lower than the 30 least deprived UTLAs (Figure 32).
Figure 32. Coverage of the primary course of the rotavirus vaccine in the 30 most and least deprived local authorities in England, measured at 12 months
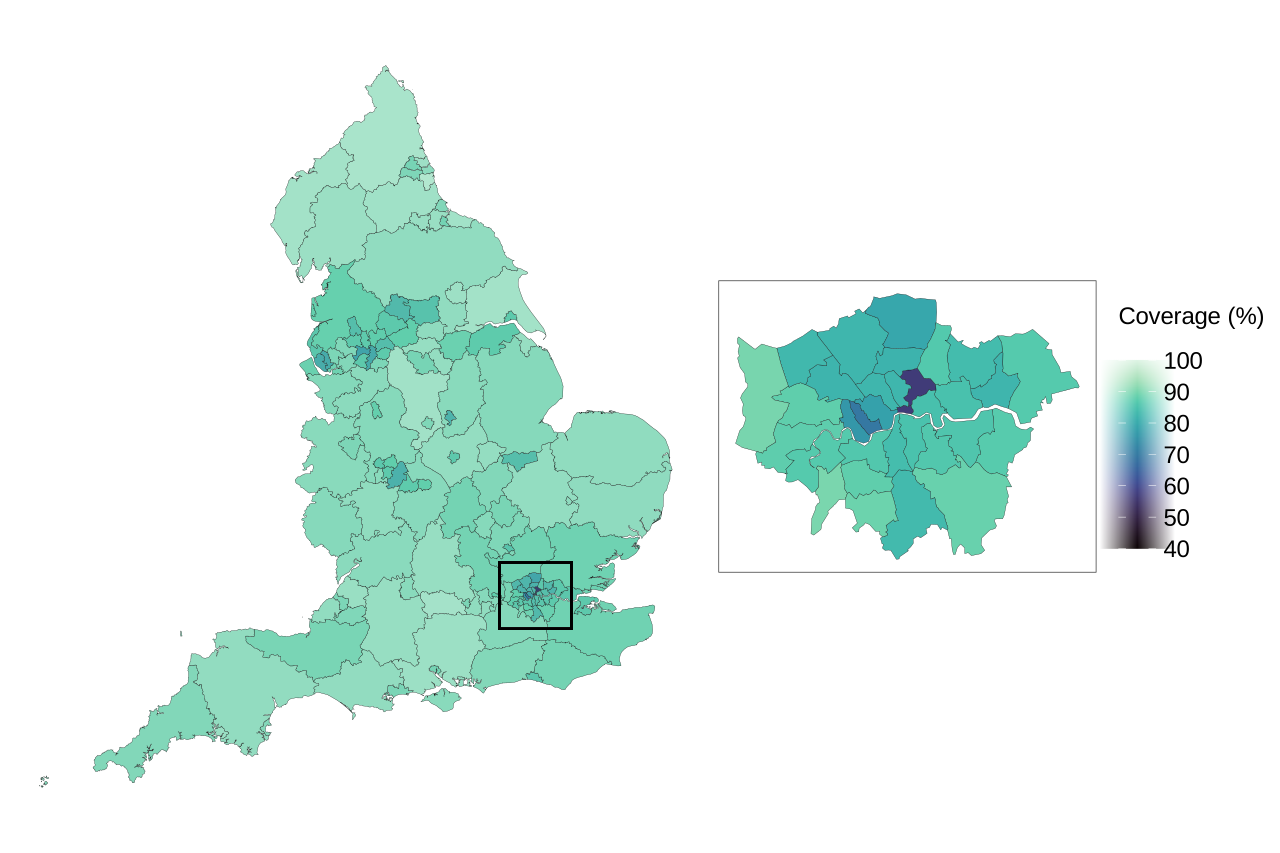
Coverage varies by geography. Full coverage data by country, region, and UTLA is contained in the supplementary data tables accompanying this report. Coverage for the rotavirus vaccine for 2025 to 2026 by UTLA measured in children aged 12 months is presented in Figure 33.
Figure 33. Coverage of the rotavirus vaccine measured in children aged 12 months in England for 2025 to 2026 by UTLA
Source of vaccine coverage data: UK Health Security Agency.
Source of boundaries: Office for National Statistics licensed under the Open Government Licence v.3.0 Contains OS data © Crown copyright and database right 2025.
Coverage of the rotavirus vaccine measured at 12 months varies by UTLA. The data underlying Figure 33 is available in the supplementary data tables accompanying this report.
PCV in England
Coverage in children aged 12 months
In England, 12-month coverage of PCV decreased by 0.9 percentage points to 92.2%.
Across England excluding London (as the region with the lowest coverage), PCV coverage at 12 months was 93.3%, which is 1.1 percentage points higher than the overall England coverage.
In England over the last 10 years, coverage for PCV peaked at peaked in 2021 to 2022 at 93.8%, 1.6 percentage points higher than the reporting year’s coverage of 92.2% (Figure 34).
Figure 34. Coverage of PCV in England measured at 12 months from FY ending 2017 to FY ending 2026 [note 2]
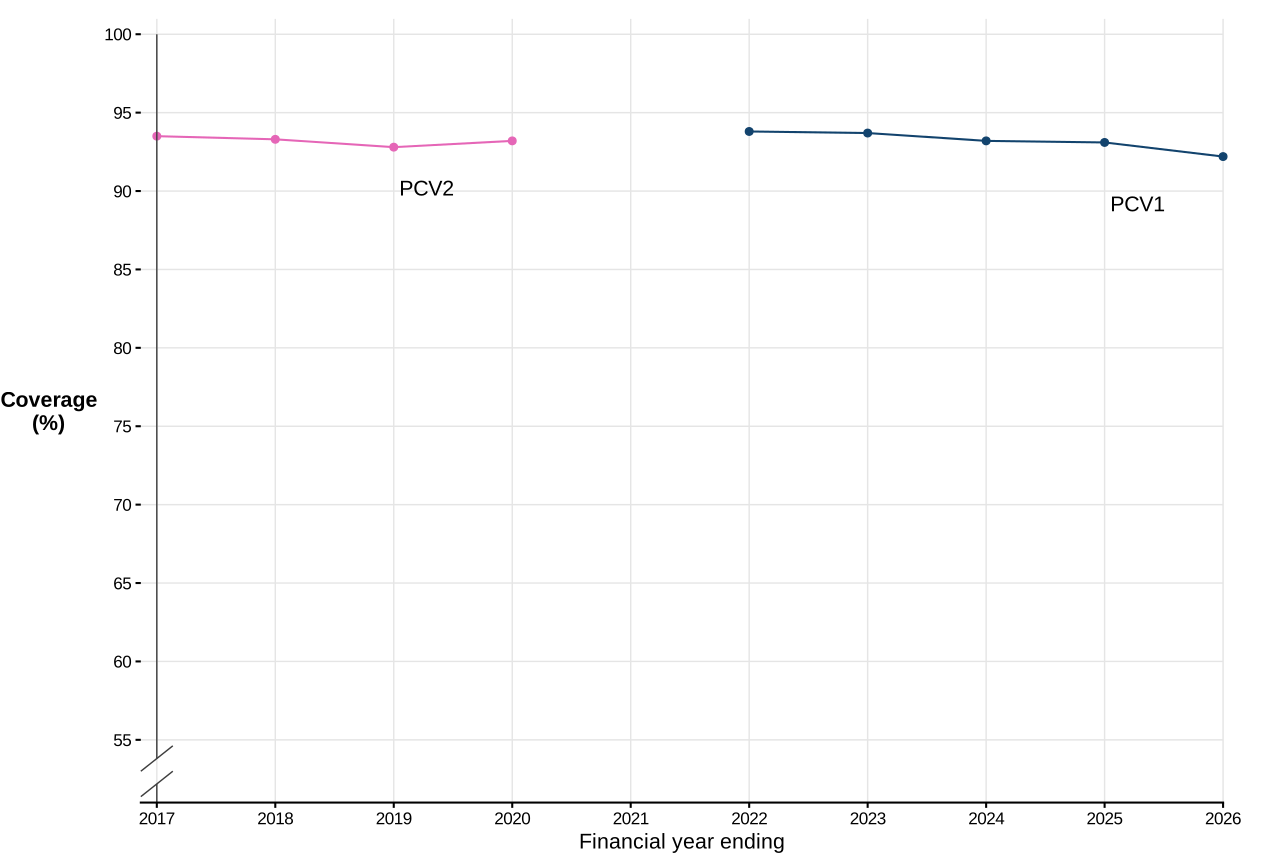
Note 2: from quarter 4 (January to March) 2020 to 2021, PCV1 rather than PCV2 is reported to reflect the change in the PCV schedule.
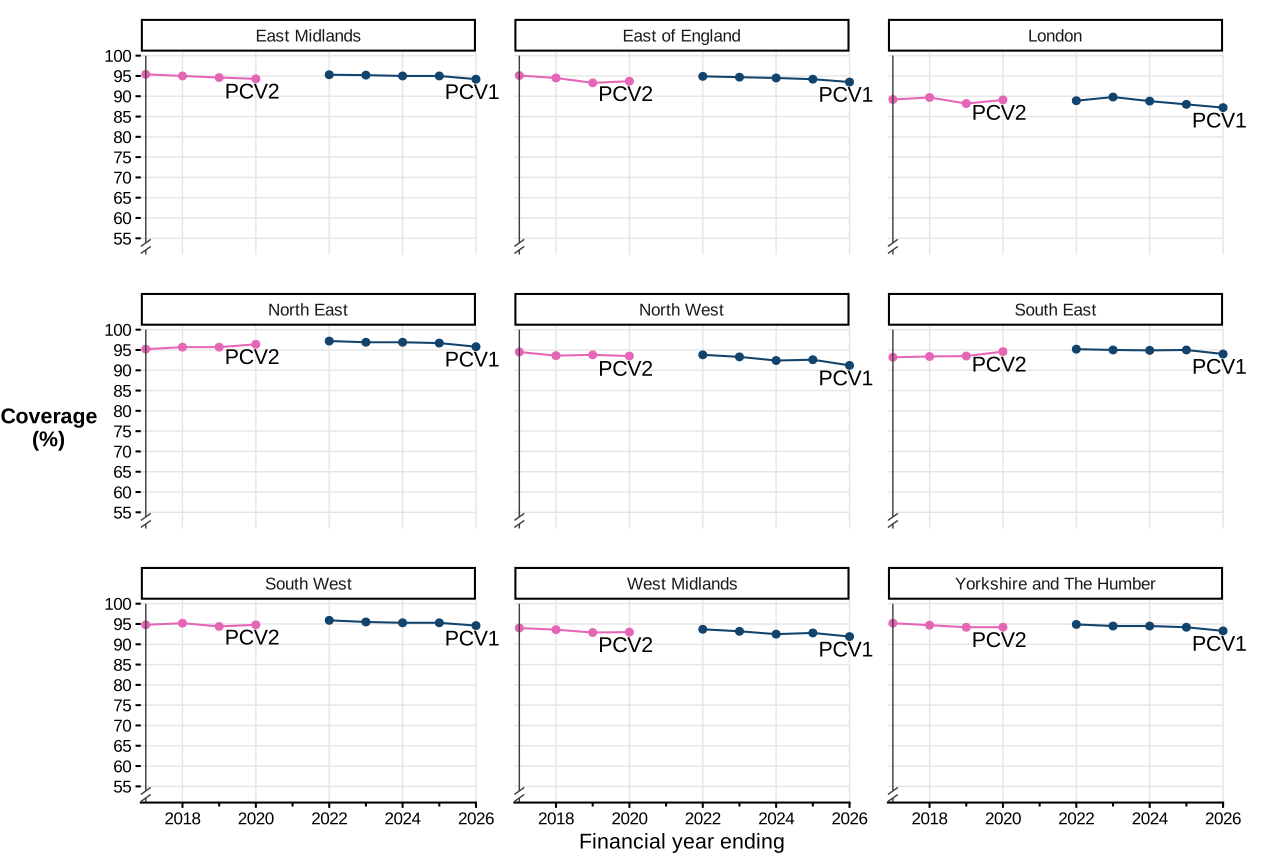
Compared with the previous year, PCV coverage decreased in all regions:
-
the East Midlands (0.8 percentage points)
-
the East of England (0.7 percentage points)
-
London (0.8 percentage points)
-
the North East (0.9 percentage points)
-
the North West (1.4 percentage points)
-
the South East (1.0 percentage points)
-
the South West (0.7 percentage points)
-
the West Midlands (0.9 percentage points)
-
Yorkshire and the Humber (0.9 percentage points).
Figure 35. Coverage of the PCV vaccine by region measured at 12 months from FY ending 2017 to FY ending 2026 [note 2]
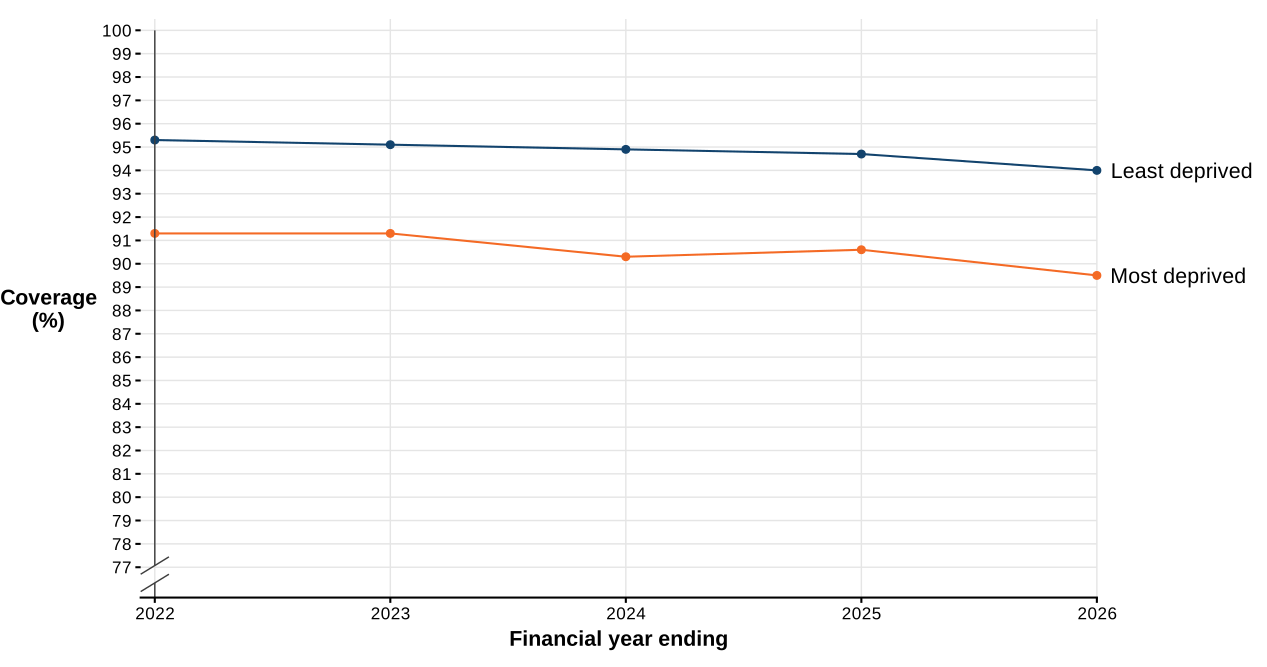
Based on the 2025 IMD scores at the UTLA level, in the 30 least deprived UTLAs, compared with the previous year, coverage of the PCV1 decreased by 0.7 percentage points to 94.0%. In comparison, in the 30 most deprived UTLAs, coverage of the PCV1 decreased by 1.1 percentage points to 89.5%, which is 4.5 percentage points lower than the 30 least deprived UTLAs. The difference in coverage between these groups has been increasing in the last 5 years, with coverage in the most deprived consistently lower and with larger decreases (Figure 36).
Figure 36. Coverage of the primary course of the PCV1 vaccine in the 30 most and least deprived local authorities in England, measured at 12 months
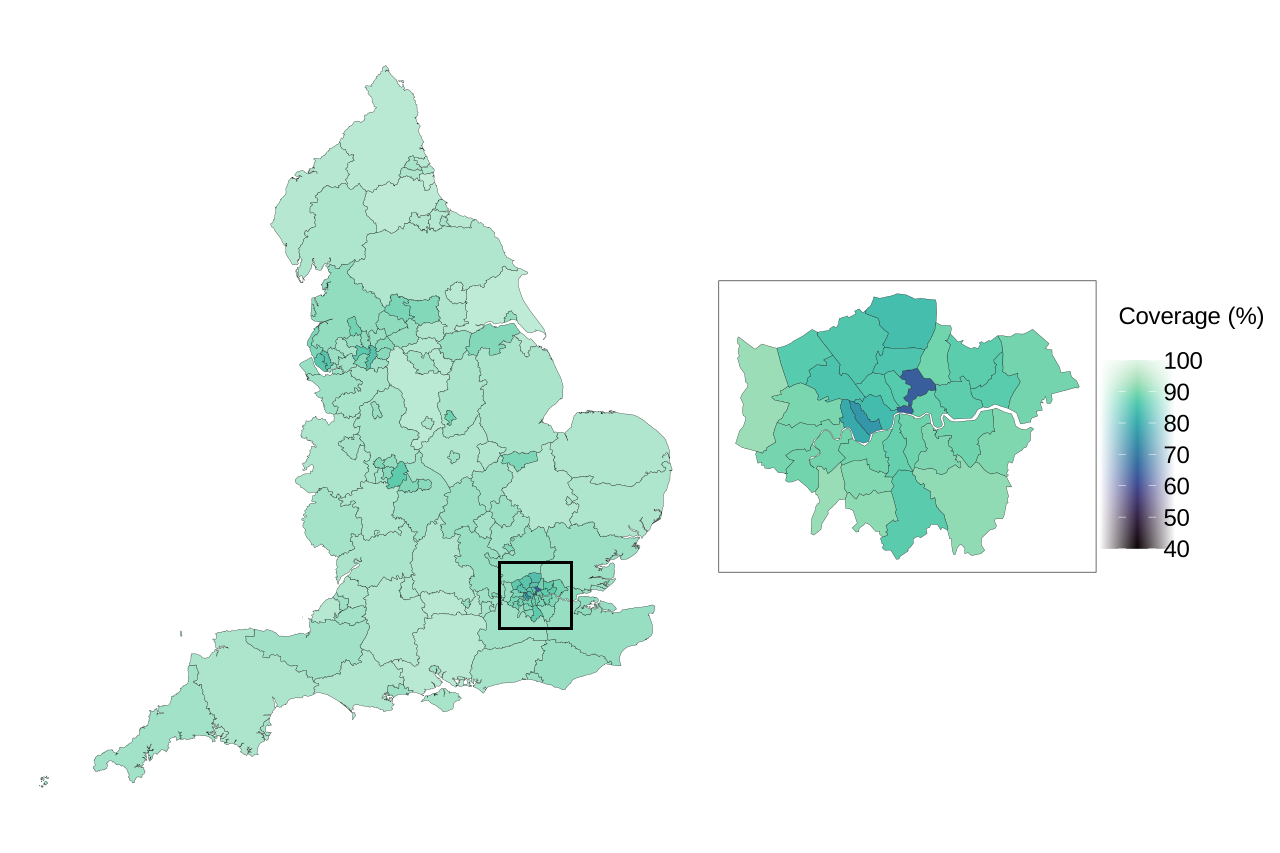
Coverage varies by geography. Full coverage data by country, region, and UTLA is contained in the supplementary data tables accompanying this report. Coverage for PCV for 2025 to 2026 by UTLA measured in children aged 12 months is presented in Figure 37.
Figure 37. Coverage of PCV1 measured in children aged 12 months in England for 2025 to 2026 by UTLA
Source of vaccine coverage data: UK Health Security Agency.
Source of boundaries: Office for National Statistics licensed under the Open Government Licence v.3.0 Contains OS data © Crown copyright and database right 2025.
Coverage of PCV measured at 12 months varies by UTLA. The data underlying Figure 37 is available in the supplementary data tables accompanying this report.
PCV booster in England
Coverage in children aged 24 months
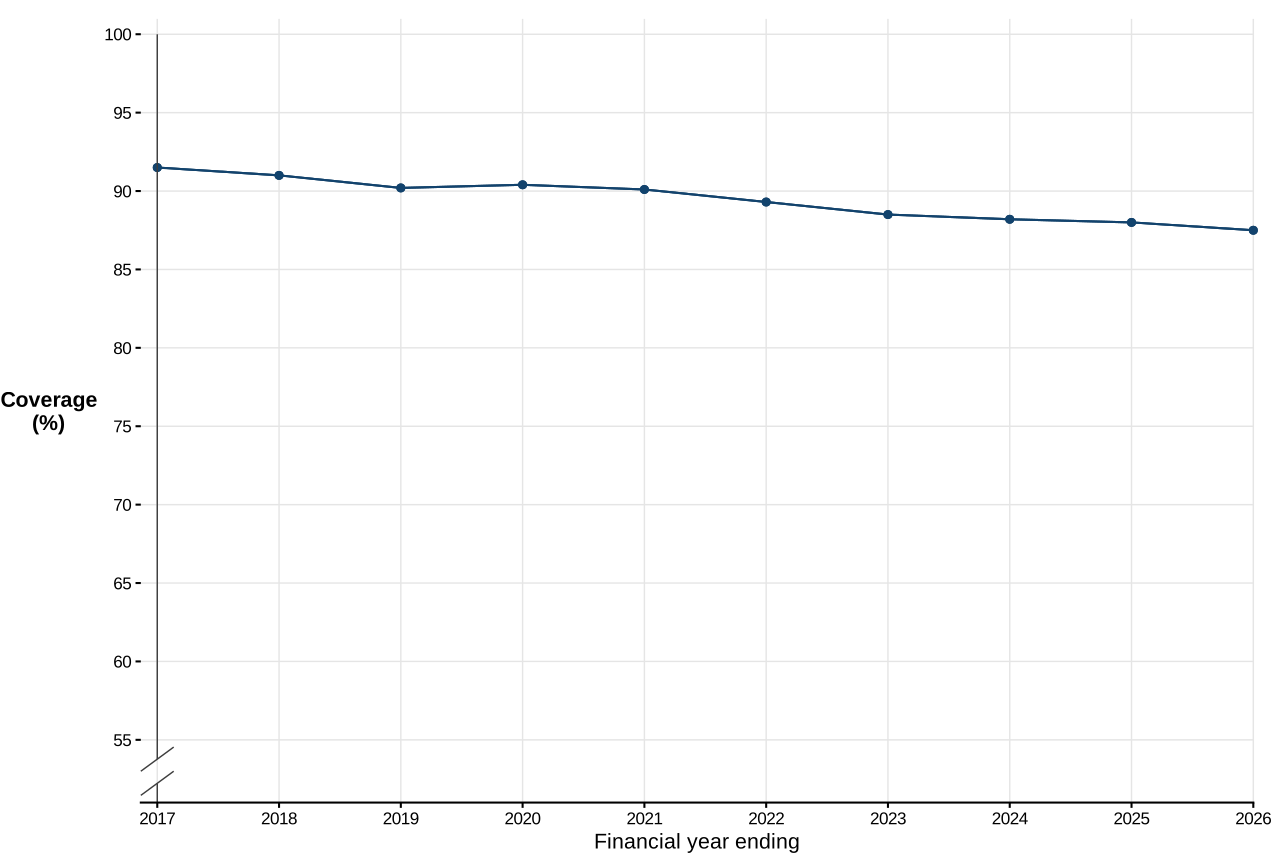
In England, 24-month coverage of the PCV booster decreased by 0.5 percentage points to 87.5%.
Across England excluding London (as the region with the lowest coverage), PCV booster coverage at 24 months was 89.4%, which is 1.9 percentage points higher than the overall England coverage.
In England over the last 10 years, coverage for the PCV booster peaked in 2016 to 2017 at 91.5%, 4.0 percentage points higher than the reporting year’s coverage of 87.5% (Figure 38).
Figure 38. Coverage of the PCV booster in England measured at 24 months from FY ending 2017 to FY ending 2026
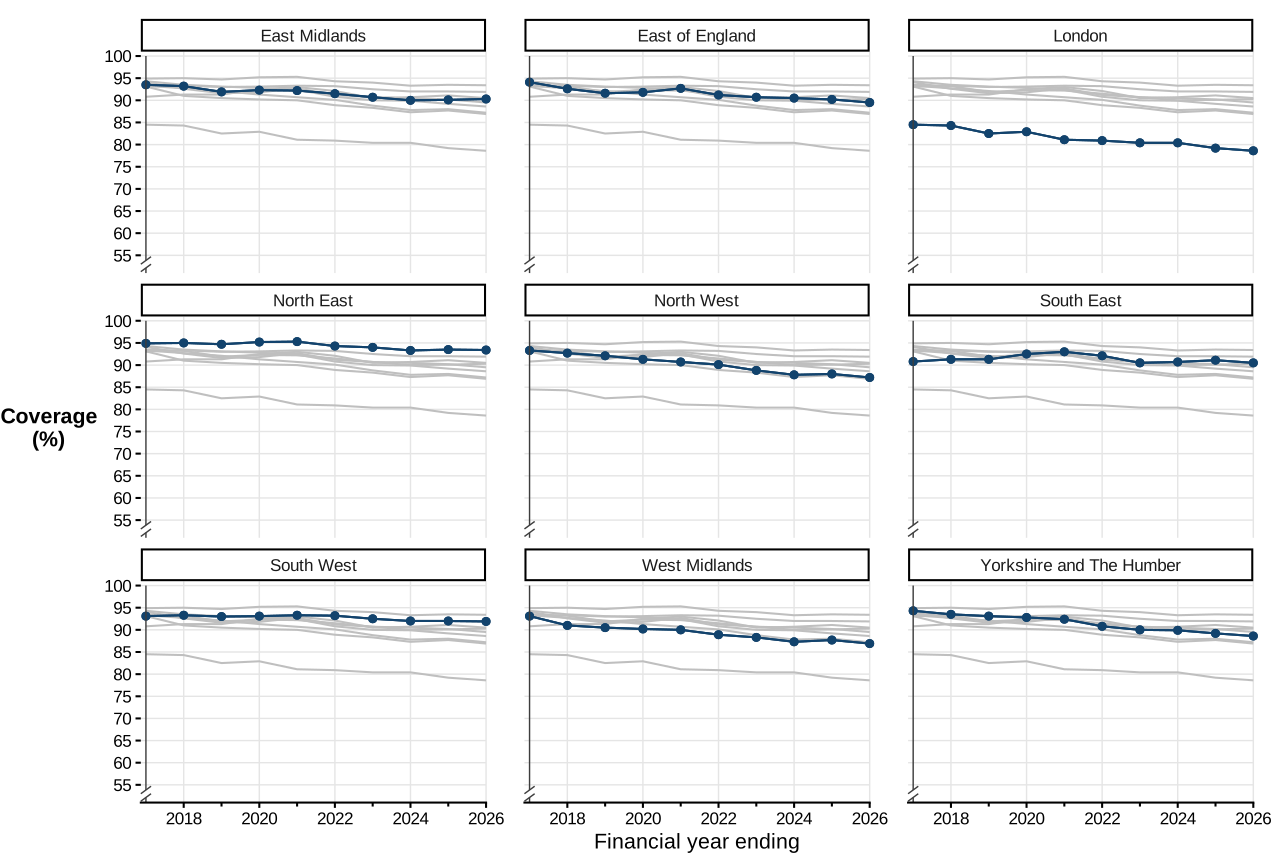
Compared with the previous year, PCV booster coverage decreased in:
-
the East of England (0.7 percentage points)
-
London (0.6 percentage points)
-
the North East (0.1 percentage points)
-
the North West (0.8 percentage points)
-
the South East (0.6 percentage points)
-
the South West (0.1 percentage points)
-
the West Midlands (0.8 percentage points)
-
Yorkshire and the Humber (0.6 percentage points).
There was an increase in PCV booster coverage in the East Midlands (0.2 percentage points).
Figure 39. Coverage of the PCV booster by region measured at 24 months from FY ending 2017 to FY ending 2026
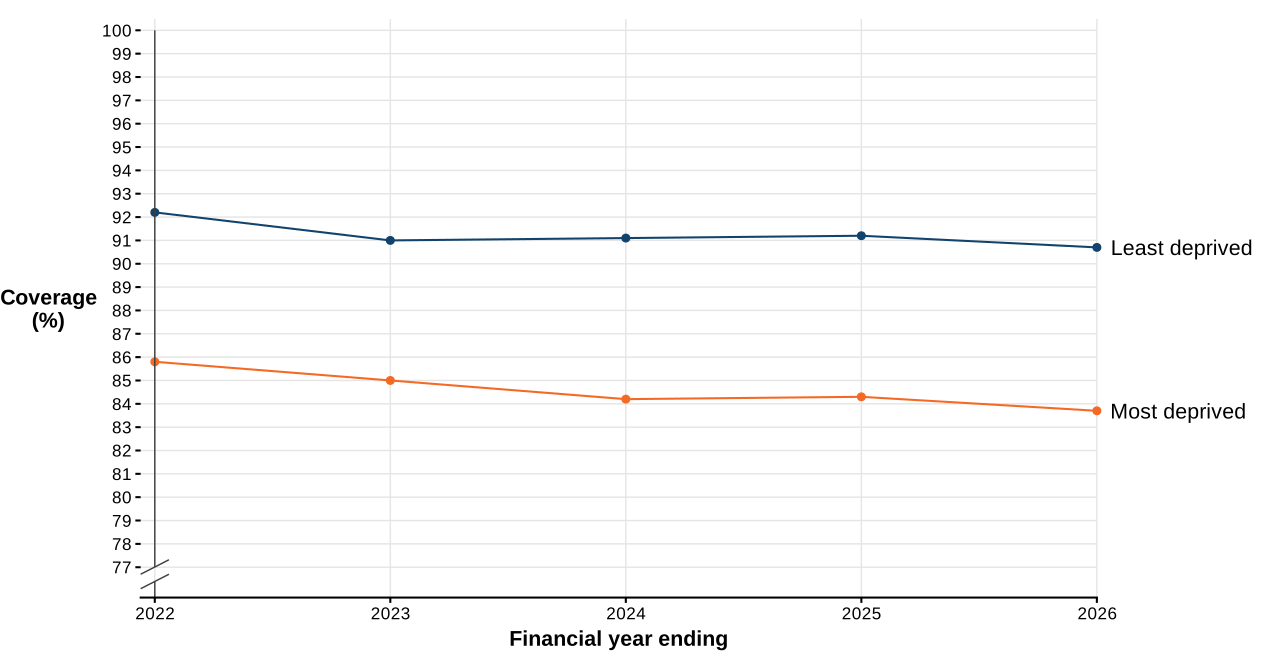
Based on the 2025 IMD scores at the UTLA level, in the 30 least deprived UTLAs, compared with the previous year, coverage of the PCV booster decreased by 0.5 percentage points to 90.7%. In comparison, in the 30 most deprived UTLAs, coverage of the PCV booster decreased by 0.6 percentage points to 83.7%, which is 7 percentage points lower than the 30 least deprived UTLAs (Figure 40).
Figure 40. Coverage of the primary course of the PCV booster vaccine in the 30 most and least deprived local authorities in England, measured at 24 months
Coverage varies by geography. Full coverage data by country, region, and UTLA is contained in the supplementary data tables accompanying this report. Coverage for PCV booster for 2025 to 2026 by UTLA measured in children aged 24 months is presented in Figure 41.
Figure 41. Coverage of the PCV booster measured in children aged 24 months in England for 2025 to 2026 by UTLA
MenB vaccine in England
Coverage in children aged 12 months
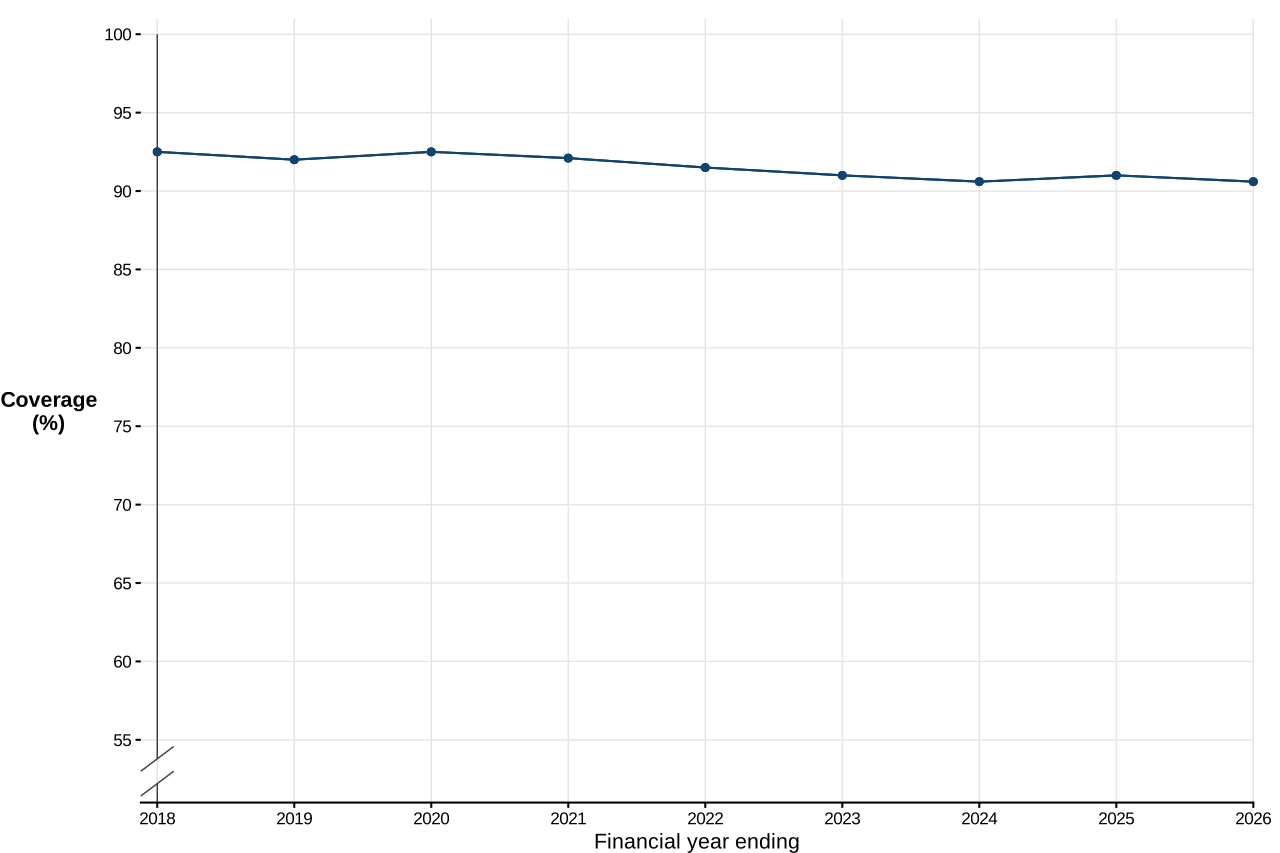
In England, 12-month coverage of the MenB vaccine decreased by 0.4 percentage points to 90.6%.
Across England excluding London (as the region with the lowest coverage), MenB coverage at 12 months was 91.8%, which is 1.2 percentage points higher than the overall England coverage.
In England over the last 10 years, coverage for the MenB vaccine peaked in 2019 to 2020 at 92.5%, 1.9 percentage points higher than the reporting year’s coverage of 90.6% (Figure 42).
Figure 42. Coverage of the MenB vaccine in England measured at 12 months from FY ending 2017 to FY ending 2026
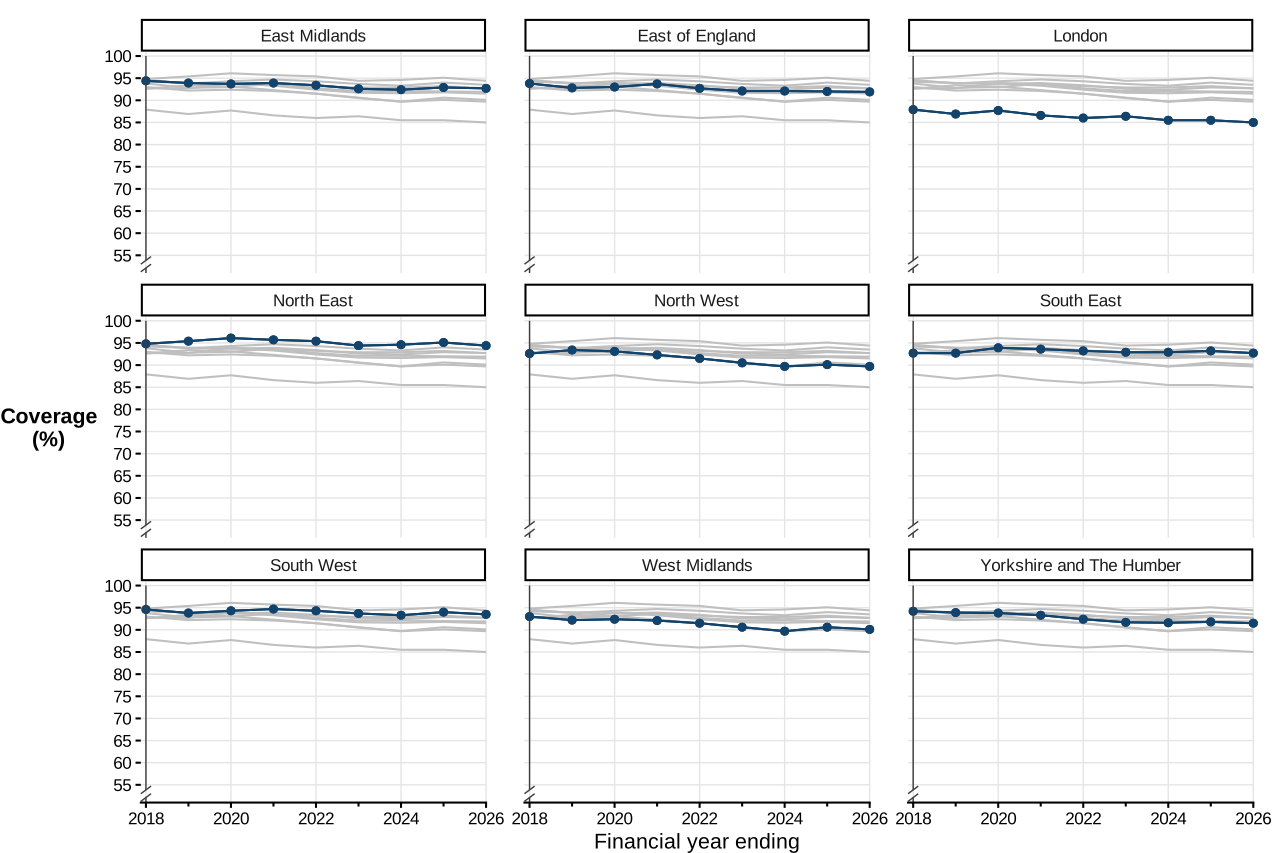
Compared with the previous year, MenB coverage decreased in all regions:
-
the East Midlands (0.2 percentage points)
-
the East of England (0.1 percentage points)
-
London (0.5 percentage points)
-
the North East (0.7 percentage points)
-
the North West (0.4 percentage points)
-
the South East (0.5 percentage points)
-
the South West (0.5 percentage points)
-
the West Midlands (0.5 percentage points)
-
Yorkshire and the Humber (0.3 percentage points).
Figure 43. Coverage of the MenB vaccine by regions measured at 12 months from FY ending 2017 to FY ending 2026
Based on the 2025 IMD scores at the UTLA level, in the 30 least deprived UTLAs, compared with the previous year, coverage of the MenB decreased by 0.6 percentage points to 92.8%. In comparison, in the 30 most deprived UTLAs, coverage of the MenB decreased by 0.2 percentage points to 87.5%, which is 5.3 percentage points lower than the 30 least deprived UTLAs (Figure 44).
Figure 44. Coverage of the primary course of the MenB vaccine in the 30 most and least deprived local authorities in England, measured at 12 months

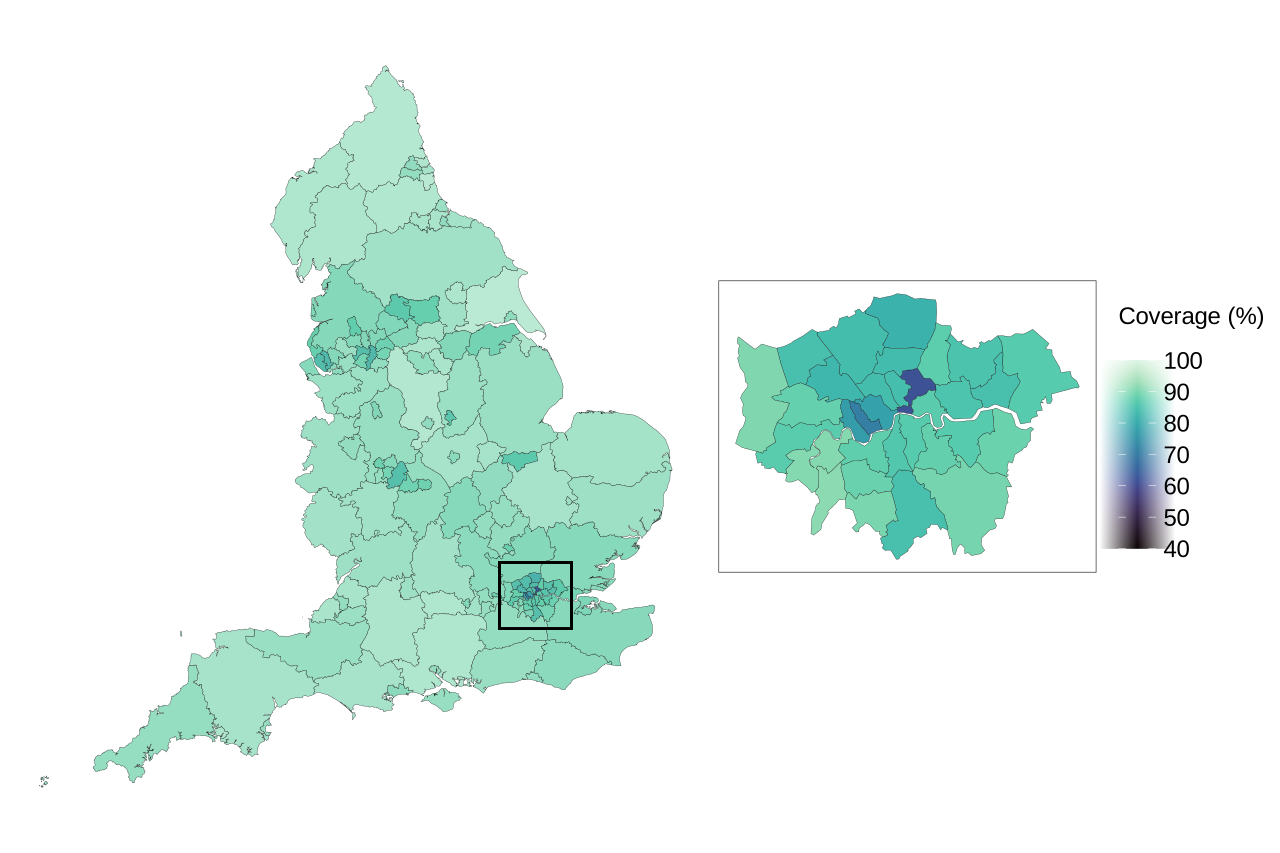
Coverage varies by geography. Full coverage data by country, region, and UTLA is contained in the supplementary data tables accompanying this report. Coverage for the MenB vaccine for 2025 to 2026 by UTLA measured in children aged 12 months is presented in Figure 45.
Figure 45. Coverage of the MenB vaccine measured in children aged 12 months in England for 2025 to 2026 by UTLA
Source of vaccine coverage data: UK Health Security Agency.
Source of boundaries: Office for National Statistics licensed under the Open Government Licence v.3.0 Contains OS data © Crown copyright and database right 2025.
Coverage of the MenB vaccine measured at 12 months varies by UTLA. The data underlying Figure 45 is available in the supplementary data tables accompanying this report.
MenB booster in England
Coverage in children aged 24 months
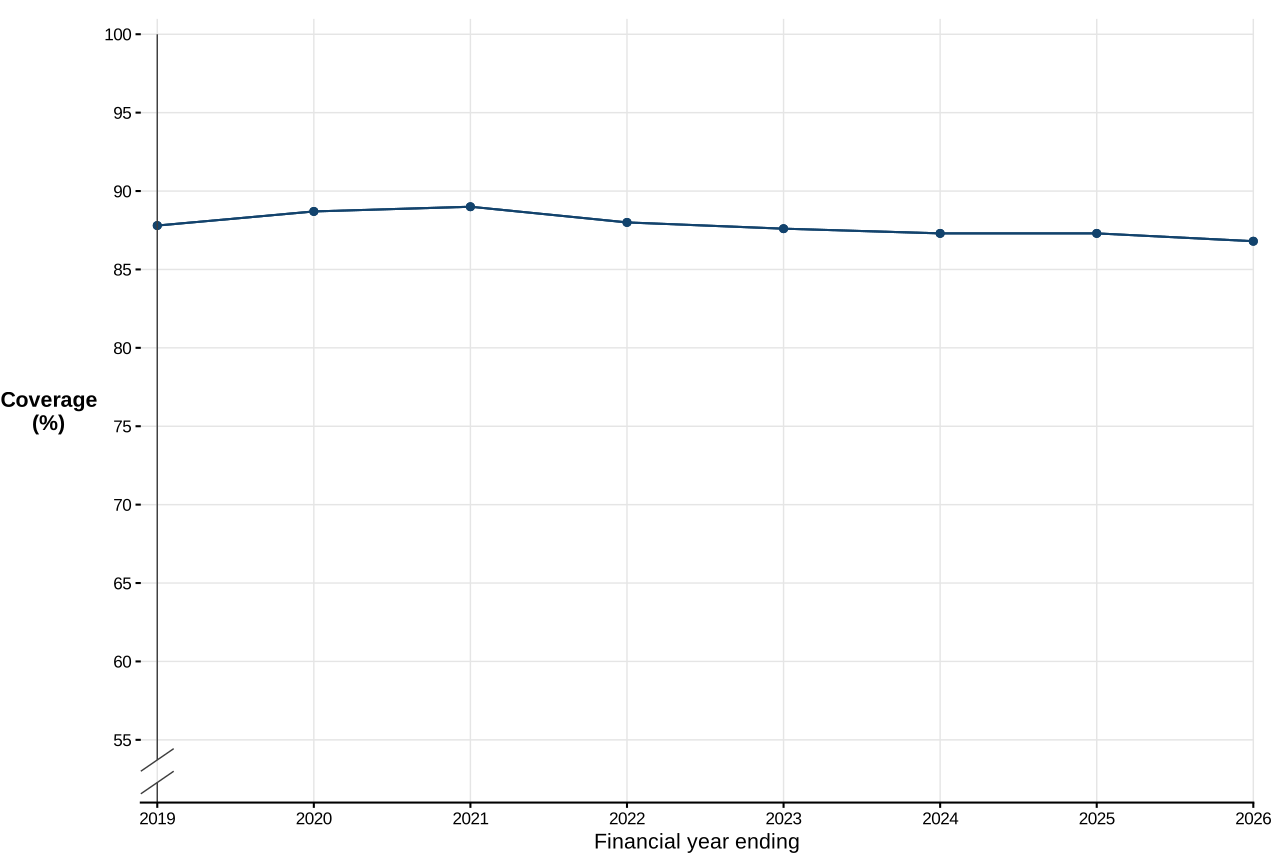
In England, 24-month coverage of the MenB booster decreased by 0.5 percentage points to 86.8%.
Across England excluding London (as the region with the lowest coverage), MenB booster coverage at 24 months was 88.8%, which is 2.0 percentage points higher than the overall England coverage.
In England over the last 10 years, coverage for the MenB booster peaked in 2020 to 2021 at 89.0%, 2.2 percentage points higher than the reporting year’s coverage of 86.8% (Figure 46).
Figure 46. Coverage of the MenB booster in England measured at 24 months from FY ending 2017 to FY ending 2026
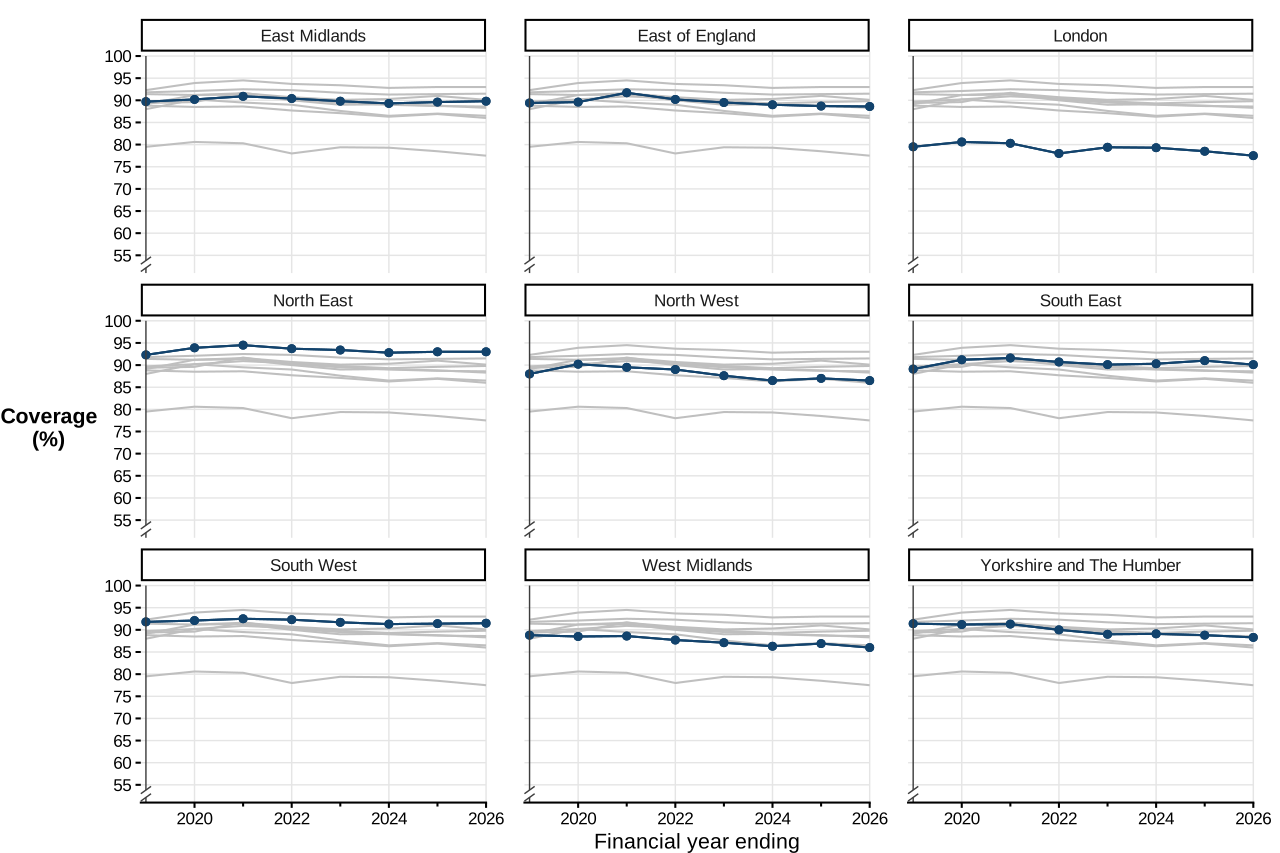
Compared with the previous year, MenB booster coverage decreased in:
-
the East of England (0.1 percentage points)
-
London (1.0 percentage points)
-
the North West (0.5 percentage points)
-
the South East (0.9 percentage points)
-
the West Midlands (0.9 percentage points)
-
Yorkshire and the Humber (0.5 percentage points).
There was an increase in MenB booster coverage in:
-
the East Midlands (0.2 percentage points)
-
the South West (0.1 percentage points).
In the North East, MenB booster coverage remained stable.
Figure 47. Coverage of the MenB booster by region measured at 24 months from FY ending 2017 to FY ending 2026
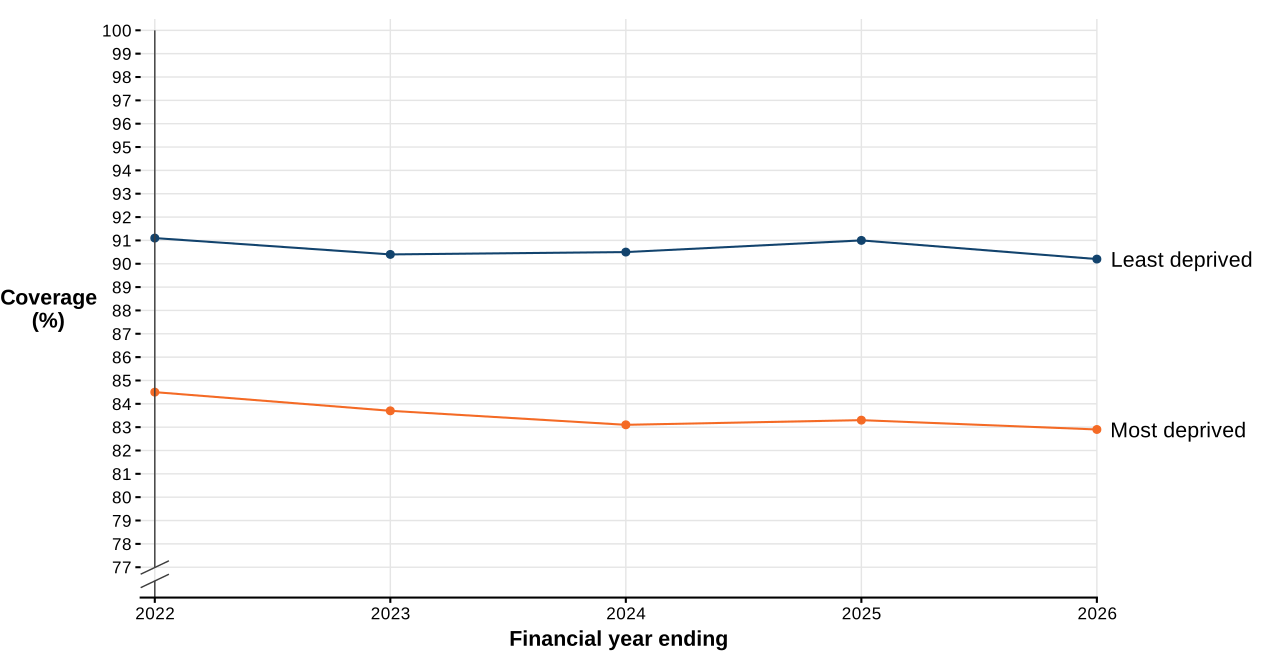
Based on the 2025 IMD scores at the UTLA level, in the 30 least deprived UTLAs, compared with the previous year, coverage of the MenB booster decreased by 0.8 percentage points to 90.2%. In comparison, in the 30 most deprived UTLAs, coverage of the MenB booster decreased by 0.4 percentage points to 82.9%, which is 7.3 percentage points lower than the 30 least deprived UTLAs (Figure 48).
Figure 48. Coverage of the primary course of the MenB booster vaccine in the 30 most and least deprived local authorities in England, measured at 24 months
Coverage varies by geography. Full coverage data by country, region, and UTLA is contained in the supplementary data tables accompanying this report. Coverage for the MenB vaccine for 2025 to 2026 by UTLA measured in children aged 24 months is presented in Figure 49.
Figure 49. Coverage of the MenB booster measured in children aged 24 months in England for 2025 to 2026 by UTLA

Source of vaccine coverage data: UK Health Security Agency.
Source of boundaries: Office for National Statistics licensed under the Open Government Licence v.3.0 Contains OS data © Crown copyright and database right 2025.
Coverage of the MenB vaccine measured at 24 months varies by UTLA. The data underlying Figure 49 is available in the supplementary data tables accompanying this report.
Selective neonatal vaccination programmes in England
Hepatitis B (HepB)
In England, coverage at 12 months for 5 doses of a HepB-containing vaccine was 92.9%. Coverage of 6 doses of a HepB-containing vaccine reported for children who reached 2 years of age in the reporting year was 90.8% (see the supplementary data tables accompanying this report).
The quality of neonatal HepB vaccine data is variable and coverage by former local teams can be based on small numbers. As such, comparisons of percentages should be considered alongside denominators. Where an area reported no vaccinated children, a check was made to ensure that this was zero reporting rather than absence of available data.
Bacillus Calmette-Guérin (BCG)
The data captures BCG coverage at 3 months for children born January 2025 to December 2025 and at 12 months for children born April 2024 to March 2025; it was provided for all local authorities in England and is published in the supplementary data tables. Measured at 3 months, coverage in England was 79.0% and measured at 12 months, it was 85.0%.
Data sources and methodology
See the quality and methodology information report for more information on all the reports.
Data was received from all health boards in Wales, Scotland and Northern Ireland. In England, local teams and Child Health Record Departments provided data for all UTLAs and the associated general practices.
In this report and the accompanying dataset: Hackney is included in the City of London, Rutland is included in Leicestershire, and the Isles of Scilly are included in Cornwall. Cumbria is now reported as Cumberland and Westmorland and Furness.
Coverage statistics should be considered in light of the uncertainty in the numbers of children recorded in child health information systems nationally. This uncertainty is linked to population movement and is therefore likely to have greater impact in urbanised areas with higher levels of population turnover such as London. Coverage may be underestimated in these areas and reported falls in coverage over time should be interpreted with caution due to the relationship with underlying trends in population movement. Consequently, in 14 UTLAs in London, children not registered with a GP are excluded from the dataset. The 14 UTLAs affected are: Greenwich, Hammersmith and Fulham, Kensington and Chelsea, Lambeth, Lewisham, Southwark, Westminster, Bexley, Brent, Bromley, Ealing, Harrow, Hillingdon, and Hounslow. Work is underway to better understand the scale and impact of population errors on reported coverage to ensure they are consistent and comparable over time and between regions.
These statistics are subject to both scheduled revisions and unscheduled corrections and are therefore marked as provisional. In addition to correction of any errors made during the production of these statistics, unscheduled corrections also include the correction of errors later identified within the source data received by UKHSA. Revisions and corrections are made timely and transparently in line with UKHSA’s published revisions and corrections policy.
Supplementary statistics are published separately from the COVER collection to provide more timely, provisional estimates to support staff delivering the childhood immunisation programme. The provisional estimates differ from the official figures published in this report, as it uses different data sources and methodologies. The provisional estimates are based on GP data, meaning unregistered individuals are not included so figures do not capture the entire eligible population. COVER reports remain the official source for childhood vaccination coverage data.
Background information
This publication is released on an annual basis and aligns with the financial year from April to March the following calendar year.
Children who reached their first birthday in this year would have been scheduled to receive their primary course (third dose) of the combined diphtheria, tetanus, acellular pertussis vaccine, inactivated poliomyelitis vaccine, haemophilus influenzae type b vaccine and hepatitis B vaccine (DTaP/IPV/Hib/HepB3 or 6-in-1 vaccination) which protects against diphtheria, tetanus, pertussis (whooping cough), polio, haemophilus influenzae type b (Hib) and hepatitis B, and their primary course (second dose) of MenB vaccine which protects against meningococcal group B disease at the age of 16 weeks, August 2024 to July 2025. They would have also been scheduled to receive a single dose of PCV (protecting against pneumococcal disease) and 2 doses of rotavirus vaccine at age 12 weeks, July 2024 to June 2025. However, a subset of these children who had not yet received their 12 week vaccinations by 1 July 2025 would have been vaccinated according to the new schedule, with the second dose of MenB at 12 weeks and PCV at 16 weeks.
Except for the rotavirus vaccine which is only offered up to 6 months of age, all other vaccines are available to children in the current cohort at any time and would have been captured in this report if given by their first birthday. Children born to hepatitis B surface antigen (HBsAg) positive mothers who reached their first birthday in this year should also have received monovalent hepatitis B vaccine at birth and at 4 weeks of age.
Children who reached their second birthday would have been scheduled to receive their primary course (third dose) of the 6-in-1 vaccination August 2023 to July 2024 and their first MMR vaccination, a Hib/MenC booster (protecting against haemophilus influenzae type b and meningococcal group C disease), MenB booster and PCV booster at one year of age April 2024 to March 2025. Children born to HBsAg positive mothers, who reached their second birthday in this year (born April 2023 to March 2024), were scheduled to receive a third dose monovalent hepatitis B vaccine at one year of age.
Children who reached their fifth birthday would have been scheduled to receive their primary course (third dose) of the 6-in-1 vaccination August 2020 to July 2021, their first MMR and the Hib/MenC booster April 2021 to March 2022, their pre-school diphtheria, tetanus, acellular pertussis and polio (dTaP/IPV) booster, and second-dose MMR from August 2023 to July 2024.
Coverage of the Hib/MenC booster at 24 months and 5 years is no longer reported due to changes to the routine childhood schedule as of 1 July 2025.
Children born in areas where tuberculosis (TB) incidence is greater than or equal to 40 per 100,000 or who are born to parents or grandparents from TB endemic areas were eligible for a BCG vaccination at 28 days. Coverage is measured at 3 months of age and 12 months of age for this selective immunisation.
In July 2025 and January 2026, the routine childhood schedule changed. The full routine immunisation schedule sets out the schedule for all childhood immunisations.
Related statistics
Further information and contact details
The submission and publication dates for this report series are available as are additional information for immunisation practitioners and other health professionals.
Future publications of this report series may include aggregation of the GP data to the primary care network (PCN) level, and links to code for analysis at regional and local levels.
Feedback and contact information
For any questions or comments regarding this report, email cover@ukhsa.gov.uk
Official statistics
Our statistical practice is regulated by the Office for Statistics Regulation (OSR). OSR sets the standards of trustworthiness, quality and value in the Code of Practice for Statistics that all producers of official statistics should adhere to. You can contact OSR by emailing regulation@statistics.gov.uk or via the OSR website.
UKHSA is committed to ensuring that these statistics comply with the Code of Practice for Statistics. This means users can have confidence in the people who produce UKHSA statistics because our statistics are robust, reliable and accurate. Our statistics are regularly reviewed to ensure they support the needs of society for information.
UKHSA has conducted a formal review of these statistics. Following this review, an implementation plan has been developed to continue to improve the trustworthiness, quality, and value of these statistics. Key continuous improvements made will be highlighted within future releases of these statistics for transparency.