Cold mortality monitoring report: winter 2025 to 2026
Published 22 October 2026
Applies to England

© Crown copyright 2026
This publication is licensed under the terms of the Open Government Licence v3.0 except where otherwise stated. To view this licence, visit nationalarchives.gov.uk/doc/open-government-licence/version/3 or write to the Information Policy Team, The National Archives, Kew, London TW9 4DU, or email: psi@nationalarchives.gov.uk.
Where we have identified any third party copyright information you will need to obtain permission from the copyright holders concerned.
This publication is available at https://www.gov.uk/government/statistics/cold-mortality-monitoring-report-england-winter-2025-to-2026/cold-mortality-monitoring-report-winter-2025-to-2026
This report has been published as official statistics for the first time, demonstrating that they are produced in line with the standards of trustworthiness, quality and value in the Code of Practice for Statistics.
The methodology used to define a cold episode has been updated since the last report. Further details are provided in the Data sources and methodology section.
Main points
In the winter of 2025 to 2026:
-
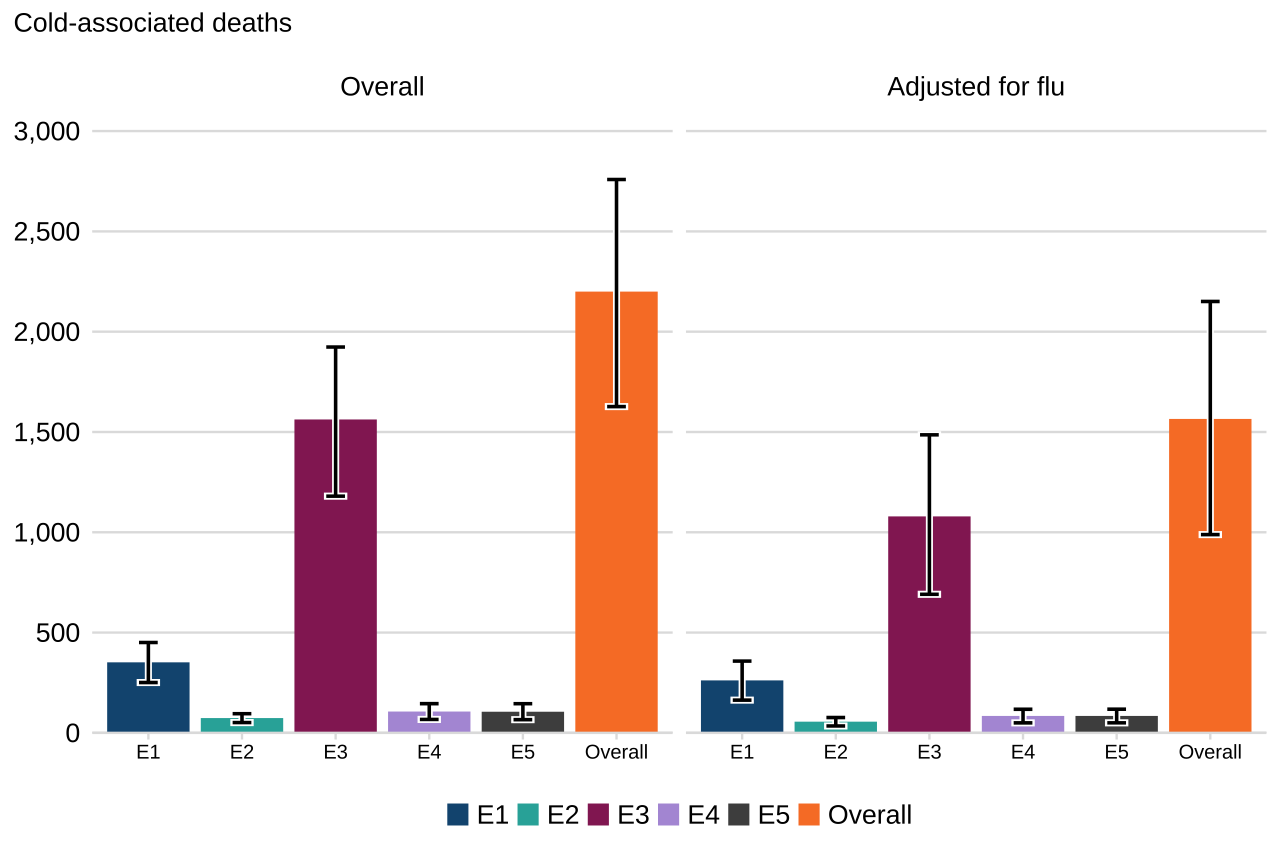
an estimated 2,200 (95% confidence interval: 1,627 to 2,759) cold-associated deaths occurred across 5 cold weather episodes
-
cold-associated deaths were seen in all regions except the North East
-
the strongest cold-mortality relationship was observed in adults aged 85 years and over, and differences were observed by sex
-
cold-associated deaths occurred in care homes, hospitals and people’s own homes
-
vulnerability to cold weather episodes has increased when comparing the relationship between temperature and mortality in the recent 5-year period against the previous 5-year period
The numbers presented in this report show the number of cold-associated deaths estimated for each cold episode in winter 2025 to 2026, based on statistical modelling of how mortality has responded to low temperatures over a recent 5 winters. This differs from the UKHSA heat-associated mortality report, which uses observed daily deaths in a single summer. It is not possible to use the same methodology for cold as for heat, because there are longer observed delays between cold weather and increases in mortality.
Help us improve this resource
We are carrying out a user survey to gather your views and shape the future of our publication.
Cold episodes
Unlike previous reports, cold episodes are identified regionally rather than nationally. This reflects the geographical variation in weather conditions across England and allows mortality estimates to be more closely aligned with the populations actually experiencing cold conditions. For each cold episode, only deaths occurring in regions that meet the temperature threshold contribute to the reported estimates. Regions that do not experience a cold episode during that period are excluded from the calculation.
A cold episode is defined separately for each region of England as a period of 2 or more consecutive days during which the average daily mean temperature falls below 2°C. This threshold is aligned with the temperature criteria used for issuing a yellow Cold-Health Alert (CHA) and is intended to identify periods when cold weather is more likely to affect population health. As a result, a cold episode may occur in one or more regions without affecting the whole of England simultaneously. Further details are provided in the Data sources and methodology section.
Analysis of temperatures in winter 2025 to 2026 found that there were 5 cold episodes meeting this definition, comprising a total of 18 days. These will be labelled episode 1 (E1) to episode 5 (E5) for the remainder of this report. Further contextual information about winter weather in winter 2025 to 2026 can be found from monthly, seasonal and annual summaries published by the Met Office.
Episode 1 (E1)
The first cold episode lasted 3 days (19 November 2025 to 21 November 2025) and impacted 7 regions of England: North East, North West, Yorkshire and The Humber, East Midlands, West Midlands, East of England, and South East. An amber CHA was in place for the North East, North West, and Yorkshire and The Humber over this period, while all other affected regions were under a yellow CHA.
Episode 2 (E2)
The second cold episode lasted 2 days (30 December 2025 to 31 December 2025) for the North East and North West. An amber CHA was in place for both regions.
Episode 3 (E3)
The third cold episode lasted 9 days (2 January 2026 to 10 January 2026) and affected all regions of England. This was a period of significant cold weather, with amber CHAs in place across the entire country.
Episode 4 (E4)
The fourth cold episode lasted 2 days (13 February 2026 to 14 February 2026) in the North East, North West, and Yorkshire and The Humber. A yellow CHA was in place in all 3 regions.
Episode 5 (E5)
The fifth cold episode lasted 2 days (17 February 2026 to 18 February 2026) in the North East, Yorkshire and The Humber, and East Midlands. A yellow CHA was in place in all 3 regions.
Cold-associated mortality
Overall findings
In this analysis, cold-associated deaths are defined as deaths attributable to exposure to cold temperatures, as estimated by a statistical model which captures both immediate and delayed effects. This means the number of deaths which occur during and after a cold weather episode, over and above the number of deaths expected without cold weather. See our Background information section on cold weather for more explanation, and our Quality and methodology information (QMI) report for more detail on the modelling method.
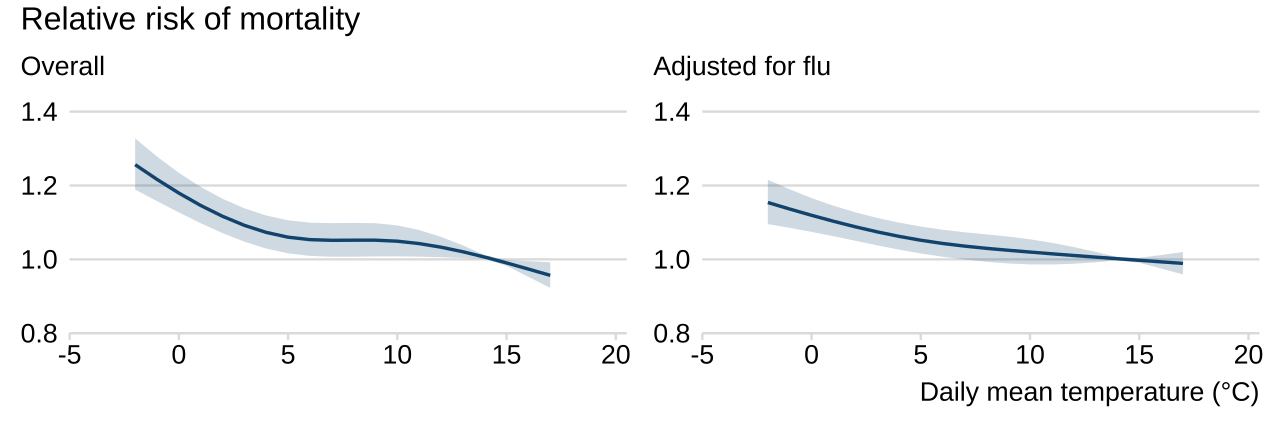
Figure 1 shows the modelled relationship between temperature and mortality, for the total impact of cold (first chart) and the direct impact of cold after adjusting for influenza (second chart). This is based on deaths from all causes over the most recent 5 winters, excluding winters 2019 to 2020 and 2020 to 2021 due to the impacts of the COVID-19 pandemic on mortality.
Figure 1. Relationship between temperature and mortality risk, England, recent 5 winters
Note 1: shaded ribbons represent 95% CIs.
Note 2: this uses data from winters 2025 to 2026, 2024 to 2025, 2023 to 2024, 2022 to 2023, and 2021 to 2022.
Figure 1 shows the estimated mortality risk at different temperatures. This represents how the chance of dying changes as a result of cold temperatures compared with a reference temperature of 14.4°C, taking account of delayed effects and immediate effects. A relative risk (RR) of 1.0 means no increase in risk compared to the reference temperature, 1.1 means a 10% higher risk, 1.2 means a 20% higher risk, and 1.4 means a 40% higher risk.
For the overall impact of cold, the mortality risk increases with colder temperatures. It increases particularly quickly when temperatures fall below 5°C. For the direct impact of cold after adjusting for influenza, mortality risk also increases with colder temperatures, but more gradually.
The relationships shown in Figure 1 are then used to estimate the number of deaths associated with each cold episode in winter 2025 to 2026, taking account of the actual observed temperatures in each episode. See our Data sources and methodology section and QMI report for more detail.
In winter 2025 to 2026, there were an estimated 2,200 (95% CI: 1,627 to 2,759) cold-associated deaths in total. 1,565 (95% CI: 989 to 2,151) of these deaths were directly associated with cold weather, independent of influenza circulation. The remaining 635 of these deaths were linked to cold weather causing increases in influenza infection.
Figure 2 shows the number of cold-associated deaths in each cold episode, for the total impact of cold and the direct impact of cold after adjusting for influenza.
Figure 2. Cold-associated deaths by cold episode, England, winter 2025 to 2026
Note 3: error bars represent 95% CIs.
E1 lasted 3 days and had the second highest mortality of 352 (95% CI: 251 to 451) cold-associated deaths.
E2 lasted 2 days and had the second lowest mortality of 74 (95% CI: 51 to 96) cold-associated deaths.
E3 lasted 9 days and had the highest mortality of 1,563 (95% CI: 1,180 to 1,923) cold-associated deaths.
E4 lasted 2 days and had the third highest mortality of 106 (95% CI: 67 to 146) cold-associated deaths.
E5 lasted 2 days and had the lowest mortality of 105 (95% CI: 66 to 145) cold-associated deaths.
Table 1 in the supplementary data tables shows cold-associated deaths and cold-associated deaths per day by cold episode, for the total impact and the direct impact after adjusting for influenza.
The method used for the overall cold-associated mortality was then applied to specific groups of deaths, to provide breakdowns by region, age, sex, place of death and cause of death. Results are presented in the following sections.
Cold-associated mortality by region
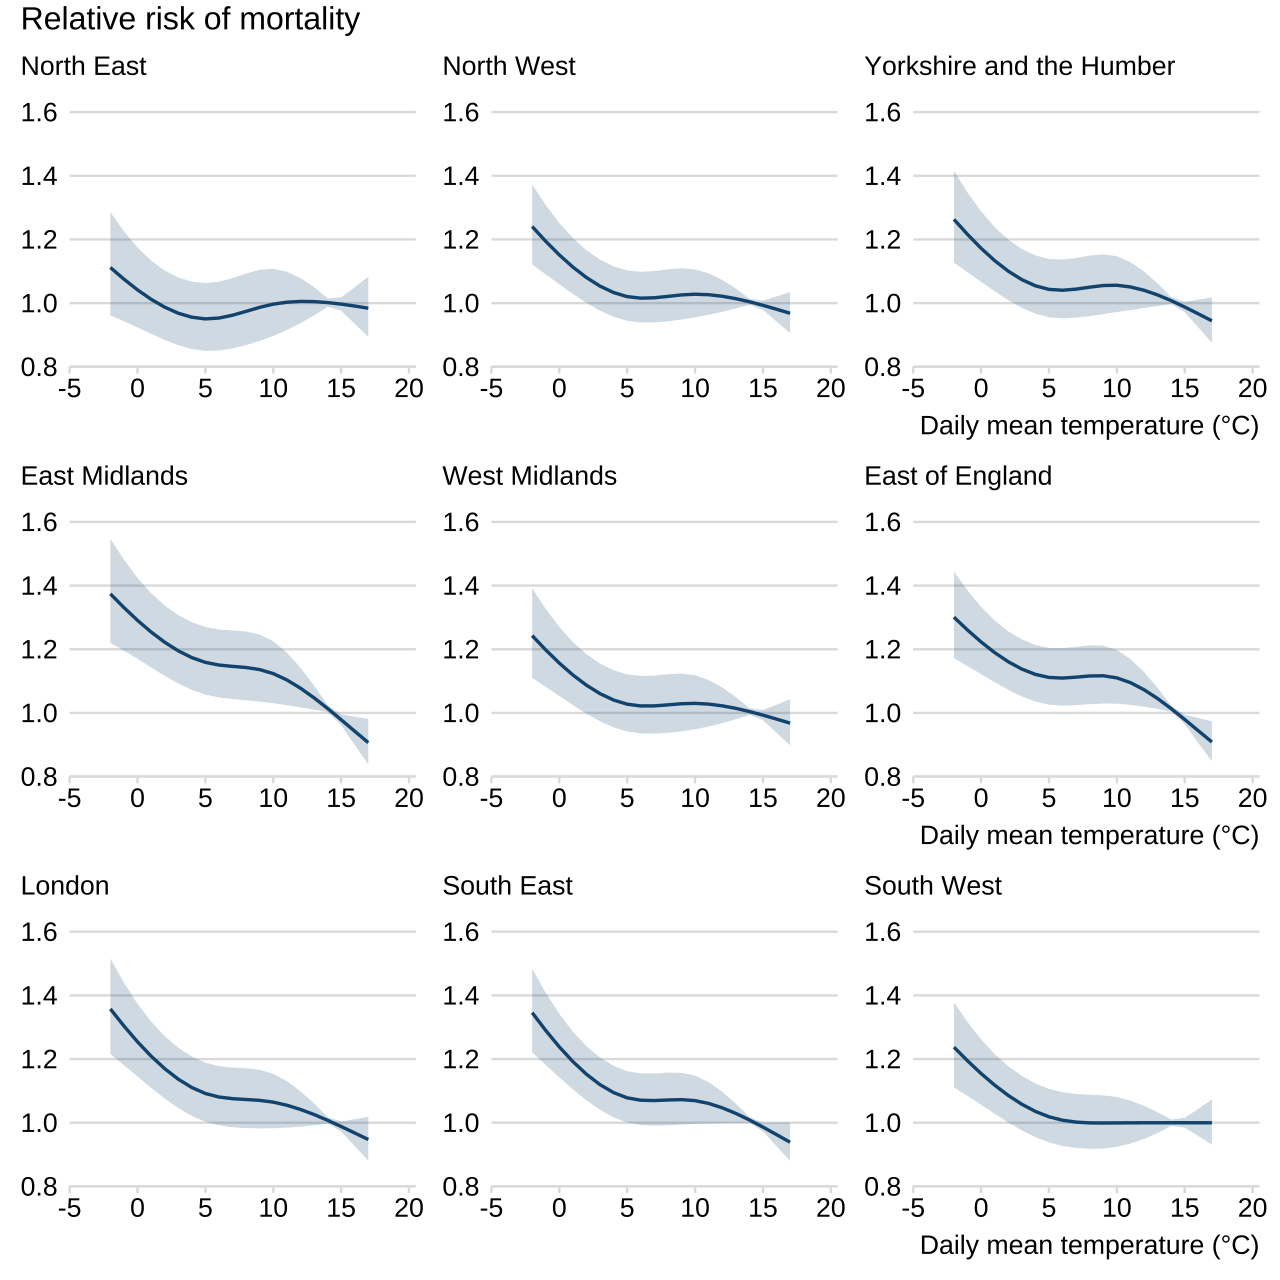
Figure 3 shows the unadjusted relationship between temperature and mortality for each region in England.
Figure 3. Relationship between temperature and mortality risk by region, England, recent 5 winters
Note 1: shaded ribbons represent 95% CIs.
Note 2: this uses data from winters 2025 to 2026, 2024 to 2025, 2023 to 2024, 2022 to 2023, and 2021 to 2022.
Most regions showed a similar pattern, with higher mortality risk at lower temperatures, particularly below around 5°C. The North East showed an unclear relationship with a similar risk of mortality across the temperature range. This may be related to the smaller population in the North East increasing uncertainty in the modelling, or may reflect a genuine difference in risk.
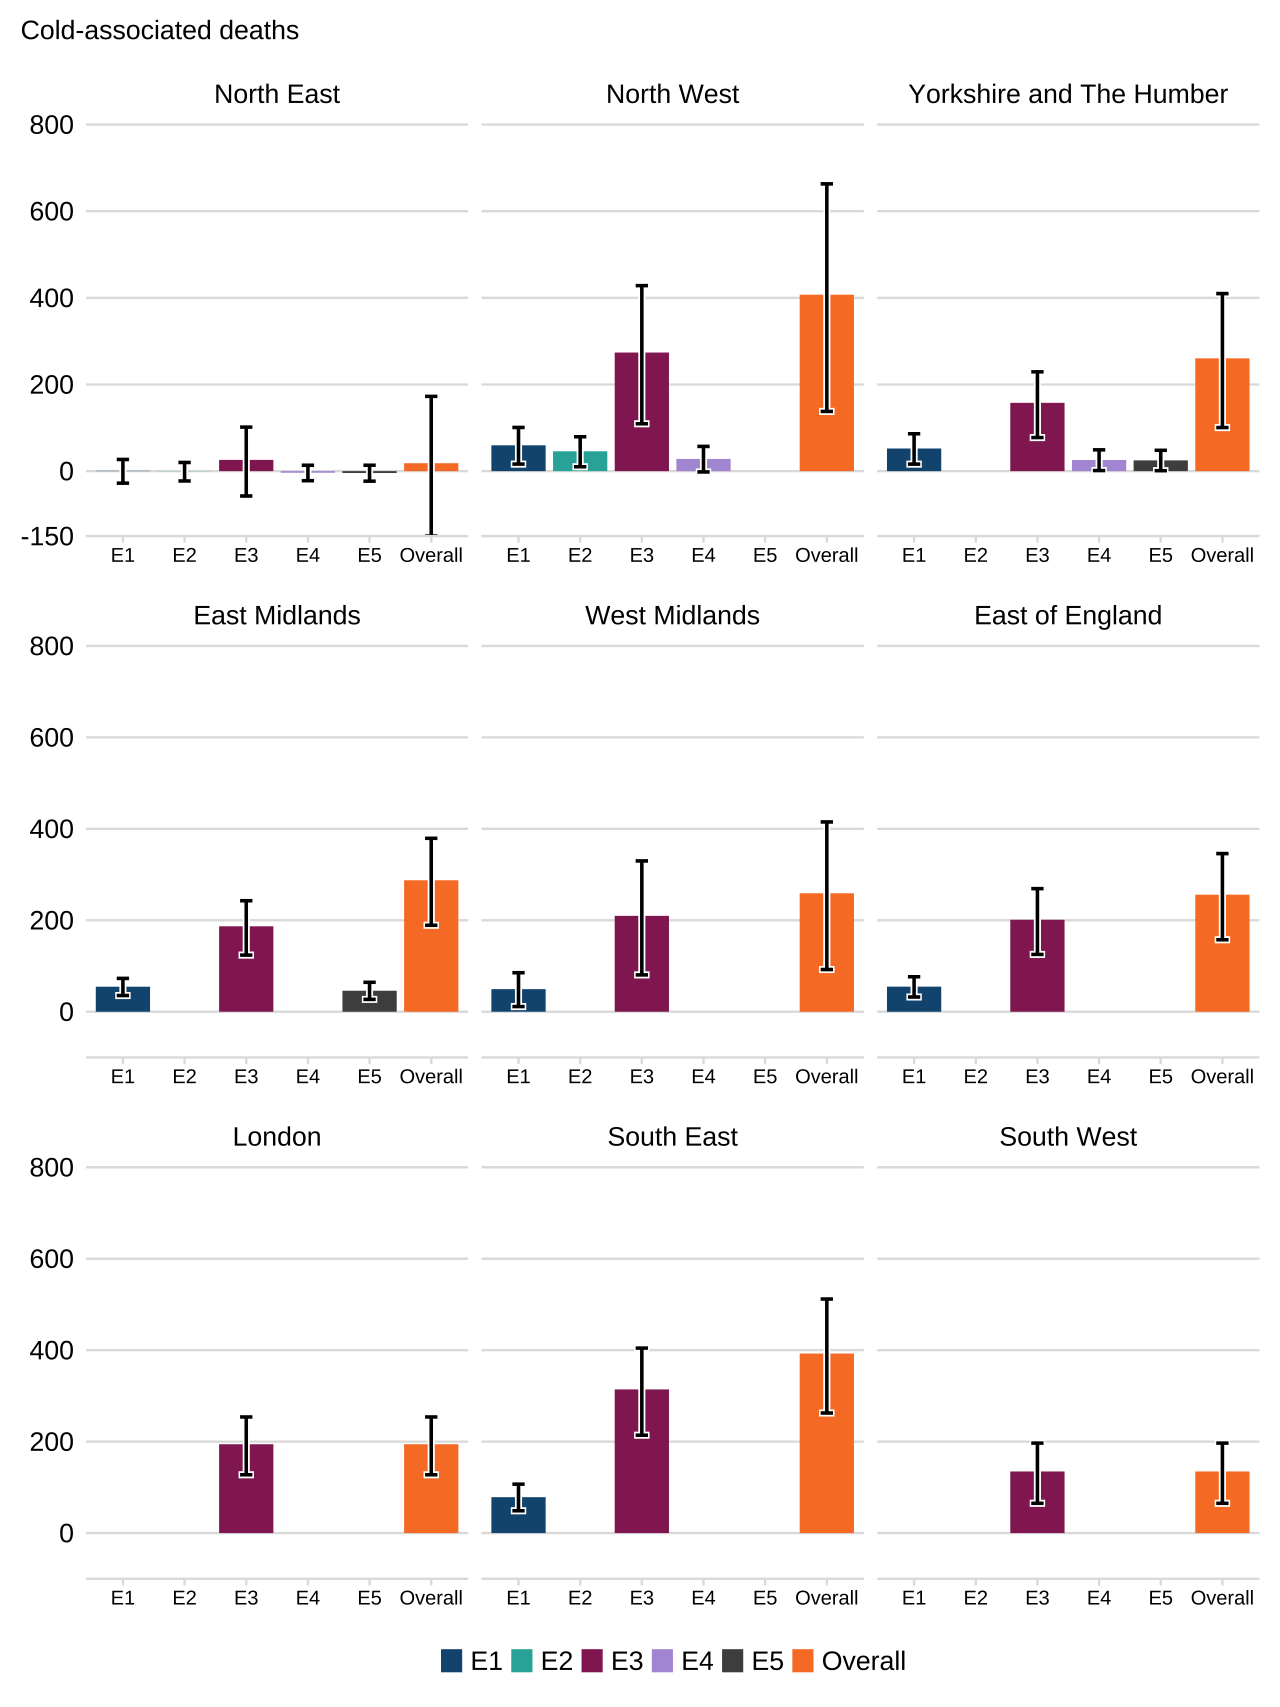
Applying the model to winter 2025 to 2026, the North West had the highest number of cold-associated deaths over the winter of 393 (95% CI: 263 to 512). Figure 4a shows the number of cold-associated deaths by region and cold episode.
Figure 4a. Cold-associated deaths by region, England, winter 2025 to 2026
Note 3: error bars represent 95% CIs.
Statistically significant cold-associated mortality was also seen in all regions except the North East (see our Data sources and methodology section for how we define statistical significance).
When adjusting for population size, the North West had the highest mortality rate of 52 (95% CI: 18 to 85) cold-associated deaths per million population, followed by the East Midlands and Yorkshire and The Humber. Figure 4b shows the rate of cold-associated deaths per million population by region, combining all 5 cold episodes.
Figure 4b. Cold-associated mortality rates by region, England, winter 2025 to 2026
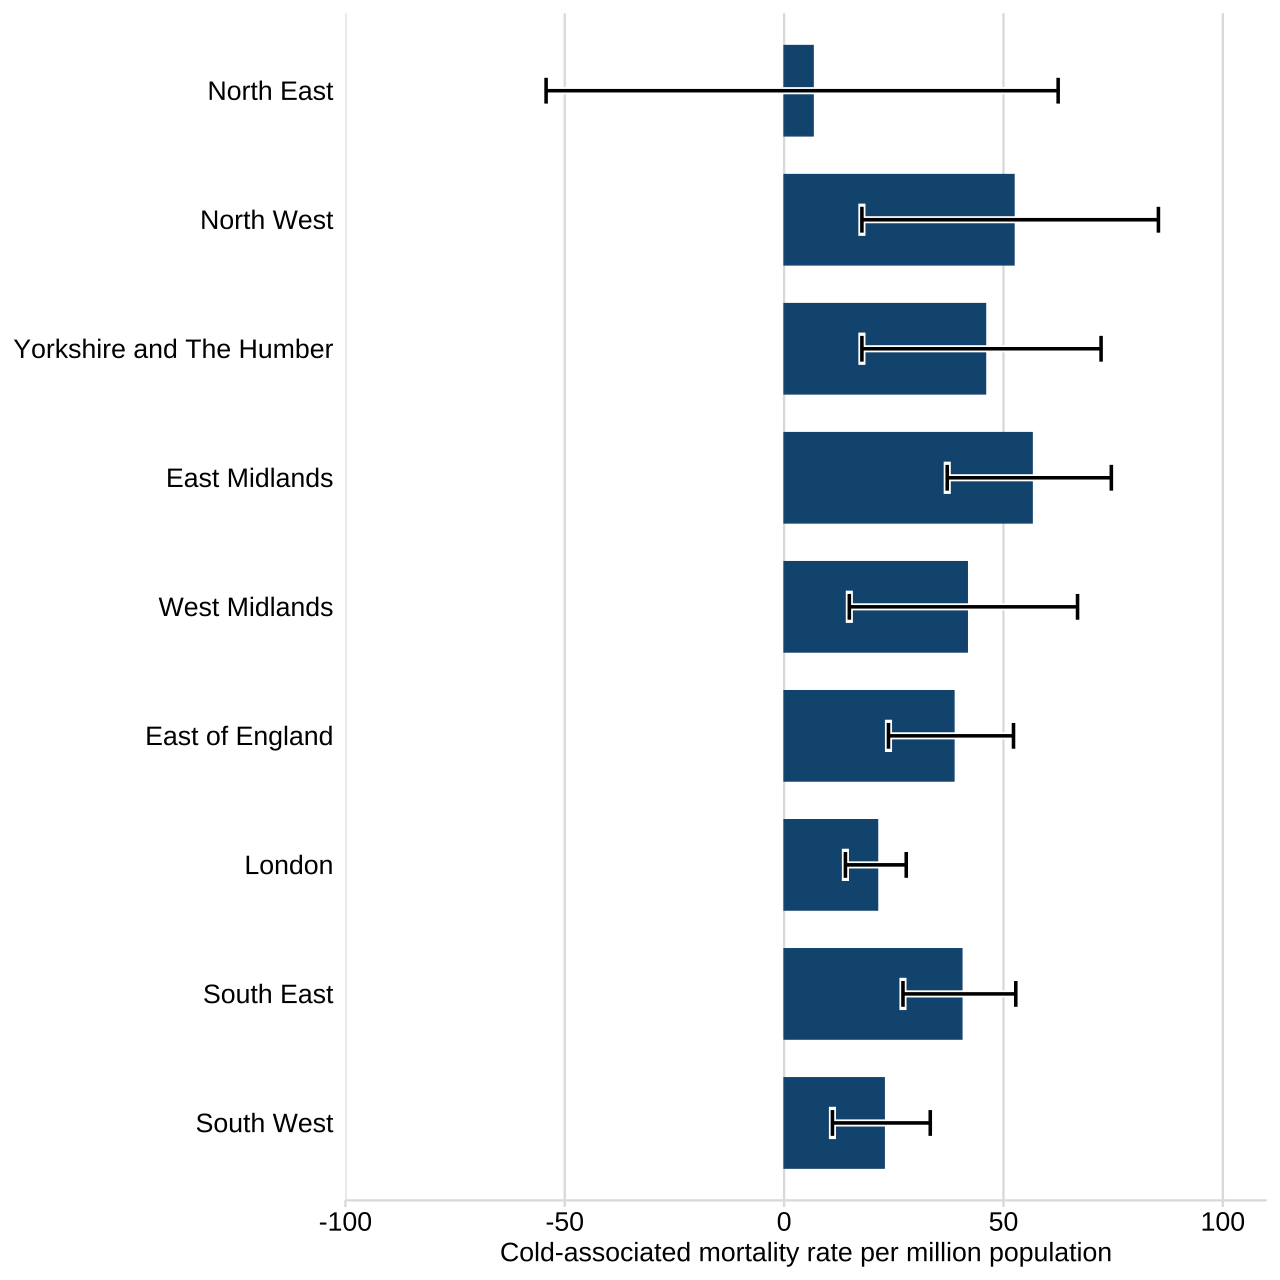
Table 2 in the supplementary data tables shows cold-associated deaths and mortality rates by region and cold episode.
Cold-associated mortality by age group
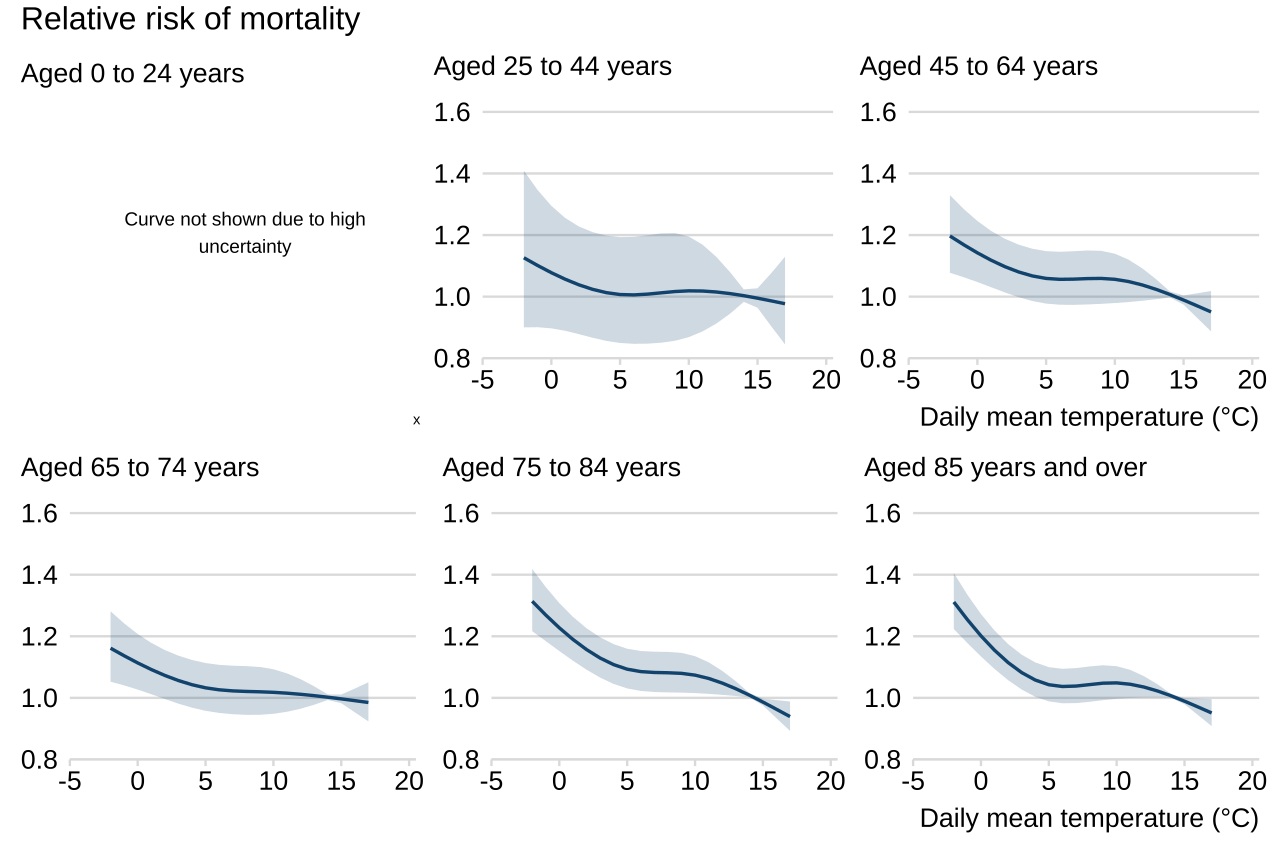
Figure 5 shows the unadjusted relationship between temperature and mortality for each age group. The relationship for those aged 0 to 24 years is not shown, due to the smaller number of deaths in this age group leading to high statistical uncertainty.
Figure 5. Relationship between temperature and mortality risk by age group, England, recent 5 winters
Note 1: shaded ribbons represent 95% CIs.
Note 2: this uses data from winters 2025 to 2026, 2024 to 2025, 2023 to 2024, 2022 to 2023, and 2021 to 2022.
The strongest relationship between cold weather and mortality was seen in those aged 85 years and over. Deaths in this age group increased with colder temperatures and increased more rapidly with temperatures below 5°C. Deaths in those aged 75 to 84 years, aged 65 to 74 years and aged 45 to 64 years also followed this pattern, though more gradually. The relationship was less clear in those aged 25 to 44 years, where there is greater statistical uncertainty due to fewer deaths in this group.
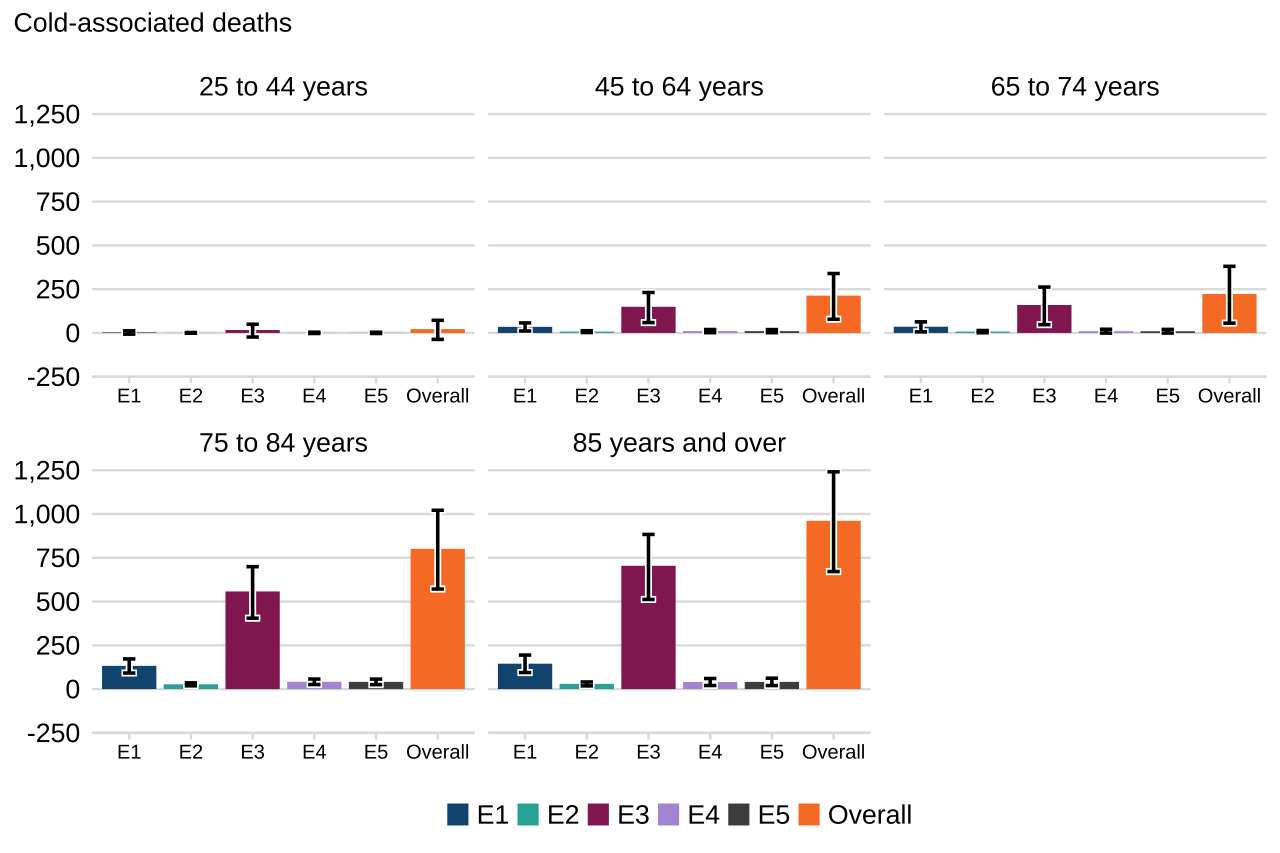
Applying the model to winter 2025 to 2026, those aged 85 years and over had the highest cold-associated deaths. Figure 6 shows the number of cold-associated deaths by age group and cold episode. Estimates for those aged 0 to 24 years are not shown due to high uncertainty in the relationship between temperature and mortality for this age group.
Figure 6. Cold-associated deaths by age group, England, winter 2025 to 2026
Note 3: error bars represent 95% CIs.
Significant cold-associated mortality was also seen in those aged 45 to 64 years, aged 65 to 74 years, and aged 75 to 84 years.
Table 3 in the supplementary data tables shows cold-associated deaths and mortality rates by age group and cold episode.
Cold-associated mortality by sex
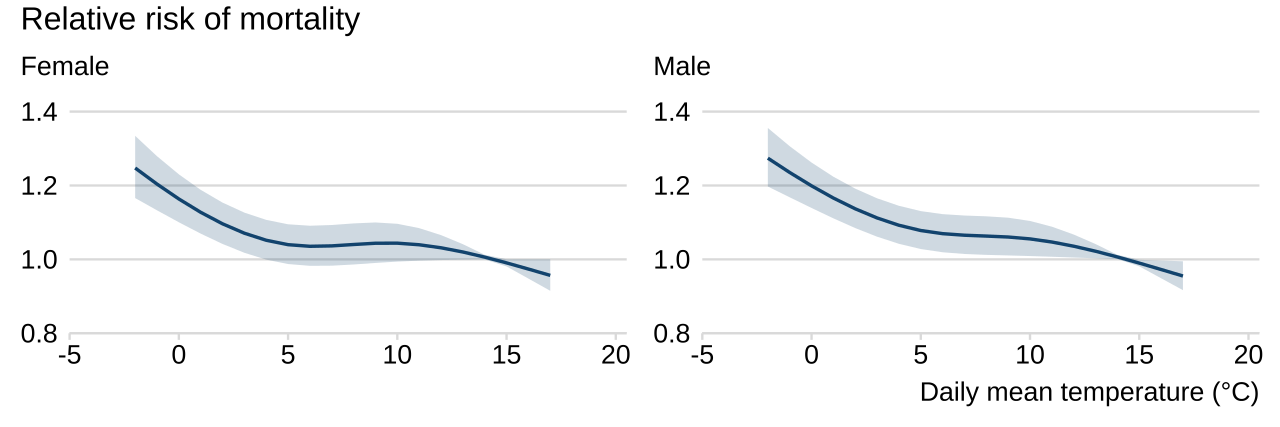
Figure 7 shows the unadjusted relationship between temperature and mortality according to sex as recorded on death certificates.
Figure 7. Relationship between temperature and mortality risk by sex, England, recent 5 winters
Note 1: shaded ribbons represent 95% CIs.
Note 2: this uses data from winters 2025 to 2026, 2024 to 2025, 2023 to 2024, 2022 to 2023, and 2021 to 2022.
A similar pattern was seen in both females and males of increasing mortality at lower temperatures. The curve increases more steeply for males, indicating greater risk as temperatures fall.
It is not possible to report on cold-associated deaths for unknown or other sexes due to small numbers.
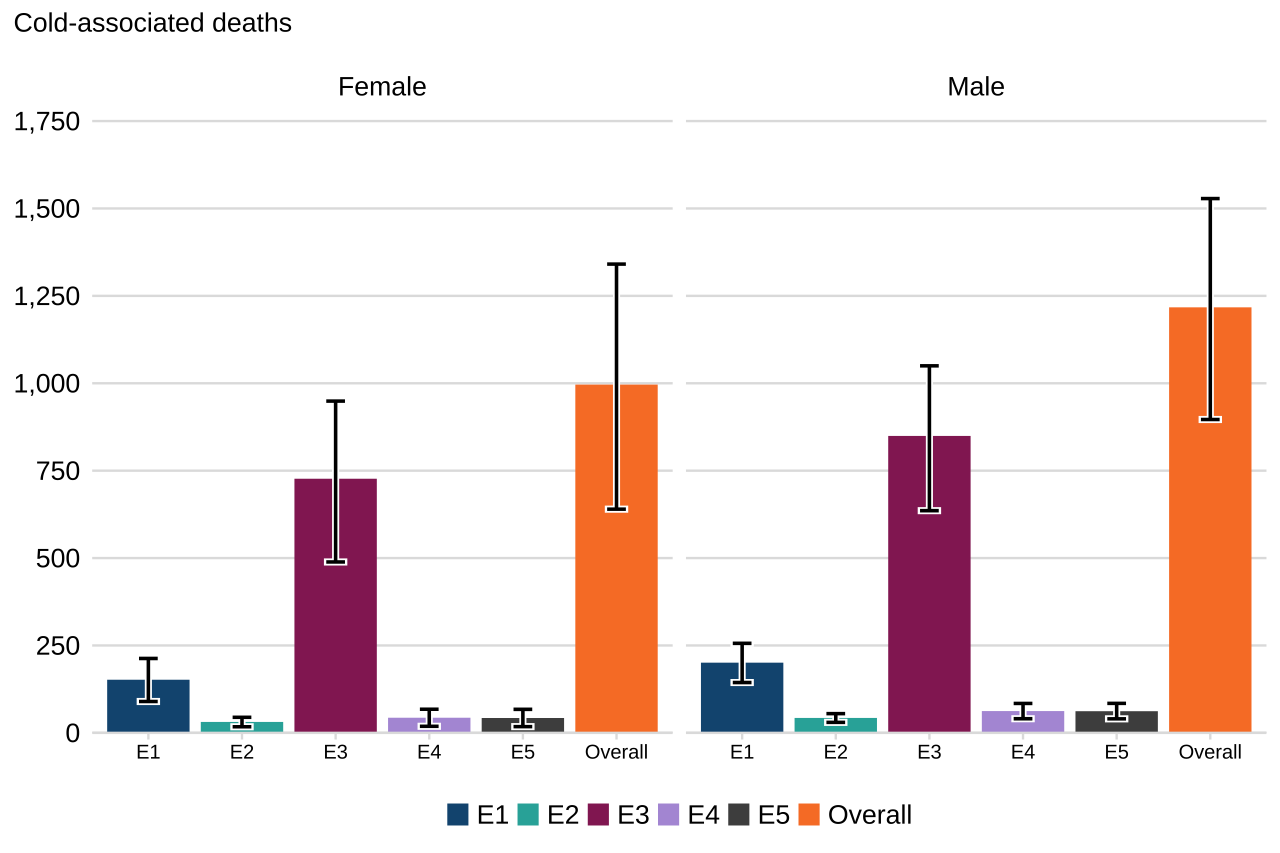
Applying the model to winter 2025 to 2026, males had a higher number of cold-associated deaths (1,217 [95% CI: 896 to 1,528]) than females (996 [95% CI: 640 to 1,341]). The difference was not statistically significant.
Figure 8 shows the number of cold-associated deaths by sex and cold episode.
Figure 8. Cold-associated deaths by sex, England, winter 2025 to 2026
Note 3: error bars represent 95% CIs.
Table 4 in the supplementary data tables shows cold-associated deaths and mortality rates by sex and cold episode.
Cold-associated mortality by place of death
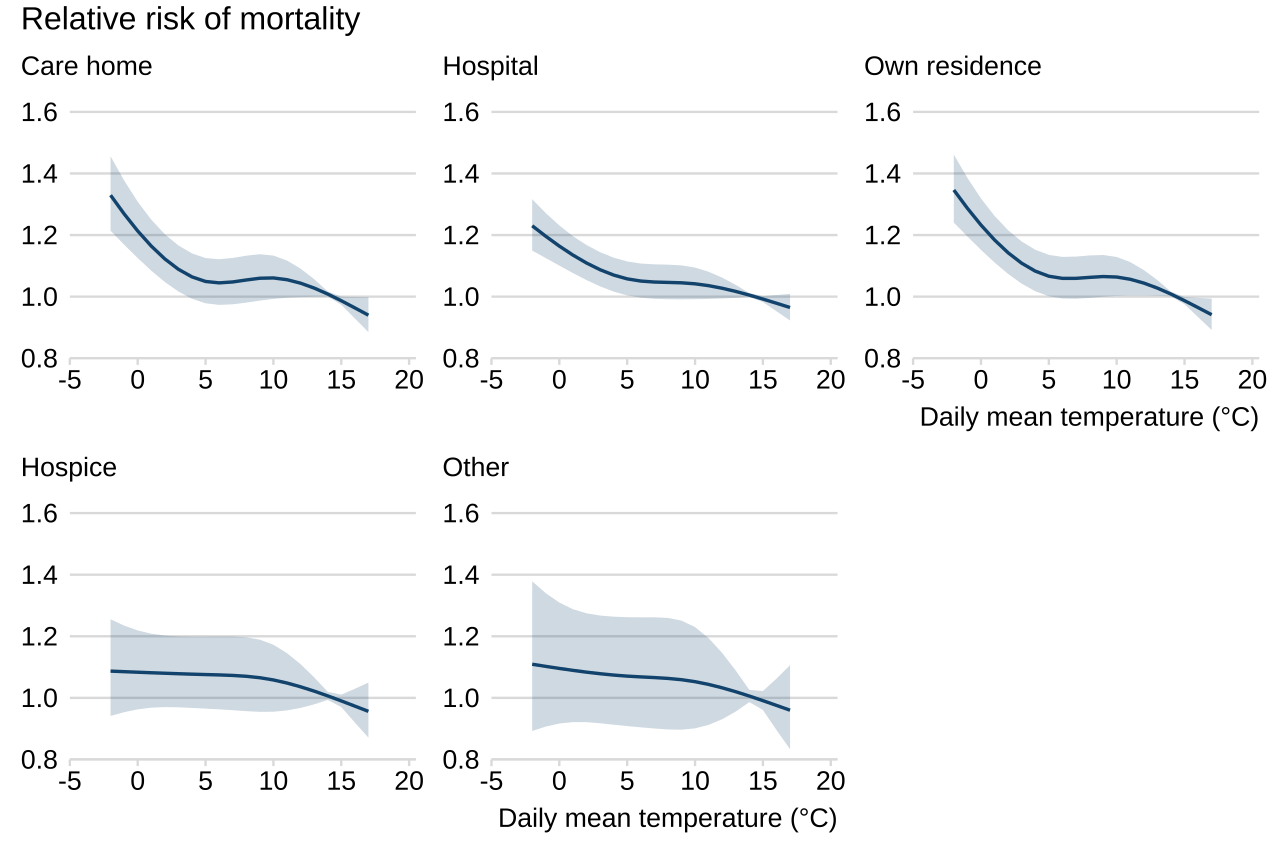
Figure 9 shows the unadjusted relationship between temperature and mortality for different places of death as recorded on death certificates. See our QMI report for a description of the methodology for grouping places of death.
Figure 9. Relationship between temperature and mortality risk by place of death, England, recent 5 winters
Note 1: shaded ribbons represent 95% CIs.
Note 2: this uses data from winters 2025 to 2026, 2024 to 2025, 2023 to 2024, 2022 to 2023, and 2021 to 2022.
Care homes, hospitals and own homes show a similar pattern of higher mortality at colder temperatures, particularly below 5°C. The curves increase more steeply for care homes and own homes than for hospitals, indicating higher risk from cold temperatures in care homes and own homes. The relationship was unclear for deaths in hospices and other places, which have greater statistical uncertainty due to fewer deaths.
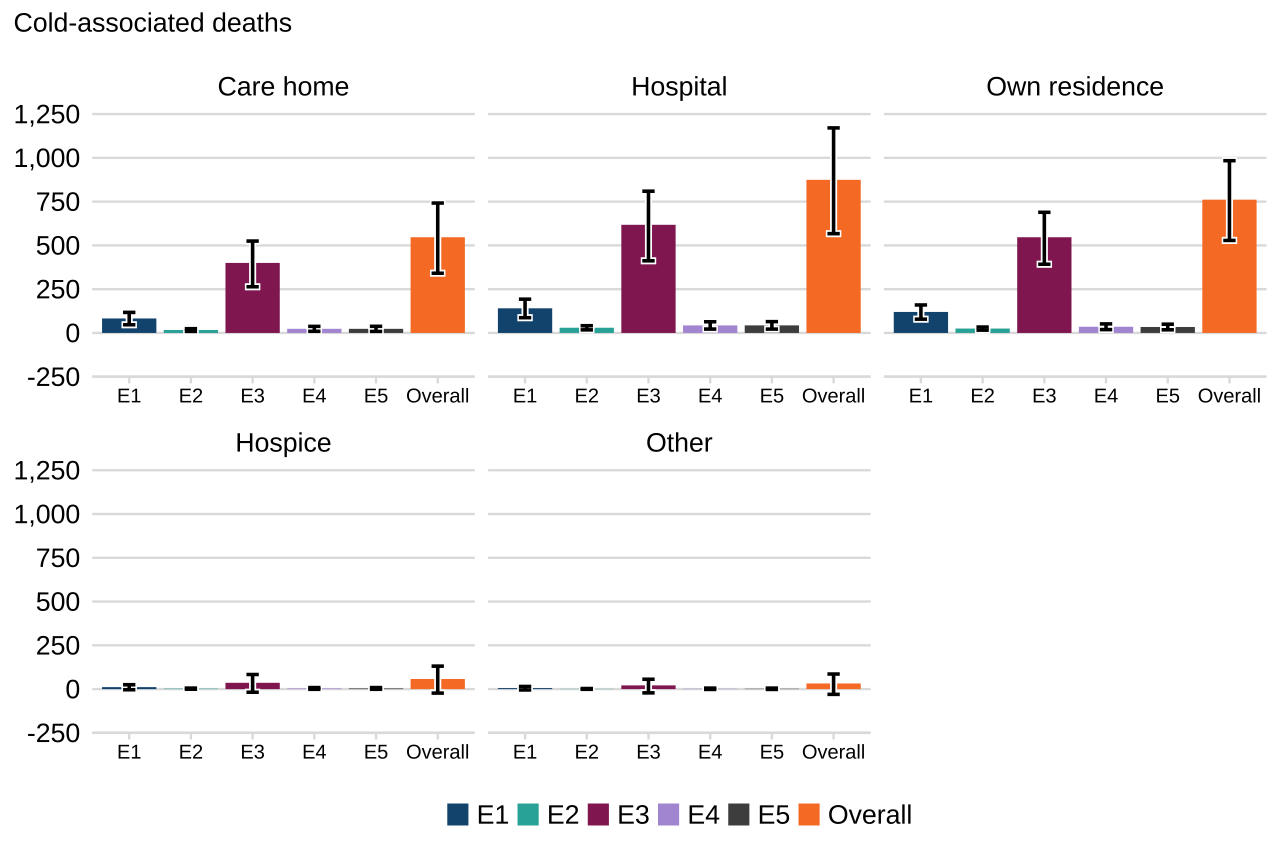
Applying the model to winter 2025 to 2026, significant cold-associated deaths were seen in care homes, hospitals and own homes. Figure 10 shows the number of cold-associated deaths by place of death and cold episode.
Figure 10. Cold-associated deaths by place of death, England, winter 2025 to 2026
Note 3: error bars represent 95% CIs.
Hospitals saw the highest number of cold-associated deaths (874 [95% CI: 567 to 1,171]). This is despite having a weaker relationship with cold temperature than care homes or own homes. The reason for this is the higher number of deaths in hospitals generally than in care homes or own homes during the winter.
Table 5 in the supplementary data tables shows cold-associated deaths by place of death and cold episode.
Cold-associated mortality by cause of death
The analysis in this report considers deaths from all causes, as there are many mechanisms through which cold weather affects health. See our Background information section for more explanation.
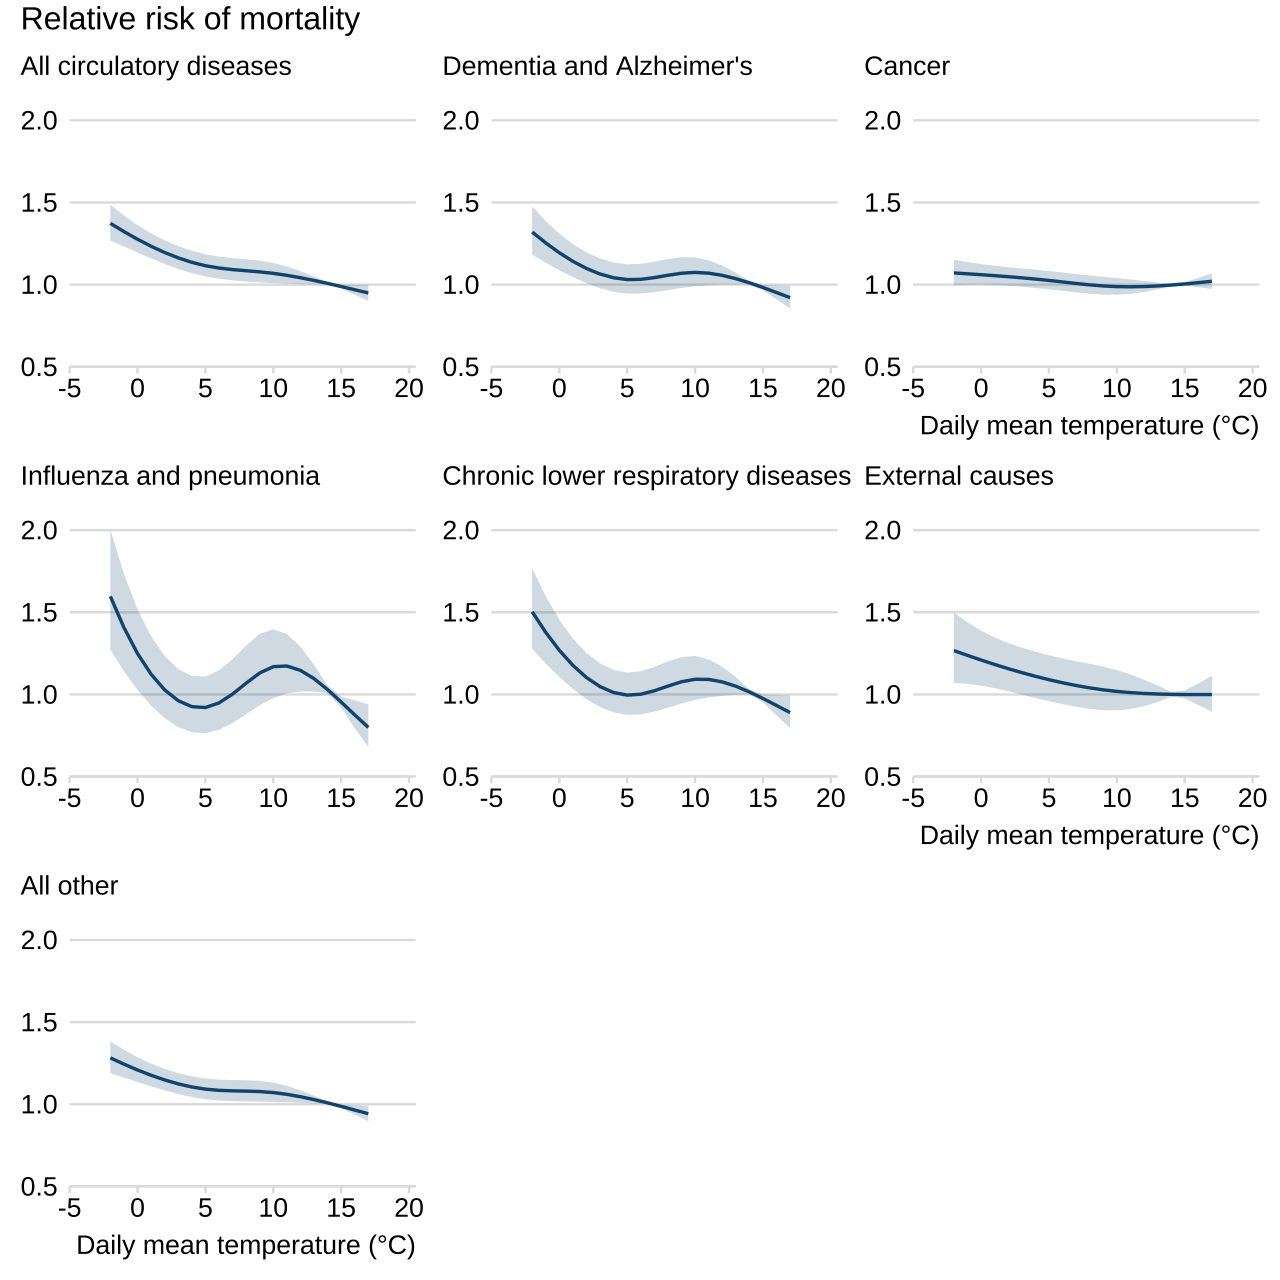
Figure 11 shows the unadjusted relationship between temperature and mortality, broken down according to different groups of underlying causes of death as recorded on death certificates. See our QMI report for a description of the methodology for grouping causes of death.
Figure 11. Relationship between temperature and mortality risk by cause of death, England, recent 5 winters
Note 1: shaded ribbons represent 95% CIs.
Note 2: this uses data from winters 2025 to 2026, 2024 to 2025, 2023 to 2024, 2022 to 2023, and 2021 to 2022.
All circulatory diseases, cancer, external causes, and other causes of death show a gradual increase in mortality risk with lower temperatures. The relationship is strongest for all circulatory diseases, and weakest for cancer.
Deaths from influenza and pneumonia show a different pattern, with mortality risk rising both at very low temperatures (below around 2°C) and at mild temperatures (between around 7°C and 12°C). This is likely related to the complex ways that cold weather and influenza interact and is discussed further below.
Dementia and Alzheimer’s and chronic lower respiratory diseases show a similar pattern to influenza and pneumonia, though with less extreme changes.
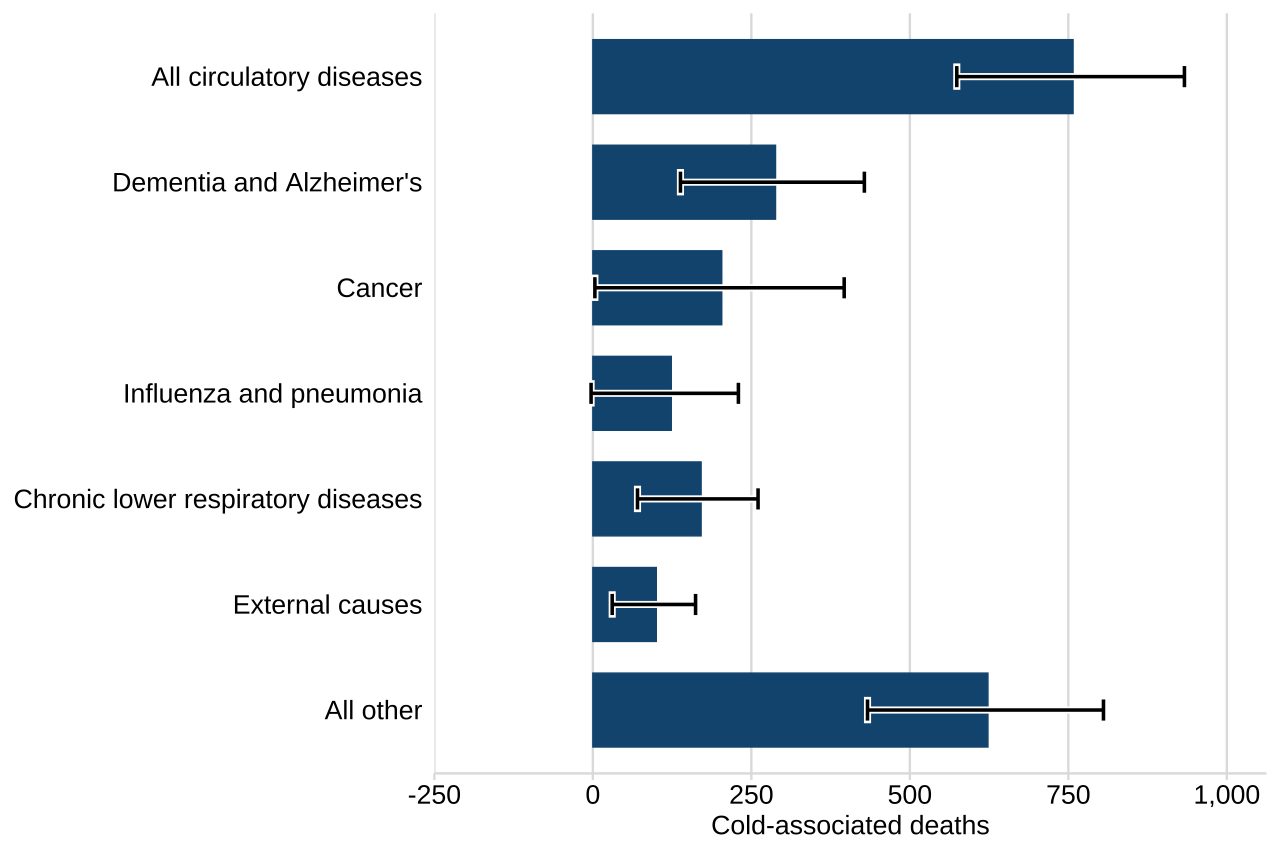
Applying the model to winter 2025 to 2026, significant cold-associated deaths were seen in all underlying causes of death groups except for influenza and pneumonia. The highest number of cold-associated deaths was seen for circulatory diseases (757 [95% CI: 574 to 933]).
Figure 12 shows the number of cold-associated deaths by cause of death group.
Figure 12. Cold-associated deaths by cause of death, England, winter 2025 to 2026
Note 3: error bars represent 95% CIs.
Only 124 (95% CI: -3 to 230) cold-associated deaths had an underlying cause of death recorded as influenza and pneumonia. Above, we estimated that 635 cold-associated deaths could be linked to increases in influenza activity. This difference reflects the fact that many deaths where influenza is a contributing factor are recorded with a different underlying cause of death, such as a chronic illness.
Table 6 in the supplementary data tables shows cold-associated deaths by cause of death groups.
Timing of cold-associated mortality
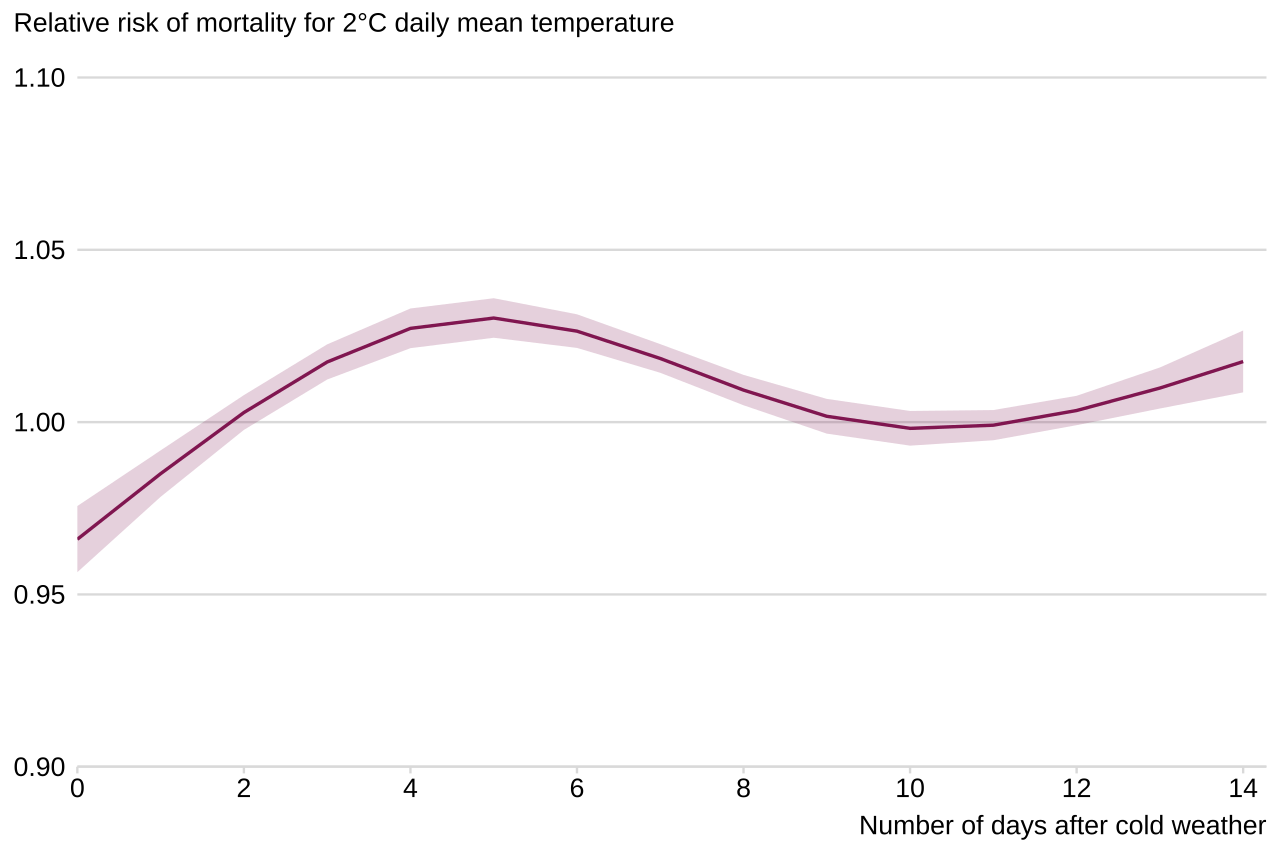
There is known to be a delay between when cold weather occurs and when effects on mortality appear, known as lagged effects. Evidence outlined in the Adverse Weather and Health Plan supporting evidence suggests delayed impacts on mortality of days or weeks after cold weather. In this report, we used a statistical method to consider deaths up to 2 weeks after the cold weather episode. See our QMI report for more detail.
Figure 13 shows how the impacts on mortality change over a 2-week period from cold weather, based on patterns of mortality over the recent 5 winters.
Figure 13. Delay in effect of temperature on mortality risk, England, recent 5 winters
Note 1: shaded ribbons represent 95% CIs.
Note 2: this uses data from winters 2025 to 2026, 2024 to 2025, 2023 to 2024, 2022 to 2023, and 2021 to 2022.
On the day of cold weather starting, mortality is at or below expected levels. Mortality rises after the cold weather arrives, peaking at around 5 days after cold weather, and remaining above expected levels until around 9 days afterwards. The chart also shows a pattern of a second increase in mortality starting around 12 days after the cold weather.
These delayed impacts from cold weather may relate to different causal pathways from cold temperature to mortality.
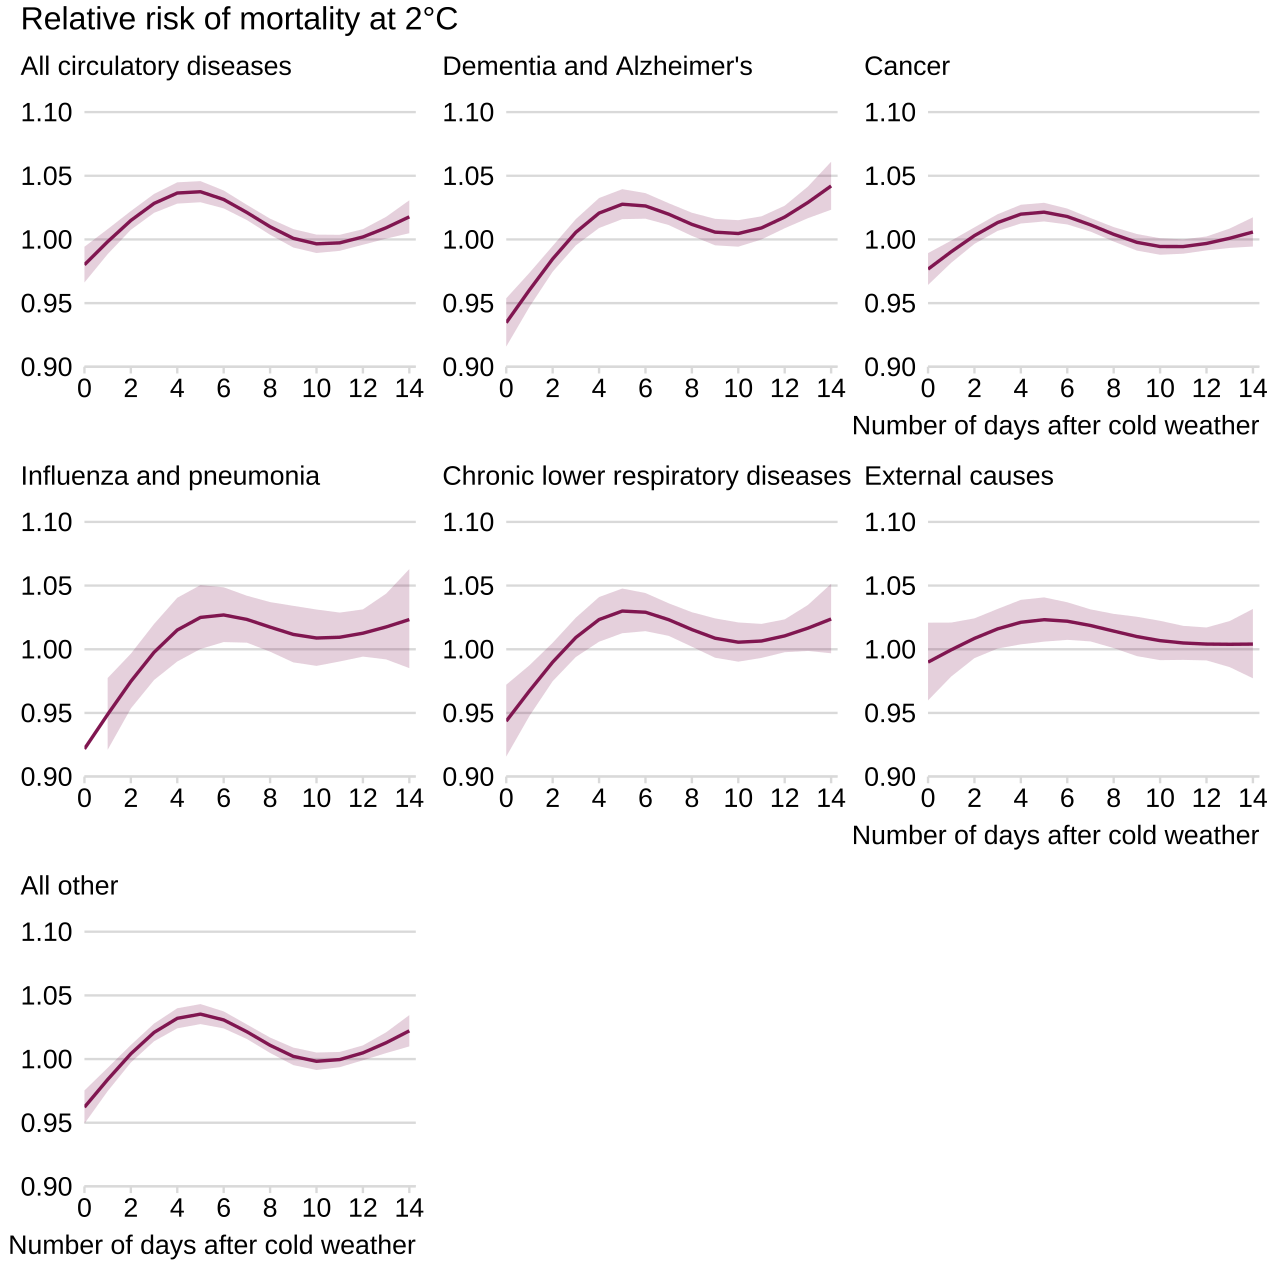
Figure 14 shows a breakdown of the delay by different causes of death.
Figure 14. Delay in effect of temperature on mortality risk by cause of death, England, recent 5 winters
Note 1: shaded ribbons represent 95% CIs.
Note 2: this uses data from winters 2025 to 2026, 2024 to 2025, 2023 to 2024, 2022 to 2023, and 2021 to 2022.
Most causes of death show a similar pattern, peaking between 4 and 6 days after cold weather.
Certain causes of death also show a later rise in mortality:
-
deaths caused by dementia and Alzheimer’s decrease back to expected levels and then rise again from 11 days after cold weather
-
deaths caused by chronic lower respiratory diseases peak around 4 to 7 days after cold weather
-
deaths caused by influenza and pneumonia also may show a second increase after around 11 days after cold weather, but this is not statistically significant
Comparison with previous years
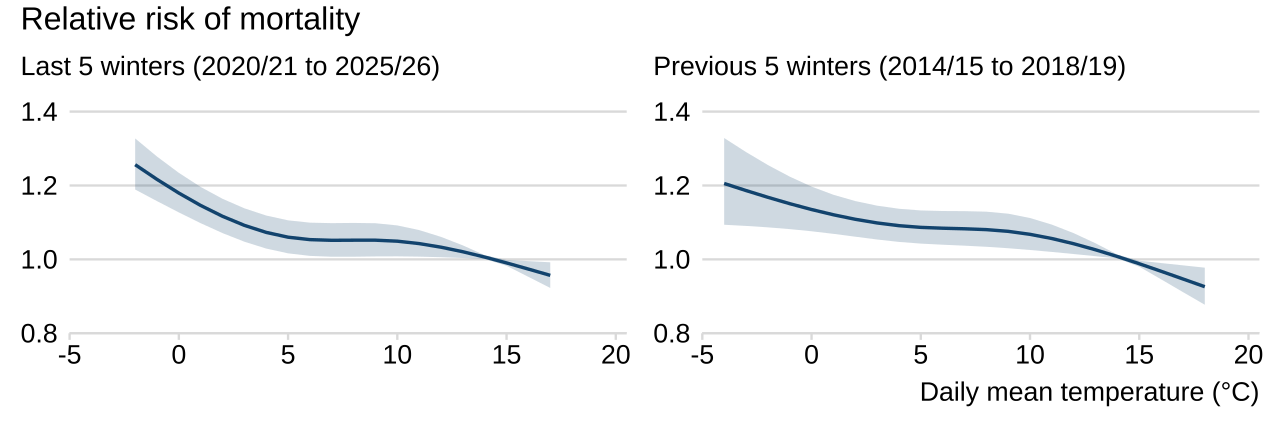
In addition, we modelled the relationship between temperature and mortality for a previous 5-year period. This provides a comparison over time. Figure 15 shows the temperature-mortality relationships for both periods.
Figure 15. Relationship between temperature and mortality risk by year, England, recent 5 winters and previous 5 winters
Note 1: shaded ribbons represent 95% CIs.
Note 4: the analysis of “recent 5 winters” uses data from winters 2025 to 2026, 2024 to 2025, 2023 to 2024, 2022 to 2023, and 2021 to 2022. The analysis of “previous 5 winters” uses data from winters 2018 to 2019, 2017 to 2018, 2016 to 2017, 2015 to 2016, and 2014 to 2015.
In the earlier 5-year period (second chart), low temperatures are associated with a less rapid increase in mortality. This may indicate that the population had greater vulnerability to cold weather and its impacts in the more recent 5-year period. It may also be affected by changes in influenza season severity.
Further insights and contextual information
For winter 2025 to 2026, we estimated the number of deaths associated with periods of cold weather using 2 approaches. The unadjusted estimate shows the overall impact on mortality from cold periods as they occurred, when low temperatures and winter illnesses such as influenza often happen at the same time. This reflects the total number of excess deaths associated with cold periods. The influenza-adjusted estimate focuses more specifically on the association between cold temperatures and mortality after accounting for changes in influenza activity.
When influenza activity is adjusted for in the analysis, the relationship between temperature and mortality becomes less steep, particularly at colder temperatures. This suggests that a proportion of the excess mortality observed during cold periods occurs alongside increased influenza activity. However, a clear association between cold temperatures and mortality remains after adjustment, indicating that cold weather itself continues to contribute substantially to winter mortality. Taken together, these estimates provide both an assessment of the overall impact of cold weather on the number of deaths, and an estimate of the number of deaths more directly associated with cold temperatures.
General patterns and evolving risk
Many of the patterns identified in the modelled estimates were consistent with previous analyses and with the wider evidence base on cold weather and health. Cold-associated mortality was concentrated among older age groups. The strongest temperature-mortality relationships were observed for causes of death known to be sensitive to cold weather, particularly circulatory and respiratory diseases. Broadly similar patterns were observed across sex and place of death. The timing of effects following cold exposure was also consistent, with different causes of death exhibiting distinct lag patterns that are compatible with the physiological and infectious pathways through which cold weather can contribute to mortality. This consistency is expected because the biological, behavioural and environmental mechanisms linking cold weather and mortality are relatively stable. This is despite the fact that weather conditions, circulation of respiratory pathogens, healthcare pressures and other winter-related factors vary between winters.
When comparing the recent 5 years with the previous 5-year period, the relationship between cold temperature and mortality in the recent 5 years appears steeper. This suggests that mortality may now increase more rapidly as temperatures fall than in the recent past. Several factors may help explain this change, including population ageing and increasing prevalence of chronic disease. Health inequalities, post-pandemic changes in resilience, and other factors affecting vulnerability to cold weather may also contribute. However, this finding should be interpreted with caution. The comparison is based on relatively short time periods and does not capture longer-term changes in the temperature-mortality relationship. Further research is underway to examine how this relationship has evolved over the past 2 decades and whether the apparent increase in cold-related risk represents a sustained long-term trend.
Regional differences
In absolute terms, the largest cold-associated mortality burden was observed in the North West and the smallest in the North East, although these estimates are influenced in part by differences in population size. The comparatively low burden estimated in the North East is notable given that this region typically experiences colder winter temperatures than many other parts of England and also experienced the highest number of cold episode days, as defined within this report. This pattern has also been consistent in previous analyses, suggesting that it is unlikely to be specific to a single winter period.
The reasons for this pattern are not fully understood. A range of factors may contribute, including behavioural and social adaptation to colder conditions, housing quality and heating practices, and underlying population health. Patterns of transmission of seasonal diseases and other local social and environmental factors that are not captured in the model may also contribute. Housing may be particularly important, as people are primarily exposed to temperatures within the built environment rather than outdoor conditions. The English Housing Survey suggests that housing quality is generally higher in the North East than in other regions, which may help to reduce exposure to indoor cold and could contribute to the relatively flatter temperature-mortality relationship observed in this region. However, further research is needed to better understand the extent to which housing quality, energy efficiency and other regionally specific factors influence patterns of cold-associated mortality.
Overall, these findings provide further evidence that cold weather continues to make an important contribution to winter mortality in England. While the magnitude of cold-associated mortality varies between winters, the modelled relationships between temperature and mortality remain broadly consistent and identify population groups, causes of death and settings that are most affected during periods of cold weather. These estimates should therefore be interpreted alongside other sources of information on winter health risks, including seasonal respiratory infections, healthcare system pressures and local population characteristics. The results contribute to the evidence base on the health impacts of cold weather and provide context for organisations involved in winter preparedness, resilience planning and monitoring of seasonal health risks.
Glossary
Confidence interval
A confidence interval is a measure of the degree of uncertainty in an estimate based on a sample distribution. Here, 95% confidence intervals indicate that if we repeatedly observed the same process under identical conditions, 95% of the intervals would contain the true value. A wider range indicates more uncertainty in the estimate. Overlapping confidence intervals indicate that there may not be a true difference between estimates.
Cold-associated deaths
Deaths attributable to exposure to cold temperatures, as estimated by a statistical model which captures both immediate and delayed effects. It is the number of deaths which occur during and after a cold weather episode, estimated to be over and above the expected number of deaths that would occur without cold weather.
Cold episode
A period of cold weather, defined for this analysis as 2 consecutive days where the average daily mean temperature in a region was below 2°C.
Cold-Health Alert (CHA)
An alert issued by England’s Weather Health Alerting system, warning that cold weather is forecast that could lead to impacts on health for the population of England. Alerts can be issued at yellow (response), amber (enhanced response) or red (emergency response) levels.
Lagged effects
An effect which occurs at a later time after an event. Health impacts of cold weather do not always happen straight away. Instead, exposure to cold weather can increase the risk of death many days later, for example by triggering heart problems, worsening existing illnesses, or increasing the chance of infections that take time to develop.
Relative risk (RR)
The chance of dying at a particular daily mean temperature, relative to a reference daily mean temperature. The reference temperature used throughout this analysis is 14.4°C. An RR of 1.0 indicates no increase in risk compared to the reference temperature. An RR of 1.1 indicates a 10% increase in risk, and an RR of 1.2 indicates a 20% increase in risk.
Data sources and methodology
Our QMI report explains our calculations in further detail.
The methodology used to define a cold episode has been updated since the last report. Under the previous definition, the estimated number of cold-associated deaths in 2024/25 was 2,788; under the new regional definition, the estimate is 3,351. This difference reflects the change in methodology rather than a true change in mortality burden. Therefore, caution is required when comparing estimates from this report with those published for previous years.
For this analysis, data from the Met Office was used to calculate an average daily mean temperature for every region. Cold episodes are identified when the average daily mean temperature is below 2°C for 2 or more consecutive days. Mortality data from the Office for National Statistics (ONS) was used to calculate daily deaths between October and April for each winter, capturing the winter period from November to March and the surrounding days to allow for measuring delayed effects.
The number of cold-associated deaths is estimated using a statistical model of the temperature-mortality relationship in England in winters over a 5-year period. The model estimates the relative risk of mortality for any given temperature compared to a baseline daily mean temperature of 14.4°C, after adjusting for effects of weekday, time of year and COVID-19. This represents the increased risk of dying for a day at that temperature, on the day or up to a delay of 14 days afterwards. The risk is applied to the actual temperatures observed in cold episodes in winter 2025 to 2026, to generate an estimate of how many deaths are linked to those cold episodes.
There is random variation in daily deaths not related to cold weather or the factors adjusted for in the model. This means there is uncertainty in the relationship between cold weather and mortality, and in the estimates of cold-associated deaths. The uncertainty is represented by the 95% confidence intervals shown on the charts and in brackets after each estimate. Reported numbers of cold-associated deaths are considered to be significant if the 95% confidence intervals do not overlap with zero.
Background information
Cold weather, winter and mortality
Deaths associated with cold weather events happen for more than one reason. Cold temperatures can directly strain the body by increasing stress on the heart and blood vessels, making breathing more difficult, and disrupting the body’s ability to stay warm. This increases mortality risk, especially for older adults and people with chronic health conditions. Snow and ice can increase the risk of falls, injuries and accidents.
At the same time, winter is the season when illnesses such as influenza and other respiratory infections spread more widely. Cold weather can contribute to the spread of influenza. One reason for this is behavioural changes such as more indoor gatherings. Other reasons are biological: cold temperatures affect the airways and immune system, making it more likely that someone will develop an infection after exposure. In addition, influenza viruses survive for longer in cold, dry conditions. A rise in influenza infections also leads to a rise in mortality.
This report uses a statistical method to provide estimates of the total impact on mortality from cold weather episodes. These estimates are also broken down by different demographics. An estimate is also provided for the direct impact on mortality from cold weather episodes, by adjusting for the effect of influenza activity in the population. See our QMI report for more information.
Related statistics
- UKHSA annual heat mortality monitoring reports
- UKHSA weekly all-cause mortality surveillance
- UKHSA annual surveillance of influenza and other seasonal respiratory viruses in the UK
Other assessments of mortality include the number of weekly deaths registered in England and Wales, which is published weekly by the Office for National Statistics (ONS).
The Office for Health Improvement and Disparities also produces the Excess mortality within England report, which provides estimates of expected deaths by month of registration for population subgroups and by cause of death.
The different methods used in the UK for mortality assessment, and their varied purposes, are discussed in more detail in Measuring excess mortality: a guide to the main reports.
In 2026 the ONS also published official statistics in development on climate-related mortality in England and Wales, 1988 to 2025.
Further information and contact details
Feedback and contact information
For any feedback or enquiries, please contact: extremeevents@ukhsa.gov.uk
We are also carrying out a user survey to gather your views and shape the future of our publication.
Official statistics
Our statistical practice is regulated by the Office for Statistics Regulation (OSR). OSR sets the standards of trustworthiness, quality and value in the Code of Practice for Statistics that all producers of official statistics should adhere to. You are welcome to contact us directly by emailing extremeevents@ukhsa.gov.uk with any comments about how we meet these standards. Alternatively, you can contact OSR by emailing regulation@statistics.gov.uk or via the OSR website.
The UKHSA is committed to ensuring that these statistics comply with the Code of Practice for Statistics. This means users can have confidence in the people who produce UKHSA statistics because our statistics are robust, reliable and accurate. Our statistics are regularly reviewed to ensure they support the needs of society for information to continue to improve the trustworthiness, quality, and value of these statistics. Key continuous improvements made will be highlighted within future releases of these statistics for transparency.