Benefit cap: number of households capped to November 2020
Published 30 March 2021
Applies to England, Scotland and Wales

© Crown copyright 2021
This publication is licensed under the terms of the Open Government Licence v3.0 except where otherwise stated. To view this licence, visit nationalarchives.gov.uk/doc/open-government-licence/version/3 or write to the Information Policy Team, The National Archives, Kew, London TW9 4DU, or email: psi@nationalarchives.gov.uk.
Where we have identified any third party copyright information you will need to obtain permission from the copyright holders concerned.
This publication is available at https://www.gov.uk/government/statistics/benefit-cap-number-of-households-capped-to-november-2020/benefit-cap-number-of-households-capped-to-november-2020
The latest release of these statistics can be found in the collection of benefit cap statistics.
The benefit cap is a limit on the total amount of benefit that most working age people can get.
The amount of benefit a household receives is reduced to ensure claimants do not receive more than the cap limit. The benefit cap can be applied through either:
- Universal Credit (UC)
- Housing Benefit (HB)
The benefit cap was introduced in April 2013. It was initially applied to HB and subsequently to UC, as UC was gradually rolled out. UC replaces 6 means-tested benefits including HB and since December 2018, UC has been available across Great Britain (GB) to people applying for means-tested social security support. However, a small number of the population may still apply for HB. Read about who can get HB. The government currently plans that by the end of 2024, all existing legacy claimants will have moved on to UC.
When the benefit cap was introduced in April 2013, the cap level set initially was:
- £26,000 per year
- £18,200 per year for single adults with no children
The Summer Budget 2015 announced changes to the level of the benefit cap to:
- £20,000 per year (or £13,400 for single adults with no children) nationally
- £23,000 per year (£15,410 for single adults with no children) in Greater London
These lower, tiered cap levels were introduced from 7 November 2016 and remain the current cap limits.
1. Main stories
The main stories are:
-
at November 2020, the proportion of households claiming benefits, that have their benefit capped, remains steady at 2.3% compared to 2.2% at August 2020. The number of capped households increased by 6% to 180,000 households at November 2020, compared with 170,000 households at August 2020
-
UC capped households continue to make up the majority of the benefit capped households, 86% at November 2020. The remaining 14% of households had their HB capped at November 2020
-
at November 2020, the overall number of UC capped households is increasing (150,000 households compared with 140,000 households at August 2020). However, there are more households coming off the UC cap (40,000 households) than the number of households that are new to the UC cap (33,000 households). The increase in UC capped households is therefore due to previously capped households returning to the cap
-
in the quarter to November 2020, 16% of households (6,300) left the UC cap due to having earnings at, or over, the earnings threshold of £604 per assessment period, compared with 19% (4,800 households) in the quarter to August 2020. The proportion of households that left the HB cap with an open Working Tax Credit (WTC) claim remains the same in the quarter to November 2020, 8% (350 households) as it did in the quarter to August 2020
-
since April 2013, 460,000 households have been capped at some point. At November 2020, 290,000 households are no longer capped. Of these, 28% (80,000 households) are no longer capped due to working or earning enough to be exempt from the cap
-
the average (mean) weekly cap amount was £55 at November 2020, a decrease of £2 per week compared with £57 at August 2020. The average weekly cap amount for:
- UC was £56 at November 2020 compared to £57 at August 2020
- HB was £51 at November 2020, compared with £55 at August 2020
The overall capped caseload (at November 2020) continues to increase, despite the number of off-flows exceeding the number of newly capped households. This is due to households returning to the cap.
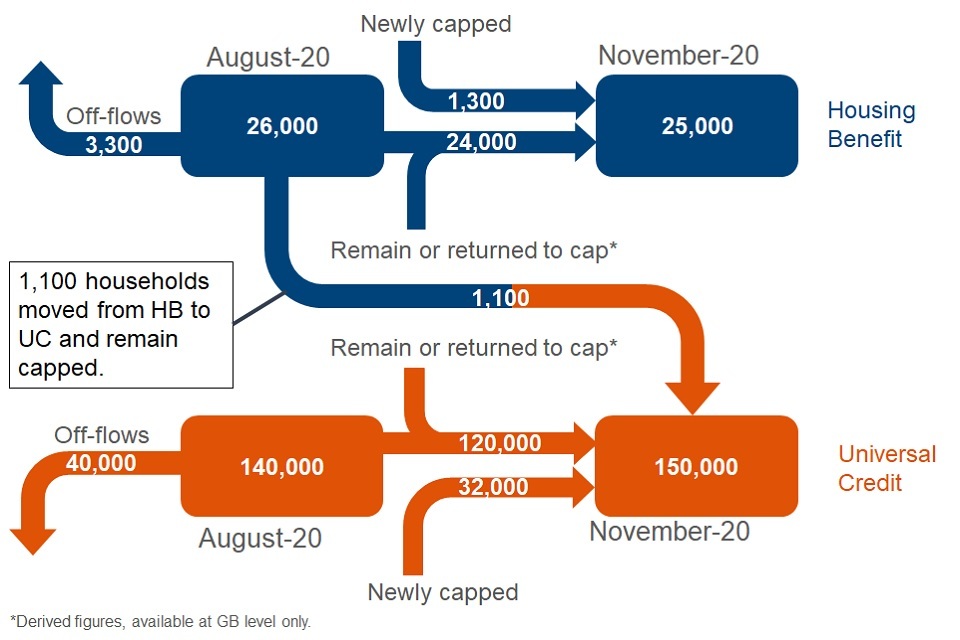
Since last quarter, the number of households with their HB capped has decreased from 26,000 (at August 2020) to 25,000 (at November 2020). 4,400 households that had previously had their HB capped were no longer capped under HB between August and October 2020. 1,100 of these households moved to UC and continue to be capped, while the remaining 3,300 are no longer capped. 1,300 households had their HB capped for the first time this quarter between August and October 2020.
Since last quarter, the number of households with their UC capped has increased from 140,000 (at August 2020) to 150,000 (at November 2020). 40,000 households that had previously had their UC capped were no longer capped between August and October 2020. 32,000 households had their UC capped for the first time this quarter between August and October 2020, this does not include the 1,100 households who had their HB capped and now have their UC capped.
Note: A methodology to differentiate between households that remain capped and households that are returning to the cap is yet to be developed. For this reason figures for Off-flows and newly capped households may not sum to the totals of the Point-in-time caseload.
2. Coronavirus (COVID-19)
This summary contains statistics on the number of households claiming UC and HB, which are capped under the benefit cap up to November 2020.
The COVID-19 pandemic which spread to the UK in early 2020, has affected the entire population with many businesses unable to trade and many employees being temporarily unable to work. As a result, there has been a marked increase in the number of claims for UC. The impact of this increased demand is reflected in these statistics.
There has been no change to the benefit cap policy in light of the COVID-19 pandemic.
However, as a response to the COVID-19 pandemic, DWP introduced temporary emergency measures, including changes to both UC and HB. These changes impact on the number of households which have a valid exemption from the benefit cap and subsequently the number of households capped, for example:
-
the Standard Allowance of UC was temporarily increased by £20 per week from 6 April 2020 for one year and has since been extended for a further 6 months
-
the Minimum Income Floor (MIF) was temporarily relaxed in March 2020 to support self-employed people at the height of the pandemic. The temporary extension will be extended to the end of July 2021. The MIF is the minimum amount of income a self-employed person is assessed to have if their reported self-employed income is lower than this
-
at the beginning of July 2020, DWP reintroduced Claimant Commitments in a phased approach, as capacity allowed, asking claimants to prepare and look for work where it was safe to do so in line with social distancing rules
Read a detailed timeline of key events in the life of UC.
There have also been some changes to Local Housing Allowance (LHA) rates, in response to the COVID-19 pandemic:
- LHA rates determine the financial support renters in the private sector are entitled to. This rate was increased in April 2020, for UC and HB claimants, to the 30th percentile of rents within a local area for each bedroom size up to a maximum of 4 bedrooms
The changes in the entitlement of both UC and HB, alongside no change in the benefit cap levels would impact on the number of households capped under each benefit and the amount they have their benefits capped by. The impact of these changes is reflected in these statistics.
3. What you need to know
National, Official and Experimental Statistics are produced in accordance with the Statistics and Registration Service Act 2007 and the Code of Practice for Statistics (the Code).
This release contains Official and Experimental Statistics on the number of households that have had their benefits capped since the cap was introduced (in April 2013) to November 2020. They are compiled following the standards of trustworthiness, quality, and public value set out within the Code.
The statistics are released every 3 months and are sourced from data originally collected via administrative systems. Since November 2020 (data to August 2020), data for households capped under HB are taken from DWP HB Caseload Statistics, and data for households capped under UC are taken from DWP UC Quarterly Statistics.
New methodology
Since November 2020 (data to August 2020), a new methodology to produce Benefit Cap Statistics using datasets of the HB and UC Official Statistics publications, has been implemented. Using Official Statistics sources for HB and UC allows for:
- more retrospection in the data ensuring a more accurate picture of what is happening within HB and UC across GB
- consistency across government publications ensuring more accurate comparisons can be made
- more up to date statistics regarding the proportion of households capped under each benefit (this previously had a 3-month time lag)
HB capped household data are now sourced from the DWP HB Caseload Statistics. Read more about HB Caseload Statistics (including their methodology).
The HB Caseload Statistics data source is the DWP 100% Single Housing Benefit Extract (SHBE). SHBE is a monthly electronic scan of claimant level data direct from LA computer systems. SHBE includes a field that contains the weekly amount that the HB of a household has been capped by. This marker is central to the production of the statistics on households that have had their HB capped.
UC capped household data are now sourced from the DWP UC Quarterly Statistics. Read more about UC Quarterly Statistics (including their methodology).
The UC Quarterly Statistics data source is the DWP UC Official Statistics database, which is compiled using data from systems within local offices and records of UC benefit payments made by the DWP. This database includes a field that contains the amount of UC that a household has been capped by for an assessment period, which is used in the production of these statistics.
UC data are returned on a particular count date each month. Statistics on households capped under UC do not include figures for those capped at the start of the UC rollout. The initial, largely clerical payment system, UC Live Service (UCLS), was gradually replaced by the current digital system, UC Full Service (UCFS). Since March 2019 UCLS ceased to be operational and all UC awards have been delivered via the current service. Due to data quality and reporting it is not possible to produce robust experimental statistics on the number of households that were capped under UCLS.
Note: UC statistics throughout this release refer to UCFS only. This is especially important to remember when looking at time series data.
Figures relating to households with their UC capped are subject to retrospection. All figures in these statistics have been updated as at November 2020. For more information, see the Background Information and Methodology document.
The benefit cap is applied to the combined income from benefits including:
- UC
- Income-based JSA
- Income Support
- Income-related ESA (except when the Support Component is in payment)
- HB
- Child Benefit and Child Tax Credit (CTC)
- other benefits, such as Incapacity Benefit and Bereavement Allowance
Read more about when benefits are affected by the cap and when benefits are not affected by the cap.
The benefit cap is applied by reducing the amount of HB or UC that a household receives, so its total benefits no longer add up to more than the cap level.
The statistics in this document show:
- The number of households that are currently capped or have ever been capped, as well as those newly capped and those who were capped due to the introduction of the lower cap level
- The proportion of HB and UC claimants that have their benefit capped at the Local Authority (LA) level
- The family make-up of capped households. From August 2019, this includes statistics on children in UC capped households
- The benefit make-up of HB capped households
- Average amount of benefits households are capped by (in £)
- The number of households that are no longer capped (off-flows), as well as a range of outcomes at off-flow for HB capped households – including those who move from HB to UC and remain capped, and the proportion of off-flows from the UC cap that are due to earnings
As set out in the response to the consultation on UC statistics, there are plans to further develop the set of UC statistics, in particular outcomes at off-flow.
Following user engagement, this publication (data to November 2020) will be the final time information on those affected by the current lower, tiered cap levels will be published. These data are currently presented in section 6 and in tables 7 and 14 of the accompanying ODS tables. If users have any queries or feedback, contact the statistics team.
HB geographies
In this release, HB data are presented using 2 sets of geographies:
- Administrative
- Residential
Administrative
This represents the administrative body responsible for administering the HB, and is therefore only meaningful at LA level. There are cases where the administrative LA is responsible for administering HB outside the geographical boundaries of the LA, and the responsibility for particular dwellings can also change with time.
Residential
This represents the geographic boundaries of the LA area and is determined by the location of the dwelling that the HB relates to. Residential geographies can be presented using a wide range of geographies based on the postcode level of the dwelling itself, usually ranging from the output areas (OAs), which comprise a few postcodes only, up to country level. Residential geographies may change if there is a change in the geographical boundaries, and affect all the dwellings affected by the boundary change.
Geography data
Geography data used in this publication are based on the address held by DWP before the COVID-19 pandemic. An update to the address held in the central data source from which geography information is taken has been deferred until any changes of address can be verified. This is most likely to affect new claimants who have not had recent contact with DWP before the pandemic. This does not affect the address information held on the UCFS or the SHBE that the claimant has declared on their claim.
Definitions
This report contains 5 measures for capped households:
- Point-in-time caseload – the number of capped households each month
- Cumulative caseload – the overall number of households that have ever been capped from the introduction of the benefit cap to the latest month. For UC this is from October 2016 to the latest month. It should be noted this includes households at the point when they first enter the cap.
- Off-flows – the number of previously capped households that are no longer capped at the latest month
- On-flows – the number of households that have their HB or UC capped for the first time each month
- Newly capped – the number of households that have their benefits capped for the very first time. This excludes on-flows to the UC cap having immediately off-flowed from the HB cap
For more information about this, see the Background Information and Methodology document.
4. The number of capped households in GB
At November 2020, 180,000 households had their benefits capped in GB:
-
150,000 had UC capped
-
25,000 had HB capped
180,000 households had their benefits capped at November 2020, an increase of 6% (10,000 households) on the previous quarter (August 2020).
The number of households capped under HB has continued to decrease (by 800 households or 3%) whilst the number of households capped under UC has continued to increase (by 11,000 households or 8%) since the previous quarter.
Number of capped households continues to increase, in line with rising number of UC claimants
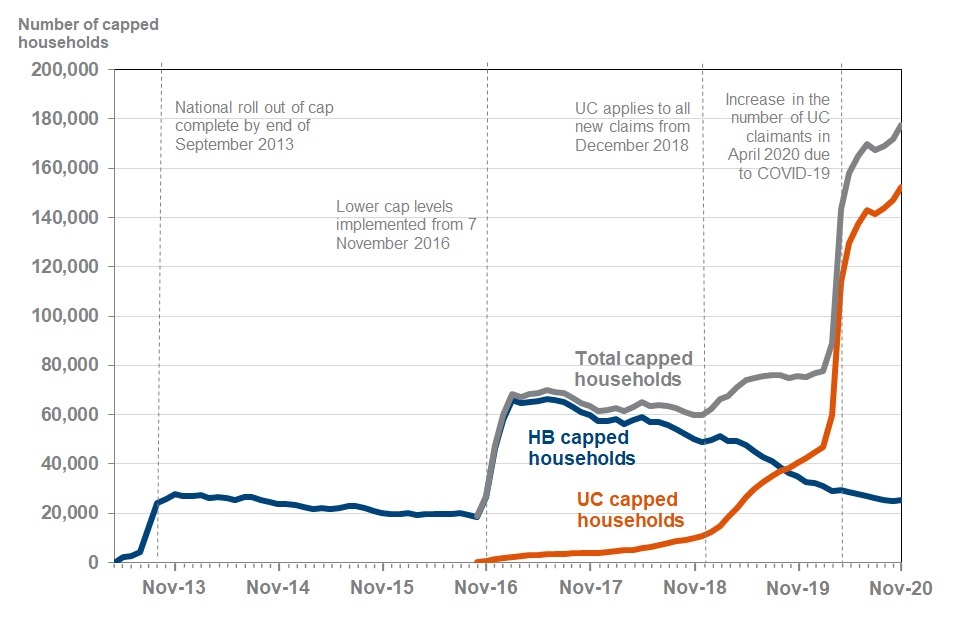
UC came into the scope of the benefit cap in October 2016 and capped households claiming UC steadily increased from 350 households (October 2016) to 11,000 households when UC was fully rolled out in December 2018. Up until this point, the overall capped caseload was driven by HB capped households which reached 66,000 households in February 2017, following the change to current cap levels. The caseload remained stable until August 2017 (65,000 households) when it started to slowly decrease.
Following the GB-wide roll out of UC in December 2018, the households capped on UC increased as HB claimants moved onto UC. The number of UC capped caseload overtook the HB capped caseload in October 2019, with 36,000 HB households capped and 38,000 UC households capped. Since then, HB-claiming households have continued to steadily decrease until November 2020 (25,000 households) which saw a small increase of 450 households since October 2020, which was driven by an increase of newly capped households at November 2020.
More recently, the COVID-19 pandemic has seen an increase of households claiming UC and therefore an increase in UC capped households. Between March 2020 and April 2020, the UC capped caseload increased by 90%, from 60,000 households to 110,000 households. From April 2020 to July 2020, the number of households capped on UC continued to increase to 140,000 households. However, in August 2020, 1% fewer households (1,500) were capped compared to the previous month. This dip should be seen in the context of COVID-19 easements in summer 2020. The increasing trend then continued to reach 150,000 UC capped households in November 2020.
See data table 3, data table 11 or Stat-Xplore for full data.
UC source data, DWP UC Quarterly Statistics, are subject to revision. The most recent quarter of data are therefore provisional and will be subject to revision in subsequent releases. It is expected that the overall provisional figures will be within two per cent of their revised figure in future releases.
33,000 households were newly capped in the last quarter.
The number of newly capped households has stabilised following a spike the start of the COVID-19 pandemic in April 2020
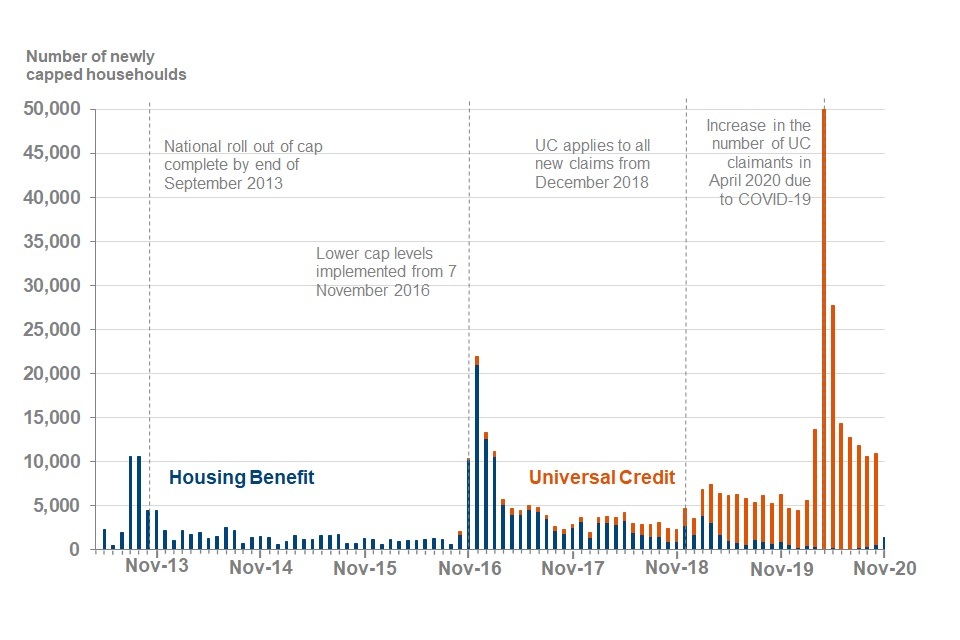
33,000 households had their benefits capped for the first time this quarter (August 2020 to October 2020). This is 21,000 (38%) fewer households than last quarter (May 2020 to July 2020), when 54,000 households had their benefits capped for the first time.
The number of newly capped households peaked in April 2020 (51,000 households), due to an increase in those claiming UC and the impact of changes to the UC standard allowance, in light of the COVID-19 pandemic.
Note: Newly capped households are those that have their benefits capped for the very first time. For UC, this excludes off-flows from the HB cap who then immediately become capped under UC. Whilst the number of on-flows to the UC cap at November can be identified, it is not possible to determine how many of those are newly capped because off-flows from HB (including no longer being capped on HB but now capped on UC) are not yet available.
460,000 households have been capped at some point between April 2013 and November 2020.
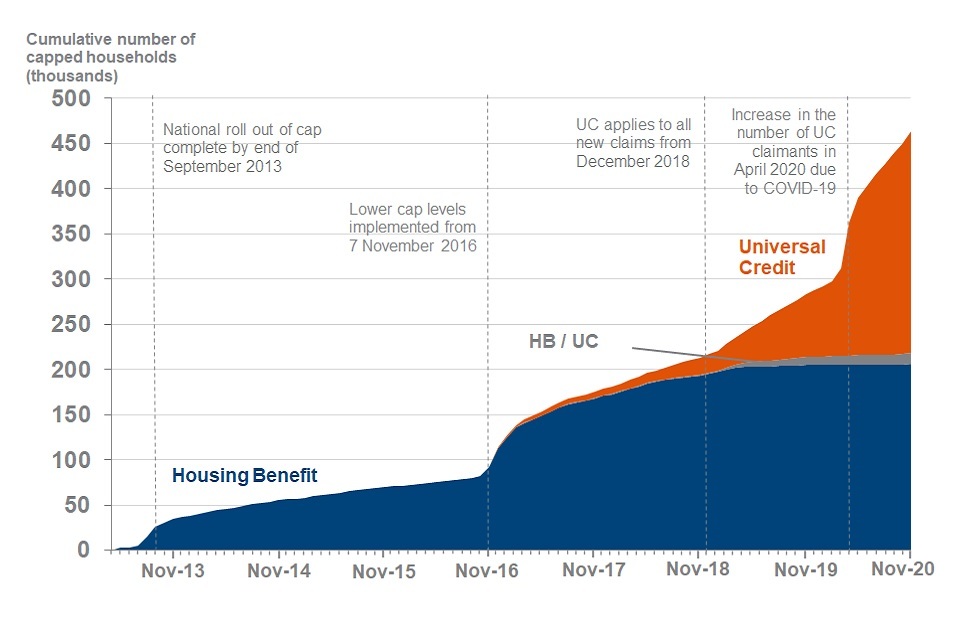
260,000 households have had their UC capped at some point between October 2016 and November 2020. 220,000 households have had their HB capped at some point between April 2013 and November 2020.
Sharp rises in the number of households that have ever had their benefits capped can be observed over time as a result of:
- the national roll out of the cap in September 2013
- the introduction of the current lower cap levels in November 2016
- the national roll out of UC in December 2018
- the start of the COVID-19 pandemic in March 2020
The increases can be explained by the number of newly capped households joining the cap following these events. The COVID-19 pandemic has seen the total number of households that have ever had their benefits capped rise by 49% from 310,000 at March 2020, to 460,000 at November 2020. The increase should be viewed in context with the increase in UC caseload, since the start of the COVID-19 pandemic.
Note: Up to November 2020 (data to August 2020), these data have been carrying a double count for households which flowed off the HB cap then immediately flowed onto the UC cap. This double count has now been removed. For this reason, data are not comparable to previous releases.
5. Characteristics of capped households
The proportion of households claiming benefits that have their benefit capped remains steady at November 2020.
2.3% of households claiming HB or UC had their benefits capped at November 2020; this is a small increase from 2.2% households at August 2020.
The proportion of UC claiming households at November 2020 remains steady
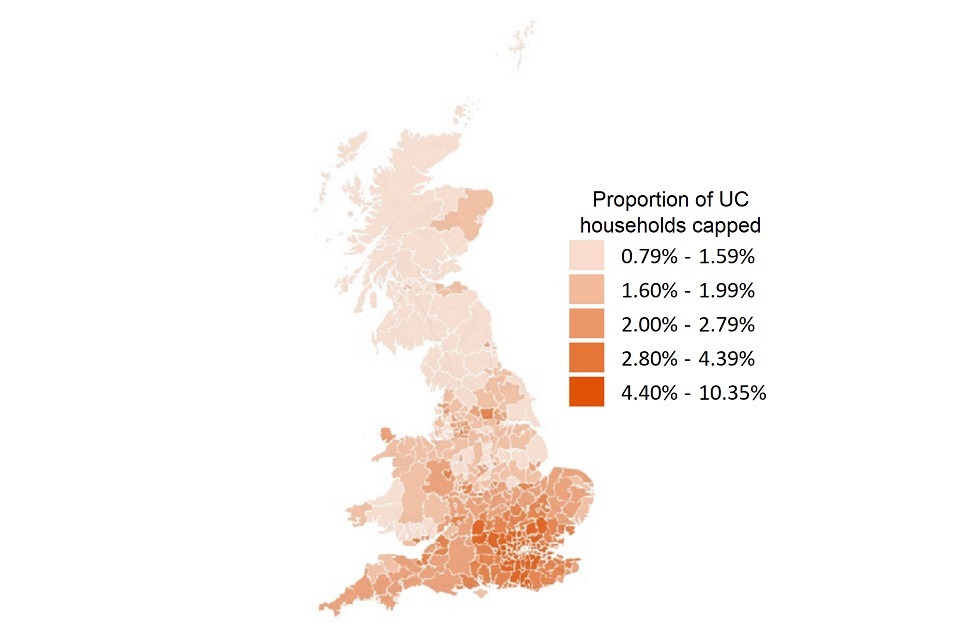
The proportion of households claiming UC, that had their benefits capped at November 2020 was 3.1%, the same as the proportion at August 2020. The London region had the highest proportion of UC households affected by the benefit cap, with 6.1% capped at November 2020, the same as the proportion at August 2020.
Of the 10 Local Authorities (LAs) with the highest proportion of UC households having their benefits capped, 7 of them are in the London region, at November 2020.
At November 2020, Scotland remains the region with the lowest proportion of UC households capped, at 1.3%.
See data table 18, and Households on UC through Stat-Xplore for full data on the proportion of UC capped households.
The proportion of HB claiming households at November 2020 remains steady
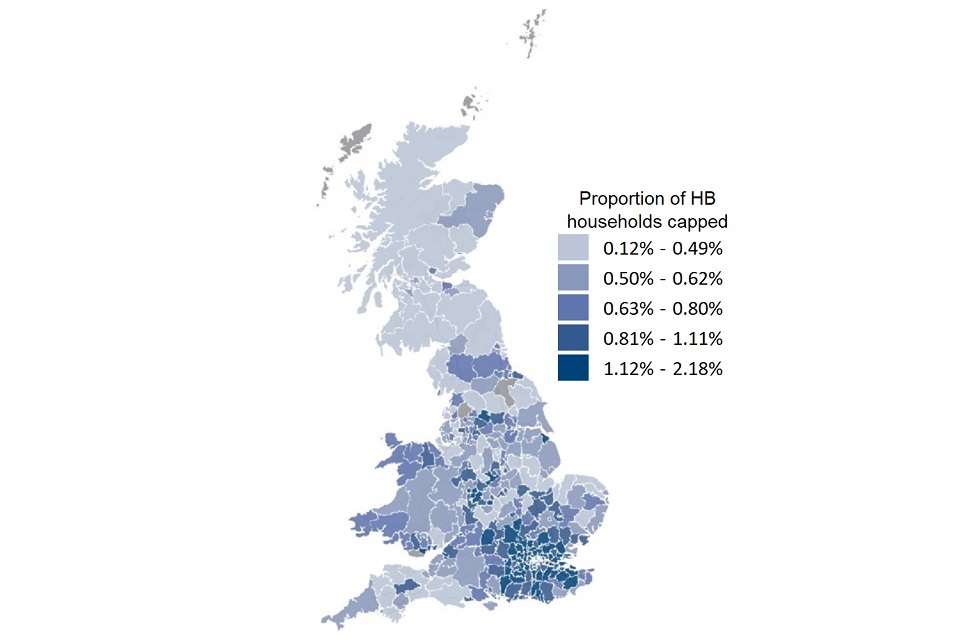
0.9% of households claiming HB had their benefits capped at November 2020, the same as the proportion at August 2020. The London region had the highest proportion of HB households affected by the benefit cap: 1.2% at November 2020, the same as the proportion at August 2020.
At November 2020, Scotland remains the region with the lowest proportion of HB households capped at 0.4%.
See data table 18, and HB data from April 2018 through Stat-Xplore for full data on the proportion of HB capped households.
Note: HB and UC statistics are provided on the same geographies with both being reported on residential LAs. Administrative data for HB is available in the ODS tables (1, 2, 3 and 7) and Stat-Xplore. Read the Background Information and Methodology document for more information. The benefit cap can only be applied to households with at least one working age claimant. HB can be claimed by households with single pension age claimants therefore caution should be taken when interpreting these statistics.
LAs which are shaded grey in the above maps could be due to several factors such as data being sparse and/or missing.
6 in 10 households that have their benefits capped are single-parent families.
Since the start of the COVID-19 pandemic, the proportional composition of household type has changed. There is now a:
- lower proportion of capped households with children; 93% (72,000 households) at February 2020 compared with 84% (150,000 households) at November 2020
- higher proportion of capped households with single people; 7% (5,700 households) at February 2020 and 16% (29,000 households) at November 2020
Family type of capped households has changed since the start of the COVID-19 pandemic
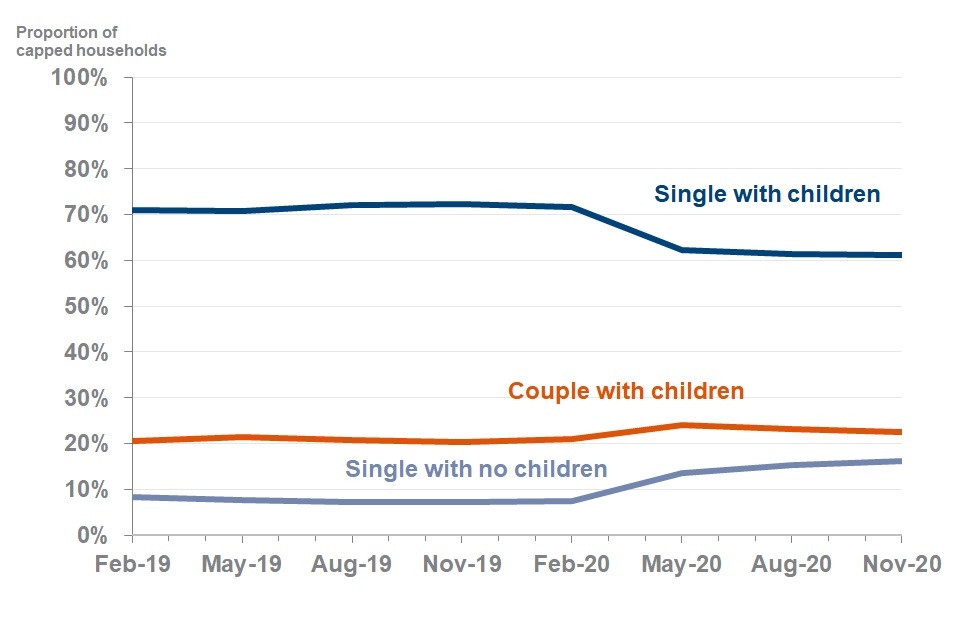
61% (110,000) of households that had their benefits capped at November 2020, were single-parent families; this is similar to the previous two quarters (62% at May 2020 and 61% at August 2020). Prior to May 2020, the proportion of single-parent families with their benefits capped was consistently between 71% and 72%.
Single-person households with no children remained a similar proportion of the capped caseload between February 2019 (8% or 5,500 households) to February 2020 (7% or 5,700 households). This proportion has risen slightly in the most recent quarters, from 14% (21,000 households) at May 2020 to 16% (29,000 households) at November 2020.
Just over half (51%) of all capped households with children have a youngest child under the age of 5
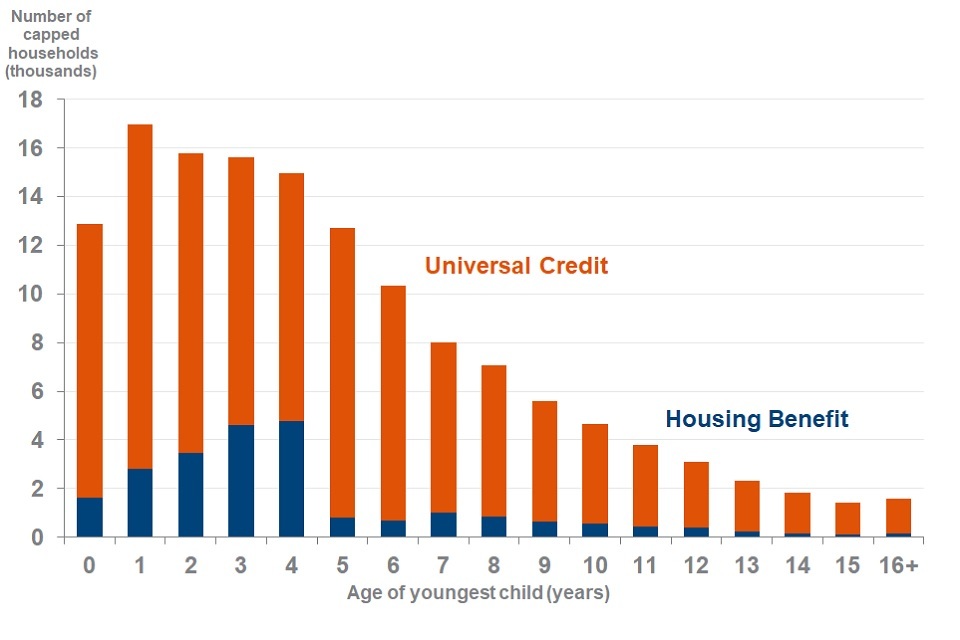
At November 2020, 50% (54,000) of single-parent capped households have at least one child aged under 5 years, including 18% (20,000) with a child aged under 2 years.
84% of currently capped households include children.
At November 2020, 150,000 households (84%) that had their benefits capped included children. 82% (130,000) of UC capped households included children and 93% (23,000) of HB capped households included children.
Of the households including children, capped at November 2020:
- 89% (130,000) had between 1 and 4 children
- 5% (7,600) had 5 or more children
Note: Due to merging administrative datasets, the proportions above do not sum to 100%, as some records contain an unknown number of children.
UC capped households have fewer children than HB capped households
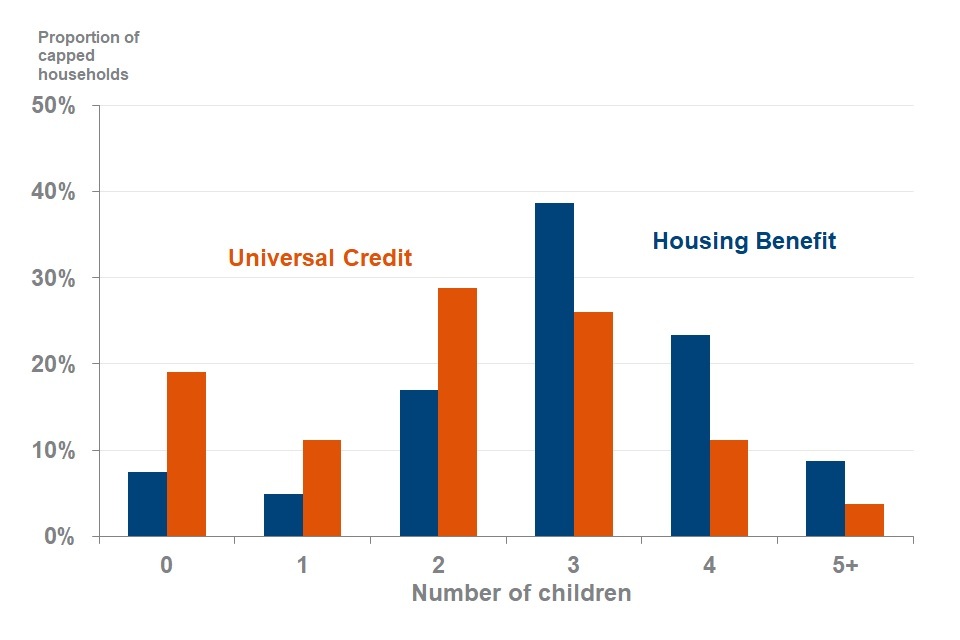
Since February 2020 (data at November 2019) a new methodology to determine the number of children was developed. Figures prior to this cannot be compared.
Child Benefit and CTC are both in scope for the HB cap, so households in receipt of these benefits are more likely to exceed the cap limit and be capped.
See data table 2, data table 9, data table 17 or Stat-Xplore for full data on the family make-up of capped households.
See data table 5 or data table 15 for full data on the age of youngest child by family type at August 2020.
See data table 8 for full data on the cumulative HB cap caseload by family type and age of youngest child.
HB Capped households by benefit make-up
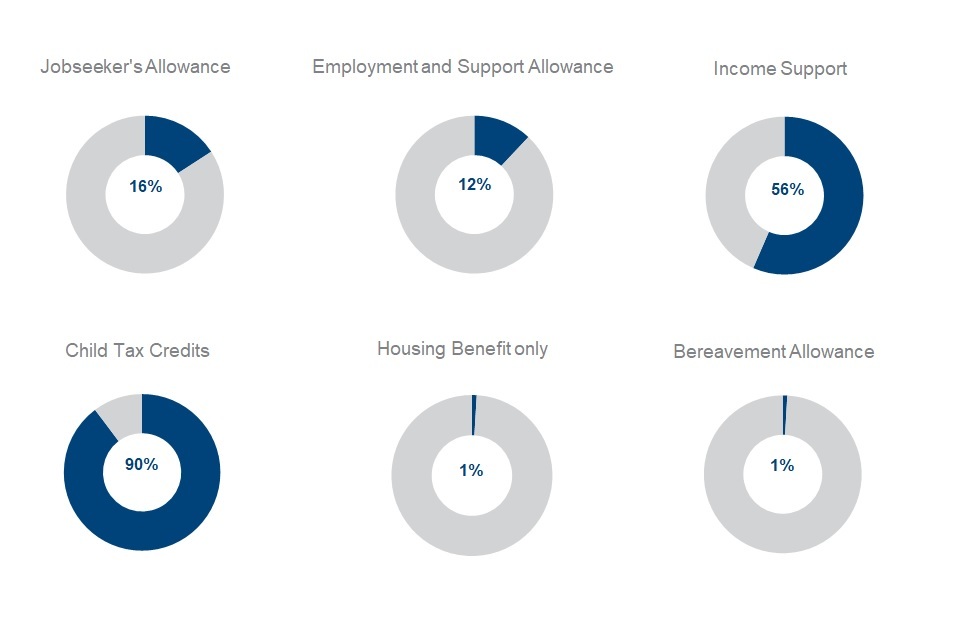
Of HB capped households at November 2020:
- 16% (4,000) were claiming Jobseeker’s Allowance
- 12% (3,000) were claiming Employment and Support Allowance (Assessment Stage and Work-Related Activity Group only)
- 56% (14,000) were claiming Income Support
- 90% (23,000) were claiming Child Tax Credits
- 1% (240) were claiming HB only
- 1% (230) were claiming Bereavement Allowance
Proportions have been calculated based on unrounded data. See data table 6 for full data.
Capped households can be in receipt of multiple benefits and therefore percentages for households in receipt of each benefit do not sum to 100%. More information on benefits that are in-scope for the benefit cap and those that are exempt can be found in the Background Information and Methodology document. Analysis is based on benefit claims by the lead claimant in a household and, where applicable, their partner. Equivalent information is not available for UC, at this time. DWP has plans to develop the methodology to provide the benefit make-up of UC capped households.
6. Households capped due to current lower, tiered cap levels
78% of capped households had their benefits capped due to the introduction of lower cap levels
The benefit cap was introduced from April 2013. Changes to the benefit cap were announced in the Summer Budget 2015 and the current lower, tiered levels were introduced from 7 November 2016.
Across GB, 78% (120,000) of UC households capped at November 2020 were capped because of the introduction of the current lower, tiered cap levels.
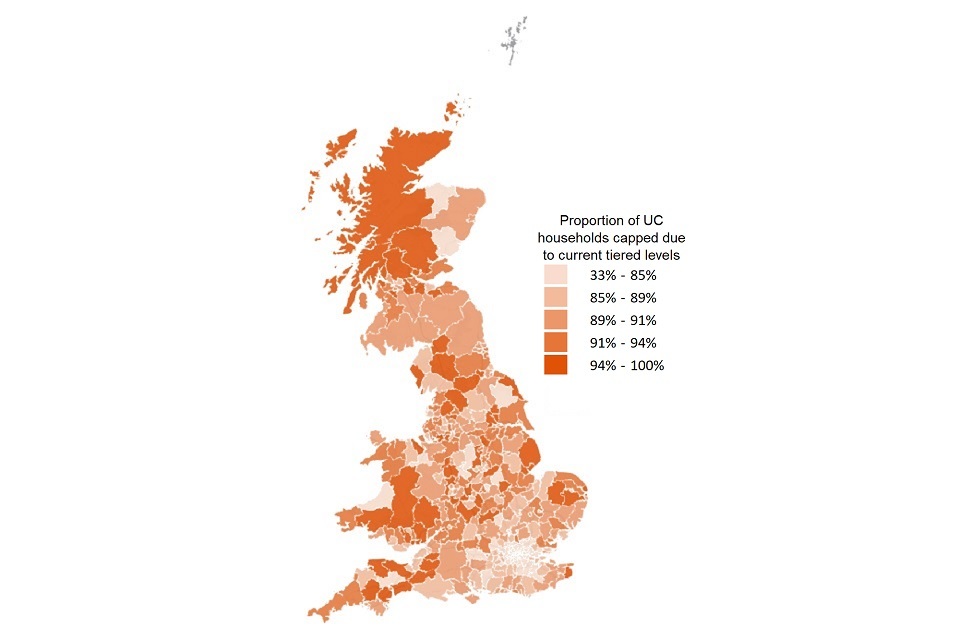
57% of UC capped households in London are capped due to the current lower, tiered cap levels. This is a much lower proportion than the next highest region, which is 87% of UC capped households in the South East region.
See data table 14 for full data on the number of UC households capped because of the lower cap levels.
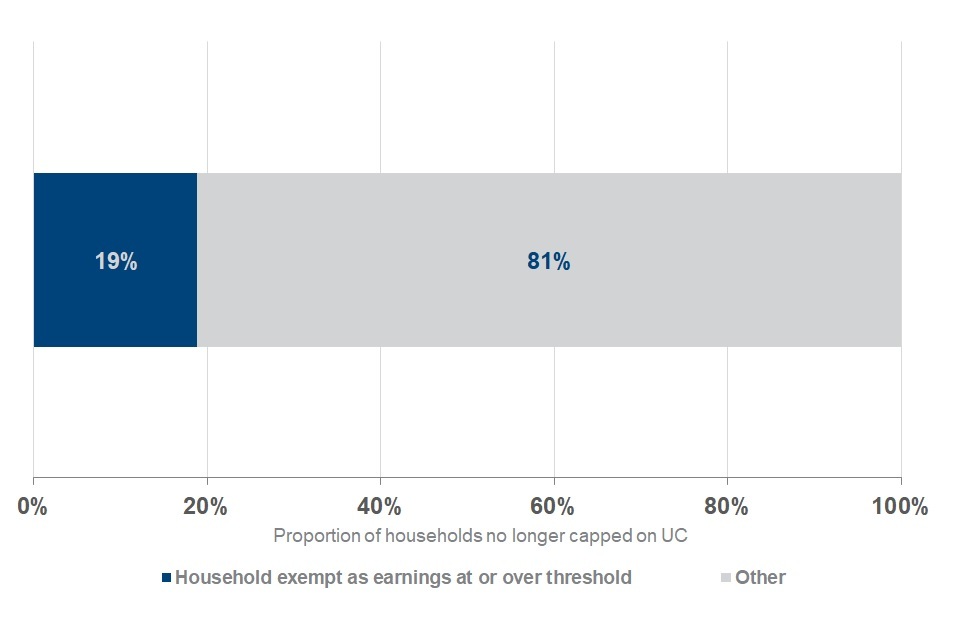
Across GB, 81% (21,000) of HB households capped at November 2020 were capped because of the introduction of the current lower, tiered cap levels.
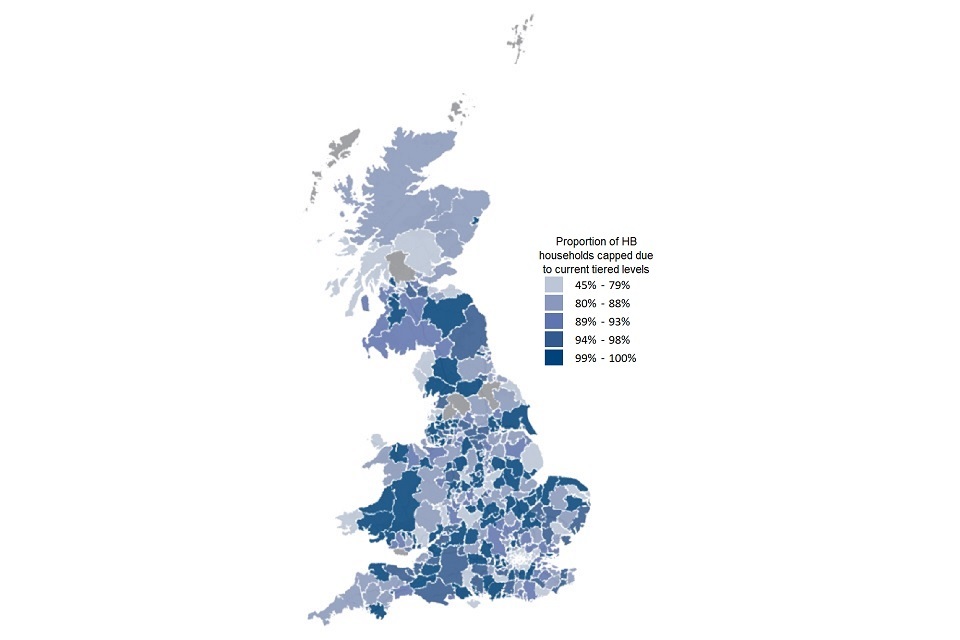
See data table 7 for full data on the number of HB households capped because of the lower cap levels.
Note: HB and UC statistics are based on different geographies. It is important to note the distinction between residence-based (for UC) and administrative-based (for HB) geographies as they are not always directly comparable. See the Background Information and Methodology document for more information.
LAs which are shaded grey in the above maps could be due to several factors such as data being sparse and/or missing.
7. The financial impact of being capped
Households had their benefits capped by an average of £55 a week, at November 2020.
The weekly average (mean) amount that households are capped by is slightly decreasing
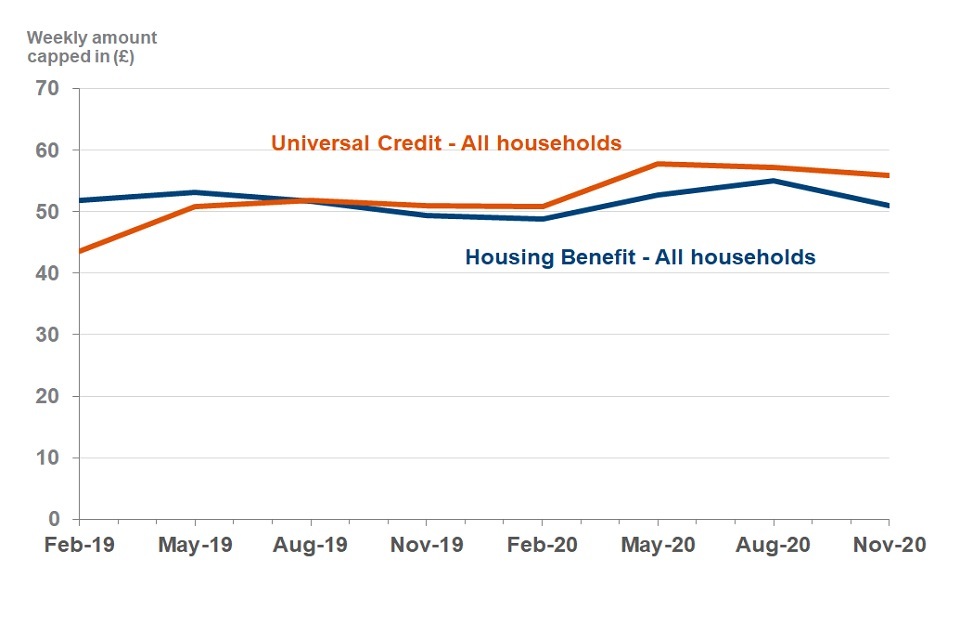
The average monthly amount that UC households are capped by is £242, at November 2020. This is the equivalent of £56 per week, a decrease from £57 at August 2020. The average weekly amount that HB households are capped by is £51, at November 2020, a decrease from £55 at August 2020.
Since the start of the COVID-19 pandemic, average cap amount has increased for both benefit types:
- UC from £51 at February 2020 to £56 at November 2020
- HB from £49 at February 2020 to £51 at November 2020
UC is assessed and paid monthly and the benefit cap is applied to the full UC award. For these statistics, a weekly cap equivalent has been calculated for UC households by dividing the amount a household has been capped by in an assessment period (which lasts one month) by 4.33.
The average weekly amount of benefits capped refers to the mean amount.
See the Background Information and Methodology document for further details.
The difference in average cap amounts across the two benefits may be affected by the differences in their caseload compositions and the different entitlement conditions across the benefits. The UC cap caseload contains a larger proportion of single people and smaller families, affecting the average amount that households are capped.
The benefit cap is applied to the full UC award not just to housing costs. Therefore, direct comparisons of cap amounts across HB and UC should be made with care.
See Stat-Xplore for full data, including by region and LA.
58% of households had their UC capped by £50 or less per week.
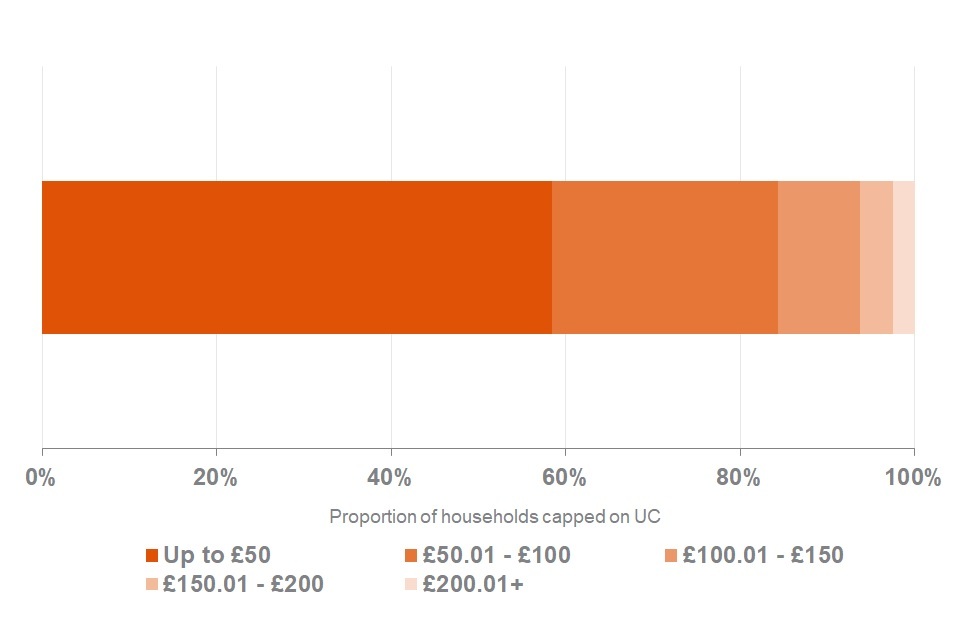
At November 2020:
- 58% (89,000) of households that had their UC capped were capped by the equivalent of £50 or less per week
- a further 26% (39,000) were capped by the equivalent of £50 to £100 per week
- 2.5% (3,800) were capped by the equivalent of £200 or more a week including 0.4% (640) capped by the equivalent of more than £300 per week
See data table 9 or Stat-Xplore for full data.
61% of households had their HB capped by £50 or less per week.
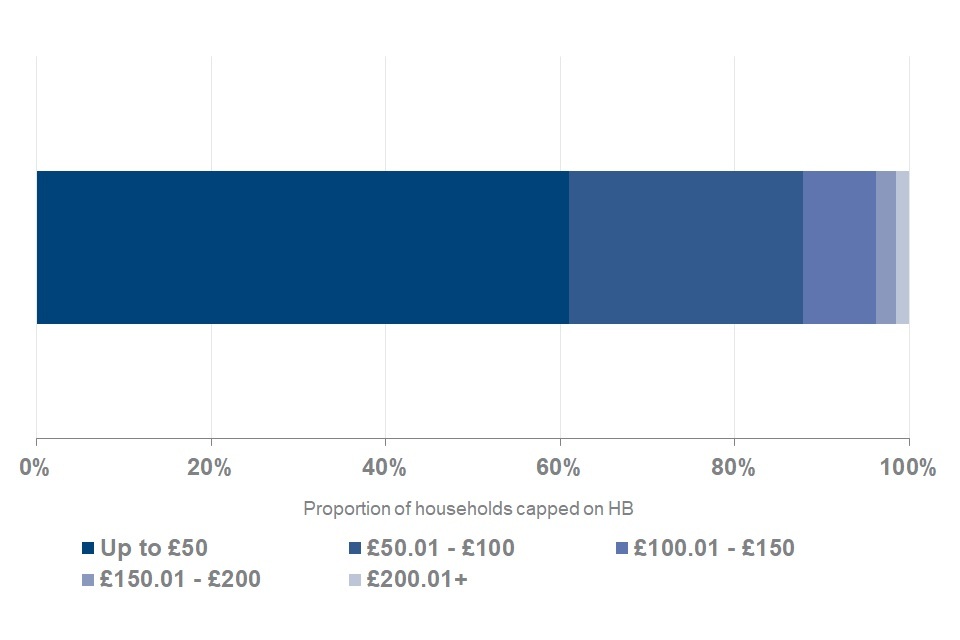
At November 2020:
- 61% (15,000) of households that had their HB capped were capped by £50 or less per week
- a further 27% (6,800) were capped by £50 to £100 per week
- 1.6% (390) were capped by £200 or more a week including 0.4% (100) capped by more than £300 per week.
From 7 November 2016, cap levels were lowered, and different cap levels for households inside and outside Greater London were introduced, replacing the single cap level that existed previously. See data table 2 or Stat-Xplore for full data.
8. Moving off the cap
290,000 (62%) households that once had their benefits capped, were no longer capped at November 2020.
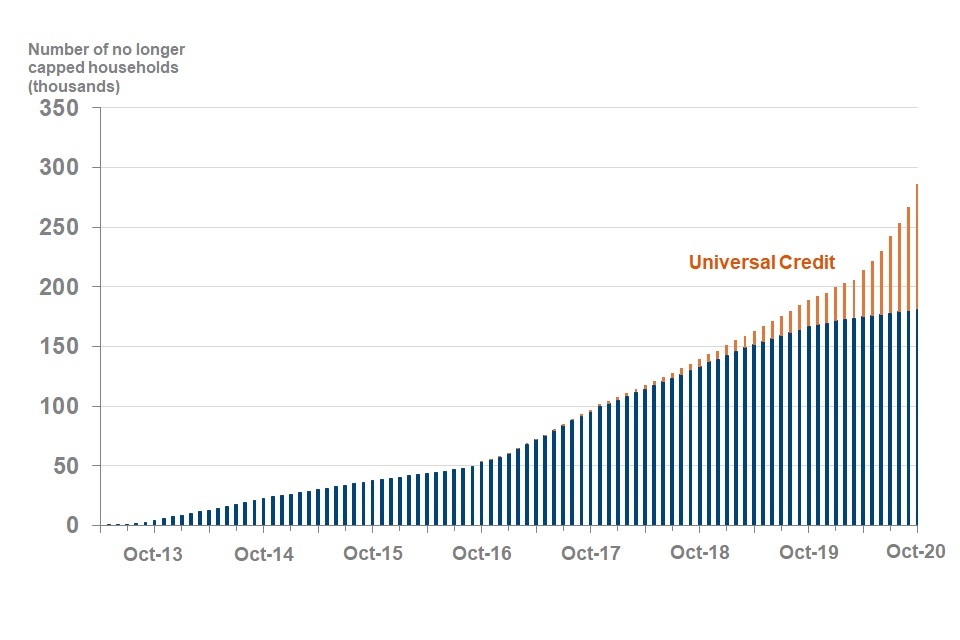
290,000 households who had their benefits capped at some point between 15 April 2013 and October 2020, were no longer capped at November 2020. This is an increase of 44,000 from last quarter (August 2020).
110,000 (41%) households that once had their UC capped were no longer capped at November 2020, an increase of 40,000 since last quarter (August 2020). Of the households who have had their HB capped, 190,000 (88%) had left the HB cap at November 2020. This is an increase of 4,400 from last quarter.
Of the 40,000 UC claiming households that were no longer capped since last quarter, 25% (10,000 households) were on-flows during this quarter. On-flows are defined as “the number of households that have their HB or UC capped for the first time” this means that these households had their UC capped for the first time this quarter.
See data table 4, data table 16 or Stat-Xplore for full data.
Off-flow statistics for capped households are not directly comparable with previous statistics, due to developments in the production of the statistics. From 1 August 2019, households whose outcome for leaving the HB cap had been to move to UC are now divided into a) those that have moved to UC and are capped, and b) those that are no longer capped under UC. Due to this, total off-flow figures do not include households that move from being capped under HB to being capped under UC, although these would count as households leaving the HB cap. In order to be counted as an off-flow from the cap, a household must no longer be capped on either benefit. Benefit cap off-flow outcome statistics for UC and HB are not directly comparable as the UC and HB policies are different. Further UC off-flow statistics are still in development.
19% of all households that previously had their UC capped, moved off the cap because of earnings.
Of the 100,000 households that no longer had their UC capped at November 2020, 19% (20,000) became exempt as they were earning at least the level of the threshold at which households become exempt from the benefit cap.
At November 2020 (off-flows from August 2020 to October 2020), 16% of households (6,300) that flowed off the cap, left the cap due to having earnings at, or over, the earnings threshold of £604 per assessment period. This has decreased from 19% (4,800 households) at August 2020 (off-flows from May 2020 to July 2020).
The earnings exemption threshold is subject to change each financial year. At the financial year 2020/21 the earnings exemption threshold is set at £604 per assessment period. The earnings exemption threshold will be updated in April 2021 for the financial year 2021 to 2022. Details of previous exemption threshold levels can be found in Background Information and Methodology document.
See data table 16 for full data broken down by Region.
Outcome statistics for households no longer capped under UC are still under development and are not comparable with statistics for outcomes of those who are no longer capped under HB. Outcomes figures related to moving into work have been presented separately for UC and HB. This is because under UC, a household is exempt from the cap when earnings in each assessment period are at least the level of the earnings exemption threshold (for 2020 to 2021 this is £604). Under HB, a household becomes exempt from the cap if it is entitled to WTC, which depends on hours of paid work (at least 30 hours for those aged 25 to 59, at least 16 hours for single people with 1 or more children, and at least 24 hours between a couple with 1 or more children).
Off-flow outcomes are shown as at the end of the quarter in which a household moved off the benefit cap, meaning the outcomes are fixed at that point, unless a household is re-capped at a later date. More detail on the way off-flow outcomes are determined is included in the Background Information and Methodology document.
31% of households that previously had their HB capped, moved off the HB cap with an open WTC claim.
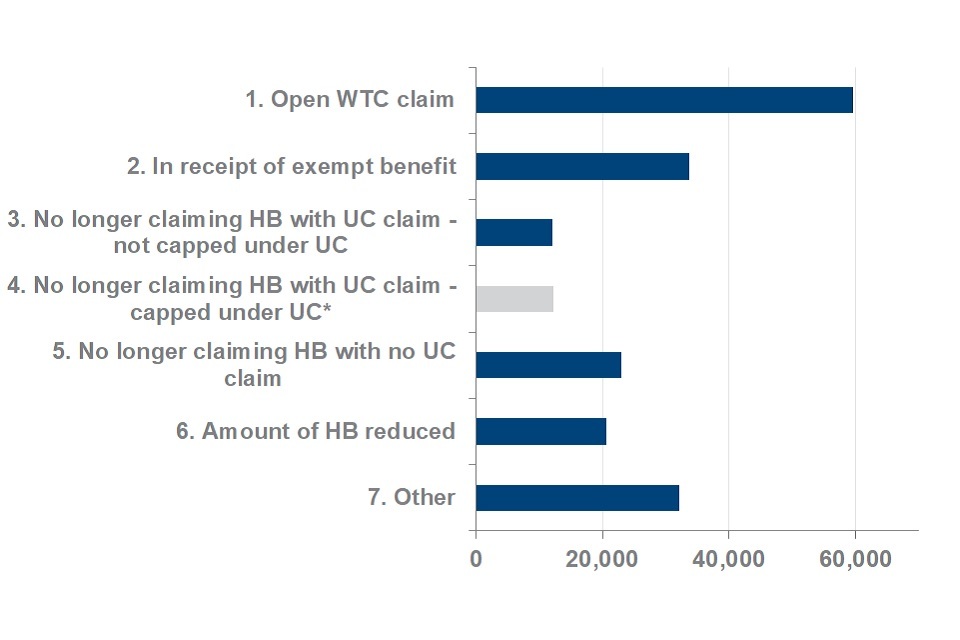
For illustration purposes and consistency with previous releases, households which have flowed from HB on to the UC cap have been included. These households are not considered in the overall off-flow figures from the benefit cap.
88% (190,000) of households that have previously had their HB capped were no longer capped at November 2020. This is an increase of 4,400 households on the previous quarter (August 2020).
Of the 190,000 households that no longer had their HB capped at November 2020, 60,000 were exempt with an open WTC claim at the time they moved off the cap, indicating that they moved into work. This is 31% of those no longer capped.
24,000 (13%) households that no longer had their HB capped at November 2020, were no longer claiming HB when they moved off the cap, but had started to claim UC. Of these, 12,000 (50%) were no longer capped after moving to UC.
See data table 4 for full data.
Households can flow off the cap for many different reasons and there may be several reasons why a household is no longer capped. These reasons are ranked (as in the chart above) and only the highest ranking reason per household is counted.
See the Background Information and Methodology document for more information on how the ranking was developed and is applied, as well as detail the way off-flow outcomes are determined.
Since December 2018, WTC has been replaced by UC with only a small number of the population able to apply for WTC, read the eligibility criteria.
32% of single-parent households that flowed off the HB cap, left with an open WTC claim.
For single-parent households with a child aged under 2 years, 88% (26,000) were no longer capped at November 2020. Of these, 35% (9,100) were exempt with an open WTC claim when they moved off the cap, indicating that they moved into work.
For single-parent households with a child aged under 5 years, 83% (74,000) were no longer capped at November 2020. Of these, 34% (25,000) were exempt with an open WTC claim when they moved off the cap, indicating that they moved into work.
See data table 8 for a full data by age of youngest child.
UC has replaced tax credits since December 2018, meaning there are no new claims. However, if a claimant is getting CTC and they start work they can claim WTC because it is treated as a change of circumstances, which doesn’t require them to move across to UC.
Off-flow outcomes are shown as at the end of the quarter in which a household moved off the benefit cap, meaning the outcomes are fixed at that point, unless a household is re-capped at a later date. More detail on the way off-flow outcomes are determined is included in the Background Information and Methodology document.
Statistics on children in UC households are not currently available. More information can be found in the Background Information and Methodology document.
9. About these statistics
Experimental Statistics on households that had their UC capped
This release contains experimental statistics on the number of households that have had their UC capped, alongside the quarterly HB cap statistics. Since August 2019, we have published additional information on households that have their UC capped, including the number of children in these households. We are also able to identify whether households that move from HB to UC continue to be capped.
UC was introduced in 2013, and is available for all new claims across GB. UC gradually rolled out between May 2016 and December 2018. The government currently plans that by the end of 2024, all existing legacy claimants will have moved on to UC. Since UC fully rolled out, the number of households that have their UC award capped has increased and the number capped under HB has declined. In October 2019, the UC capped caseload exceeded the HB caseload for the first time.
Statistics on households capped under UC do not include figures for those capped at the start of the UC rollout. The initial, largely clerical payment system, UCLS, was gradually replaced by the current digital system, UCFS. Since March 2019, UCLS ceased to be operational and all UC awards have been delivered via the current service. Due to data quality and reporting it is not possible to produce robust experimental statistics on the number of households that were capped under UCLS. When looking at figures in a time series, it should be noted these exclude figures for UCLS in the period from April 2013 until March 2019.
Data sources
Data used to create the statistics comes from administrative databases. For these, accuracy is determined by how well the information is recorded and transmitted.
HB Data
The main source of data on households that had their HB capped is the HB Caseload Statistics. Read more about HB Caseload Statistics (including their methodology).
The HB Caseload Statistics data source is the DWP 100% SHBE. SHBE is a monthly electronic scan of claimant level data direct from LA computer systems. SHBE includes a field that contains the weekly amount that the HB of a household has been capped by. This marker is central to the production of the statistics on households that have had their HB capped.
HB Caseload Statistics are merged with 100% DWP benefit scans, to give data on the types of benefits claimed by capped households, and with Her Majesty’s Revenue and Customs (HMRC) child benefit data, to give information on the age of the youngest child dependant in a capped household. HB caseload statistics are merged with Working Tax Credit data and 100% DWP benefit scans to provide information on the outcomes of households that have off-flowed from the benefit cap.
Data on those households who have ever had their HB capped that are no longer capped is linked to HMRC and DWP benefits data to determine why households are no longer capped.
UC Data
The main source of data on households that had their UC capped is the UC Quarterly Statistics. Read more about UC Quarterly Statistics (including their methodology).
The UC Quarterly Statistics data source is the DWP UC Official Statistics database, which is compiled using data from systems within local offices and records of UC benefit payments made by the DWP. This database includes a field that contains the amount of UC that a household has been capped by for an assessment period, which is used in the production of these statistics.
Data are merged with the DWP Customer Information System address file so that the number of households that have had their UC capped can be broken down by region and LA.
Data on households that have had their UC capped are matched with the full DWP UC Official Statistics database to obtain information on earnings, which is used to determine which households moved off the cap under UC due to becoming exempt due to their earnings.
The number of children and age of the youngest child dependant in a household is calculated by merging data held on HMRC child benefit systems to data on UC capped households. This detail is available for capped households only, and not the UC caseload.
Data coverage and reporting month
LAs extract and return their HB data to the DWP over a four week rolling period based on an extraction schedule for each LA. For example, “February 2020” data shown last quarter was typically extracted between 28 January and 21 February 2020. Each LA may extract its data up to a week before the date it is scheduled to be returned to the DWP. Consequently, the statistics do not directly relate to a particular date but rather show the position of capped cases over a monthly cycle.
To be counted as being on UC a household must have an assessment period spanning the ‘count date’ for a particular month. An assessment period is the period of a month for which a UC payment is made. The count date is the second Thursday of the month. Entitlement to UC must also have been calculated.
Definition of a household
For the purposes of the benefit cap policy and hence this analysis, a household is defined as:
“One or two adults, living together as a couple, plus any dependent children they are living with”
This may also be termed a ‘benefit unit’. This differs from the Office for National Statistics (ONS) definition that defines a household as one person alone; or a group of people (not necessarily related) living at the same address who share cooking facilities and share a living room or sitting room or dining area. A household by the ONS definition may contain multiple benefit units.
There are a small number of cases where an individual and household has more than one HB claim, for these cases, only the most recent claim is reported on.
Changes to the benefit cap amounts from 7 November 2016
The Summer Budget 2015 announced changes to the level of the benefit cap. The cap amounts changed from 7 November 2016 to:
- £20,000 a year (£13,400 for single adults with no children) nationally
- £23,000 a year (£15,410 for single adults with no children) in Greater London (the 32 London boroughs and the City of London)
The changes in cap levels were rolled-out across LAs from 7 November 2016 to 20 January 2017. From March 2017, data for all LAs reflects the lower cap levels.
Where to find out more
Use Stat-Xplore to create your own tables and further breakdowns of these statistics.
View national and regional figures in an interactive visualisation.
Read older releases of these statistics.
Read Background Information about these statistics.
Read statistics for households who have their benefits capped in Northern Ireland.
Read statistics on HB caseload.
Read statistics on UC.
Read statistics on Local Authorities’ use of Discretionary Housing Payment funds.
Read more information on the benefit cap.
Contact us
Contact us for statistical enquiries and publication feedback only please.
Lead Statistician: Lee McGargill
Produced by: Charlotte Stubbs
DWP Press Office: 0203 267 5144