Benefit cap: number of households capped to August 2021
Updated 19 January 2022

© Crown copyright 2022
This publication is licensed under the terms of the Open Government Licence v3.0 except where otherwise stated. To view this licence, visit nationalarchives.gov.uk/doc/open-government-licence/version/3 or write to the Information Policy Team, The National Archives, Kew, London TW9 4DU, or email: psi@nationalarchives.gov.uk.
Where we have identified any third party copyright information you will need to obtain permission from the copyright holders concerned.
This publication is available at https://www.gov.uk/government/statistics/benefit-cap-number-of-households-capped-to-august-2021/benefit-cap-number-of-households-capped-to-august-2021
The latest release of these statistics can be found in the collection of benefit cap statistics.
The benefit cap is a limit on the total amount of benefit that most working age people can get.
The amount of benefit a household receives is reduced to ensure claimants do not receive more than the cap limit. The benefit cap can be applied through either:
- Universal Credit (UC)
- Housing Benefit (HB)
The benefit cap was introduced in April 2013. It was initially applied to HB and subsequently to UC, as UC was gradually rolled out. UC replaces 6 means-tested benefits including HB and since December 2018, UC has been available across Great Britain (GB) to people applying for means-tested social security support. However, a small number of the population may still apply for HB. Read about who can get HB. DWP still expects the movement of legacy benefit claimants to Universal Credit to be completed by 2024.
When the benefit cap was introduced in April 2013, the cap level set initially was:
- £26,000 per year
- £18,200 per year for single adults with no children
The Summer Budget 2015 announced changes to the level of the benefit cap to:
- £20,000 per year (or £13,400 for single adults with no children) nationally
- £23,000 per year (£15,410 for single adults with no children) in Greater London
These lower, tiered cap levels were introduced from 7 November 2016 and remain the current cap limits.
1. Main stories
The main stories are:
-
180,000 households had their benefit capped at August 2021, a decrease of 2% on the previous quarter
- when compared to the previous quarter (May 2021), the number of households capped under UC has continued to decrease. The number of households capped under UC has decreased by 1%, or 1,500 households. The volumes at August 2021 are still significantly higher than at March 2020, but as the UC caseload decreases, the volume of households capped on UC is also beginning to decrease, as people return to work
-
2.7% of households claiming HB or UC had their benefits capped at August 2021, the same as at May 2021
-
29,000 households became capped for the first time in the quarter to August 2021:
- the proportion of households that left the HB cap with an open Working Tax Credit (WTC) claim in the quarter to August 2021 was 10% (390 households). This is an increase of 100 households, compared with 7% (280 households) to May 2021
-
68% (380,000) of households that have ever been capped were no longer capped at August 2021, of these 25% (95,000) of households were no longer capped due to working or earning enough to be exempt from the cap:
Fewer households became capped than those leaving the cap between May 2021 and August 2021
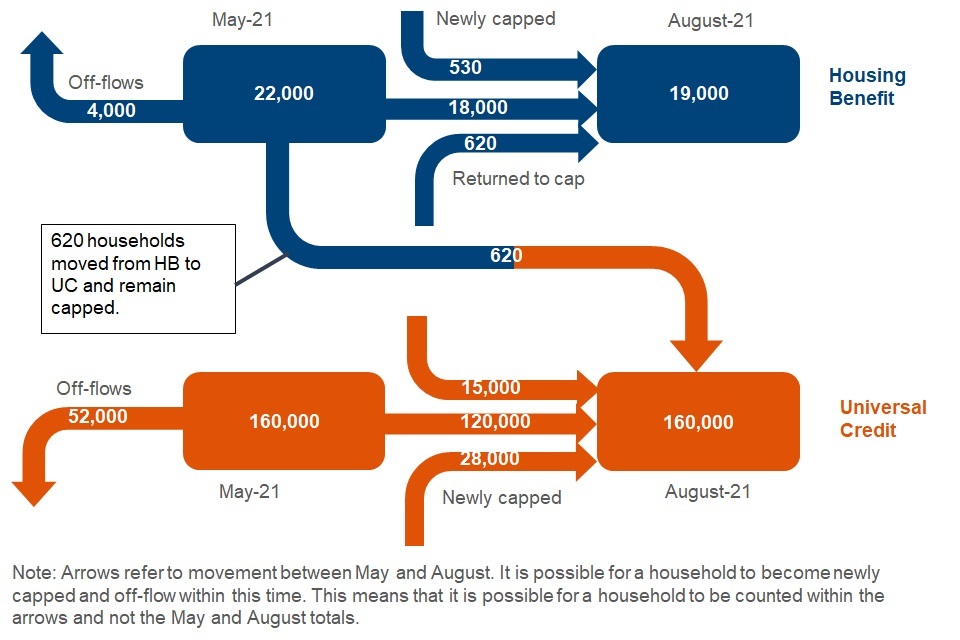
In the latest quarter for households capped on HB:
- the number of households that had their HB capped decreased from 22,000 (at May 2021) to 19,000 (at August 2021), a 12% decrease
- 18,000 households remained capped on HB at August 2021
- 4,000 households off-flowed from the benefit cap, which means no longer on the benefit cap (between May 2021 and July 2021). Of the 4,000 off-flows, 52% (2,100 households) were no longer claiming HB. Of these, 79% (1,700) of households no longer claiming HB are now claiming UC
- 620 households moved from HB to UC and continued to be capped (between May 2021 and July 2021)
- 530 households were newly capped, which means on the benefit cap for the first time (between May 2021 and July 2021):
- of the 530 newly capped HB households, 90 were also off-flows within the same time-period (May 2021 to July 2021)
- 620 households returned to the HB cap that had been capped prior to, but not at, May 2021
In the latest quarter for households capped on UC:
- the number of households that had their UC capped at August 2021 was 160,000, a decrease of 1,500, or 1%, from May 2021
- 120,000 remained capped at August 2021
- 52,000 off-flows (between May 2021 and July 2021)
- 620 on-flows from the HB cap (between May 2021 and July 2021). An on-flow is a household that is capped for the first time on the respective benefit (HB or UC). In this case it is not the first time the household was on the benefit cap, rather the first time it was capped under UC
- 28,000 newly capped (between May 2021 and July 2021)
- 15,000 returned to the UC cap that had been capped prior to, but not at, May 2021
Of the 29,000 (28,000 newly capped and 620 on-flows from the HB cap) households that on-flowed to the UC cap, 9,100 also off-flowed within the same time period (May 2021 and July 2021).
Note: Figures relating to on-flows, newly capped and off-flows refer to the time period of May 2021 to July 2021. Whereas figures relating to remaining capped or returning to the cap refer to the time period of May 2021 to August 2021. The difference is due to the methodology used to obtain outcome at off-flow (including households that flow from the HB cap to the UC cap), as it is not possible to obtain outcome data for August 2021, at August 2021. Figures within this release have been rounded in line with our rounding policy.
2. The number of capped households in GB
At August 2021, 180,000 households had their benefits capped in GB:
- 160,000 had UC capped
- 19,000 had HB capped
180,000 households had their benefits capped at August 2021, a decrease of 2% (4,200 households) on the previous quarter (at May 2021).
The number of households capped under HB has continued to decrease (by 2,700 households or 12%) from May 2021.
The number of households capped under UC continued to decrease (by 1,500 households or 1%) from May 2021. The volumes of households capped under UC are still high compared with pre-pandemic levels, however it appears the volume is starting to decrease.
The total number of capped households is decreasing
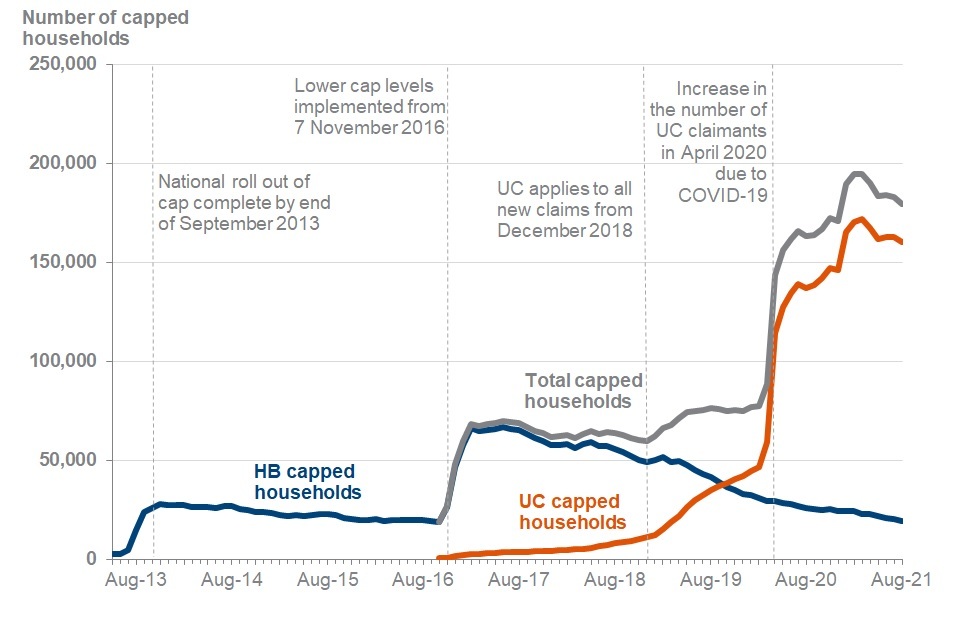
UC came into the scope of the benefit cap in October 2016 and capped households claiming UC steadily increased from 350 households (October 2016) to 11,000 households when UC was fully rolled out in December 2018. Up until this point, the overall capped caseload was driven by HB capped households which reached 67,000 households in June 2017, following the change to current cap levels. The caseload remained stable until August 2017 (65,000 households) when it started to slowly decrease.
Following the completion of GB-wide roll out of UC in December 2018, the households capped on UC increased due to:
- the majority of new claimants no longer being able to apply for legacy benefits, only UC
- HB claimants moving onto UC
The number of UC capped caseload overtook the HB capped caseload in October 2019, with 36,000 HB households capped and 38,000 UC households capped. Since then, HB capped households have continued to steadily decrease to 19,000 households at August 2021.
More recently, the COVID-19 pandemic has seen an increase of households claiming UC and therefore an increase in the number of UC capped households. Between March 2020 and April 2020, the UC capped caseload increased by 93%, from 59,000 households to 110,000 households. From April 2020 until March 2021 the number of households capped on UC increased to 170,000. From March 2021 to August 2021, the number of households capped on UC decreased by 11,000.
See Stat-Xplore for full data.
Note: UC source data, DWP UC Quarterly Statistics, are subject to revision. The most recent quarter of data are therefore provisional and will be subject to revision in subsequent releases. It is expected that the overall provisional figures will be within 2% of their revised figure in future releases.
29,000 households were newly capped in the latest quarter.
The quarterly number of newly capped households has decreased
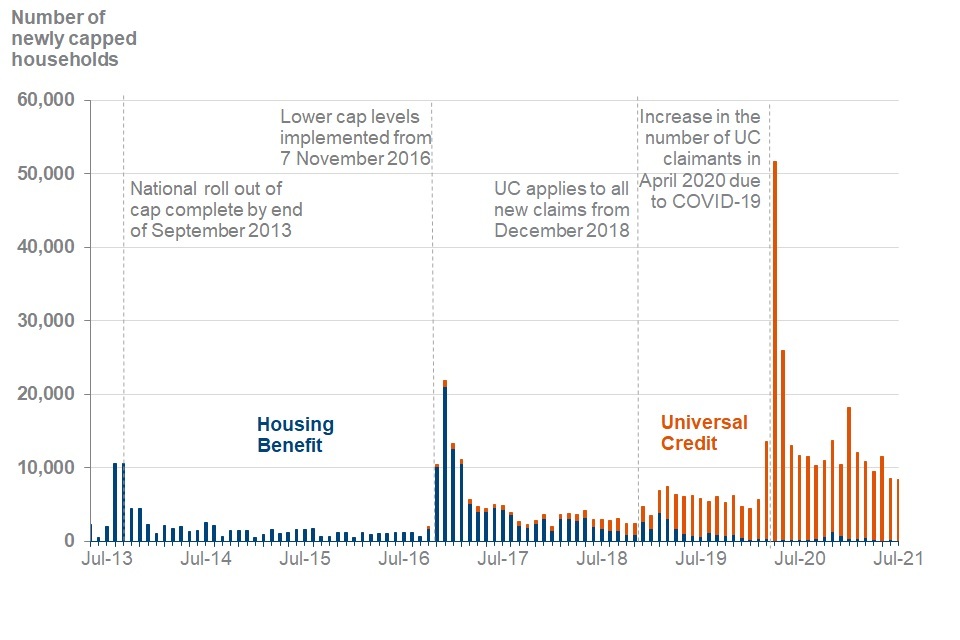
29,000 households had their benefits capped for the first time this quarter (May 2021 to July 2021). This is 3,900 (12%) fewer households than last quarter (February 2021 to April 2021), when 33,000 households had their benefits capped for the first time.
The number of newly capped households peaked in April 2020 (52,000 households), due to:
- an increase in the number of households claiming UC
- the impact of changes to the UC standard allowance and the Local Housing Allowance (LHA) rate, in light of the COVID-19 pandemic
Note: Newly capped households are those that have their benefits capped for the very first time. For UC, this excludes off-flows from the HB cap who then immediately become capped under UC. Due to the methodology used to obtain outcome at off-flow (including households that flow from the HB cap to the UC cap), it is not possible to obtain outcome data for August 2021, at August 2021.
560,000 households have been capped at some point between April 2013 and August 2021.
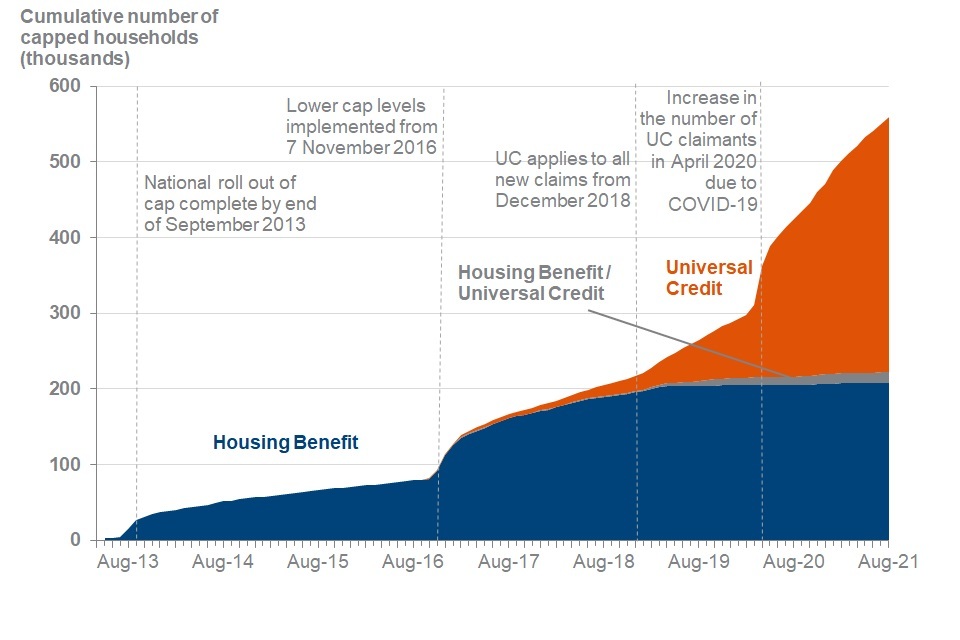
Between October 2016 and August 2021, 350,000 households have had their UC capped at some point. Between April 2013 and August 2021, 220,000 households have had their HB capped at some point.
Sharp rises in the number of households that have ever had their benefits capped can be observed over time when newly capped households joined the cap as a result of:
- the national roll out of the cap in September 2013
- the introduction of the current lower cap levels in November 2016
- the start of the COVID-19 pandemic in March 2020
The COVID-19 pandemic has seen the total number of households that have ever had their benefits capped rise by 80% from 310,000 at March 2020, to 560,000 at August 2021. The increase should be viewed in context with the increase in the UC caseload, since the start of the COVID-19 pandemic.
3. Characteristics of capped households
The proportion of households claiming benefits that have their benefit capped has stayed the same since last quarter (May 2021) at 2.7%.
2.7% of households claiming HB or UC had their benefits capped at August 2021, this is the same as at May 2021.
Note: From June 2021 (data to February 2021) it was possible to identify working age claimants for HB. Previously the proportion of benefit claiming households that were capped was calculated using all HB claimants. HB claimants that are of state pension age (and therefore not in scope for the benefit cap) are no longer included in this calculation so these statistics cannot be compared to prior releases. For more information, see the Background Information and Methodology document.
The proportion of UC households that are capped is greatest in the English Local Authorities, particularly in the South of England.
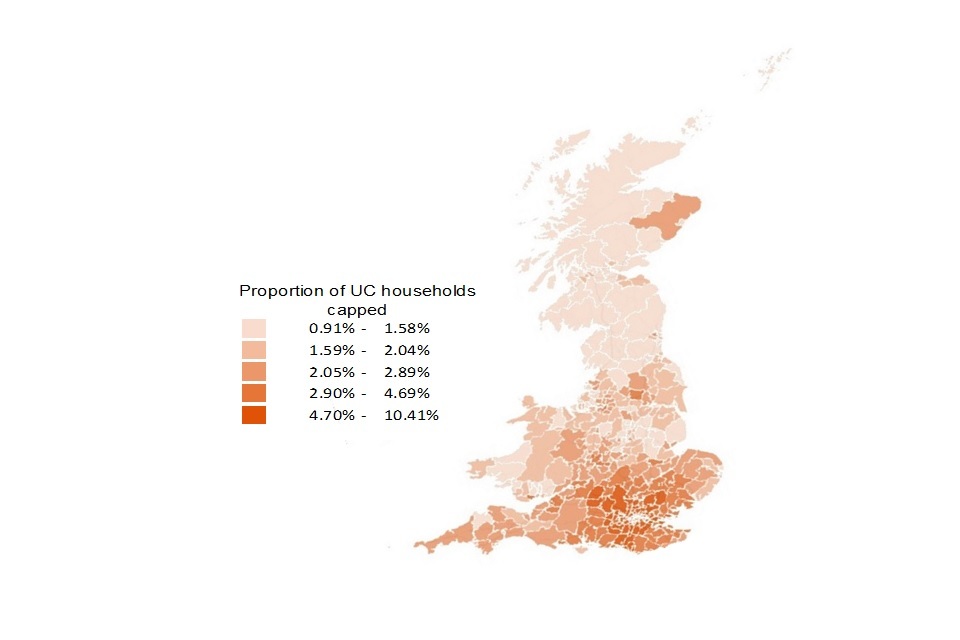
The proportion of households claiming UC, that had their benefits capped at August 2021 was 3.3%, a slight increase from 3.2% at the previous quarter (May 2021). The London region continues to have the highest proportion of UC households affected by the benefit cap, with 6.5% capped at August 2021, a small increase from 6.4% at May 2021.
Of the 10 Local Authorities (LAs) with the highest proportion of UC households having their benefits capped at August 2021, 8 of them are in the London region and 2 are in the South East region. Whilst the order is different, 8 of the 10 LAs are the same LAs that were in the top 10 LAs at May 2021.
At August 2021, Scotland remains the region with the lowest proportion of UC households capped, at 1.3%, which is the same proportion as at May 2021.
See the number of households that had their benefits capped and Households on UC through Stat-Xplore for full data on the proportion of UC capped households using residential geographies.
On average, the proportion of HB claiming households that are capped is greatest in English LAs
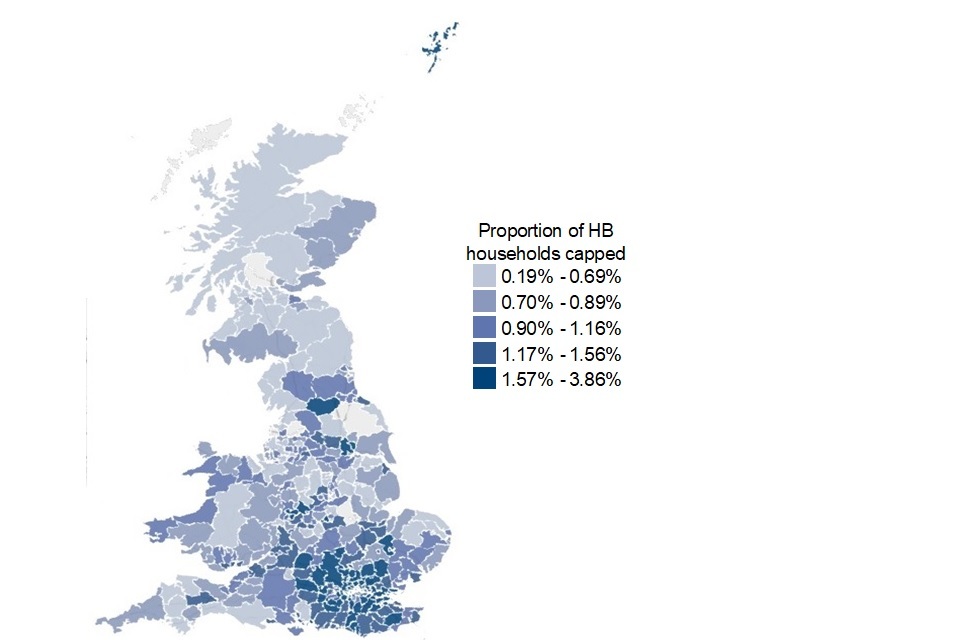
1.2% of households claiming HB had their benefits capped at August 2021, a slight decrease from 1.3% at May 2021. London and the South East had the highest proportion of HB households affected by the benefit cap at 1.6%. Both regions have experienced a slight decrease from 1.8% (London) and 1.7% (South East) at May 2021.
At August 2021, Scotland remains the region with the lowest proportion of HB households capped at 0.6%, a slight decrease from 0.7% at May 2021.
To see full data on the proportion of HB capped households for HB, you can use Stat-Xplore by using the number of households that had their benefits capped and HB data from April 2018, by selecting residential geographies and working age client type.
Note: LAs which are shaded grey in the above maps could be due to several factors such as data being sparse and /or missing.
6 in 10 (63%) households that have their benefits capped are single-parent families.
Since the start of the COVID-19 pandemic, there have been changes to the characteristics of household types. There is now a:
- lower proportion of capped households with children; from 93% at February 2020 to 83% at August 2021, which is the same as at May 2021
- higher proportion of capped households for single people with no children; from 7% at February 2020 to 17% at August 2021, which is the same as at May 2021
The proportion of capped households for single people with children has increased in each quarter since February 2021, whilst the proportion of capped households for couples with children has decreased
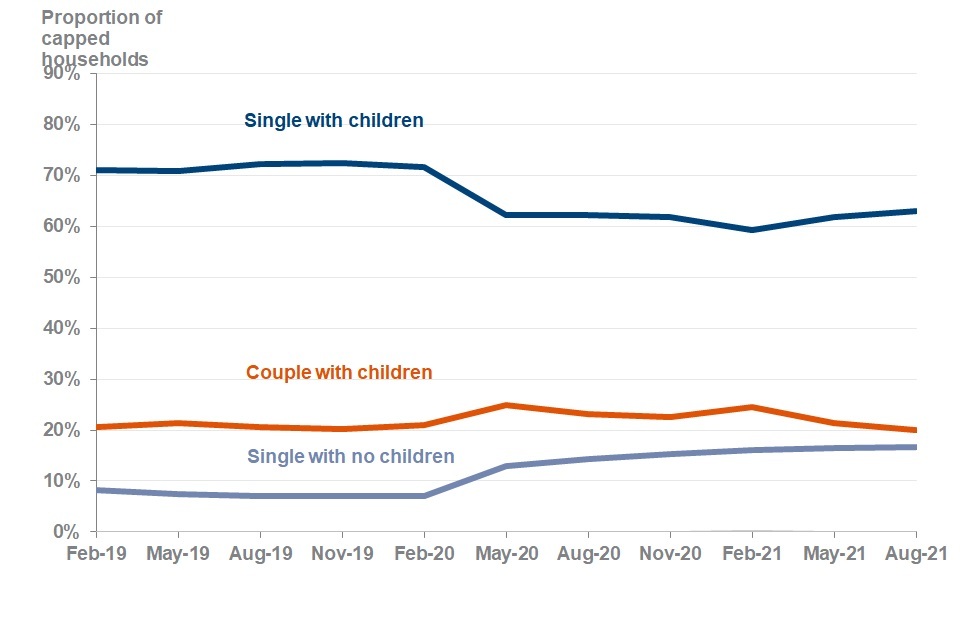
63% (110,000) of households that had their benefits capped at August 2021, were single-parent families, this is an increase from 62% at May 2021. Prior to May 2020, the proportion of single-parent families with their benefits capped was consistently between 71% and 72%.
Single-person households with no children remained a similar proportion of the capped caseload between February 2019 (8%) and February 2020 (7%). This proportion has steadily risen in the most recent quarters to 17% at August 2021.
Households of couples with children accounted for between 20% and 21% of the capped caseload between February 2019 and February 2020. The proportion increased to 25% at May 2020 and decreased to 23% until February 2021. It increased to 25% again at February 2021. It has since decreased to 20% at August 2021.
Households of couples with no children accounted for a marginal amount of the total capped caseload, being 0.1% at February 2019, decreasing to 0% until May 2020 where it increased to 0.1% again and has remained since.
Just over half of all single-parent capped households have a youngest child under the age of 5 at August 2021
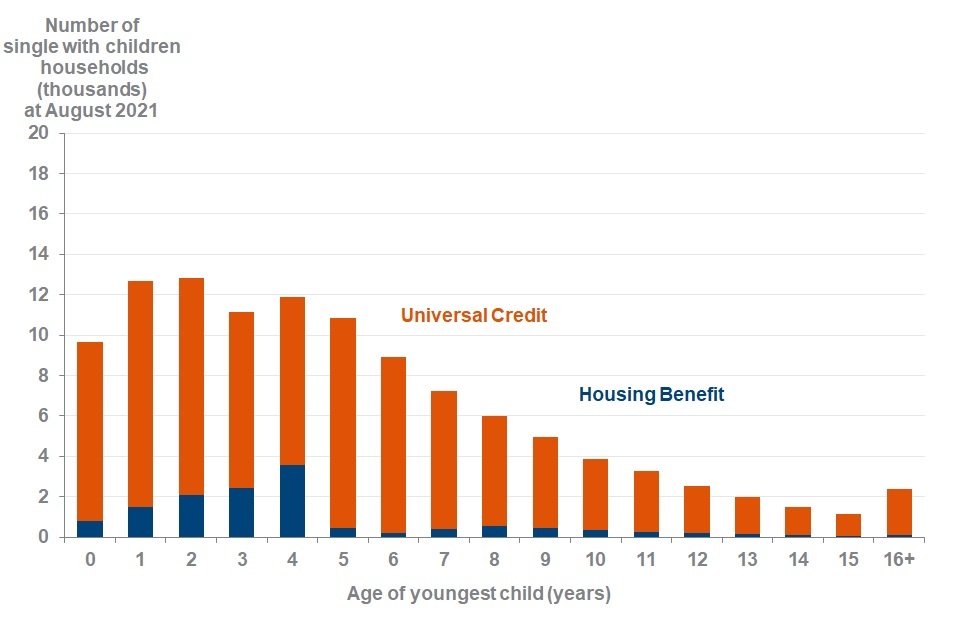
At August 2021, 52% (58,000) of single-parent capped households have at least one child aged under 5 years, including 20% (22,000) with a child aged under 2 years.
Income Support (IS) is a legacy benefit which could be claimed alongside HB. Read HB Capped households by benefit make-up for more information. When the youngest child reaches the age of 5, claimants are no longer eligible for IS on the grounds of being a lone parent and must claim UC. As the HB award will stop when the UC claim is made this may be the reason for a sudden decrease in the number of HB capped households with a youngest child aged 5 or over.
83% of households that are currently capped include children.
At August 2021, 150,000 households (83%) that had their benefits capped included children, 82% (130,000) of UC capped households included children and 91% (17,000) of HB capped households included children.
Of the households including children, capped at August 2021:
- 93% (140,000) had between 1 and 4 children
- 7% (9,900) had 5 or more children
UC capped households have fewer children per household than HB capped households
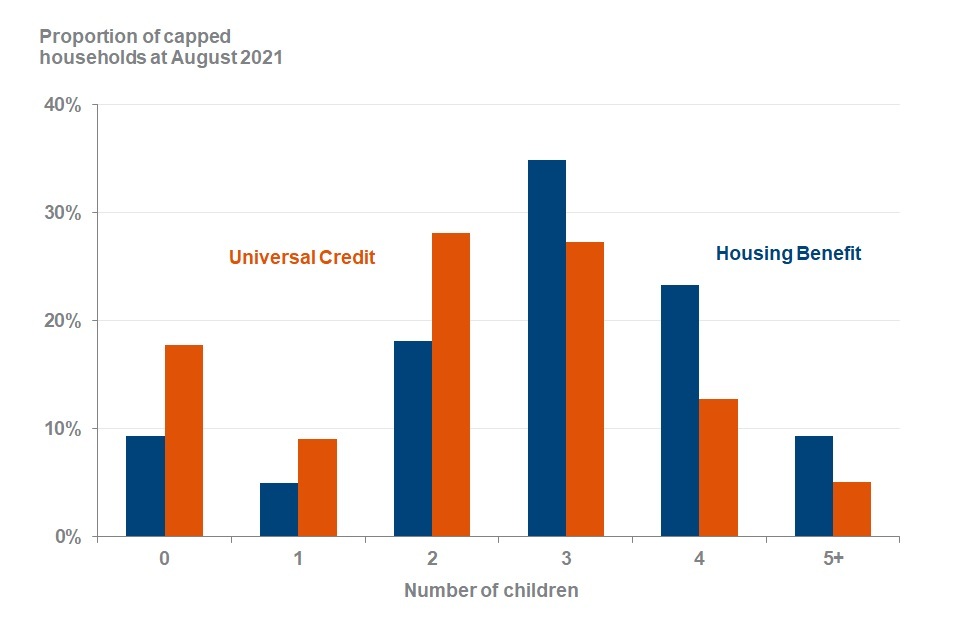
Since February 2020 (data at November 2019) a new methodology to determine the number of children was developed. Figures prior to this cannot be compared. Read further information in the Background Information and Methodology document.
Child Benefit (CHB) and Child Tax Credit (CTC) are legacy benefits which can be claimed alongside HB. Read HB Capped households by benefit make-up for more information. UC claimants can get CHB and, where applicable, receive the UC child element instead of CTC. CHB, CTC and UC are all in scope for the benefit cap, so households in receipt of these benefits or elements are more likely to exceed the cap limit and be capped if they are not exempt.
See Stat-Xplore for full data on the family make-up of capped households.
See data table 1 and data table 6 for full data on the age of youngest child by family type at August 2021.
See data table 3 for full data on the cumulative HB cap caseload by family type and age of youngest child.
HB Capped households by benefit make-up
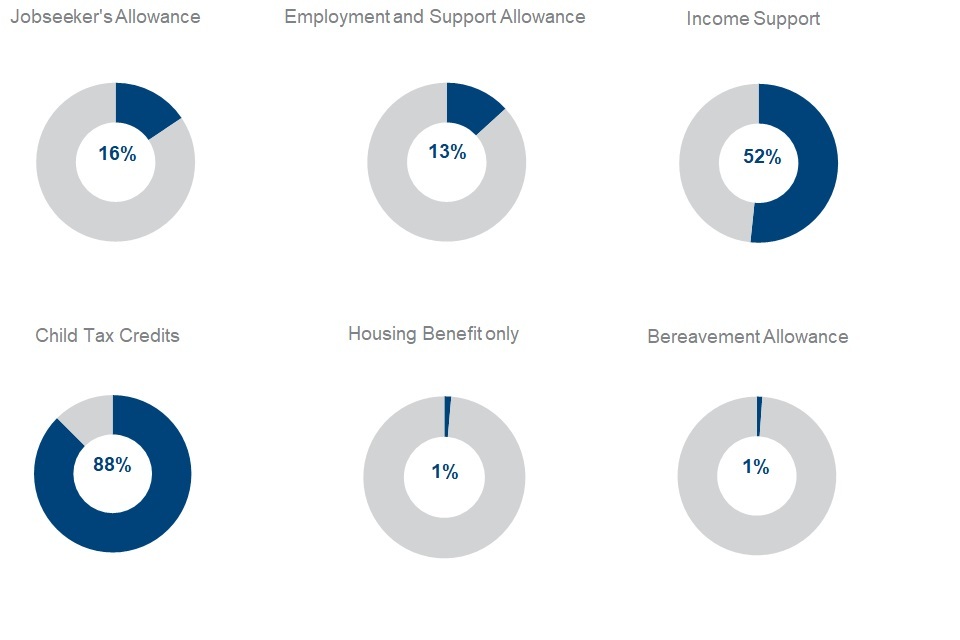
Of HB capped households at August 2021:
- 16% (3,000) were claiming Jobseeker’s Allowance (JSA)
- 13% (2,500) were claiming Employment and Support Allowance (ESA) (Assessment Stage and Work-Related Activity Group only)
- 52% (9,900) were claiming IS
- 88% (17,000) were claiming CTC
- 1% (260) were claiming HB only
- 1% (210) were claiming Bereavement Benefit
Proportions have been calculated based on unrounded data. See data table 2 for full data.
Note: Capped households can be in receipt of multiple benefits and therefore percentages for households in receipt of each benefit do not sum to 100%. More information on benefits that are in-scope for the benefit cap and those that are exempt can be found in the Background Information and Methodology document. Analysis is based on benefit claims by the lead claimant in a household and, where applicable, their partner. Equivalent information is not available for UC, at this time. DWP has plans to develop the methodology to provide the benefit make-up of UC capped households.
4. The financial impact of being capped
Households had their benefits capped by an average of £54 a week, at August 2021.
The weekly average (mean) amount capped at August 2021 (£54) (when combining HB and UC), was £1 lower than last quarter (£55).
The weekly average (mean) amount capped remains similar to last quarter (data to May 2021)
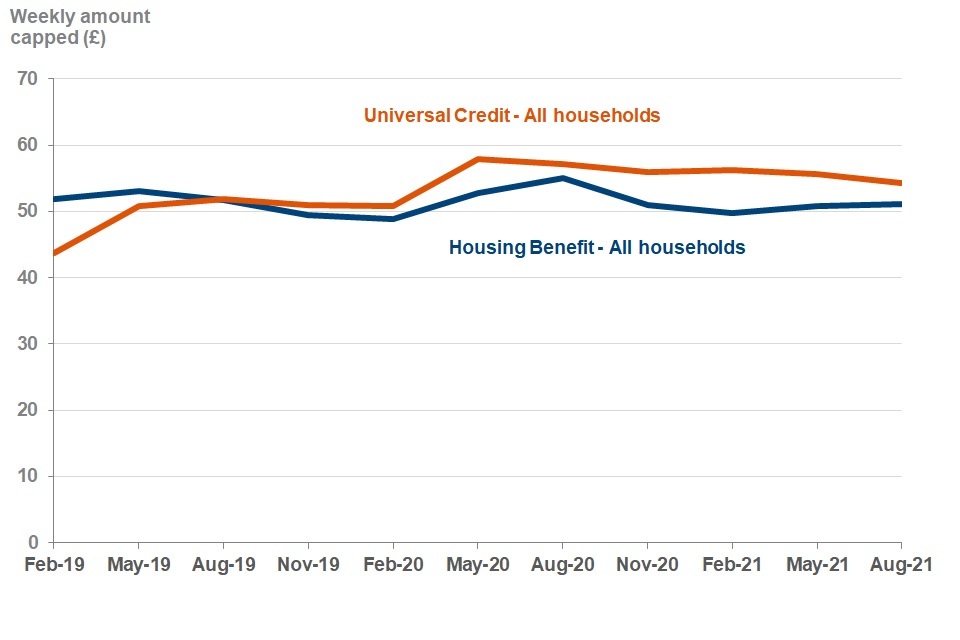
The average monthly amount that UC households are capped by is £235, at August 2021. This is the equivalent of £54 per week, a reduction of £1 from May 2021.
The average weekly amount that HB households are capped by is £51, at August 2021, the same as at May 2021.
Since the start of the COVID-19 pandemic, the weekly average cap amount for:
- UC has increased from £51 at February 2020 to £54 at August 2021
- HB has fluctuated, from £49 at February 2020, increasing up to £55 at August 2020 and is £51 at August 2021
Note: UC is assessed and paid monthly and the benefit cap is applied to the full UC award. For these statistics, a weekly cap equivalent has been calculated for UC households by dividing the amount a household has been capped by in an assessment period (which lasts one month) by 4.33.
See the Background Information and Methodology document for further details.
The difference in average cap amounts across the two benefits may be affected by the differences in their caseload compositions and the different entitlement conditions across the benefits. The UC cap caseload contains a larger proportion of single people and smaller families, affecting the average amount by which households are capped.
The benefit cap is applied to the full UC award not just to housing costs. Therefore, direct comparisons of cap amounts across HB and UC should not be made.
See Stat-Xplore for full data, including by region and LA.
60% of households had their UC capped by £50 or less per week.
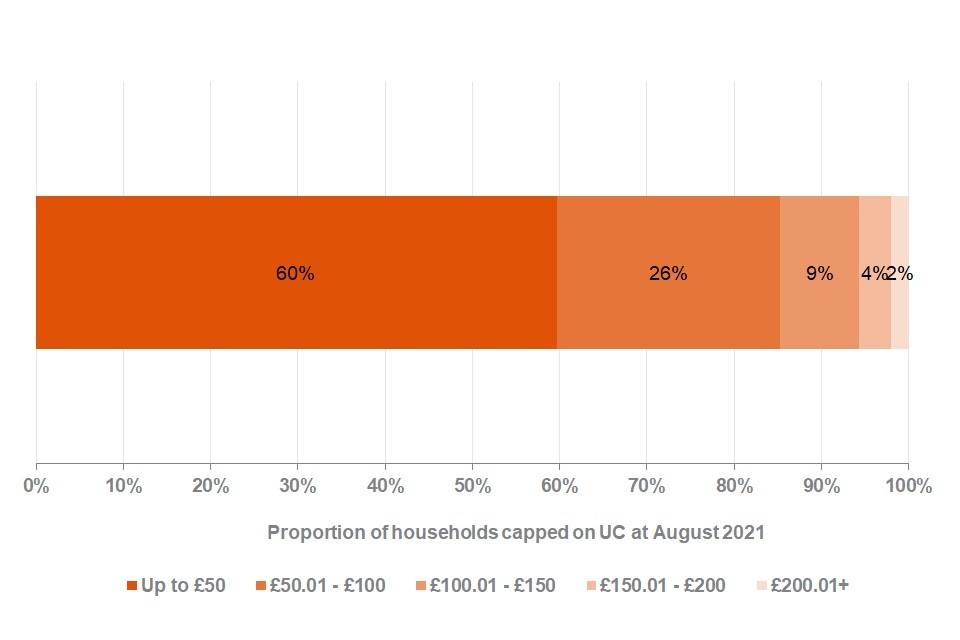
At August 2021:
- 60% (96,000) of households that had their UC capped were capped by the equivalent of £50 or less per week
- a further 26% (41,000) were capped by the equivalent of £50.01 to £100 per week
- 2.1% (3,300) were capped by the equivalent of more than £200 a week including 0.3% (530) capped by the equivalent of more than £300 per week
See Stat-Xplore for full data.
62% of households had their HB capped by £50 or less per week.
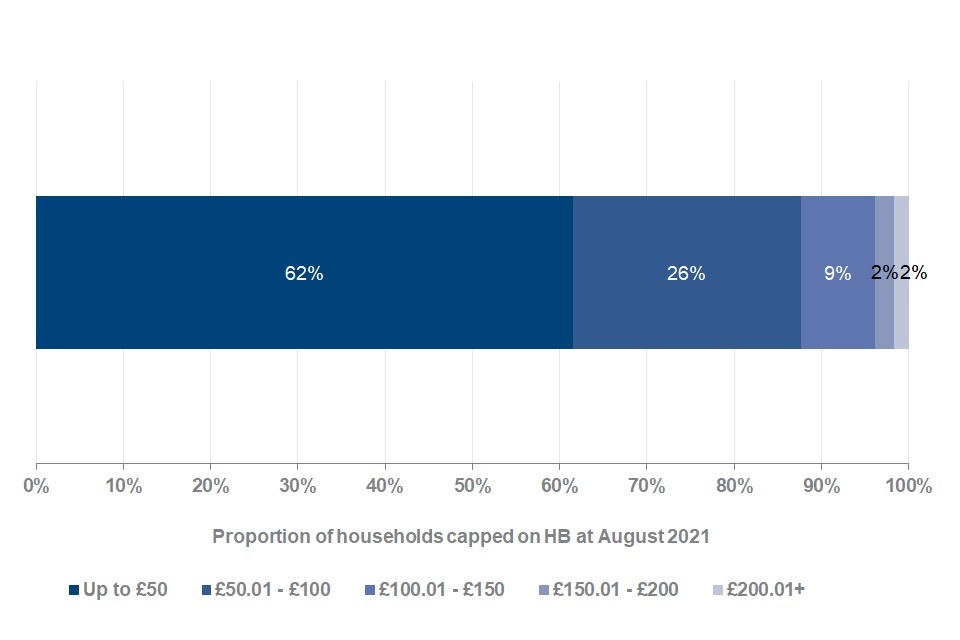
At August 2021:
- 62% (12,000) of households that had their HB capped were capped by £50 or less per week
- a further 26% (5,000) were capped by £50.01 to £100 per week
- 1.6% (310) were capped by £200.01 or more a week including 0.4% (80) capped by £300.01 or more per week
From 7 November 2016, cap levels were lowered, and different cap levels for households inside and outside Greater London were introduced, replacing the single cap level that existed previously.
See Stat-Xplore for full data.
5. Moving off the cap
380,000 (68%) households that once had their benefits capped, were no longer capped at August 2021.
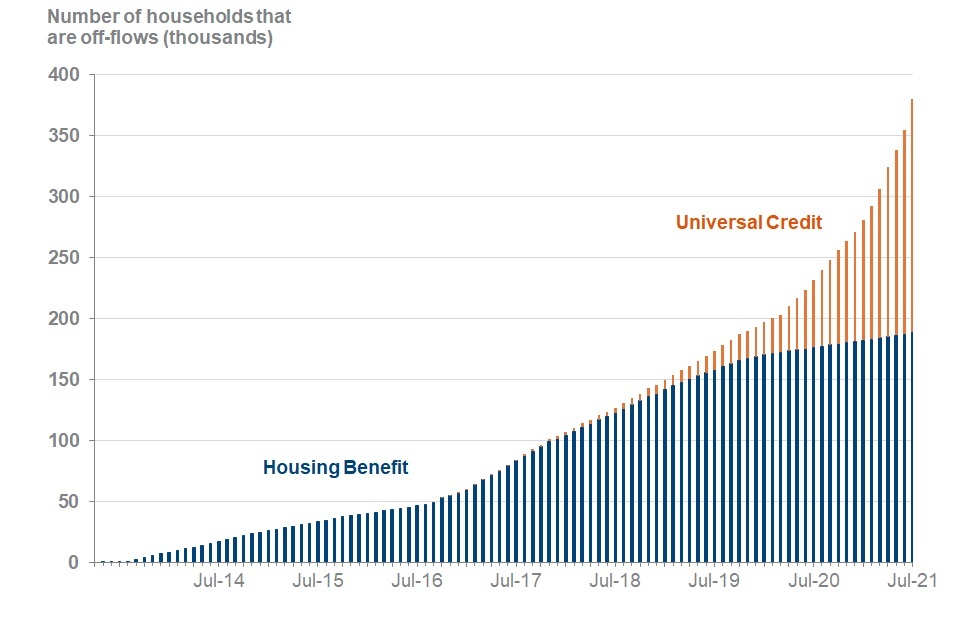
Between 15 April 2013 and July 2021 there have been 380,000 households that have flowed off the benefit cap, meaning their benefits are no longer capped. At August 2021:
- 190,000 (54%) households that once had their UC capped were no longer capped
- 200,000 (91%) households that once had their HB capped were no longer capped
Of households that once had their HB capped, 14,000 (7%) went on to have their UC capped, they are not included in the overall total as they are not truly off-flows from the benefit cap.
Of the 52,000 UC claiming households that were off-flows since last quarter, 17% (9,100 households) were also on-flows during this quarter, this means that these households had their UC capped for the first time and left the cap during this quarter.
See Stat-Xplore for full data.
Note: Off-flow statistics for capped households are not directly comparable with releases prior to August 2019, due to developments in the production of the statistics. Benefit cap off-flow outcome statistics for UC and HB are not directly comparable as the UC and HB policies are different. Further UC off-flow statistics are still in development.
18% of all households that previously had their UC capped, moved off the cap because of earnings.
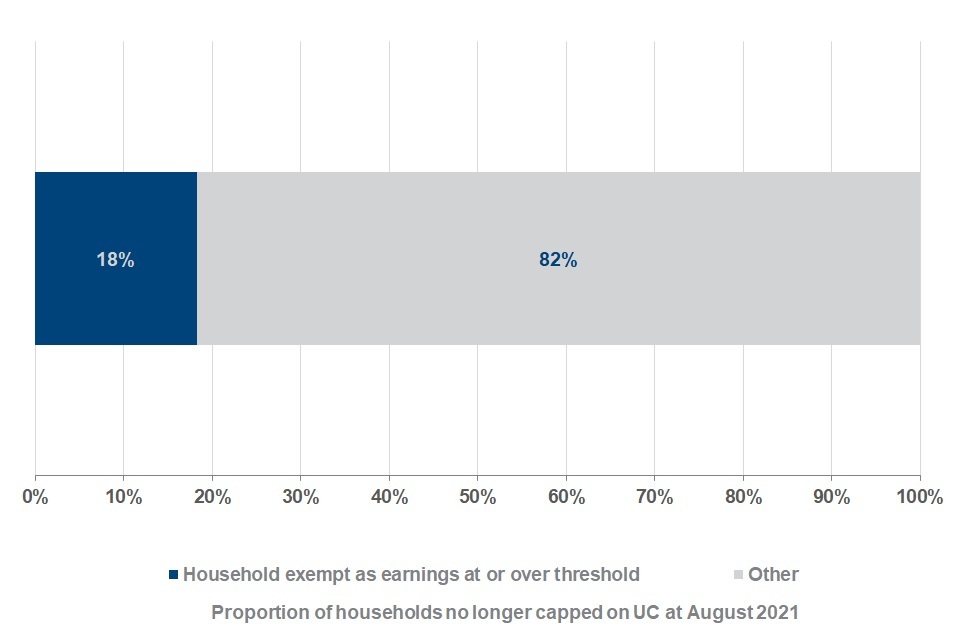
Of the 190,000 households that no longer had their UC capped at August 2021, 18% (35,000) became exempt as they were earning at least the level of the threshold at which households become exempt from the benefit cap.
In the most recent quarter, at August 2021 (off-flows from May 2021 to July 2021), 17% of households (8,900) that flowed off the cap, left the cap due to having earnings at, or over, the earnings threshold of £617 per assessment period from April 2021. This has decreased from 19% (7,700 households) at May 2021 (off-flows from February 2021 to April 2021).
The earnings exemption threshold is subject to change each financial year. The earnings exemption threshold is £617 for the FYE 2022. Details of previous exemption threshold levels can be found in Background Information and Methodology document.
See Stat-Xplore for full data broken down by Region.
Note: Outcome statistics for households no longer capped under UC are still under development and are not comparable with statistics for outcomes of those who are no longer capped under HB. Outcomes figures related to moving into work have been presented separately for UC and HB. This is because under UC, a household is exempt from the cap when earnings in each assessment period are at least the level of the earnings exemption threshold (for FYE 2022 this is £617). Under HB, a household becomes exempt from the cap if it is entitled to WTC, which depends on hours of paid work (at least 30 hours for those aged 25 to 59, at least 16 hours for single people with 1 or more children, and at least 24 hours between a couple with 1 or more children).
Off-flow outcomes are shown as at the end of the quarter in which a household moved off the benefit cap, meaning the outcomes are fixed at that point, unless a household is capped again at a later date. More detail on the way off-flow outcomes are determined is included in the Background Information and Methodology document.
30% of households that previously had their HB capped, moved off the HB cap with an open WTC claim.
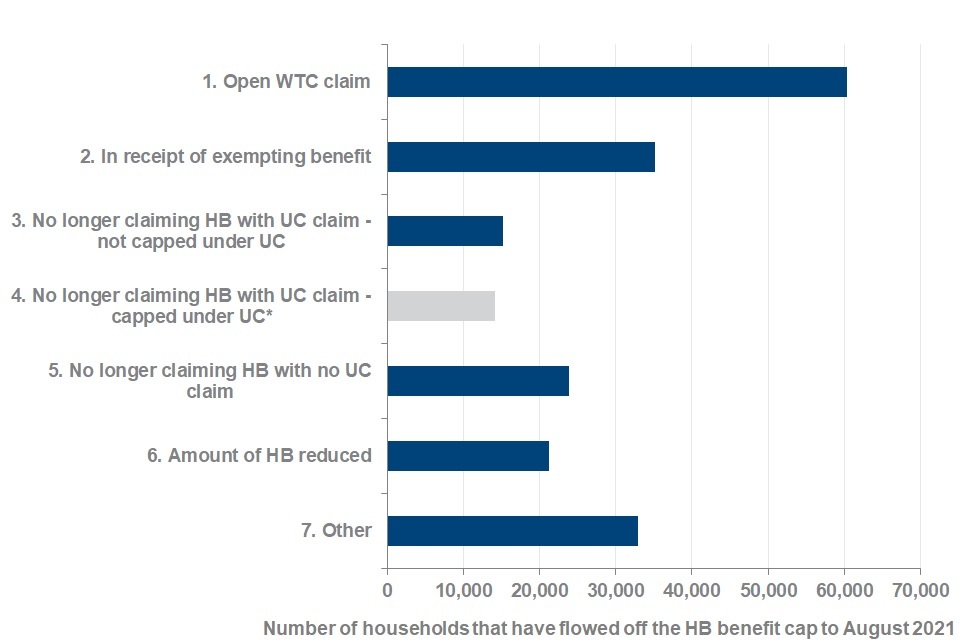
For illustration purposes and consistency with previous releases, households which have flowed from HB on to the UC cap have been included. These households are not considered in the overall off-flow figures from the benefit cap.
Of the households that have previously had their HB benefit capped, 91% (200,000) were no longer capped at August 2021. This is an increase of 4,000 households on the previous quarter (May 2021).
Of the 200,000 households that no longer had their HB capped at August 2021, 60,000 were exempt with an open WTC claim at the time they moved off the cap, indicating that they moved into work. This is 30% of those no longer capped under HB. The proportion of households that left the HB cap with an open WTC claim in the quarter to August 2021 was 10% (390 households), this is an increase of 100 households, compared with 7% (280 households) to May 2021.
Of the households that no longer had their HB capped at August 2021, 29,000 (14%) were no longer claiming HB when they moved off the cap but had started to claim UC. Of these, 15,000 (52%) were no longer capped after moving to UC.
See Stat-Xplore for full data.
Note: Households can flow off the cap for many different reasons and there may be several reasons why a household is no longer capped. These reasons are ranked (as in the chart above) and only the highest ranking reason per household is counted.
See the Background Information and Methodology document for more information on how the ranking was developed and is applied, as well as detail the way off-flow outcomes are determined.
Since December 2018, WTC has been replaced by UC with only a small number of the population able to apply for WTC, see the eligibility criteria.
31% of single-parent households that flowed off the HB cap, left with an open WTC claim.
For single-parent households with a child aged under 2 years, 92% (27,000) were no longer capped at August 2021. Of these, 34% (9,200) were exempt with an open WTC claim when they moved off the cap, indicating that they moved into work.
For single-parent households with a child aged under 5 years, 88% (79,000) were no longer capped at August 2021. Of these, 32% (25,000) were exempt with an open WTC claim when they moved off the cap, indicating that they moved into work.
See data table 3 for a full data by age of youngest child.
Note: UC has replaced tax credits since December 2018, meaning there are no new claims. However, if a claimant is getting CTC and they start work they can claim WTC because it is treated as a change of circumstances, which doesn’t require them to move across to UC.
Off-flow outcomes are shown as at the end of the quarter in which a household moved off the benefit cap, meaning the outcomes are fixed at that point, unless a household is re-capped at a later date. More detail on the way off-flow outcomes are determined is included in the Background Information and Methodology document.
Statistics on children in UC households are not currently available. More information can be found in the Background Information and Methodology document.
6. COVID-19
This summary contains statistics on the number of households claiming UC and HB, which are capped under the benefit cap up to August 2021.
Between March 2020 and April 2020, at the onset of the COVID-19 pandemic, the number of households capped on UC increased by 93%, and overall continued to increase until March 2021. The impact of this increased demand continues to be reflected in these statistics.
There were no changes to the benefit cap policy in light of the COVID-19 pandemic. However, as a response to the COVID-19 pandemic, DWP introduced temporary emergency measures, which increased the amount of benefit payable and consequently impacted, the number of households capped. For example:
- the standard allowance of UC was temporarily increased by £20 per week from 6 April 2020 until 1 September 2021
- the minimum income floor (MIF) was temporarily relaxed in March 2020 until the end of July 2021. The MIF is the minimum amount of income a self-employed person is assessed to have if their reported self-employed income is lower than this
Read a detailed timeline of key events in the life of UC
The Local Housing Allowance (LHA) rates were permanently increased in April 2020 for both UC and HB claimants, in response to the COVID-19 pandemic:
- LHA rates determine the financial support renters in the private sector are entitled to (up to a maximum of 4 bedrooms). They were increased to the 30th percentile of rents within a local area for each property size
7. Definitions
Point-in-time caseload
The number of capped households at each month.
Point-in-time datasets contain one record per household, per month capped. From these datasets it is possible to identify the capped caseload at each month. UC source data, DWP UC Quarterly Statistics, are subject to revision. The most recent quarter of data are therefore provisional and will be subject to revision in subsequent releases. It is expected that the overall provisional figures will be within 2% of their revised figure in future releases.
Cumulative caseload
The number of households that have ever been capped from the introduction of the benefit cap (or October 2016 for UC) to the latest month.
Cumulative datasets contain one record per household that has ever been capped on either HB or UC. Characteristics (family type, LA, region etc.) are based on when the household was first capped and may have subsequently changed.
Off-flows
The number of previously capped households that are no longer capped on either benefit (HB or UC).
These are true off-flows i.e. no longer capped on either benefit. However, it is possible to talk about households that are off-flows from the HB cap or off-flows from the UC cap. Where this is the case it will clearly state HB off-flows or UC off-flows, if it is not stated then it is assumed to be a true off-flow.
On-flows
The number of households that are capped on their respective benefit (HB or UC) for the first time.
It is possible to be capped on HB and when no longer capped on HB to immediately on-flow to UC and remain capped i.e. the household is capped on UC for the first time.
Newly capped
The number of households that have their benefits capped for the very first time.
Unlike on-flows, newly capped is the first time a household is capped irrespective of the benefit (HB or UC). This means that households that on-flow to the UC cap having immediately off-flowed from the HB cap are not newly capped because they have been capped previously.
Due to limitations of the current methodology, it is not possible to identify a household that off-flows the HB cap and later (however, not immediately) on-flows to the UC cap. They would currently be counted as newly capped because they did not immediately flow from the HB cap to the UC cap.
Household
One or two adults, living together as a couple, plus any children they are living with.
This definition applies to the benefit cap policy and hence this analysis. A household may also be referred to as a ‘benefit unit’. This definition differs from the Office for National Statistics (ONS) definition that defines a household as one person alone; or a group of people (not necessarily related) living at the same address who share cooking facilities and share a living room or sitting room or dining area. A household by the ONS definition may contain multiple benefit units.
There are a small number of cases where an individual or household has more than one HB claim, for these cases, only the most recent claim is reported on.
Reporting month
For HB data, LAs extract and return their data to DWP over a four week rolling period based on an extraction schedule for each LA. For example, “February 2020” data was typically extracted between 28 January and 21 February 2020. Each LA may extract their data up to a week before the date it is scheduled to be returned to DWP. Consequently, the statistics do not directly relate to a particular date but rather show the position of capped cases over a monthly cycle.
For UC data, a household must have an assessment period spanning the ‘count date’ for a particular month. An assessment period is the period of a month for which a UC payment is made. The count date is the second Thursday of the month. Entitlement to UC must also have been calculated.
Administrative geographies
In this release, HB data are presented using two sets of geographies:
- administrative
- residential
Administrative geographies represent the administrative body responsible for administering the HB, and is therefore only meaningful at LA level. There are cases where the administrative LA is responsible for administering HB outside the geographical boundaries of the LA, and the responsibility for particular dwellings can also change with time.
Residential geographies
In this release, HB data are presented using two sets of geographies:
- administrative
- residential
Residential geographies represent the geographic boundaries of the LA area and is determined by the location of the dwelling that the HB relates to. Residential geographies can be presented using a wide range of geographies based on the postcode level of the dwelling itself, usually ranging from the output areas (OAs), which comprise a few postcodes only, up to country level. Residential geographies may change if there is a change in the geographical boundaries, and affect all the dwellings affected by the boundary change.
8. About these statistics
Housing Benefit disruption
An interruption in the supply of data from Hackney Borough Council has affected HB statistics from December 2020. Data problems are unlikely to be fixed until late into 2021 and until then HB statistics that cover Hackney will be derived from earlier data. This means estimates for London and Hackney will deteriorate in their quality and accuracy. To find out what the DWP analysts are doing to maintain HB statistics, please refer to the background information note for the DWP benefits statistics. Please also note caveats and warnings in the accompanying ODS tables and Stat-Xplore where they appear.
More about the benefit cap
The benefit cap is applied to the combined income from benefits including:
-
UC
-
Income-based JSA
-
IS
-
Income-related ESA (except when the Support Component is in payment)
-
HB
-
CHB and CTC
-
other benefits, such as Incapacity Benefit and Bereavement Benefit
Read more about when benefits are affected by the cap and when benefits are not affected by the cap.
Release schedule
The statistics are published quarterly in March, June, September and December and are sourced from data originally collected via administrative systems. Since November 2020 (data to August 2020), data for households capped under HB are taken from DWP HB Caseload Statistics, and data for households capped under UC are taken from DWP UC Quarterly Statistics.
Next release: 22 March 2022
Status of these statistics
National, Official and Experimental Statistics are produced in accordance with the Statistics and Registration Service Act 2007 and the Code of Practice for Statistics (the Code).
This release contains Official and Experimental Statistics on the number of households that have had their benefits capped since the cap was introduced (in April 2013) to August 2021. This is due to the ongoing development of the data systems that are used to support UC. The statistics are compiled following the standards of trustworthiness, quality, and public value set out within the Code.
Rounding
Volumes and amounts have been rounded as shown in the table. Percentages are calculated using numbers prior to rounding and rounded to the nearest whole percentage point.
| Range | Rounded to the nearest |
|---|---|
| 0 to 1,000 | 10 |
| 1,001 to 10,000 | 100 |
| 10,001 to 100,000 | 1,000 |
| 100,001 to 1,000,000 | 10,000 |
| 1,000,001 to 10,000,000 | 100,000 |
| 10,000,001 to 100,000,000 | 1,000,000 |
Data sources
Data used to create the statistics comes from administrative databases. For these, accuracy is determined by how well the information is recorded and transmitted.
HB Data
HB capped household data are sourced from the DWP HB Caseload Statistics. Read more about HB Caseload Statistics (including their methodology).
The HB Caseload Statistics data source is the DWP 100% Single Housing Benefit Extract (SHBE). SHBE is a monthly electronic scan of claimant level data direct from LA computer systems. SHBE includes a field that contains the weekly amount that the HB of a household has been capped by. This marker is central to the production of the statistics on households that have had their HB capped.
HB Caseload Statistics are merged with 100% DWP benefit scans, to give data on the types of benefits claimed by capped households, and with Her Majesty’s Revenue and Customs (HMRC) CHB data, to give information on the number of children and the age of the youngest child dependant in a capped household. HB caseload statistics are merged with Working Tax Credit data and 100% DWP benefit scans to provide information on the outcomes of households that have off-flowed from the benefit cap.
Data on those households that have ever had their HB capped that are no longer capped is linked to HMRC and DWP benefits data to determine why households are no longer capped.
UC Data
UC capped household data are sourced from the UC Quarterly Statistics. Read more about UC Quarterly Statistics (including their methodology).
The UC Quarterly Statistics data source is the DWP UC Official Statistics database, which is compiled using data from systems within local offices and records of UC benefit payments made by the DWP. This database includes a field that contains the amount of UC that a household has been capped by for an assessment period, which is used in the production of these statistics.
Data are merged with the DWP Customer Information System address file so that the number of households that have had their UC capped can be broken down by region and LA.
Data on households that have had their UC capped are matched with the full DWP UC Official Statistics database to obtain information on earnings, which is used to determine which households moved off the cap under UC due to becoming exempt due to their earnings.
From the September 2021 release (data to May 2021) of this publication, data that was previously provided to users in both Stat-Xplore and the accompanying ODS tables are now only available on Stat-Xplore.
UC data are returned on a particular count date each month. Statistics on households capped under UC do not include figures for those capped at the start of the UC roll out. The initial, largely clerical payment system, UC Live Service (UCLS), was gradually replaced by the current digital system, UC Full Service (UCFS). Since March 2019 UCLS ceased to be operational and all UC awards have been delivered via the current service. Due to data quality and reporting it is not possible to produce robust experimental statistics on the number of households that were capped under UCLS.
Note UC statistics throughout this release refer to UCFS only. This is especially important to remember when looking at time series data.
Figures relating to households with their UC capped are subject to retrospection. All figures in these statistics have been updated as at August 2021. For more information, see the Background Information and Methodology document. The timeseries detailing weekly cap amount does not include retrospection.
User engagement and consultation
As set out in the UC statistics release strategy, the statistics in this publication include:
-
the number of households that are currently capped or have ever been capped, as well as those newly capped
-
the proportion of HB and UC claimants that have their benefit capped at the Local Authority (LA) level
-
the benefit make-up of HB capped households
-
average amount of benefits that households are capped by (in £)
-
the number of households that are no longer capped (off-flows), as well as a range of outcomes at off-flow for HB capped households – including those that move from HB to UC and remain capped, and the proportion of off-flows from the UC cap that are due to earnings.
There are also plans to further develop the set of UC statistics, in particular outcomes at off-flow.
Following user engagement, information on the households capped due to the current lower, tiered cap levels are no longer included in these statistics. If users have any queries or feedback, contact the statistics team.
For the first time in the previous release (data to May 2021), data that was previously provided to users in both Stat-Xplore and the accompanying ODS tables were only available on Stat-Xplore.
The DWP have provided new measures in the UC Quarterly Statistics, which is the source data for UC capped households. The new measures are, the:
-
number of children in UC households
-
age of the youngest child in UC households
Statistics on both of these measures are presented in this release and were previously obtained by merging with HMRC CHB scans. Now, the source data for UC capped households will provide these measures, for UC only. This means that the methodology of merging two administrative data sources, can be replaced by a single data source – giving improved coherence throughout the Benefit Cap Statistics. The methodology of obtaining these measures for HB remain unchanged.
Where to find out more
Use Stat-Xplore to create your own tables and further breakdowns of these statistics.
View national and regional figures in an interactive visualisation.
Read older releases of these statistics.
Read Background Information about these statistics.
Read statistics for households who have their benefits capped in Northern Ireland.
Read statistics on HB caseload.
Read statistics on UC.
Read statistics on Local Authorities’ use of Discretionary Housing Payment funds.
Read more information on the benefit cap.
9. User Engagement
Contact us for statistical enquiries and publication feedback only please.
Lead Statistician: Judith Correia
Produced by: Dominique Radcliffe
DWP Press Office: 0115 965 8781
ISBN: 978-1-78659-370-2