Water and sewerage companies in England: environmental performance report for 2025
Published 29 October 2026
Applies to England

© Crown copyright 2026
This publication is licensed under the terms of the Open Government Licence v3.0 except where otherwise stated. To view this licence, visit nationalarchives.gov.uk/doc/open-government-licence/version/3 or write to the Information Policy Team, The National Archives, Kew, London TW9 4DU, or email: psi@nationalarchives.gov.uk.
Where we have identified any third party copyright information you will need to obtain permission from the copyright holders concerned.
This publication is available at https://www.gov.uk/government/publications/water-and-sewerage-companies-in-england-environmental-performance-report-2025/water-and-sewerage-companies-in-england-environmental-performance-report-for-2025
1. Chair’s foreword
Our role is to protect rivers, lakes, coasts and groundwater for the people and wildlife that depend on them. This report shows where water and sewerage companies have delivered environmental improvements, where performance has fallen short, and why the next 5 years must turn investment into visible results.
This report marks the end of the 2020 to 2025 Asset Management Plan (AMP) period for water companies. During that period, we have overseen £5 billion of investment in environmental improvements. More than 11,000 actions have been completed, bringing benefits for rivers, coasts and habitats: 4,475 km of habitat enhanced, 867 km protected, a 36% reduction in phosphate, and contributing to 13 bathing water sites being improved or maintained.
But the 2025 EPA results expose the scale of underperformance across the sector. Water and sewerage companies continue to fall well short of the standards rightly demanded by both us and the public. The sector achieved 16 stars overall, compared with 19 in 2024. Most companies are rated 1 or 2 stars, and only Severn Trent Water achieved a 4 star rating.
Serious pollution incidents remain a major concern. In 2025, they remained at similarly high levels observed in the previous year, continuing the overall decline in performance seen across this 5 year AMP period. Although total pollution incidents were lower than in 2024, the longer-term trend is still moving in the wrong direction. Discharge permit compliance also fell in 2025, and whilst investment has been made, not all companies have delivered the environmental improvement schemes they have been funded for.
These results point to underlying issues of long-term underinvestment. Critically, companies now have the investment – a record £91.95 billion for water and sewerage companies in England to spend between 2025 and 2030, of which over £50 billion is for wastewater. This includes increased levels of funding for companies to maintain their assets as part of their base expenditure. What matters now is that investment delivers cleaner waters, healthier habitats and stronger public confidence. It must slow the rate of decline and move us towards a future tipping point where the pace of asset improvements delivers sustained environmental improvement.
We must acknowledge that it will take time and several AMP cycles to address all the issues, but I am optimistic. Continued improvement in self-reporting points to greater real-time understanding of network performance. I am also seeing a far greater acknowledgement of the scale of problems. This is a welcome shift, alongside a sharper focus on the unprecedented scale of delivery needed to increase asset health and resilience.
Together with this increased investment, it is our role as regulators to enforce the rules. I am proud of the increased rigour, scrutiny and transparency we are bringing through our regulation. Real, measurable change is happening with our modernised and tougher regulatory culture. We are attending more pollution incidents to confirm water company reporting and since our last report we have introduced statutory pollution incident reduction plans. In the last financial year we carried out over 10,000 on-site inspections and an additional 3,000 compliance assessments, finding over 3,000 sites to be non-compliant. In 2025 we also secured a record of nearly £7 million in enforcement undertakings from water companies.
Recent prosecution fines show there is nowhere to hide for those companies that fail to abide by the law. New powers under the Water (Special Measures) Act 2025 will continue to enhance our ability to regulate and enforce standards across the sector.
Alongside this work, water reform creates an opportunity for a clearer, more joined-up system of oversight that supports long-term improvement and holds companies firmly to account. The conditions are now in place for progress, but that progress must be visible in the health of our water environment and the standard of service the public receives.
Finally, I am pleased to see the new water industry performance insights report published today, which shows how we are already working collaboratively with the other water regulators. By sharing intelligence and data, we are building a stronger shared view of performance that reinforces our common goal to improve the water industry and turn this opportunity into results.
Alan Lovell, Chair of the Environment Agency
2. Introduction
This annual report is about the 9 water and sewerage companies that provide clean drinking water (water supply) and wastewater (sewerage) services. These are:
- Anglian Water
- Northumbrian Water (for 2025 not including Essex & Suffolk Water)
- Severn Trent Water
- Southern Water
- South West Water (including Bournemouth Water since 2021)
- Thames Water
- United Utilities
- Wessex Water
- Yorkshire Water
It includes our Environmental Performance Assessment (EPA) for several core requirements as well as broader assessments of other aspects of environmental performance in 2025. It is accompanied by company specific EPA data reports.
Water supply only companies (known as water only companies) and companies providing local water supply and sewerage services are not covered in this report. See our separate report on the environmental performance of water only companies. See also our analysis of the water resources management plan annual review submissions from water companies across England for April 2025 to March 2026. This includes average household consumption, leakage and metering.
3. Performance facts for 2025
For 2025, the main performance facts for the water and sewerage company sector are:
- 4 water and sewerage companies are rated as poor performing (1 star) in our EPA, 4 are rated as requiring improvement (2 stars) and only 1 is rated 4 stars (our maximum rating)
- the EPA ratings have declined to 16 stars (out of a possible 36)
- water and sewerage companies failed to meet many of their EPA targets – only 46% of metric ratings (25 out of 54) achieved target (green)
- the number of serious pollution incidents (category 1 and 2) continued to be too high at 74, with the majority from 4 water and sewerage companies – for the EPA metric, 7 water and sewerage companies performed significantly below target (red)
- there were 2,666 pollution incidents from sewerage and water supply assets (category 1 to 3) – a slight improvement on the previous year but remaining too high
- there were 2,205 pollution incidents from sewerage assets (category 1 to 3) – the majority of water and sewerage companies (8 out of 9) performed significantly below target (red) for this EPA metric
- self-reporting of all pollution incidents by water and sewerage companies was 87%, and 93% for just pumping stations (PS) and sewage treatment works (STW) combined – this was the best since the EPA began, however one water and sewerage company performed below target (amber) and self-reporting of serious incidents by the majority was far too low
- 97.4% of STW and water treatment works (WTW) were compliant with numeric permit conditions for discharging treated wastewater – only 2 water and sewerage companies achieved the EPA metric target (green) and there has been a deterioration in sector compliance
- 99.99% of sewage sludge produced met the requirements of the satisfactory sludge use and disposal EPA metric – all water and sewerage companies achieved target (green)
- for the Water Industry National Environment Programme (WINEP) EPA metric, 80.2% of planned environmental improvement schemes were completed, the lowest percentage completion since the EPA WINEP metric was introduced in 2011 – 4 water and sewerage companies failed to meet all requirements within planned deadlines
4. Environmental Performance Assessment (EPA)
4.1 EPA for 2025
We introduced the EPA in 2011 as a tool for comparing performance between water and sewerage companies and across years for several specific environmental obligations that we regulate. See our EPA metric guide for more information on our regulation and how we set targets for water and sewerage companies. It includes our definition of red, amber and green status and thresholds for each metric, and our star ratings for performance across all metrics.
For 2025, the 6 EPA metrics are:
- total pollution incidents (sewerage assets only)
- serious pollution incidents (sewerage and water supply assets)
- self-reporting of pollution incidents (sewerage and water supply assets)
- discharge permit compliance (STW and WTW numeric water quality limits for treated wastewater only)
- satisfactory sludge use and disposal
- delivery of the WINEP
For the 2021 to 2024 data years, the EPA also included the Supply Demand Balance Index (SDBI) metric. We are developing a new water resources scheme delivery metric to replace the SDBI metric. The SDBI metric is therefore suspended for the 2025 data year (financial year ending 2026).
Every 5 years we review the EPA to align with the 5 year Asset Management Plan (AMP) investment cycles for water companies. For 2021 to 2025, we revised metric definitions and tightened metric thresholds to protect people and the environment. We consulted with the water companies and stakeholders and released a revised EPA methodology for this period. This describes our updated reporting approach and EPA for use for 2021 to 2025 data reporting. For 2025, the total pollution incident metric thresholds and serious pollution incidents metric thresholds have been tightened as part of the 5 year glidepath.
To view performance for all years, see the EPA results 2011 to 2025. For 2025, 4 water and sewerage companies are rated as poor performing, 1 star (Southern Water, South West Water, Thames Water and Yorkshire Water). Four water and sewerage companies are rated as requiring improvement, 2 stars (Anglian Water, Northumbrian Water, United Utilities and Wessex Water). One water and sewerage company achieved our industry leading rating of 4 stars (Severn Trent Water). Water and sewerage companies failed to meet many of their EPA targets. Across all 6 metrics and all 9 water and sewerage companies, only 46% of metric ratings (25 out of 54) achieved target (green). The remaining metric ratings (29 out of 54) were below target (red or amber).
Ofwat (the economic regulator of water companies) is using 3 of our EPA metrics as common performance commitments (CPCs) for 2025 to 2030. Total pollution incidents, serious pollution incidents and discharge permit compliance performance may have financial consequences for water and sewerage companies.
4.2 EPA for 2021 to 2025
The aim of the EPA is to provide a transparent assessment of water and sewerage company performance. It also highlights where they are doing well and where improvement in water and sewerage company performance is required. We are pushing for continuous improvement in standards from them and to make sure that statutory obligations and our performance expectations are met.
We are now able to review performance data for the whole of this 5 year EPA period, 2021 to 2025 (Table 1). In 2025, Severn Trent Water has again shown that sustained leading performance is possible in the EPA. They are the only water and sewerage company to consistently achieve 4 stars in this period. However, 8 of the 9 water and sewerage companies were rated poor or requiring improvement, 4 of them consistently in all of the last 5 years.
The total number of stars that the 9 water and sewerage companies achieved in 2025 is the lowest for this EPA period so far – only 16 stars out of a possible 36. This is also the lowest number of stars since the EPA began in 2011, due to declining performance in some areas but also due to our tighter performance standards. Between 2011 and 2025 we have progressively updated and tightened EPA metrics to reflect environmental expectations. To review if there have been performance improvements over time, we have re-assessed all previous years of EPA data using the 2025 methodology. The results (star ratings 2011 to 2025) show some progress with EPA performance up to 2023, but since 2024 the results have deteriorated.
Table 1. Ranked cumulative EPA performance star ratings for the 9 water and sewerage companies 2021 to 2025 – each year a maximum of 4 stars
| Water and sewerage company | 2021 (year 1) | 2022 (year 2) | 2023 (year 3) | 2024 (year 4) | 2025 (year 5) | Total |
|---|---|---|---|---|---|---|
| Severn Trent Water | 4 stars | 4 stars | 4 stars | 4 stars | 4 stars | 20 stars |
| United Utilities | 4 stars | 3 stars | 4 stars | 2 stars | 2 stars | 15 stars |
| Northumbrian Water | 4 stars | 3 stars | 3 stars | 2 stars | 2 stars | 14 stars |
| Wessex Water | 2 stars | 2 stars | 4 stars | 2 stars | 2 stars | 12 stars |
| Anglian Water | 2 stars | 2 stars | 2 stars | 2 stars | 2 stars | 10 stars |
| Yorkshire Water | 2 stars | 3 stars | 2 stars | 2 stars | 1 star | 10 stars |
| Southern Water | 1 star | 2 stars | 2 stars | 2 stars | 1 star | 8 stars |
| South West Water | 1 star | 2 stars | 2 stars | 2 stars | 1 star | 8 stars |
| Thames Water | 2 stars | 2 stars | 2 stars | 1 star | 1 star | 8 stars |
| Total | 22 stars | 23 stars | 25 stars | 19 stars | 16 stars | 105 stars |
For historic results, see our EPA results 2011 to 2025 and EPA star ratings 2011 to 2025. Water and sewerage company specific reports with data for 2011 to 2025 are also available.
4.3 Performance expectations (2020 to 2025)
In October 2017, we set out our performance expectations for 2020 to 2025 (Water Industry Strategic Environmental Requirements, WISER) describing environmental, resilience and flood risk obligations. Water companies were required to take these into account when developing their business plans for the AMP7 period 2020 to 2025.
We had the following expectations of water and sewerage companies that were directly relevant to the EPA:
- trend to minimise all pollution incidents (category 1 to 3) by 2025 – there should be at least a 40% reduction compared to numbers of incidents recorded in 2016
- serious pollution incidents must trend towards zero
- a plan in place to achieve 100% compliance for all licences and permits and 100% compliance with all look-up table conditions (where a limit cannot be exceeded more than a specified number of times in a 12 month period)
- high levels of self-reporting of pollution incidents with at least 80% of incidents self-reported by 2025 and more than 90% of incidents self-reported for just STW and PS combined
- business plans include all measures identified within the WINEP and these are planned well and completed to agreed timescales and specification
- manage sewage sludge treatment and re-use so as not to cause pollution to land, surface water or groundwater
Most water and sewerage companies translated our expectations into actions within their 2020 to 2025 business plans. Ofwat approved funding to deliver them as part of the 2019 price review (PR19) final determination.
Now the period has ended, we have assessed whether the expectations that are directly relevant to the EPA were met by the water and sewerage companies in 2025. Our findings are in the relevant sections of this report.
5. Pollution incident performance
Pollution incidents lead to the release of harmful substances into air, land or water, and some can cause significant harm to the environment and impact human health. We categorise all incidents based on their impact. Incidents are assessed as having a major impact (category 1), significant impact (category 2), minor impact (category 3) or no impact (category 4). This report includes data on incidents affecting the water environment. For more details see our EPA metric guide.
Water and sewerage companies must manage assets and maintain them in good operational condition so that they do not cause pollution. This is a basic requirement which they should ensure is adequately funded. This includes being prepared for the effects of climate change and ensuring that assets are robust and resilient to extreme weather. Details of how we are taking action against the water and sewerage companies are in section 10 of this report (regulatory interventions).
Storm overflows are a necessary part of the current sewerage system. They are designed to discharge storm sewage (wastewater diluted with rainwater) to rivers or the sea at times of rainfall or snow melt. This is to prevent storm sewage backing up into homes and flooding streets. If they are operating outside of these circumstances, they are deemed non-compliant with their permit and, where reported to us at the time, are recorded as pollution incidents. Monitoring of storm overflows has increased to capture information on how they are operating. This is covered in section 8.2 of this report (Event Duration Monitoring, EDM, of storm overflows). We are expanding the incident metric in the EPA for 2026 to 2030 data reporting to use data from this new monitoring.
5.1 Serious pollution incidents
The number of serious water quality pollution incidents (category 1 and 2) from sewerage and water supply assets for the sector continues to be unacceptable (Figure 1). Our performance expectation (in WISER, issued in 2017) for water and sewerage companies in the period 2020 to 2025 was that there should be a trend towards zero serious incidents. The water and sewerage company sector as a whole has not met this expectation, instead we have seen an increasing trend in numbers. Although 4 water and sewerage companies did achieve zero serious incidents within the 2020 to 2025 period (Northumbrian Water 3 times), no company sustained this.
In 2025:
- there were 74 serious pollution incidents, numbers are too high and continue the trend of deteriorating performance at the end of this EPA period – 75 in 2024, 47 in 2023, 45 in 2022 and 62 in 2021
- looking back to 2011 there was a slight improving trend up until 2020, however performance in the most recent years has worsened
- the majority of serious pollution incidents (61 of the 74, 82%) were from 4 of the 9 water and sewerage companies (Thames Water – 24, Yorkshire Water – 13, Southern Water – 12, and Anglian Water – 12) – these companies continue to have far more serious incidents than the rest of the sector
- no water and sewerage company achieved zero serious pollution incidents
- 7 water and sewerage companies performed significantly below target (red) for this EPA metric and 2 performed below target (amber) – no company achieved target (green)
- the majority of serious pollution incidents continue to be from foul sewers (26) followed by STW (19), rising mains (16) and PS (8) – representing 69 out of the 74 (93%)
- there were 2 serious pollution incidents from water supply assets, both from the water distribution systems of Thames Water – 8 companies had zero
- for the most serious (category 1) pollution incidents there were 6 from 5 water and sewerage companies – 2 from Severn Trent Water and 1 each from Anglian Water, Southern Water, South West Water and Thames Water
Figure 1. Number of serious pollution incidents (category 1 and 2) from sewerage and water supply assets, and trend for the 9 water and sewerage companies 2011 to 2025
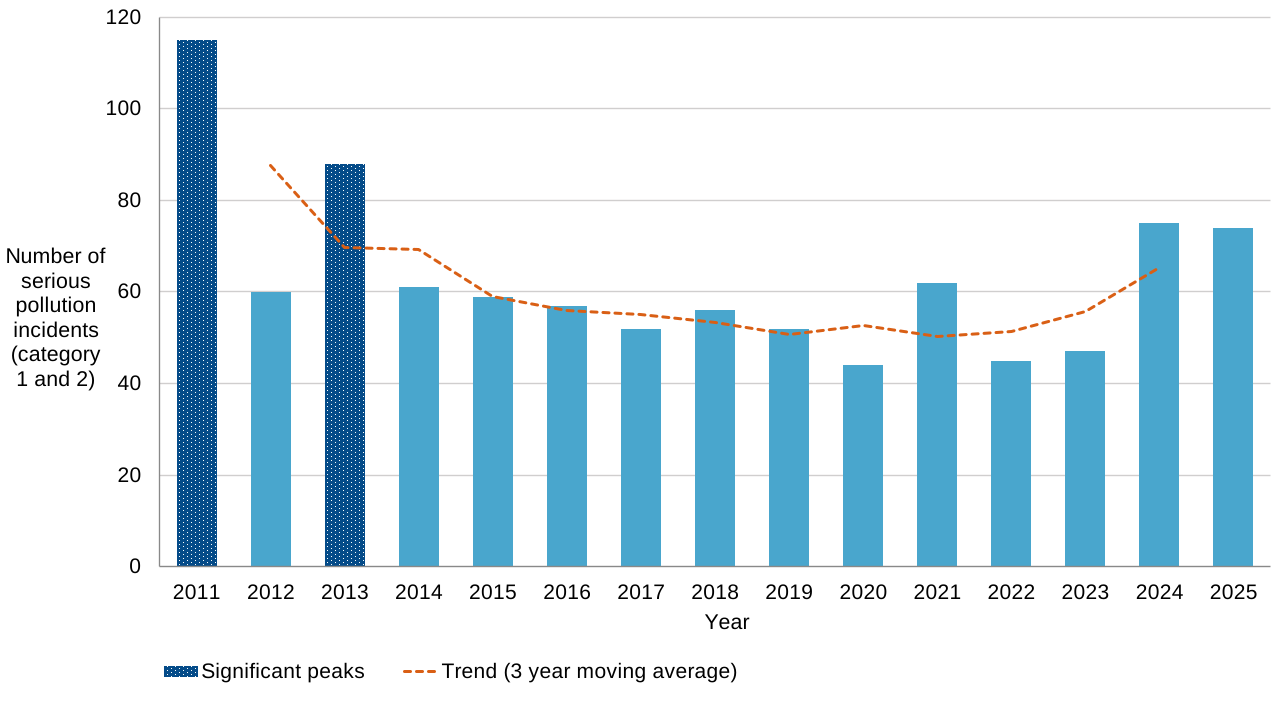
Figure 1 note: a statistical assessment (using the Pearson correlation coefficient) has been applied to annual data. This identifies the years 2011 and 2013 to be significantly higher than the average for the data period 2011 to 2025.
Table 2. Number of serious pollution incidents (category 1 and 2) from sewerage and water supply assets, and 3 year moving average for the 9 water and sewerage companies 2011 to 2025
| Year | Water and sewerage company sector total | Water and sewerage company sector trend (3 year moving average) |
|---|---|---|
| 2011 | 115 | - |
| 2012 | 60 | 87.7 |
| 2013 | 88 | 69.7 |
| 2014 | 61 | 69.3 |
| 2015 | 59 | 59.0 |
| 2016 | 57 | 56.0 |
| 2017 | 52 | 55.0 |
| 2018 | 56 | 53.3 |
| 2019 | 52 | 50.7 |
| 2020 | 44 | 52.7 |
| 2021 | 62 | 50.3 |
| 2022 | 45 | 51.3 |
| 2023 | 47 | 55.7 |
| 2024 | 75 | 65.3 |
| 2025 | 74 | - |
Table 2 note: 3 year moving averages are presented for the middle year of each 3 years. The years 2011 and 2025 are included in calculations but do not have averages presented in the table as they are not middle years.
5.2 Total pollution incidents
The total number of incidents affecting the water environment from sewerage and water supply assets remains too high (Figure 2). Our performance expectation (in WISER, issued in 2017) for water and sewerage companies in the period 2020 to 2025 was for a trend to minimise pollution incidents with at least a 40% reduction compared to the number of incidents (1,902) in 2016. The water and sewerage company sector as a whole has not met this expectation. Instead in 2025 numbers were 40% higher than in 2016.
In 2025:
- there were 2,666 incidents from sewerage and water supply assets – a slight improvement compared to 2,801 in 2024 but numbers remain too high, significantly more than the average since 2011
- looking back to 2011 there was initially a reduction in incident numbers up to 2016, however this trend of improvement has reversed with numbers now similar to 2011
- Thames Water had the most incidents (464) followed by Anglian Water (433), United Utilities (388), Yorkshire Water (335) and Southern Water (301)
- most incidents (83%) were from sewerage assets – the majority, although slightly lower than in 2024, were from foul sewers (747) followed by STW (604) and PS (550), with incidents from rising mains (179) continuing to increase
- there were 461 incidents from water supply assets, an increase from 332 in 2024 and 272 in 2023 – most were from the water distribution system (441)
Figure 2. Number of pollution incidents (category 1 to 3) from sewerage and water supply assets, and trend for the 9 water and sewerage companies 2011 to 2025
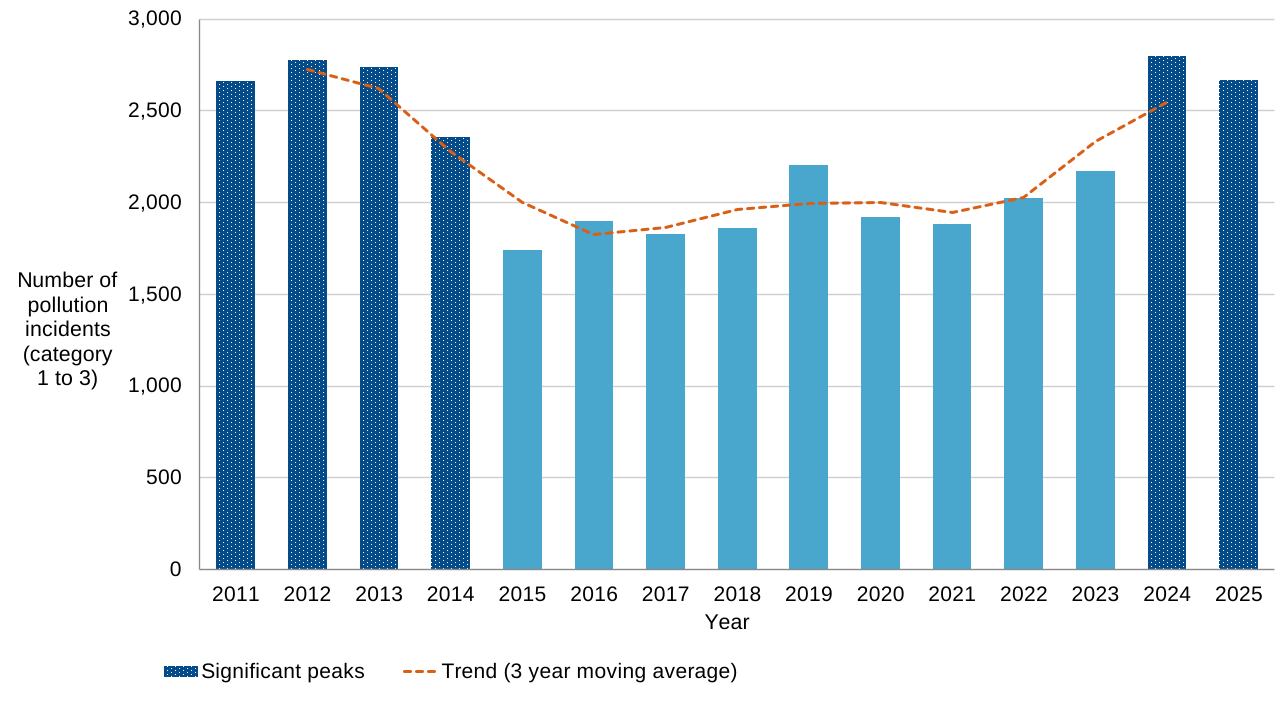
Figure 2 note: a statistical assessment (using the Pearson correlation coefficient) has been applied to annual data. This identifies the years 2011 to 2014, 2024 and 2025 to be significantly higher than the average for the data period 2011 to 2025.
Table 3. Number of pollution incidents (category 1 to 3) from sewerage and water supply assets, and 3 year moving average for the 9 water and sewerage companies 2011 to 2025
| Year | Water and sewerage company sector total | Water and sewerage company sector trend (3 year moving average) |
|---|---|---|
| 2011 | 2,660 | - |
| 2012 | 2,776 | 2,725 |
| 2013 | 2,738 | 2,624 |
| 2014 | 2,358 | 2,279 |
| 2015 | 1,742 | 2,001 |
| 2016 | 1,902 | 1,824 |
| 2017 | 1,827 | 1,864 |
| 2018 | 1,863 | 1,965 |
| 2019 | 2,204 | 1,995 |
| 2020 | 1,919 | 2,002 |
| 2021 | 1,883 | 1,943 |
| 2022 | 2,027 | 2,028 |
| 2023 | 2,174 | 2,334 |
| 2024 | 2,801 | 2,547 |
| 2025 | 2,666 | - |
Table 3 note: 3 year moving averages are presented for the middle year of each 3 years. The years 2011 and 2025 are included in calculations but do not have averages presented in the table as they are not middle years.
Our EPA metric assesses the total number of water quality pollution incidents from water and sewerage company sewerage assets. Due to variation in company size, we normalise the number of sewerage pollution incidents per 10,000km of sewer length for which a water and sewerage company is responsible.
In 2025:
- there were 2,205 sewerage pollution incidents, a slight improvement on 2,469 in 2024 – however this is a big deterioration since the start of this EPA period (1,677 in 2021, 1,659 in 2022 and 1,902 in 2023)
- the majority of water and sewerage companies (8 out of 9) performed significantly below target (red) for this EPA metric – Southern Water for the seventh year in a row and South West Water for all 15 EPA reported years
- only Severn Trent Water achieved the EPA metric target (green)
- if all water and sewerage companies had achieved green EPA status in this metric there would have been at least 1,165 fewer sewerage pollution incidents and far less environmental harm
- Southern Water performed the worst (with 64 incidents per 10,000km sewer)
5.3 Self-reporting of incidents
We expect water and sewerage companies to report pollution incidents to us in a timely way before others do, particularly for their sites where technology makes remote monitoring viable. Without a rapid response, the impact of pollution can escalate and the opportunity for mitigation measures can be lost.
Our performance expectation (in WISER, issued in 2017) for water and sewerage companies in the period 2020 to 2025 was for high levels of self-reporting of pollution incidents. The water and sewerage company sector as a whole has achieved this, due to performance of the majority of companies (Figure 3). We also assess the self-reporting percentage for incidents from just STW and PS combined. We expect higher self-reporting for incidents from these permitted assets. They normally have alarms or staff on site so there is a greater chance of an incident being reported first by water and sewerage companies.
In 2025:
- for the EPA metric, 87% of all recorded incidents were self-reported by water and sewerage companies, the best performance since the start of the EPA – this continued the trend of gradual improvements (85% in 2024, 84% in 2023, 82% in 2022 and 77% in 2021)
- the water and sewerage company sector achieved 93% for all incidents from just PS and STW combined, compared to 92% in 2024 and 93% in 2023 – this is higher performance than for all asset types, which is what we expect
- 8 water and sewerage companies achieved the EPA metric target (green) – of these Northumbrian Water, Severn Trent Water and Wessex Water have been consistently green in every year of this EPA period (since 2021)
- South West Water had the lowest self-reporting performance compared to the other water and sewerage companies and performed below target (amber) for the EPA metric
- most incidents were from foul sewers and self-reporting from this asset type has improved in recent years but continues to be too low (76%) – further improvement is required
- self-reporting of serious pollution incidents (category 1 and category 2) by the majority of water and sewerage companies was far too low at 69% (51 out of 74), compared to 63% in 2024 and 74% in 2023 – given the environmental impact of these incidents companies must significantly improve
Figure 3. Percentage self-reporting of pollution incidents (category 1 to 3) from sewerage and water supply assets, and trend for the 9 water and sewerage companies 2011 to 2025
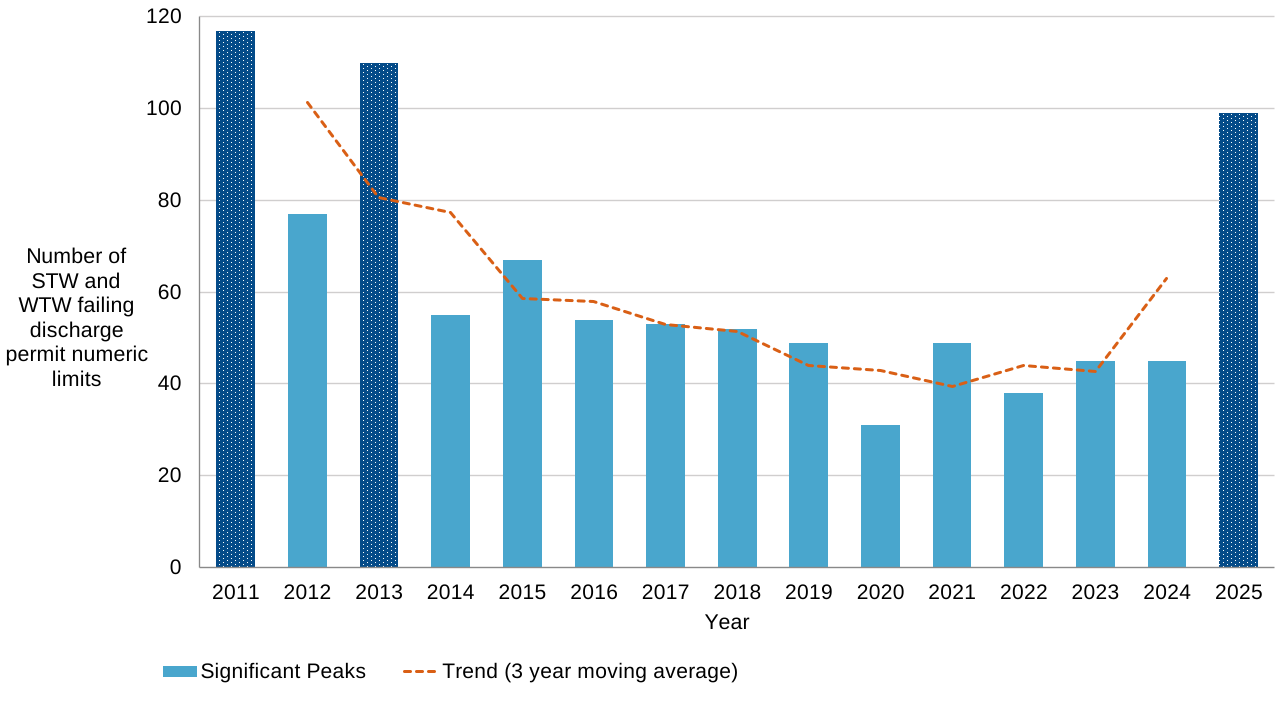
Table 4. Percentage self-reporting of pollution incidents (category 1 to 3) from sewerage and water supply assets, and 3 year moving average for the 9 water and sewerage companies 2011 to 2025
| Year | Water and sewerage company sector average | Water and sewerage company sector trend (3 year moving average) |
|---|---|---|
| 2011 | 66 | - |
| 2012 | 67 | 66.3 |
| 2013 | 66 | 66.3 |
| 2014 | 66 | 67.0 |
| 2015 | 69 | 69.0 |
| 2016 | 72 | 72.3 |
| 2017 | 76 | 74.7 |
| 2018 | 76 | 77.3 |
| 2019 | 80 | 77.7 |
| 2020 | 77 | 78.0 |
| 2021 | 77 | 78.7 |
| 2022 | 82 | 81.0 |
| 2023 | 84 | 83.7 |
| 2024 | 85 | 85.3 |
| 2025 | 87 | - |
Table 4 note: 3 year moving averages are presented for the middle year of each 3 years. The years 2011 and 2025 are included in calculations but do not have averages presented in the table as they are not middle years.
6. Compliance with licences and permits
All water and sewerage companies have licences and permits and are required to comply with them. We set conditions to control the impact that licensed and permitted activities are allowed to have, based on the nature and sensitivity of the receiving environment. Water and sewerage companies must comply with these conditions to reduce their impact and protect the water environment. You can find details of how we are taking action against the water and sewerage companies in section 10 of this report (regulatory interventions).
The EPA includes assessment of compliance with numeric permit conditions to discharge treated wastewater from STW and WTW (not storm overflows). We are expanding the EPA for 2026 to 2030 data reporting to cover more aspects of water and sewerage company licence and permit compliance.
The increased monitoring of storm overflows is covered in section 8.2 of this report (EDM of storm overflows). This will allow us to further assess and report on compliance of the wider sewerage network in the future.
6.1 Discharge permit compliance (numeric)
This section is about water and sewerage company compliance with permits to discharge treated wastewater from STW and WTW (not storm overflows). It is a requirement to comply with permits. As part of the EPA, we assess compliance with conditions in these permits that set numeric limits for pollutants in the discharges. We set limits to prevent discharges causing environmental harm or pollution. Our WISER performance expectation for 2020 to 2025 sets out that water and sewerage companies should have a plan in place to achieve 100% compliance. However, compliance for the water and sewerage company sector has deteriorated (Figure 4).
In 2025:
- 97.4% of STW and WTW were compliant, worse than 98.8% in 2024 and 2023, 99.0% in 2022 and 98.7% in 2021 – there has been a deterioration in water and sewerage company sector compliance in this EPA period, much of this can be attributed to Thames Water
- out of 3,783 STW and WTW permitted discharge outlets there were 99 non-compliant sites (93 STW and 6 WTW) – this is the third highest number since 2011, and significantly higher than the average since 2011
- no water and sewerage company achieved 100% compliance with their permits for the fourth consecutive year
- Southern Water and Thames Water performed significantly below target (red) – Thames Water had the highest number of non-compliant sites (45)
- 5 water and sewerage companies performed below target (amber)
- Severn Trent Water and Yorkshire Water were the only water and sewerage companies to achieve target (green) for this EPA metric – Severn Trent Water have been consistently green for all years in this EPA period since 2021
- there would have been at least 65 fewer non-compliant sites if all water and sewerage companies had achieved green EPA status
- out of 3,516 STW, the majority of non-compliant STW (49) were due to failure by 4 water and sewerage companies to meet new or tightened phosphorus limits that reflect WINEP obligations – Thames Water failed to meet this limit at 43 STW
- out of 267 WTW permitted discharge outlets, 6 WTW were non-compliant, the same as in 2023 and 2024 – this is the joint lowest number since WTW were included in the EPA from 2016, however further improvement is required
Figure 4. Number of STW and WTW failing discharge permit numeric limits and trend for the 9 water and sewerage companies 2011 to 2025
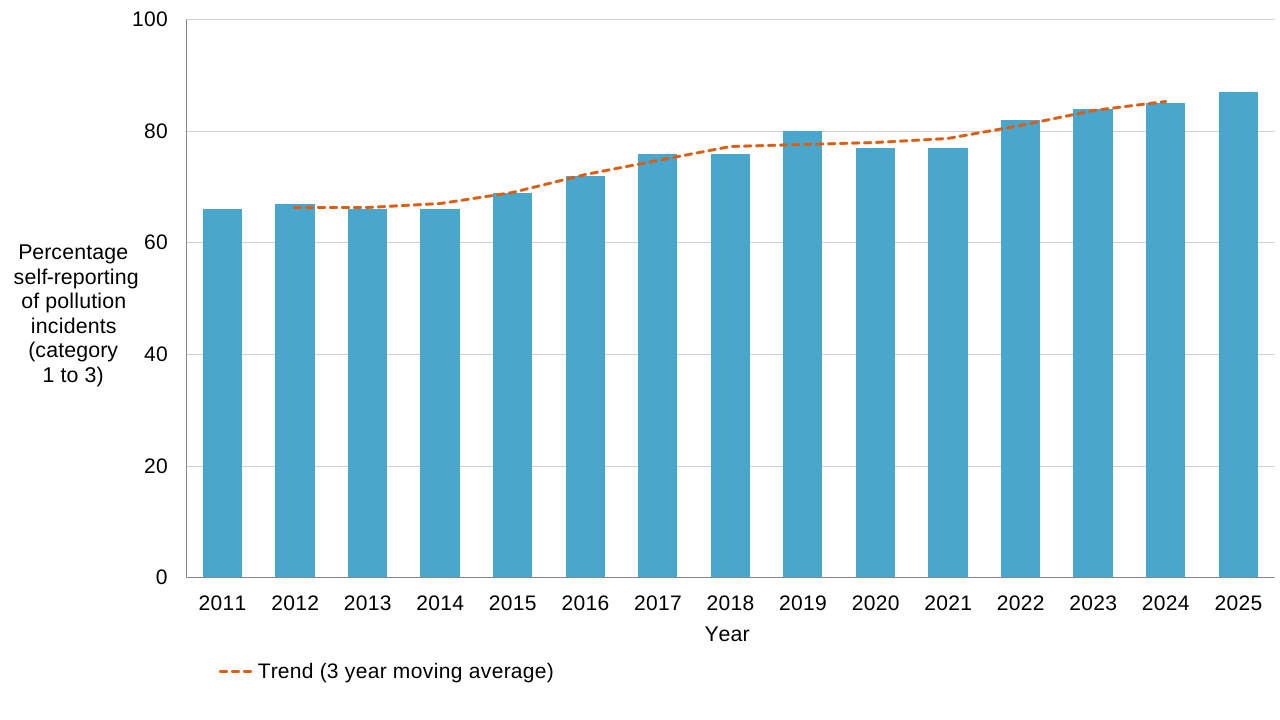
Figure 4 note: a statistical assessment (using the Pearson correlation coefficient) has been applied to annual data. This identifies the years 2011, 2013 and 2025 to be significantly higher than the average for the data period 2011 to 2025.
Table 5. Number of STW and WTW failing discharge permit numeric limits and 3 year moving average for the 9 water and sewerage companies 2011 to 2025
| Year | Water and sewerage company sector total | Water and sewerage company sector trend (3 year moving average) |
|---|---|---|
| 2011 | 117 | - |
| 2012 | 77 | 101.3 |
| 2013 | 110 | 80.7 |
| 2014 | 55 | 77.3 |
| 2015 | 67 | 58.7 |
| 2016 | 54 | 58.0 |
| 2017 | 53 | 53.0 |
| 2018 | 52 | 51.3 |
| 2019 | 49 | 44.0 |
| 2020 | 31 | 43.0 |
| 2021 | 49 | 39.3 |
| 2022 | 38 | 44.0 |
| 2023 | 45 | 42.7 |
| 2024 | 45 | 63.0 |
| 2025 | 99 | - |
Table 5 note: 3 year moving averages are presented for the middle year of each 3 years. The years 2011 and 2025 are included in calculations but do not have averages presented in the table as they are not middle years.
6.2 Abstraction and impounding licence compliance
Water companies hold abstraction and impounding licences that allow them to abstract water from the environment or impound water.
In 2025, across all the licence conditions for water and sewerage companies, we have identified:
- 243 compliance breaches across 158 licences (13%) out of a total of 1,214 licences held
- 42% of the breaches were for abstraction meter issues, such as not calibrating an abstraction meter – we expect water companies to install and maintain accurate water abstraction meters to ensure they can verify that they are abstracting within the conditions of their licences
- 23% of breaches were for over-abstraction – water companies must fully comply with their abstraction limits as over-abstraction reduces the water available for other legitimate water users and the environment
- 14% of breaches were for compensation flow (for example water released from reservoirs) failures – we expect water companies to consistently maintain required compensation flows as compensation flow failures can reduce the water available for other legitimate water users and the environment
- 7% of breaches were for monitoring issues such as missing data – accurate data is essential so that companies can verify that they are abstracting within the conditions of their licences
Compliance figures in previous publications are not directly comparable as they were based on partial data available at the time of publication and were for a subset of compliance breaches.
Most of England was in drought or prolonged dry weather in 2025, following a dry spring and one of the hottest summers on record. During prolonged dry weather and drought, there is more pressure on water resources. This increases the risk that abstractors are non-compliant with licence conditions and impacts on the environment.
Where we find that licence holders are not compliant with the conditions on their licences, we will take appropriate enforcement action as set out in our enforcement and sanctions policy.
We are developing an abstraction and impounding metric that we plan to include in the EPA during the period 2026 to 2030.
6.3 Waste permit compliance
Water and sewerage companies operate various waste management sites under the Environmental Permitting (England and Wales) Regulations 2016 (EPR). These include sewage sludge anaerobic digestion (AD), waste transfer stations, discharge of liquid waste into wastewater treatment works by tankers, sludge incineration and landfill. We assess compliance and give a compliance band of between A or B (good) to F (poor). Sites in compliance bands C and D must improve, and sites in bands E and F must significantly improve.
We worked with the water and sewerage company sector to bring unpermitted AD sites into the EPR, as required by the Industrial Emissions Directive. As the number of new permits for sewage sludge AD increased, instances of non-compliance have increased since 2024. A programme of improvements in company compliance plans will ensure compliance steadily improves as we approach 2030. Until then, we continue to score non-compliance with permit conditions.
In 2025, out of 316 permitted waste sites, 80% were compliant (bands A and B).
For the remaining 20%:
- 38 sites were not compliant (band D and E)
- 16 sites were assessed as band E (7 operated by Thames Water, 2 each by Anglian Water, Severn Trent Water and Yorkshire Water, and 1 each by Southern Water, South West Water and Wessex Water) – this is a drop in performance compared to 2 band E performers in 2024
- 32 sites were assessed as band D (12 operated by Thames Water, 9 by Severn Trent Water, 3 by Anglian Water, 2 each by Northumbrian Water, United Utilities and Yorkshire Water and 1 each by South West Water and Southern Water) – this represents a fall in performance compared to 14 band D performers in 2024, 8 in 2023 and 4 in 2022
- 25 sites were assessed as requiring improvement, band C (6 operated by Yorkshire Water, 5 each by Anglian Water and Thames Water, 4 by Southern Water, 2 each by Severn Trent Water and United Utilities and 1 by Northumbrian Water – this reflects an increase year on year with 15 band C in 2024 and 6 in 2023
There were 2 serious pollution incidents (category 2) caused by Anglian Water (to air) and Severn Trent Water (to land). There were 47 incidents that caused minor impacts to the environment, the most being caused by Thames Water (37).
Sewage sludge AD installations
There are now 101 permitted sludge AD sites. We expect this number to increase slightly in 2026. We are working with the water and sewerage companies to ensure they make significant improvements to their sites, reducing pollution risks and becoming compliant with their permits.
Since last year all water and sewerage companies produced compliance plans. These plans provide us with evidence that each company has committed to improvements that will result in complete compliance with their permits by the end of AMP8 in March 2030. We agreed all compliance plans apart from Thames Water’s plan.
The companies’ compliance plans will drive improvements to ensure:
- emissions of the greenhouse gas methane are minimised – using leak detection and repair programmes and enclosing digestate storage tanks to capture and use methane rich biogas
- the structural integrity of existing assets like liquid storage tanks are in good condition
- emissions to water are prevented from liquid storage tanks by installing secondary containment infrastructure
- emission limits are met for point source emissions to water and air
- appropriate disposal of tankered liquid wastes
6.4 Reservoir compliance
Water and sewerage companies operate 611 large raised reservoirs in England. These are reservoirs that store at least 25,000 cubic metres of water above natural ground level.
Operators of large raised reservoirs must comply with the Reservoirs Act 1975 (as amended). They must appoint engineers to supervise and inspect the reservoir, and complete safety measures identified by the inspecting engineer. We assess compliance with the legislation. This report focuses on major non-compliances, which are where a reservoir operator has not:
- appointed a supervising engineer to oversee ongoing safety
- appointed a construction engineer to oversee construction or alteration of a reservoir
- appointed an inspecting engineer to carry out the statutory inspection
- completed safety measures identified by the inspecting engineer by the deadline
In 2025, 6 reservoirs operated by water and sewerage companies had non-compliances for overdue safety measures. Northumbrian Water did not complete safety measures by the deadline at 3 reservoirs. Southern Water, South West Water and Yorkshire Water did not complete safety measures by the deadline at 1 reservoir each. Of these non-compliances, 2 were resolved by the end of 2025. However, non-compliances continued into 2026 at 1 Northumbrian Water reservoir, 1 Southern Water reservoir, 1 South West Water reservoir and 1 Yorkshire Water reservoir.
Maintaining reservoir safety continues to be our priority. Through our proactive regulatory approach, we work with water companies to identify and address risks early and secure consistently high standards of reservoir safety. Each water company has a dedicated reservoir regulation account manager who leads planned engagement, promotes open dialogue and maintains clear oversight of compliance. Where concerns or non-compliance arise, we set clear expectations, monitor progress and take timely, proportionate enforcement action in line with our regulatory responsibilities.
We are continuing with the Reservoir Safety Reform Programme. We publish regular updates on the Reservoir Safety Reform Programme engagement page.
7. Satisfactory sludge use and disposal
Sewage sludge is a product of wastewater treatment. Water and sewerage companies must manage sewage sludge treatment and re-use so as not to cause pollution to soil, surface water or groundwater. The EPA sludge metric measures the percentage of sewage sludge produced and controlled by a water and sewerage company that is dispatched and used or disposed of in a satisfactory manner. We review water and sewerage company data to check compliance with relevant environmental legislation. These include the Sludge (Use in Agriculture) Regulations and the EPR.
In 2025:
- the 9 water and sewerage companies dispatched 873,522 tonnes (dry solids) of sewage sludge, of which 92.5% was used by them on agricultural land (across 165,449 hectares of land)
- 99.99% of sewage sludge produced met the requirements of the satisfactory sludge use and disposal metric – all water and sewerage companies achieved the target (green) for this EPA metric, the same as in 2022, 2023 and 2024
- 8 water and sewerage companies reported 100% satisfactory sludge use and disposal – United Utilities reported 99.94% due to unsatisfactory sludge related to non-compliance with the S3 exemption for storage of sewage sludge
We continue to work with the water industry to improve the management of their sludge and its use on agricultural land to supply beneficial organic matter and nutrients. This work supports our aims that are given in our strategy for safe and sustainable sludge use.
8. Environmental improvement schemes
8.1 Water Industry National Environment Programme (WINEP)
Ofwat sets controls that limit what water companies can charge their customers in each 5 year period. As part of their price review (PR19) for 2020 to 2025, water companies were allocated £5 billion for environmental enhancements.
We developed and published a WINEP for each water company for the 5 year AMP7 investment cycle. These set out the actions that we required water companies to complete to meet their statutory obligations and environmental requirements.
For the 5 financial years ending March 2025, 11,348 WINEP actions were delivered (of which 10,817 were by water and sewerage companies). These actions reduced the impact of their activities on the local water environment providing benefits for wildlife and people. They included the following environmental outcomes:
- contributed to the enhancement of 4,475km water habitat and protection of 867km water habitat
- reduced phosphate load – monitoring shows a cut of 36% (from 8.34 kilo tonnes per annum in 2020 to 5.34 kilo tonnes per annum in 2025)
- contributed to 4 bathing waters being improved and 9 maintained
As part of Ofwat’s price review (PR24) for 2025 to 2030, water and sewerage companies in England were allocated £21.59 billion for environmental enhancements. We developed and published a new WINEP for each water company with actions for the 5 year AMP8 investment cycle. The PR24 WINEP dataset and an interactive mapping tool can be accessed from the Department for Environment, Food and Rural Affairs (Defra) Data Services Platform.
The financial year ending March 2030 will be the last year of the plan. Our expectation is for all planned schemes (including asset improvements, investigations and monitoring) to be completed to agreed timescales and specification. This expectation was not met for the financial year ending March 2026 (Figure 5).
The EPA WINEP metric assesses completion of all improvement, no deterioration and investigation schemes. Any delay in planned improvements can lead to impacts on the water environment and pose wider risks to sustainability and growth. Monitoring schemes are excluded from the EPA, with the exception of schemes to monitor invasive non-native species. Any outstanding schemes from AMP7 are being tracked and reported with AMP8 schemes in this EPA reporting period. For the financial year ending March 2026 (for year 1 of the AMP8 WINEP including outstanding AMP7 actions) for WINEP schemes in the EPA:
- 80.2% (502 out of 626) met requirements within planned deadlines – the lowest percentage completion since the EPA WINEP metric was introduced in 2011, largely due to Thames Water
- 124 actions that were due this year were not completed, of which 117 were actions that were reported as undelivered in the previous year (financial year ending March 2025, AMP7) – these were mostly capital actions to improve the water environment or cause no deterioration for example where there was pressure from population growth
- Thames Water failed to deliver 105 schemes within planned deadlines – 86 water quality, 11 water resources and 8 fisheries, biodiversity and geomorphology
- 4 water and sewerage companies failed to meet all requirements (red) within planned deadlines – Thames Water 105 schemes (24.5%), Southern Water 10 schemes (50%), Yorkshire Water 5 schemes (93.2%) and South West Water 4 schemes (94.2%)
- 5 water and sewerage companies met all requirements (100%, green) within planned deadlines – Anglian Water, Northumbrian Water, Severn Trent Water, United Utilities and Wessex Water
For the 502 WINEP actions in the EPA that were delivered by water and sewerage companies in the financial year ending March 2026, 299 were investigations to assess the impact of company assets on the environment. There were 203 completed actions to improve the environment or prevent it deteriorating. These were:
- 189 water quality actions – including 74 to reduce phosphorus and other nutrients in discharges, 12 to improve water quality at 2 designated bathing waters, 12 to reduce spills from storm overflows and 1 action to protect the quality of water abstracted for drinking water supply
- 5 water resources actions – including 2 actions to protect or improve rivers flows by reducing abstraction
- 9 fisheries, biodiversity and geomorphology actions which benefit designated sites and species
Figure 5. Percentage of WINEP (National Environment Programme, NEP, up to financial year ending 2020) complete within deadlines for the 9 water and sewerage companies, for the financial years ending 2012 to 2026
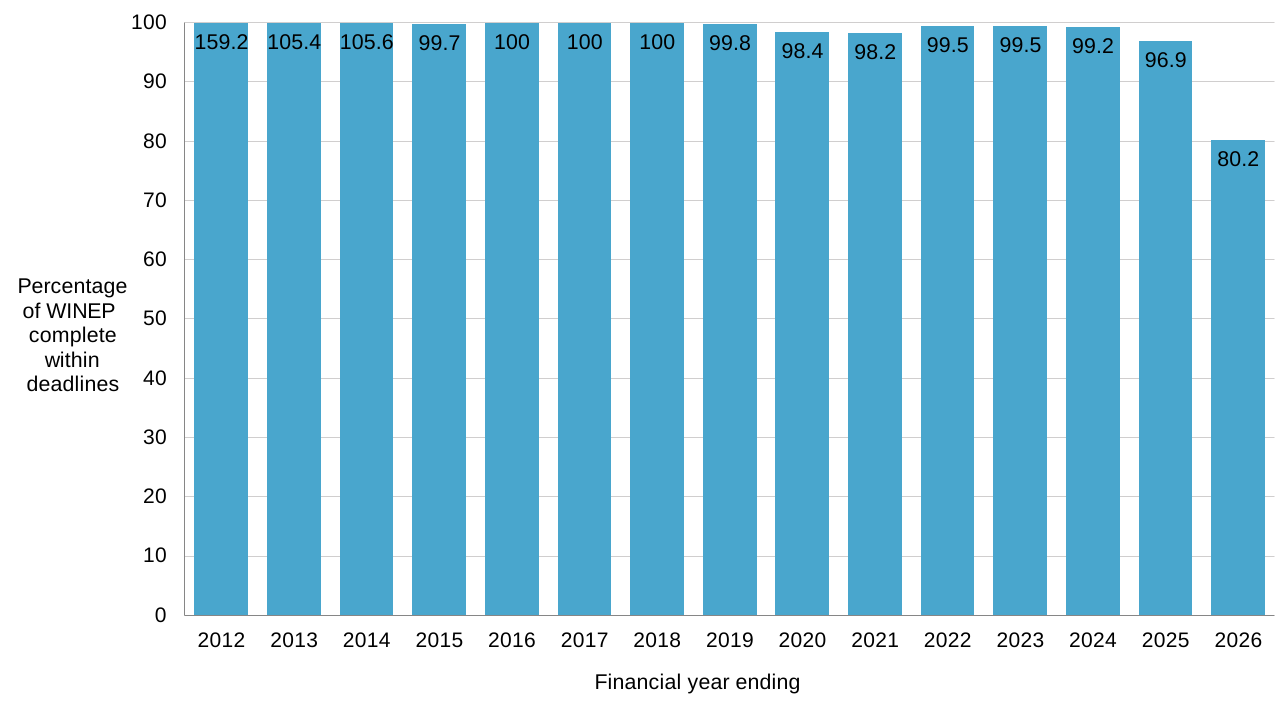
Table 6. Percentage of WINEP (NEP up to financial year ending 2020) complete within deadlines for the 9 water and sewerage companies, for the financial years ending 2012 to 2026
| Financial year ending | Water and sewerage company sector percentage |
|---|---|
| 2012 | 159.2 |
| 2013 | 105.4 |
| 2014 | 105.6 |
| 2015 | 99.7 |
| 2016 | 100 |
| 2017 | 100 |
| 2018 | 100 |
| 2019 | 99.8 |
| 2020 | 98.4 |
| 2021 | 98.2 |
| 2022 | 99.4 |
| 2023 | 99.5 |
| 2024 | 99.2 |
| 2025 | 96.9 |
| 2026 | 80.2 |
Figure 5 and Table 6 note: AMP5 schemes (for the 5 financial years ending 2015) that were completed early before their planned year were included in the cumulative delivery percentage. In some years, this resulted in percentages over 100%. Later schemes that were completed early before their planned year are not included in the cumulative delivery percentage until their planned year (cannot report over 100%).
Table 7. Water and sewerage company WINEP EPA scheme delivery for year 1 of the AMP8 WINEP (financial year ending March 2026) including AMP7 actions undelivered in the previous year
| Water and sewerage company | Percentage WINEP delivery year 1 | Total schemes completed year 1 | Total schemes not completed year 1 | Schemes not completed – AMP7 from previous year | Total schemes in AMP8 (due to deliver by 31 March 2030) |
|---|---|---|---|---|---|
| Anglian Water | 100 | 144 | 0 | 0 | 2,611 |
| Northumbrian Water | 100 | 5 | 0 | 0 | 1,646 |
| Severn Trent Water | 100 | 109 | 0 | 0 | 2,345 |
| Southern Water | 50.0 | 10 | 10 | 7 | 929 |
| South West Water | 94.2 | 65 | 4 | 3 | 737 |
| Thames Water | 24.5 | 34 | 105 | 102 | 1,008 |
| United Utilities | 100 | 54 | 0 | 0 | 1,651 |
| Wessex Water | 100 | 13 | 0 | 0 | 851 |
| Yorkshire Water | 93.2 | 68 | 5 | 5 | 1,336 |
| Total | 80.2 | 502 | 124 | 117 | 13,114 |
We also track percentage completion of additional WINEP actions which are not part of the EPA metric. These are mostly to install (appropriate and certified) monitors to measure flow to full treatment at STW. For the financial year ending March 2026 (year 1 of the WINEP), for these WINEP schemes not in the EPA:
- 8 of the 9 water and sewerage companies met all of their requirements within planned deadlines
- 1,140 actions were delivered out of 1,147 planned – Thames Water did not complete 7 schemes out of 271 they had planned
Water and sewerage companies are carrying out investigations into their high spilling storm overflows, using our Storm Overflow Assessment Framework (SOAF). SOAF investigations are not included as part of the EPA metric but are closely tracked through the SOAF Tracking Frameworks with companies reporting outcomes to us. Around 8,700 storm overflows have triggered a SOAF investigation. Companies are expected to progress these investigations into compliance with the Urban Waste Water Treatment Regulations (UWWTR). The outcomes will determine if improvements are required for overflows under the UWWTR requirement to design, construct and maintain sewer networks according to best technical knowledge not entailing excessive costs.
8.2 Event Duration Monitoring (EDM) of storm overflows
Water and sewerage companies have installed EDM on their storm overflows to capture performance information on how often and how long they operate (spill count and duration). We put permits in place for storm overflow operation to ensure they are only used when they should be – during times of rainfall and snowmelt. If storm overflows operate when they should not, they can affect the water quality in our rivers and on our coasts.
At the end of March 2026, we published the EDM Storm Overflow Annual Return dataset for the 2025 calendar year. This was received from water and sewerage companies operating in England (this includes Dŵr Cymru Welsh Water storm overflows in England). This is the sixth year that we have published the full dataset. Water and sewerage companies achieved their obligation to monitor 100% of storm overflows by December 2023. As a result, the 2025 dataset represents the second full year of data for all overflows included.
In 2025:
- the total duration (hours) of monitored spills was 1,878,240
- the total number of monitored spill events recorded was 292,119
- the average number of spills per overflow with spill data was 20.5
- 49.5% of monitored storm overflows operated equal to or less than 10 times
- 15.7% of storm overflows did not record a spill
- monitor operability improved, with only 7.3% of overflows reporting less than 90% operation in 2025 compared to 9.5% in 2024
We have updated the water and sewerage companies EPA methodology for 2026 to 2030. From the 2026 data year onwards, we will include a storm overflows EDM operation metric to assess the number of EDM monitors reporting reliable data. Having working monitors is a basic requirement. The new metric will assess the percentage of monitors providing reliable storm overflow activation data (more than or equal to 90% operation) using the annual regulatory returns.
Table 8. Summary facts from the storm overflow 2025 annual return dataset – the 9 water and sewerage companies ordered by percentage EDM monitors reporting reliable storm overflow activation data (equal to or greater than 90% EDM operation)
| Water and sewerage company | Total number of storm overflows with EDM Operation data | Percentage of storm overflows with ≥90% EDM Operation | Percentage of storm overflows with 0% EDM Operation |
|---|---|---|---|
| Wessex Water | 1,342 | 97.5% | 0% |
| South West Water | 1,358 | 96.7% | 0.07% |
| Severn Trent Water | 2,432 | 96.3% | 0.04% |
| Thames Water | 580 | 94.5% | 0.17% |
| Anglian Water | 1,442 | 91.7% | 0.28% |
| United Utilities | 2,270 | 91.5% | 0% |
| Yorkshire Water | 2,184 | 90.7% | 0.37% |
| Southern Water | 977 | 88.2% | 0.20% |
| Northumbrian Water | 1,561 | 87.1% | 0.13% |
| Total | 14,146 | 92.7% | 0.14% |
9. Flood and coastal erosion risk management (FCERM)
Under the Flood and Water Management Act 2010, water companies are Risk Management Authorities (RMAs). This means they must act in a manner consistent with the National FCERM Strategy for England and have a duty to cooperate with other RMAs.
Between April 2025 and March 2026 water companies have:
- responded to flood incidents, including participating in multi-agency responses
- worked with partners to reduce flood risk and provide wider benefits for communities, including water quality and amenity benefits
- used strategic partnerships, including with Regional Flood and Coastal Committees (RFCCs) to align investment planning and funding
- continued to innovate and share good practice
Between April 2025 and March 2026, water companies invested:
- £114.9 million to reduce the risk of sewer flooding to properties
- £260.1 million to maintain the public sewer system to prevent blockages and flooding
- £12.9 million in property-level protection and mitigation measures to reduce the likelihood of customers’ homes experiencing sewer flooding
In 2025, water companies started developing their statutory drainage and wastewater management plans (DWMPs) following government guidelines for DWMPs. The plans will demonstrate how water company investment from 2030 will meet environmental, water quality, and flood and catchment resilience needs in the face of climate change and population growth. They have established their governance and delivery teams and developed evidence and tools and been engaging with stakeholders. Many have started their collaboration with RMAs on options to manage drainage risks through partnership schemes. Data sharing and digital tools are helping to improve this coordination.
Partnership work continues to focus on rainwater management that uses sustainable drainage systems (SuDS) and natural flood management to reduce flood risk while delivering wider environmental and community benefits. United Utilities, for example, have collaborated with local authorities and other partners on integrated water management plans (including in Greater Manchester, Merseyside, and Cumbria). These plans have helped focus on rainwater management so that flood risk solutions are built into regeneration projects, transport schemes, schools, properties and catchment management.
Innovation continues to take place across the water and sewerage company sector, with companies embracing new technology. Some examples include:
- Southern Water have been working with the Blue Heart Project in East Sussex – this involved SuDS in schools and other projects combining telemetry and hydrological datasets so that flood forecasting capabilities can be developed, tested and improved
- Enabling Water Smart Communities (EWSC), led by Anglian Water and delivered with industry partners, has established a blueprint for water-smart communities – it includes practical measures for water efficiency, water reuse, flood-risk management and behavioural change, that support growth while improving resilience to water scarcity, flooding and pollution
- Severn Trent Water are using latest satellite technology to better understand how extreme weather is impacting their assets, so they take action faster and minimise impacts
10. Regulatory interventions
The water industry underpins public health, homes, habitats and economic growth. A reliable, well‑regulated water and wastewater system is essential to support communities, protect nature, and enable new homes, businesses, and infrastructure.
To do this, water companies must comply with licence and permit conditions and meet their statutory duties. Our role is to hold them to account – ensuring compliance with the law and protecting people and nature.
We continue to take decisive action to drive improvements in environmental performance. Since 2023, we have strengthened and modernised our regulatory approach, with the biggest ever investment in water regulation. This has enabled increased scrutiny including a specialised workforce that faces every water and sewerage company. New powers under the Water (Special Measures) Act 2025 (WSMA) are further enhancing our ability to regulate and enforce standards across the water and sewerage company sector. We have also secured record levels of investment for environmental improvements through the WINEP.
Alongside this, the government has published a new vision for water. This white paper sets out their plans to reform the water sector and the wider water system. It describes the proposed reforms as a ‘once in a generation’ opportunity and includes plans for the creation of a new integrated water regulator.
We remain actively involved in water reform, providing evidence, expertise and operational insight to inform government decisions on the future regulatory model. Water reform provides an opportunity to improve accountability and coordination across the water system. This will better protect human health and the environment, support stable, long-term investment and deliver better outcomes for customers and communities.
10.1 Our regulatory approach
Since 2023, we have made significant changes to the way we regulate water companies to better hold them to account. We continue to modernise and expand our approach using the uplift in water quality permit charges that secured £51 million of additional funding each year.
We have:
- recruited over 400 new roles focusing on water company regulation – including a specialised workforce that faces every water and sewerage company and focuses solely on frontline regulation
- continued our aim to attend all category 1 and 2 (serious and significant) water industry incidents and increased our attendance at category 3 (minor) incidents
- carried out over 10,000 on-site inspections of water industry assets and an additional 3,000 compliance assessments (financial year ending March 2026), finding over 3,000 sites to be non-compliant with their permit – although over 90% were minor breaches, we are taking action for the most serious breaches in line with our enforcement and sanctions policy
- used evidence and intelligence from our inspections and assessments to tailor our regulatory approach to each company
- invested in new digital systems – digital tools and data analysis are targeting root causes of non-compliance, supporting us to direct resource where most needed and enabling us to modernise our permitting system
- improved transparency of how compliance is assessed and enforcement decisions are informed – we now publish the findings of our inspections on compliance assessment report (CAR) forms on the public register
Monitoring developments
We now have access to vast amounts of data from nearly 15,000 EDMs at storm overflows. We have developed processes and tools to map this data intelligently and allow us to direct our regulatory resource to those places that need it the most. Through the revised guidance on the SOAF, we are lowering the spill frequency trigger for investigations of storm overflows. This aligns with the government’s Storm Overflows Discharge Reduction Plan (SODRP) goal of reducing harm to public health and the environment by 2050.
We also have access to data from flow monitors at STW. Installation of monitors by water and sewerage companies is continuing into early AMP8. Increasingly we also have access to data from continuous water quality monitors (water and sewerage company monitors upstream and downstream of their discharges).
Reporting
We are strengthening and broadening our reporting and the EPA for the 2026 to 2030 data years. This is to make sure we assess water and sewerage company progress towards performance expectations and statutory obligations as set out in our revised WISER (published May 2022).
We are improving transparency and consistency in our reporting of water company pollution incidents. This includes that dry day spills identified from the monitoring of storm overflows will be recorded as pollution incidents and reported in the EPA (from 2026 data onwards).
For the reporting of water and sewerage company performance in 2025 we have worked with the Drinking Water Inspectorate, Natural Resources Wales and Ofwat to publish a single, integrated view of water company performance. The water industry performance insights report brings together data and analysis from across all 4 regulators to provide a comprehensive shared view of how water companies in England and Wales are performing.
Stakeholder engagement
We continue to engage with water and sewerage companies at chair, executive director and operational levels. We set out what is expected and encourage them to work together and share good practice and innovative approaches that will improve their environmental performance. We also bring together key stakeholders with a significant interest in water and the impacts on it.
Sludge and waste
As the regulator, we are:
- continuing to work with Defra to assess the regulatory framework for sludge applied to agriculture – further details on the use of sludge and information on our strategy for safe and sustainable sludge use are on our Water Hub
- working on several sludge investigations within the water industry led Chemicals Investigation Programme (CIP) to assess the complexity of sludge from antimicrobial agents, microplastics and chemicals including per- and polyfluoroalkyl substances (PFAS)
- ensuring the sludge environmental enhancements agreed within PR24 deliver improved performance and resilience of the sludge supply chain to agriculture
- preparing to review permits that allow tankered industrial effluents to be discharged into wastewater treatment works and developing a set of standard rules for this activity
10.2 Enforcement and sanctions
Between January 2015 and September 2026 there have been 73 prosecutions of the 9 water and sewerage companies (some involving multiple cases) securing fines of over £172 million (Table 9).
In 2025, for the 9 water and sewerage companies:
- we completed 2 prosecutions, both against Yorkshire Water, which led to total fines of £1,215,000 – both of the prosecutions resulted from pollution incidents
- we accepted 19 enforcement undertaking offers from 6 different water and sewerage companies totalling £6,950,424 and ranging from £50,000 to £777,424
Table 9. Enforcement and sanctions for the 9 water and sewerage companies 2015 to 30 September 2026
| Year | Number of prosecutions | Value of prosecution fines | Number of enforcement undertakings | Value of enforcement undertakings |
|---|---|---|---|---|
| 2015 | 9 | £2,494,500 | 0 | £0 |
| 2016 | 10 | £6,560,000 | 4 | £595,000 |
| 2017 | 9 | £21,589,334 | 15 | £1,435,900 |
| 2018 | 3 | £427,000 | 15 | £3,436,650 |
| 2019 | 5 | £3,097,000 | 11 | £2,429,760 |
| 2020 | 3 | £852,000 | 14 | £2,465,901 |
| 2021 | 7 | £102,490,000 | 9 | £1,703,272 |
| 2022 | 9 | £4,198,750 | 3 | £500,000 |
| 2023 | 4 | £6,794,000 | 5 | £1,762,500 |
| 2024 | 6 | £3,527,000 | 10 | £4,193,780 |
| 2025 | 2 | £1,215,000 | 19 | £6,950,424 |
| 2026 (to 30 September) | 6 | £19,104,816 | 10 | £5,175,000 |
Table 9 note: cases against a water company sentenced in court on the same day count as one prosecution. If a prosecution has an appeal hearing it is recorded here according to the date of the final hearing not the original prosecution.
There are 4 outcomes that we seek to achieve through enforcement. These are to:
- stop illegal activity from occurring
- put right environmental harm or damage
- bring illegal activities under regulatory control
- punish and deter future offending
Prosecution continues to be an important response where it is in the public interest, as a proportionate and outcome focused enforcement option to protect the environment. Prosecution is rightly reserved for those pollution incidents and permit or licence breaches where there is serious, actual or potential environmental harm and a high level of culpability. Fines continue to reflect the size of the organisation concerned as well as the offence category. Sentencing is a matter for the courts who fine on a case-by-case basis, and for this reason fines vary significantly.
An enforcement undertaking is a voluntary agreement offered by those who have committed a less serious offence that becomes legally binding once accepted. It funds local environmental improvements but also requires that steps are taken by the water company to put right what went wrong and to prevent it happening again.
A variable monetary penalty (VMP) is a proportionate monetary penalty we may impose on a company that commits certain environmental offences. VMPs were not available for EPR offences until December 2023, when a legislative amendment came into force. In addition, an amendment was also made to the Environmental Civil Sanctions (England) Order 2010. This removed the £250,000 cap per VMP, allowing us to impose penalties of any amount. We expect these changes to result in an increase in our use of VMPs and the size of those penalties. In 2025, we imposed a VMP on Southern Water for £1 million in response to a pollution offence. This penalty is subject to appeal to the First-tier Tribunal. We expect the outcome of that appeal shortly.
Before taking enforcement action, we must investigate to gather evidence, consider the facts and establish matters relevant to public interest and sentencing. This takes time and our enforcement activity can conclude some months or years after the original offence occurred, particularly court cases. We are continuing with our major investigation of all the water companies into potential wastewater treatment works flow-to-full treatment (FFT) non-compliance.
10.3 Water (Special Measures) Act 2025
The Water (Special Measures) Act 2025 (WSMA) brings in a package of measures to give us stronger powers to hold water companies to account. Some measures are already in place and further provisions will follow.
Tougher penalties for obstructing investigations
The WSMA strengthens our powers to take tougher action where investigations are obstructed. It broadens existing obstruction offences to include corporate liability and increases the penalties for water industry-related obstruction. Offences are now punishable by imprisonment of up to 2 years and unlimited fines. This helps close accountability gaps and strengthens deterrence across the water industry.
Cost recovery for enforcement activities
We now have the power to recover the cost of our enforcement work from water companies. This ensures we have the resource and capability to take enforcement action, delivering an effective deterrent and strengthening the overall regulatory system.
Penalties at the civil standard of proof
The WSMA will strengthen our enforcement powers by introducing financial penalties that can be imposed using the civil standard of proof. When these new penalties come into force next year, they will close a long-standing enforcement gap. They will make it quicker, more proportionate and cost-effective to hold water companies to account for lower-impact offences.
Automatic penalties
The WSMA also creates a new statutory duty for us to impose automatic penalties. This is where fixed penalties must be imposed in certain circumstances, using the civil standard of proof. Once in force, this will ensure proportionate, consistent and efficient consequences for minor to moderate offences.
Monitoring of every emergency sewage overflow
The WSMA will require water companies to accelerate their installation of EDMs on every emergency sewage overflow and publish near real-time discharge data. Once in place, this will give us full oversight of emergency overflows for the first time and close a major transparency gap in the water industry.
Pollution incident reduction plans (PIRPs)
Since 2020, at our request, the water and sewerage companies have provided us with PIRPs. These contain information on their actions to reduce the number of pollution incidents they cause.
The WSMA introduced a new statutory requirement for all water companies in England and Wales to publish PIRPs (starting April 2026) with an accompanying implementation report (starting April 2027) to demonstrate progress. Therefore, it is now a legal requirement to publish PIRPs on an annual basis. In doing so, companies must have regard to the statutory guidance we published in January 2026. We expect this to increase the quality and consistency of PIRPs content.
In April 2026, all water and sewerage companies published a statutory PIRP. We are currently reviewing each PIRP against the legislative requirements and our guidance.
Bonus Ban
We continue to work closely with Ofwat to align financial penalty and reward with environmental performance. Earlier this year, we shared our category 1 incident data for them to implement the rule prohibiting water company executives’ performance related pay for the second year.
10.4 Planning and investment
Price review and WINEP for water and sewerage companies
Water companies must take ownership of their performance and invest in improving their asset health, performance and resilience. They have been funded to do so through the price review process where Ofwat sets controls that limit what companies can charge their customers in each 5 year period. Water and sewerage companies operating in England have a record £91.95 billion to spend between 2025 and 2030, of which £50.45 billion is for wastewater. This includes maintenance of assets. We expect the companies to meet their performance commitments to deliver lasting benefits for people and the environment. These investment values reflect changes following the Competition and Markets Authority’s final redeterminations and subsequent amendments for updated accounting information.
As part of that price review, we have secured the biggest ever programme of environmental improvements from water and sewerage companies. The WINEP translates our expectations into over 24,000 actions that water and sewerage companies must complete between now and 2030. This investment of £21.59 billion will not only improve the environment but will help stimulate development and support the government’s objective of boosting economic growth. This has been developed in collaboration with Ofwat, Natural England and water companies. The WINEP includes a significant programme of work to meet the requirements of the government’s storm overflows discharge reduction plan. This has a goal to reduce harm to public health and the environment by 2050.
We are already looking ahead to the next price review (PR29), ensuring future investment is even more targeted, evidence-led and focused on delivering the greatest environmental benefit.
Drainage and wastewater management plans (DWMPs)
DWMPs are statutory water industry plans. They are vital to set out actions to extend, improve and maintain a robust and resilient drainage and wastewater system that faces pressures from climate change, urban development and a growing population.
Environmental and pollution incidents may not always be under the direct control of a water company, for example those linked to the effects of climate change such as severe storms. However, water companies must strive to protect their assets and look to work with others to do this. DWMPs identify short, medium and long-term investment needs for wastewater and drainage. They ensure water companies:
- prepare for climate change and deliver catchment resilience and capacity, ahead of need
- proactively maintain and improve asset health and performance
- manage surface water at source, working collaboratively with others
DWMPs support economic growth. They provide the evidence base for all water companies drainage and wastewater investment needs over the next 25 years. This includes investment needed to reduce both total and serious pollution incidents. Plans are due to be published in draft by November 2027, for a 12 week public consultation, and final plans by August 2028, ahead of the price review (PR29). We expect companies to be transparent on the scale and pace of investment need, particularly associated with the challenges associated with aging infrastructure.
For more information see government guidelines for statutory Drainage and Wastewater Management Plans (DWMPs).
11. Conclusions
The 2025 EPA results mark the final year in the current EPA period. Following a decline in EPA star ratings in 2024, ratings deteriorated further in 2025 with the water and sewerage sector achieving just 16 EPA stars out of a possible 36. As in previous years, the results were primarily driven by the poor performance on pollution incidents by almost all companies.
Although most companies are proactively reporting more incidents, greater focus is needed on implementing measures through their PIRPs to reduce their occurrence. We are also concerned about the significant deterioration in sector discharge permit compliance and WINEP delivery, and improvement is needed across the sector. Only 2 companies met our targets for discharge permit compliance and only 5 companies for WINEP delivery. Poor treatment of wastewater and delays in planned improvements can have lasting impacts on the water environment and our communities.
The EPA continues to provide a consistent and transparent measure of water and sewerage company performance against several specific environmental obligations that we regulate. By publishing annual EPA results alongside wider aspects of performance, we continue to hold companies to account and provide the public, government and other stakeholders with a clear picture of performance.
Our recent regulatory interventions and evidence-based approach have played an important role in supporting government plans to reform the water sector. We have developed our regulation to make use of advances in data and monitoring. This has increased our sector intelligence and enabled greater scrutiny, transparency and accountability across the water and sewerage company sector. By shining a light on performance, we provide the insights needed to strengthen accountability from water companies and focus them on improvements.
Our regulatory developments alone will not bring environmental outcomes. Companies must take ownership with effective operational management and investment.
Sustained improvement will depend on water and sewerage companies taking a long-term approach to asset management, investment and maintenance. Well maintained, resilient assets are essential to reducing pollution incidents, improving permit compliance and delivering environmental improvement schemes on time. They must use the funding available to them to maintain, renew and upgrade their networks, so that better performance is delivered consistently for people and the environment.
As the water and sewerage sector enters the next EPA reporting period, we will implement our updated EPA methodology for 2026 to 2030. This has new metrics providing a more holistic picture and new targets reflecting our environmental expectations. The sector must deliver measurable improvements that benefit both the environment and the public.