Student-level equalities analysis for GCSE, A level and VTQ - 2022
Updated 7 December 2022
Applies to England

© Crown copyright 2022
This publication is licensed under the terms of the Open Government Licence v3.0 except where otherwise stated. To view this licence, visit nationalarchives.gov.uk/doc/open-government-licence/version/3 or write to the Information Policy Team, The National Archives, Kew, London TW9 4DU, or email: psi@nationalarchives.gov.uk.
Where we have identified any third party copyright information you will need to obtain permission from the copyright holders concerned.
This publication is available at https://www.gov.uk/government/publications/student-level-equalities-analyses-for-gcse-a-level-and-vtqs-2022/student-level-equalities-analysis-for-gcse-a-level-and-vtq-2022
Authors
- Ming Wei Lee
- Dovile Rama
- Kate Johnson
Executive summary
This report presents an analysis of how differences in results between groups of students with different protected characteristics and socioeconomic status have changed in 2022 in relation to previous years, for GCSEs and A levels (referred to here as general qualifications (GQ)) and vocational and technical qualifications (VTQ). Ofqual previously published separate equalities analyses for GQ and VTQ in 2020 and 2021 (see: GQ 2020, VTQ 2020; GQ 2021; VTQ 2021).
The methodology used in this analysis allows us to identify and quantify the changes that have occurred. Causes cannot, however, be attributed to any of these changes. There are likely to be many possible causal factors, some unrelated to the pandemic. Analysis from 2018 and 2019 shows that differences in results existed in pre-pandemic times and can vary from year to year. Many of the findings reported here are likely to reflect normal fluctuations in outcomes from one year to the next.
As in previous analyses, we used a multivariate analytical approach. This allows us to explore the impact on overall results of each feature separately (for example, gender, or ethnicity) while controlling for other features. This is important because we know that there are relationships between different features (for example, ethnicity and gender).
We used regression modelling to estimate differences in results for subgroups of students after controlling for other variables. The variables analysed were:
- ethnicity
- gender
- special educational needs and disabilities (SEND) status
- free school meal (FSM) eligibility (a measure of deprivation)
- Income Deprivation Affecting Children Index (IDACI) score
- prior attainment
- first language (GQ only)
- region (GQ only)
- centre type (GQ only) according to JCQ categories
For each of the above variables, the largest group is used as a comparator, and all other groups are compared to that. For example, for ethnicity, we use White British as the comparator as it is the largest group. We compare students in other ethnic groups with White British students of the same gender, SEND status, FSM eligibility, IDACI score, prior attainment, first language, region and centre type. We estimate the results of the ‘average’ student, that is, a student who falls into the comparator group for every variable, and can then examine the impacts of each of the other groups separately.
In this analysis, results for 2022 are presented alongside those for the period 2018 to 2021. This report focuses on two comparisons. We compare results in 2022, when there were exams, with results in 2021, when grades were determined by teachers for GQs and many VTQs. We also compare results in 2022 with results in 2019, the last year when exams and other assessments were sat.
We used a set of criteria to identify changes we considered to be ‘notable’, taking into account normal fluctuations between years. These changes are set out in this report.
Analysis of results for 2018 to 2021 is given in the full report and accompanying data tables. Given the exceptional circumstances under which grades were awarded in 2020 and 2021, and the package of support in place for 2022, any comparison should be treated carefully.
For GCSEs and A levels we analysed 3 outcome measures:
- grade achieved,
- the probability of attaining grade 7 and above for GCSE, or grade A and above for A level,
- the probability of attaining grade 4 and above for GCSE, or grade C and above for A level.
Of the many comparisons between groups of students presented in our modelling, the majority showed no notable change in 2022, with respect to 2019 and 2021.
For A level in 2022, the modelling showed that the grade for an average student was a high grade C (3.85 on a numeric scale of 0 to 6, where 0 was ungraded and 6 was A*). The probability of an average student attaining grade A and above was 28.8%, and the probability of them attaining grade C and above was 87.7%. The average student’s grade and probabilities of attaining grade C and grade A in 2022 were higher than in 2019 and lower than in 2021. This is to be expected, given the results pattern in 2021 and the approach to grading for 2022.
Some groups showed notable changes on all 3 of the above outcome measures. when controlling for other variables. We found the following notable changes on all 3 outcome measures:
- In 2022, male students had higher outcomes than female students. The difference of 0.02 of a grade reversed the difference in 2021 when male students had lower outcomes than female students.
- Black African students had lower outcomes than White British students. The difference of 0.01 of a grade was 0.11 grade narrower than in 2021.
- Students in further education colleges had lower outcomes relative to students in academies. The difference of 0.53 of a grade was 0.38 of a grade wider than in 2019, and 0.32 of a grade wider than in 2021.
- Students in sixth form colleges and tertiary colleges had lower outcomes relative to students in academies. The differences of 0.13 and 0.16 of a grade reversed the differences seen in 2019 when sixth form and tertiary college students had higher average grades than academy students.
- Students in ‘other’ centres (including institutions such as tutorial colleges, language schools, special schools, pupil referral units and training centres), had lower outcomes relative to students in academies. The difference of 0.26 of a grade reversed the difference seen in 2021 when students in other centres had higher outcomes than academy students.
- Students in secondary selective schools had higher outcomes relative to students in academies. The difference of 0.22 of a grade reversed the difference seen in 2021 when outcomes were lower for students in secondary selective schools compared to academy students.
For GCSE in 2022, the modelling showed that the grade for an average student was a grade 5 (5.32 on a scale of 0 to 9, using the numeric grades). The probability of an average student attaining grade 7 and above was 22.7%, and the probability of them attaining grade 4 and above was 86.7%. The average student’s grade and probabilities of attaining grade 4 and grade 7 were higher than in 2019 and lower than in 2021. Some groups showed notable changes on all 3 outcome measures relative to demographics-matched students in the comparator groups.
- Students eligible for FSM had lower outcomes, relative to students not eligible for FSM. The difference of 0.49 of a grade was 0.10 of a grade wider than in 2019, but was at a similar level to 2021. There is, however, some instability in the FSM measure[1] across the period investigated, so any comparisons across years should be treated with caution.
- White Gypsy and Roma students continue to have lower outcomes relative to White British students, but the difference of 1 grade was 0.21 of a grade narrower than in 2021.
- Students in independent schools continue to have higher outcomes relative to students in academies, but the difference of 1.41 grade was 0.34 of a grade narrower than in 2019.
- Students in further education colleges and ‘other’ centres had lower outcomes relative to students in academies. The differences of 1.12 and 1.03 grades were 0.21 and 0.31 of a grade wider than in 2021 respectively.
- Students in secondary selective schools had higher outcomes relative to students in academies. The difference of 0.84 of a grade was 0.13 of a grade wider than in 2021.
For vocational and technical qualifications (VTQs) analyses, we focused on national qualifications used alongside GCSEs and A levels in schools and colleges and included in the Department for Education’s (DfE’s) 2021 performance tables. Unlike GCSEs and A levels, these VTQs have different structures and grade scales. The analysis, therefore, looks at the probability of achieving the top grade, that is the highest grade that can be achieved in each qualification.
In the majority of cases, no notable changes over time in the relative probabilities of achieving top grades between different groups of learners were observed.
For Level 1/2 Technical Awards and Technical Certificates the modelling showed that the probability of an average student attaining the top grade was 4.5% and 4.3% respectively in 2022. This is higher than in 2019 and lower than in 2021.
There were no notable changes for Level 1/2 Technical Awards. For Level 1/2 Technical Certificates, there were notable changes relating to some groups with different ethnic backgrounds. However, the number of students is relatively small and so these findings should be treated with caution.
For Level 3 VTQs the modelling showed that the probability of an average student attaining the top grade in Applied Generals and Tech Level qualifications was 10% and 14.5% respectively in 2022. This is higher than in 2019 and lower than in 2021.
For Tech Level qualifications, there were notable changes relating to some groups with different ethnic backgrounds. However, as for Level 1/2 VTQs, the number of students is relatively small and so these findings should be treated with caution.
For Applied Generals notable changes were seen only with respect to prior attainment. Students with very high prior attainment are more likely to achieve the top grades than students with medium prior attainment. In 2022, however, this gap increased by 7 percentage points and students with high prior attainment were 23% more likely to achieve top grades than in 2019.
We had found in 2021 that male students were less likely to obtain top grades for Level 3 Applied Generals than female students. The difference was lower, with male students around 2% less likely to achieve top grades in 2018 and 2019. The difference increased in 2020 and 2021 when male students were around 6% less likely to achieve top grades. In 2022, male students were still less likely to obtain top grades than female students, but this difference had decreased to 4%. This change was not sufficiently large to flag as a notable finding, but we mention it here for context given the findings in 2021.
Introduction
Background
Summer 2022 saw the return of examinations and assessments following disruption due to the coronavirus (COVID-19) pandemic in 2020 and 2021. To recognise the disruption students had experienced over the course of the past 2 years, adaptations were put in place for GCSEs and A levels (referred to here as general qualifications (GQ)) and vocational and technical qualifications (VTQ). Further information on the package of support for students and adaptations to assessment put in place in 2022 can be found in the student guide to exams and assessments.
In 2020 and 2021, both for GQ and VTQ (see: GQ 2020, VTQ 2020; GQ 2021; VTQ 2021), Ofqual analysed how results gaps in relation to protected characteristics and socioeconomic status compared to results gaps that were present when students took exams before the pandemic. This equalities analysis has been repeated for 2022. In this report we present the results of the analysis for the period 2018 to 2022, focusing comparisons on outcomes across different groups in 2022, comparing both to 2019, when exams and assessments were last sat, and 2021, when summer exams were cancelled and there was a different method of assessment.
In 2020 and 2021, arrangements for awarding were different due to the impacts of the COVID-19 pandemic. Grades for GQ were based primarily on Centre Assessment Grades (CAGs) in 2020 and Teacher Assessed Grades (TAGs) in 2021. For VTQ, many assessments were adapted, delayed, or replaced by CAGs in summer 2020 or TAGs in summer 2021. For more information on how grades were awarded in these years, see Ofqual’s publications relating to the awarding of vocational, technical and other general qualifications in 2020 and 2021, Ofqual’s 2021 student guide to awarding covering both GQ and VTQ, and Ofqual’s guidance on awarding for GCSE, AS and A level in 2020. For this reason, comparisons of 2022 results with previous years should be treated carefully.
It should be noted that differences in attainment between groups of students can have multiple and complex causes, and it is not possible to disentangle causal factors from the impacts of different awarding arrangements due to the pandemic. Therefore, while we aim to report differences in attainment associated with the variables modelled where they appear to exist, we do not speculate on the underlying causes of any differences in attainment. A degree of change is expected in any given year, and some of the findings reported here are likely to reflect normal fluctuations in outcomes from one year to the next.
This analysis focuses on GCSEs and A levels and vocational and technical qualifications (VTQs) included in the Department for Education’s performance tables, specifically Level 1/2 Technical Awards and Technical Certificates, and Level 3 Applied Generals and Technical Level qualifications. The scope of VTQ qualifications included in this analysis is slightly different to the analysis published in 2021 due to changes to the data collection. For this reason and due to improvements to methodology, the current report should be seen as the most up to date source of information for both GQ and VTQ.
Analytical approach
The outcomes presented in the report are the result of multivariate modelling. The reason modelling of this type is used, rather than presenting simple descriptive breakdowns between different characteristics, is that multivariate analyses allow the effect of a variable to be considered while controlling for the impacts of other variables. For example, we can compare the effect of being female vs being male on outcomes, while holding prior attainment and ethnicity constant. If there are no differences in female vs male effects, we can conclude that differential performance in female students compared to male students was associated with other factors – such as a higher level of ability and/or ethnicity – and not their gender.
Analysis of the differences between groups of students in 2018 and 2019 tells us that such differences in exam outcomes existed in pre-pandemic times and can vary from year to year even in normal times. By comparing changes in these differences between 2022 and 2019 and between 2022 and 2021, against changes between 2019 and 2018, we identified the ‘notable’ changes between 2022 and 2019 and those between 2022 and 2021. We used a series of criteria (see Methodology sections) to identify changes that we considered to be practically significant while taking into consideration normal between-year fluctuations. In this paper, we use the word ‘notable’ to refer to between-group differences that met these criteria. The term ‘notable’ is not intended to convey any judgement of the importance of the change in question.
The data used in this analysis included data collected from awarding organisations by Ofqual as well as student-level background information from the DfE. Data was matched using students’ names, date of birth and gender.
A set of explanatory variables were included in the models. A full list of these explanatory variables, their possible values, sources, reference categories and any further details is given in Appendix A. For each variable, a reference category was chosen. This was usually the largest category (for example, White British is used for ethnicity as this group represents the largest proportion of cases) or the category that represents the middle of an ordered group (for example, medium is the reference category for prior attainment, the others being very low, low, high and very high). When comparisons are made in the results section below, each category is compared to the reference category, after controlling for other explanatory variables.
The variables included in the models, along with their reference categories in brackets, were:
- ethnicity (White British)
- gender (Female)
- special educational needs and disabilities status (No SEND)
- FSM eligibility as a measure of deprivation (not eligible)
- IDACI score (medium)
- prior attainment (medium)
- language status – included for GQ only (English)
- region – included for GQ only (south-east)
- centre type (the type of school or other educational setting in which the qualification was taken) – included for GQ only (Academies)
We included a measure of prior attainment in this analysis. For GCSE, Level 1, Level 1/2 and Level 2 vocational and technical qualifications, prior attainment was from Key Stage 2. For A level and Level 3 qualifications, GCSE prior attainment was used. Prior attainment is the stronger predictor of achievements in these qualifications and including it in the models gives a more accurate interpretation of the effect size of other variables. As the model quantifies the effect of each variable after controlling for prior attainment, among other variables, the effects relate to the differences that the variables would have made since candidates took their KS2 or GCSEs, rather than the differences that the variables may introduce across an entire school career.
A multilevel modelling approach was used to take account of clustering present in the data, for instance of students within schools and colleges. Clustering means that, for example, the students within a school or college might be more likely to have similar results to each other compared to other students from the population, because of factors that are common to that particular school or college such as teaching materials. Clustering within schools and colleges was accounted for in both the GQ and VTQ models. In addition, the GQ models took into account clustering within students (across multiple subjects) and within subject.
General qualifications
Methodology
Data
Data collected from awarding organisations on students’ grades, gender, prior attainment, centre type and region was matched to extracts from the National Pupil Database (NPD) containing FSM status, SEND status, language, ethnicity and IDACI score from the year of awarding. Students who could not be uniquely matched or who could be uniquely matched but who had no relevant information in the NPD were marked as missing data on the relevant variable. Missing data rates are given in Appendix B. Data on prior attainment and the background variables are missing to varying degrees and not at random.
Tables B1.1 and B1.2 (in Appendix B.1) show the extent of missing data for each background variable used in our analysis. There was no missing data on the region and centre type variables and nearly none on gender, but data on prior attainment and other background variables were missing to varying degrees. Also, data was missing not at random, as the extent of missing data varied by centre type: Tables B1.3 and B1.4 show the percentage of each centre type’s entries that had unknown information on the prior attainment, SEND and deprivation variables, and Tables B1.5 and B1.6 give a breakdown by centre type of the entries with unknown information on the 3 variables.
Missing data on the background variables is most likely the result of schools and colleges not returning the DfE School census. Missing data on KS2 prior attainment most likely reflects the fact that some students did not sit the KS2 tests for a variety of reasons, including being absent from school at the time of the tests, attending independent schools at KS2, or attending school outside of England at the time of the tests. Missing data on GCSE prior attainment has a similar cause: some students did not take GCSEs at 16. As with any analysis involving the merging of datasets, missing data can also be caused by data matching problems.
Missing data can be problematic, particularly where it is systematic rather than random. It raises questions about whether the findings from the modelling about the known categories apply to the whole student population, whether those findings would still hold if the unknown information were known, and whether the unknown categories could effectively be treated as proxies for some centre type(s) due to some centre types having much higher proportions of missing data. Nonetheless, the comparisons of interest here concern not so much the between-group differences within each year, but rather any changes in between-group differences in 2022 compared with previous years. As is evident from Tables B1.1, B1.2, B1.3, B1.4, B1.5 and B1.6, the missing data rates and patterns are comparable across the 5 years, so we can reasonably assume the subgroups are comparable in terms of ‘missingness’, although we note some factors driving instability in the FSM eligibility measure below as well as some changes in outcomes in across some groups with missing data. That is to say, while we might interpret the estimates of the differences between groups within each year cautiously, any change to those differences between years can be interpreted as a change in relative outcomes for different subgroups.
Where data was missing, we included the categories in the model as ’unknown’ groups. We did observe some notable differences (see notable difference methodology below) between some of these ‘unknown’ groups and the reference groups, which could indicate some degree of systematic change underlying the missing groups. The outcomes for the unknown categories are included in the charts and tables in the results sections and appendices. We observed some notable changes between 2022 and either 2019 or 2021 on at least one outcome measure for the unknown categories for prior attainment for GCSE and A level, for ethnicity at GCSE, for IDACI at GCSE and A level, and for major language at GCSE and A level. We also observed notable differences in the unknown category for FSM at both GCSE and A level.
In terms of data limitations, it is also worth noting that the proportion of students eligible for FSM increased between 2018 and 2022, due to an arrangement related to the roll-out of Universal Credit and, since 2020, the economic impact of the Covid-19 pandemic (Julius and Ghosh, 2022). This increase was also reflected in the GCSE equalities dataset, with the proportion of entries by FSM-eligible students increasing year on year in 2018 to 2022. The subgroups under the FSM status variable were therefore less stable across the years than other variables included in the analysis.
To ensure like-for-like comparisons, we built an equalities dataset from the matched data for each qualification level consisting of data for:
- students who by 31 August of the respective year were at the target age of the qualification level of their entries (16 for GCSE, 18 for A level)
- subjects examined under the same specifications in 2018 to 2022 (this meant in effect only reform phase 1 and phase 2 subjects/specifications that were first assessed in 2017 and 2018 and therefore had five years’ data, were included)
- schools and colleges whose self-declared centre type designation stayed the same throughout 2018 to 2022
- on a subject-by-subject basis, schools/colleges that had entries in the subject in each of the years 2018 to 2022
These inclusion criteria ensured that our analyses were carried out on as stable successive cohorts as possible. This was necessary for a meaningful equalities analysis as it minimises between-year changes in group differences being caused by between-year cohort changes.
Tables 1 and 2 show the number of entries by target-age candidates, centres and subjects in the resultant dataset for A level and GCSE, respectively. Values have been rounded to the nearest 5.
Table 1. Number of entries, centres and subjects in A level dataset
| Year | Entries | Centres | Subjects |
|---|---|---|---|
| 2018 | 410,395 | 2,300 | 30 |
| 2019 | 427,910 | 2,300 | 30 |
| 2020 | 426,435 | 2,300 | 30 |
| 2021 | 452,795 | 2,300 | 30 |
| 2022 | 472,275 | 2,300 | 30 |
Table 2. Number of entries, centres and subjects in GCSE dataset
| Year | Entries | Centres | Subjects |
|---|---|---|---|
| 2018 | 3,450,425 | 4,340 | 29 |
| 2019 | 3,557,575 | 4,340 | 29 |
| 2020 | 3,653,005 | 4,340 | 29 |
| 2021 | 3,736,150 | 4,340 | 29 |
| 2022 | 3,734,615 | 4,340 | 29 |
Modelling overview
We carried out linear mixed-effects modelling on 3 performance measures:
- mean numeric grade (for A level, grades A* to E were converted to 6 to 1 respectively and U treated as 0 while for GCSE, grades on 9 to 1 scale were numeric and U was treated as 0)
- probability of attaining A level grade A and above / GCSE grade 7 and above
- probability of attaining A level grade C and above / GCSE grade 4 and above
Each analysis took exam entry as the unit of analysis and aimed to model the relationship, in a particular year, between:
- an entry’s numeric grade or
- probability of attaining the key grades listed above or higher
The analysis also controlled for background information about the student that the entry belonged to. The full model specification can be found in Appendix D, along with a full list of model variables and their definitions in Appendix A. Interactions were not included in the models.
Using this modelling we can estimate the result for an ‘average’ entry, that is, an entry by a student who was in the reference category of every one of the background variables. In numeric grade analyses, we estimate the grade an average entry would receive. In grade probability analyses, we estimate the probability that an average entry would be awarded the key grade in question.
We can also estimate the size of the difference in outcome between a particular group and the reference group after controlling for effects of other background variables. For example, in the analysis on the probability of attaining grade A and above in A level in 2018, on the gender variable, an estimate of 0.0339 for male suggests that after controlling for other background variables, in 2018 male students were, on average, 3.39 percentage points more likely to achieve a grade A or above than female students (the reference category of the gender variable). Variation of these group estimates from the models covering each of the 5 years tells us how that group’s results relative to the relevant reference groups have changed across the 5 years.
There is some degree of uncertainty present in any estimation arising from modelling, so to aid interpretation, 95% confidence intervals are presented in bar graphs below. For further information of how the confidence intervals were generated, see Appendix D.3.
Detailed output of all models reported in this paper can be found in Appendix E.
To appreciate what is meant by a change between 2 years of 0.1 grade in relative outcome difference, we can consider a theoretical scenario comparing left- and right-handed students. If we had 2 groups of 100 students. Students in one group are left-handed and students in the other group are right-handed. The 2 groups are otherwise perfectly matched in background, and all take one A level subject in one year.
If in one year, all 100 right-handed students receive grade B, and in the left-handed group, 50 receive grade A and 50 receive grade B, the overall difference between the groups is half a grade (0.5 grade). If the following year, the right-handed students all receive grade B, but in the left-handed group, 60 get grade B and 40 get grade A, the overall difference between the groups is slightly less than half a grade (0.4 grade) and the change between the years is 0.1 grade. There are, however, many different ways to get the same size of overall change. In the example above, a change of 0.1 grade between the years would also occur if, in the left-handed group in the second year, 5 students got an A*, 50 got an A and 45 got a B.
Notable change criteria
We used a multi-step method for evaluating changes in relative outcome differences between key years of comparison, with the aim of identifying practically significant changes while taking into consideration normal between-year fluctuations. We used this method to evaluate changes in relative outcome differences between 2019 and 2022, and then repeated the process to evaluate changes between 2021 and 2022. This is described below.
Step 1: identify subgroups whose relative outcome differences were not significantly different from zero (at 5% level of significance) in any year and exclude them from further consideration. This step identifies the subgroups that showed no difference in any year relative to the reference group and those whose estimates consistently had large standard errors and confidence intervals, suggesting the groups were too small in size and/or had much variability within the subgroup, making it hard for their relative outcome difference to be estimated reasonably precisely.
Step 2: from the subgroups not excluded in Step 1, identify those whose 2019 to 2022 change in relative outcome difference in absolute value was larger than their 2018 to 2019 change in absolute value. This step considers how the relative outcome differences can change between 2 normal years, namely, 2018 and 2019, and identifies between-year changes that exceed normal between-year changes in magnitude.
Step 3: from the subgroups identified in Step 2, flag as ‘notable’ the subgroups whose 2019 to 2022 change exceeded an effect size criterion, which we set at 0.1 grade for the numeric grade measure and 1 percentage point for the grade probability measures.
Results
A level - numeric grade
Figures AA.1-9 show the findings for A levels on the numeric grade measure. Each figure refers to one background variable included in our analysis.
For each figure:
- the top chart displays the raw breakdowns of results for the period 2018 to 2022. Because results of the very small Unknown/Neither gender group are suppressed out of concern for disclosure, there are no bars for the group on the charts for gender.
- the bottom chart presents the results of the modelling, showing the relative outcome differences of the subgroups defined under each variable relative to their respective reference group, after controlling for other variables. In these charts, there are no bars for the reference groups because that is the group that we are comparing to.
The relative outcome differences shown in the charts, as well as keys for acronyms, are given in table AA below, with further details in Appendices C and E.
Figure AA.1 2018 to 2022 A level results (numeric grade) by gender and outcome difference after controlling for other background variables
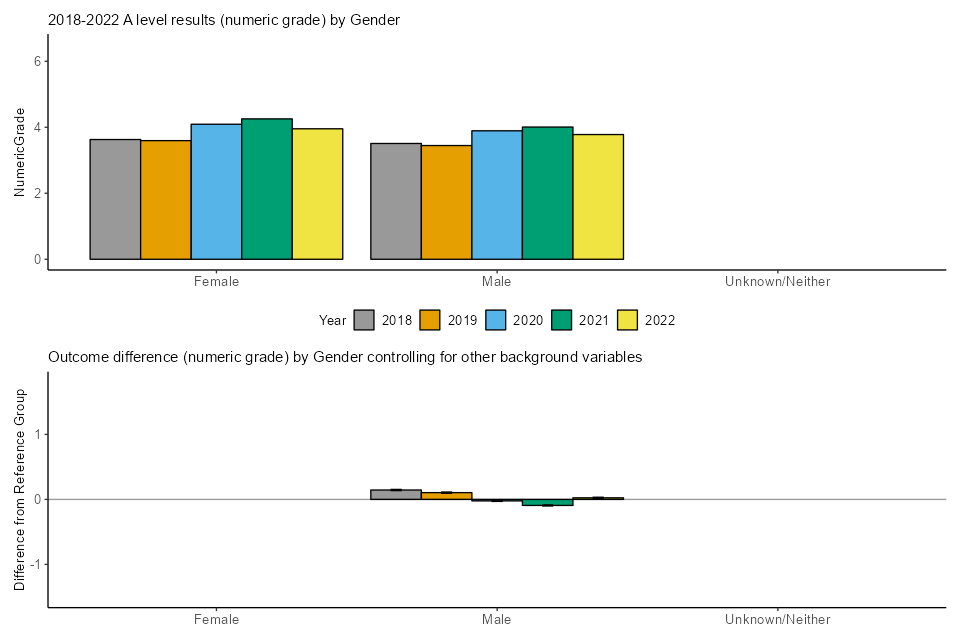
Figure AA.2 2018 to 2022 A level results (numeric grade) by ethnicity and outcome difference after controlling for other background variables
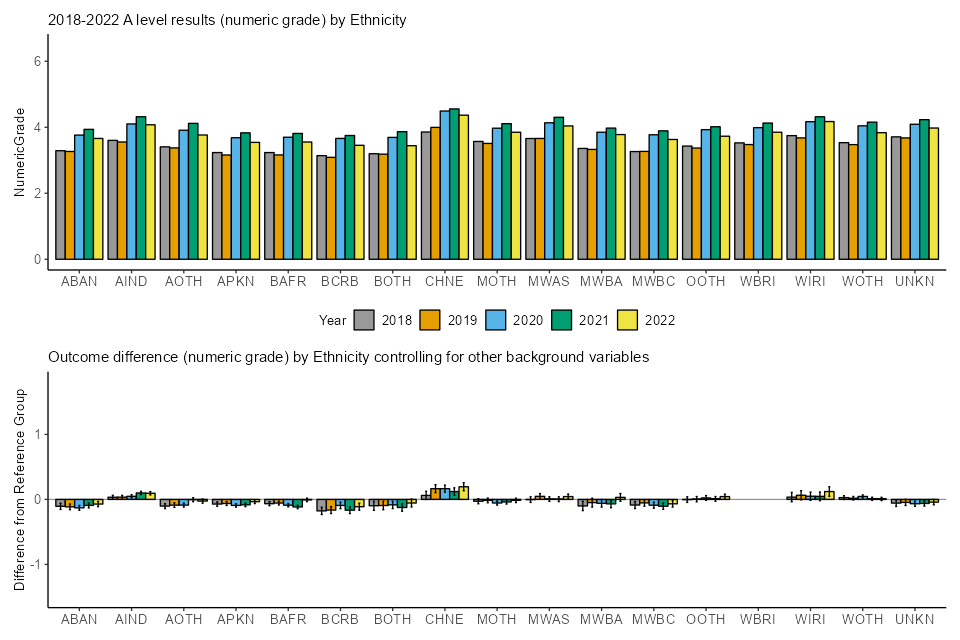
Figure AA.3 2018 to 2022 A level results (numeric grade) by major language and outcome difference after controlling for other background variables
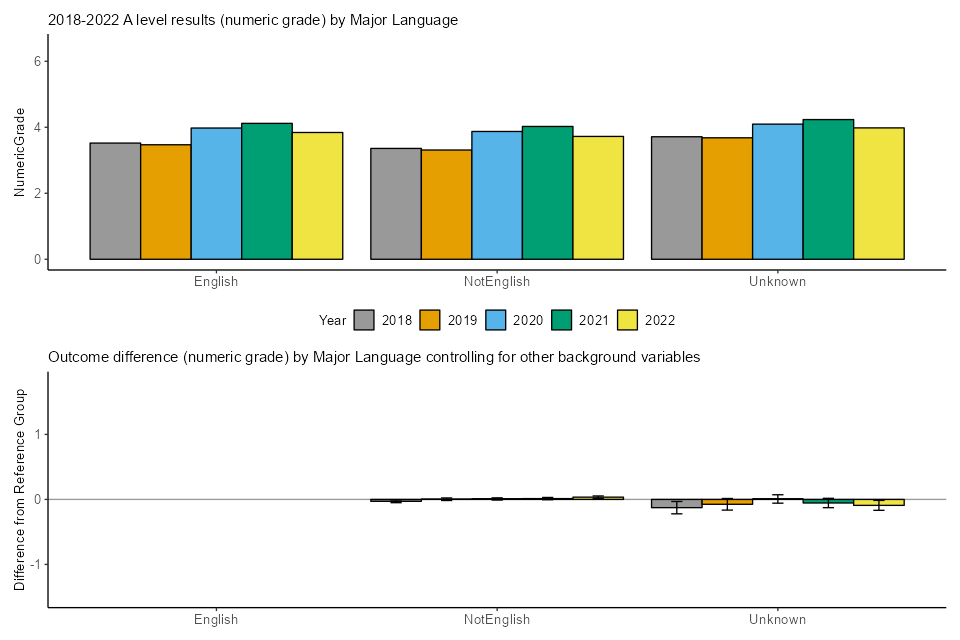
Figure AA.4 2018 to 2022 A level results (numeric grade) by SEND status and outcome difference after controlling for other background variables
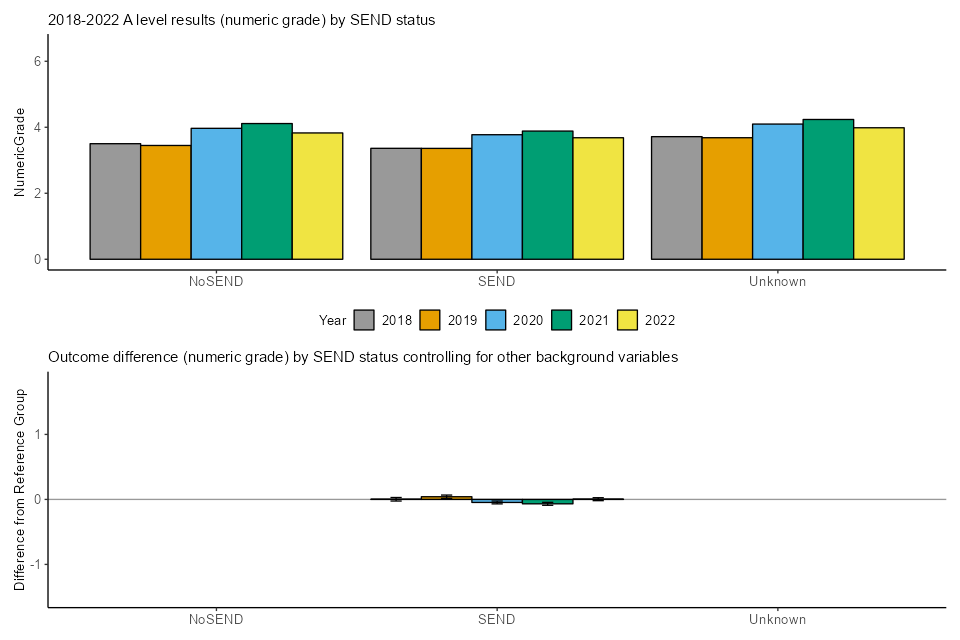
Figure AA.5 2018 to 2022 A level results (numeric grade) by FSM eligibility status and outcome difference after controlling for other background variables

Figure AA.6 2018 to 2022 A level results (numeric grade) by deprivation and outcome difference after controlling for other background variables
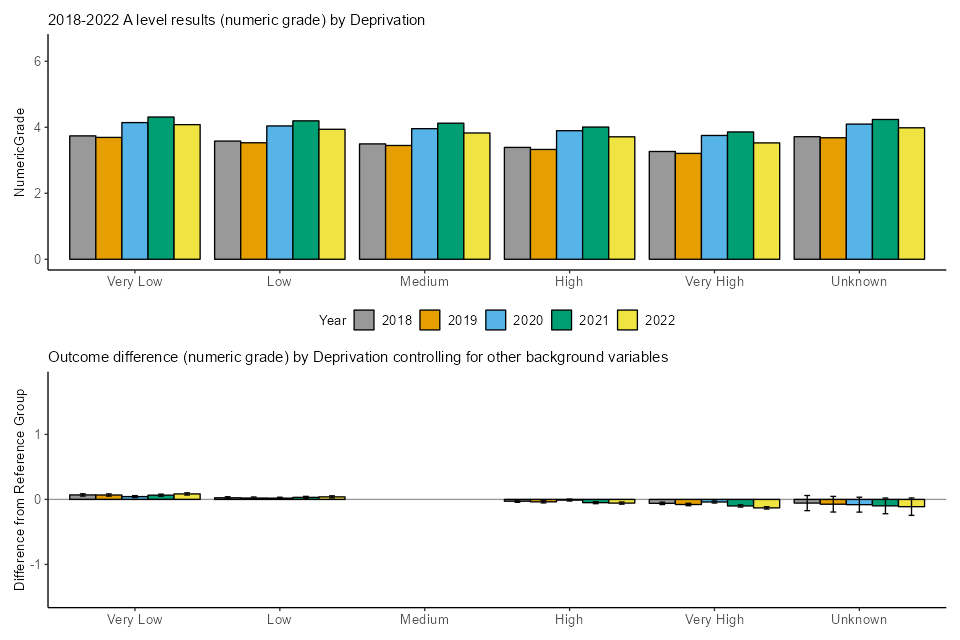
Figure AA.7 2018 to 2022 A level results (numeric grade) by prior attainment and outcome difference after controlling for other background variables
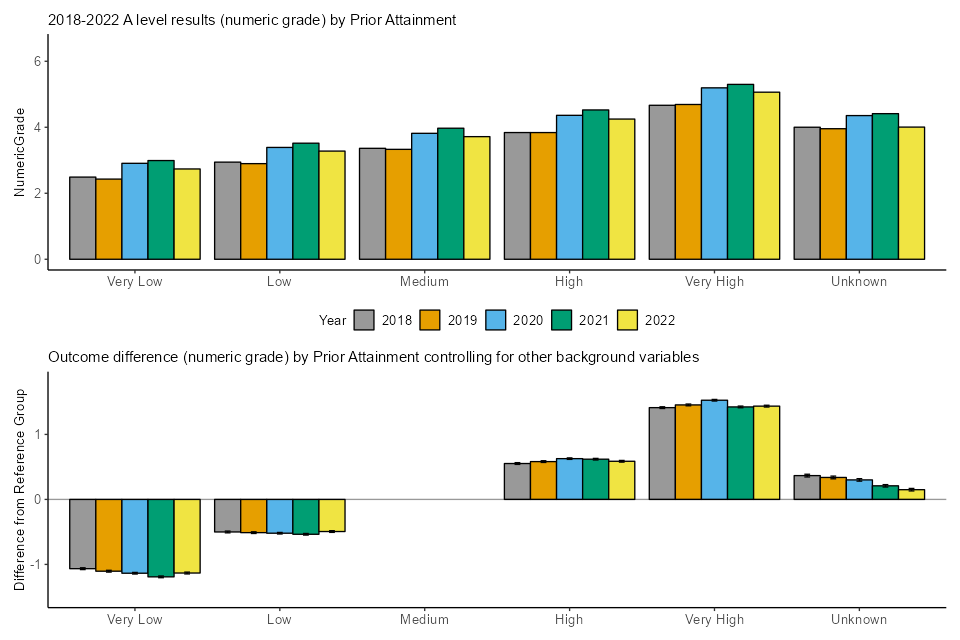
Figure AA.8 2018 to 2022 A level results (numeric grade) by region and outcome difference after controlling for other background variables
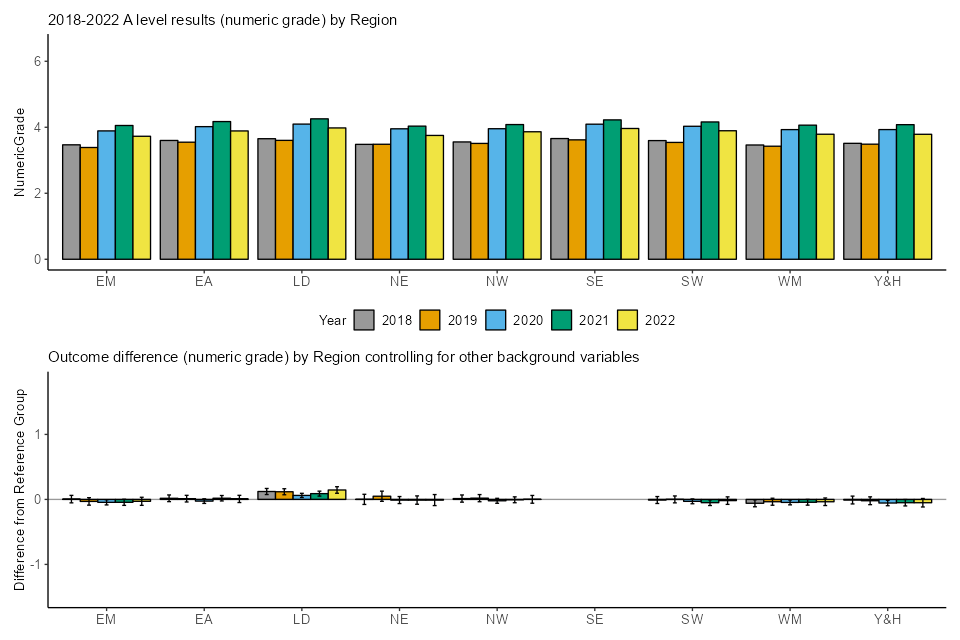
Figure AA.9 2018 to 2022 A level results (numeric grade) by centre type and outcome difference after controlling for other background variables

Table AA. Summary of 2018 to 2022 relative A level outcome differences (in numeric grade) after controlling for background variables
| Comparison | 2018 | 2019 | 2020 | 2021 | 2022 |
|---|---|---|---|---|---|
| Reference entry | 3.43 | 3.44 | 4.10 | 4.31 | 3.85 |
| Centre Type: Free Schools (Free) v Academies (Acad) | -0.17 | 0.00 | -0.04 | -0.03 | 0.03 |
| Centre Type: Further Education Establishment (FurE) v Academies (Acad) | -0.07 | -0.15 | -0.11 | -0.21 | -0.53 |
| Centre Type: Independent schools (Indp) v Academies (Acad) | 0.45 | 0.47 | 0.35 | 0.48 | 0.39 |
| Centre Type: Other v Academies (Acad) | -0.21 | -0.09 | 0.13 | 0.25 | -0.26 |
| Centre Type: Secondary Comprehensive School (SecComp) v Academies (Acad) | -0.05 | -0.06 | 0.00 | 0.01 | -0.03 |
| Centre Type: Secondary Modern or High School (SecMod) v Academies (Acad) | -0.24 | -0.23 | -0.05 | -0.08 | -0.21 |
| Centre Type: Secondary Selective School (SecSel) v Academies (Acad) | 0.12 | 0.14 | -0.05 | -0.03 | 0.22 |
| Centre Type: Sixth Form College (Sixth) v Academies (Acad) | 0.03 | 0.03 | -0.11 | -0.19 | -0.13 |
| Centre Type: Tertiary College (Tert) v Academies (Acad) | 0.12 | 0.05 | -0.10 | -0.21 | -0.16 |
| Ethnicity: Asian Bangladeshi (ABAN) v White British (WBRI) | -0.11 | -0.11 | -0.13 | -0.09 | -0.07 |
| Ethnicity: Asian Indian (AIND) v White British (WBRI) | 0.03 | 0.04 | 0.05 | 0.10 | 0.09 |
| Ethnicity: Any Other Asian Background (AOTH) v White British (WBRI) | -0.10 | -0.09 | -0.09 | 0.00 | -0.03 |
| Ethnicity: Asian Pakistani (APKN) v White British (WBRI) | -0.07 | -0.06 | -0.09 | -0.08 | -0.03 |
| Ethnicity: Black African (BAFR) v White British (WBRI) | -0.07 | -0.06 | -0.09 | -0.12 | -0.01 |
| Ethnicity: Black Caribbean (BCRB) v White British (WBRI) | -0.18 | -0.16 | -0.09 | -0.17 | -0.11 |
| Ethnicity: Any Other Black Background (BOTH) v White British (WBRI) | -0.10 | -0.09 | -0.08 | -0.12 | -0.06 |
| Ethnicity: Chinese (CHNE) v White British (WBRI) | 0.06 | 0.17 | 0.17 | 0.12 | 0.19 |
| Ethnicity: Any Other Mixed Background (MOTH) v White British (WBRI) | -0.03 | -0.02 | -0.06 | -0.04 | -0.01 |
| Ethnicity: Mixed White and Asian (MWAS) v White British (WBRI) | 0.00 | 0.05 | 0.01 | 0.00 | 0.04 |
| Ethnicity: Mixed White and Black African (MWBA) v White British (WBRI) | -0.10 | -0.05 | -0.06 | -0.07 | 0.03 |
| Ethnicity: Mixed White and Black Caribbean (MWBC) v White British (WBRI) | -0.09 | -0.05 | -0.09 | -0.10 | -0.07 |
| Ethnicity: Any Other Ethnic Group (OOTH) v White British (WBRI) | 0.00 | 0.00 | 0.02 | 0.01 | 0.04 |
| Ethnicity: White Irish (WIRI) v White British (WBRI) | 0.04 | 0.06 | 0.05 | 0.05 | 0.12 |
| Ethnicity: Any Other White Background (WOTH) v White British (WBRI) | 0.03 | 0.02 | 0.05 | 0.01 | 0.01 |
| Ethnicity: Unknown v White British (WBRI) | -0.06 | -0.05 | -0.07 | -0.06 | -0.04 |
| FSM: Eligible for FSM v Not Eligible for FSM (NotFSM) | -0.08 | -0.04 | -0.06 | -0.10 | -0.10 |
| FSM: Unknown v NotFSM | 0.10 | 0.06 | 0.11 | 0.17 | 0.18 |
| Gender: Male v Female | 0.14 | 0.10 | -0.02 | -0.09 | 0.02 |
| Deprivation: Very low v Medium | 0.07 | 0.07 | 0.04 | 0.07 | 0.08 |
| Deprivation: Low v Medium | 0.02 | 0.02 | 0.02 | 0.03 | 0.04 |
| Deprivation: High v Medium | -0.03 | -0.04 | -0.01 | -0.05 | -0.06 |
| Deprivation: Very high v Medium | -0.06 | -0.08 | -0.04 | -0.10 | -0.13 |
| Deprivation: Unknown v Medium | -0.06 | -0.07 | -0.08 | -0.10 | -0.11 |
| Major language: NotEnglish v English | -0.03 | 0.00 | 0.01 | 0.01 | 0.03 |
| Major language: Unknown v English | -0.13 | -0.07 | 0.01 | -0.05 | -0.09 |
| Prior attainment: Very low v Medium | -1.07 | -1.10 | -1.14 | -1.19 | -1.13 |
| Prior attainment: Low v Medium | -0.50 | -0.51 | -0.52 | -0.54 | -0.49 |
| Prior attainment: High v Medium | 0.55 | 0.58 | 0.63 | 0.62 | 0.59 |
| Prior attainment: Very high v Medium | 1.41 | 1.45 | 1.53 | 1.42 | 1.44 |
| Prior attainment: Unknown v Medium | 0.37 | 0.34 | 0.30 | 0.21 | 0.15 |
| Region: East Midlands (EM) v south-east (SE) | 0.00 | -0.03 | -0.04 | -0.04 | -0.03 |
| Region: East of England (EA) v south-east (SE) | 0.02 | 0.01 | -0.03 | 0.02 | 0.01 |
| Region: London (LD) v south-east (SE) | 0.12 | 0.12 | 0.06 | 0.09 | 0.15 |
| Region: north-east (NE) v south-east (SE) | 0.00 | 0.05 | -0.01 | -0.01 | -0.01 |
| Region: north-west (NW) v south-east (SE) | 0.01 | 0.02 | -0.02 | -0.01 | 0.00 |
| Region: South West (SW) v south-east (SE) | -0.01 | 0.00 | -0.03 | -0.05 | -0.02 |
| Region: West Midlands (WM) v south-east (SE) | -0.06 | -0.04 | -0.05 | -0.04 | -0.04 |
| Region: Yorkshire and the Humber (Y&H) v south-east (SE) | -0.01 | -0.02 | -0.06 | -0.05 | -0.05 |
| SEND: Has SEND v Does Not Have SEND (NoSEND) | 0.00 | 0.04 | -0.05 | -0.07 | 0.00 |
The top charts in Figures AA.1-9 show that all groups saw an increase in their mean numeric grade in 2022 compared to 2019, and a decrease compared to 2021. This was expected as a result of the grading approach in 2022, which reflected a staging post between 2021 and 2019 grades.
The top row of Table AA shows the grade awarded to an ‘average’ entry in 2018 to 2022. The 2021 to 2022 decrease of 0.46 of a grade and the 2019 to 2022 increase of 0.41 of a grade are notable.
Overall, from the bottom charts in Figures AA.1-9 as well as Table AA, using the multi-step method described above, we found that for A levels on the numeric grade scale:
- 43 of the 49 between-group comparisons (on ethnicity, gender, deprivation, major language, region, SEND) showed no notable change from 2019 to 2022.
- 43 of the 49 between-group comparisons (on FSM, deprivation, major language, prior attainment, region, SEND) showed no notable change from 2021 to 2022.
- we do not list notable changes for ‘unknown’ categories here, but these are described further in the Methodology section.
The notable 2019 to 2022 changes, after controlling for the impact of other variables, are:
- Students in further education colleges had lower outcomes than students in academies. The difference of 0.53 grade was 0.38 grade wider than in 2019. The difference had narrowed slightly between 2019 and 2020, and then widened in both 2021 and 2022.
- Students in ‘other’ centres had lower outcomes than students in academies. The difference of 0.26 grade was 0.18 grade wider than in 2019. This difference had been reversed in 2020 and 2021, when students in ‘other’ centres had higher outcomes compared to students in academies.
- Students in sixth form colleges had lower outcomes than students in academies. The differences of 0.13 grade reversed the differences in 2019 when sixth form students had higher outcomes than academy students, and are more in line with the differences seen in both 2020 and 2021 when outcomes were also lower.
- Students in tertiary colleges had lower outcomes than students in academies. The difference of 0.16 grade reversed the differences in 2019 when tertiary college students had higher outcomes than academy students. Outcomes were also lower in both 2021, when the difference was widest, and 2020 when the difference was slightly narrower than in 2022.
The notable 2021 to 2022 changes, after controlling for other variables, are:
- Students in further education colleges had lower outcomes than students in academies. The difference of 0.53 grade was 0.32 grade wider than in 2021 respectively.
- Students in secondary modern schools had lower outcomes than students in academies. The difference of 0.21 grade was 0.13 grade wider than in 2021, and is more in line with the differences seen prior to the pandemic.
- Students in ‘other’ centres had lower outcomes than students in academies. The difference of 0.26 grade reversed the difference in 2021 when students in other centres had higher outcomes than academy students.
- Students in secondary selective schools had higher outcomes than students in academies. The difference of 0.22 grade reversed the difference in 2021 as well as in 2020 when secondary selective school students had slightly lower outcomes than academy students. The difference in 2022 is more in line with the higher outcomes for these students observed prior to the pandemic, although it is wider in 2022 than in 2019.
- Black African students had slightly lower outcomes than White British students. The difference of 0.01 grade was 0.11 grade narrower than in 2021.
- Male students had slightly higher outcomes than female students. The difference of 0.02 grade reversed the difference in 2021 and in 2020 when male students had lower outcomes than female students, and is more in line with the differences seen prior to the pandemic
A level - probability of grade A and above
Figures AB.1-9 show breakdowns of 2018 to 2022 A level results on the measure of probability of grade A and above.
Each figure refers to one background variable included in our analysis.
For each figure:
- the top chart displays the raw breakdowns of results for the period 2018 to 2022. Because results of the very small Unknown/Neither gender group are suppressed out of concern for disclosure, there are no bars for the group on the charts for gender.
- the bottom chart presents the results of the modelling, showing the relative outcome differences of the subgroups defined under each variable relative to their respective reference group, after controlling for other variables. In these charts, there are no bars for the reference groups because that is the group that we are comparing to.
The relative outcome differences shown in the charts below, as well as keys for acronyms are given in table AB below, with further details in Appendices C and E.
Figure AB.1 2018 to 2022 A level results (probability of grade A and above) by gender and outcome difference after controlling for other background variables
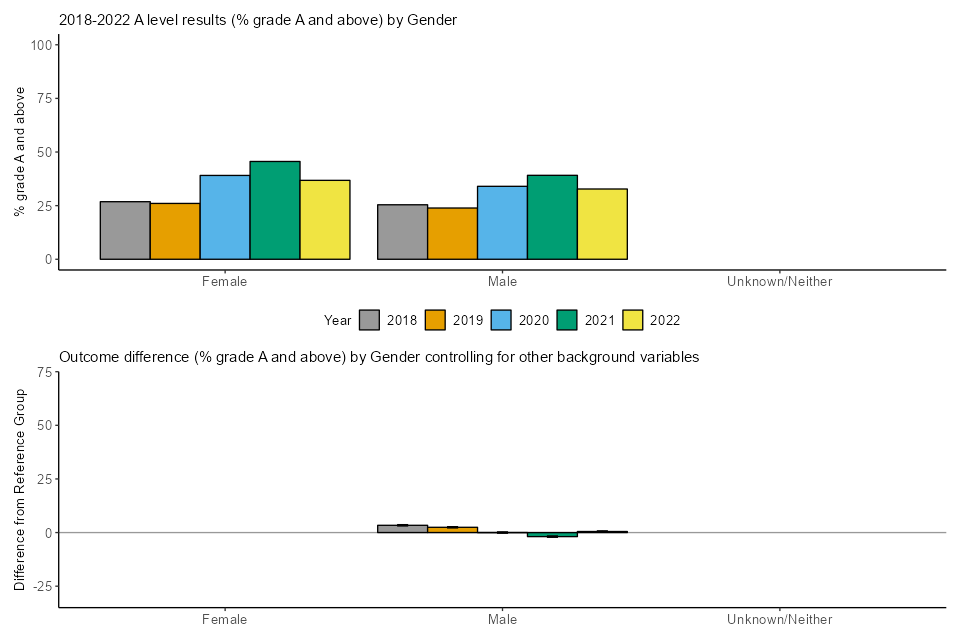
Figure AB.2 2018 to 2022 A level results (probability of grade A and above) by ethnicity and outcome difference after controlling for other background variables
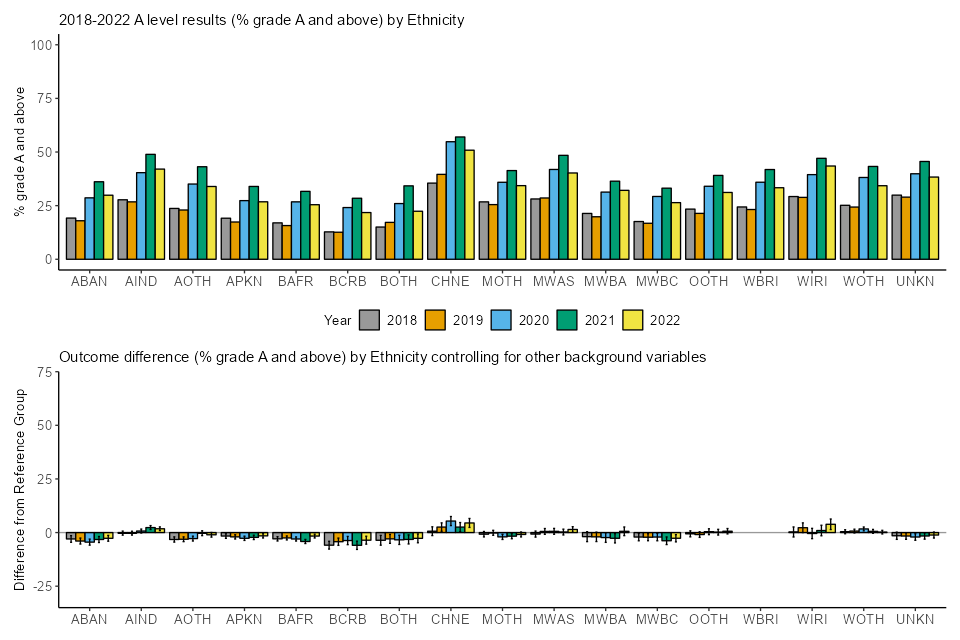
Figure AB.3 2018 to 2022 A level results (probability of grade A and above) by major language and outcome difference after controlling for other background variables
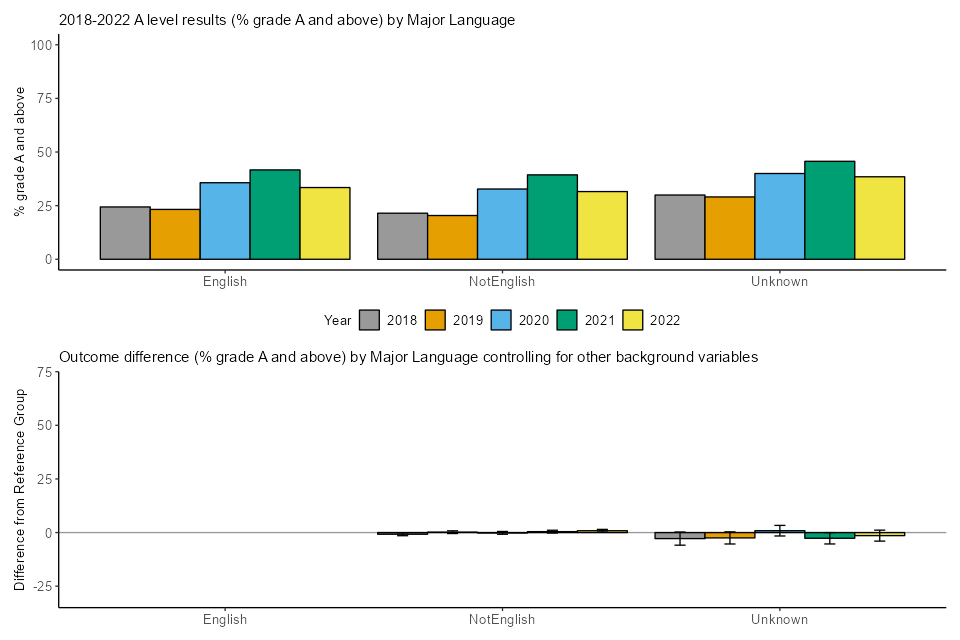
Figure AB.4 2018 to 2022 A level results (probability of grade A and above) by SEND status and outcome difference after controlling for other background variables
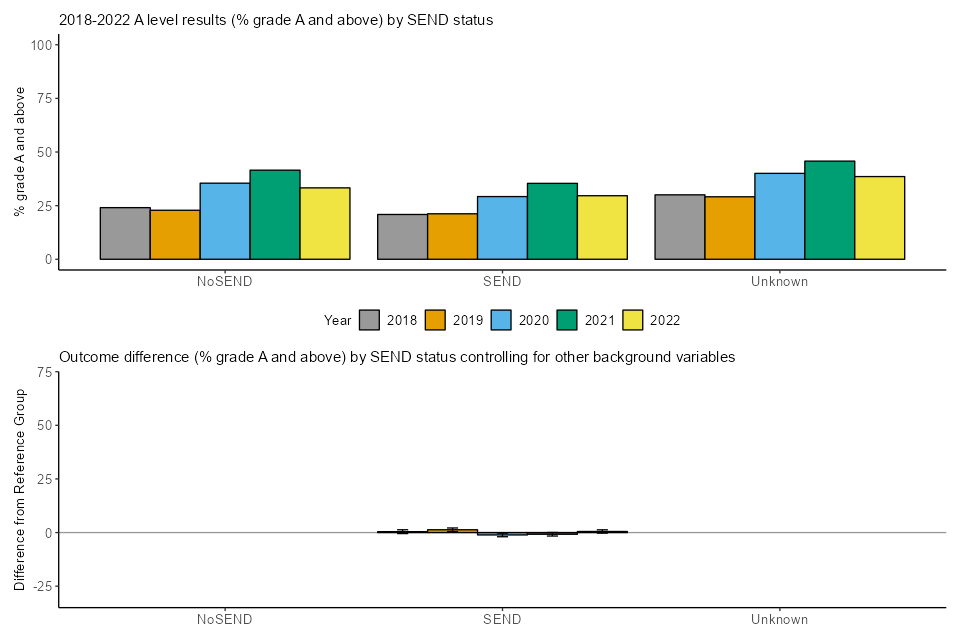
Figure AB.5 2018 to 2022 A level results (probability of grade A and above) by FSM eligibility status and outcome difference after controlling for other background variables
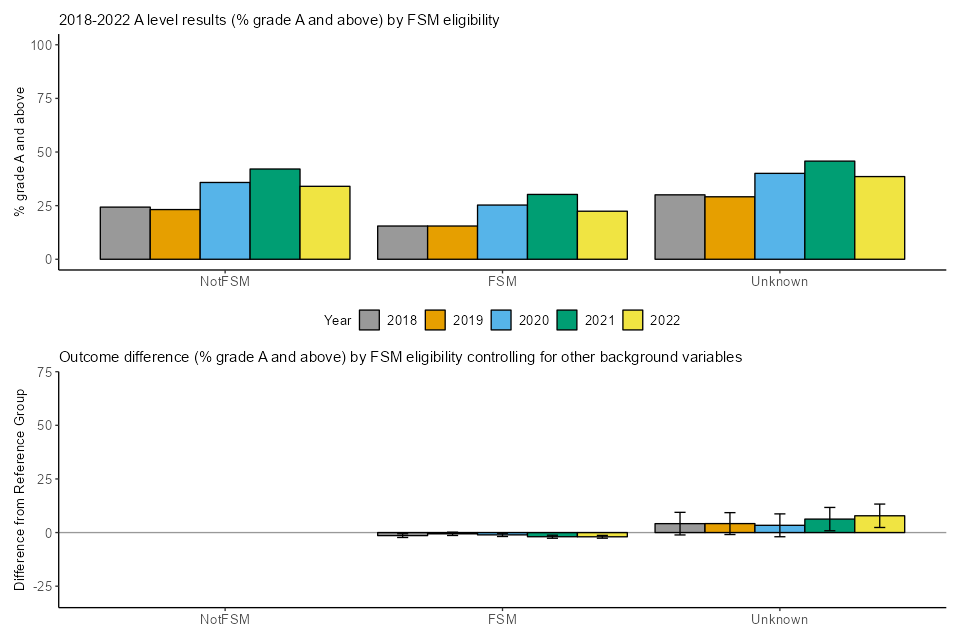
Figure AB.6 2018 to 2022 A level results (probability of grade A and above) by deprivation and outcome difference after controlling for other background variables
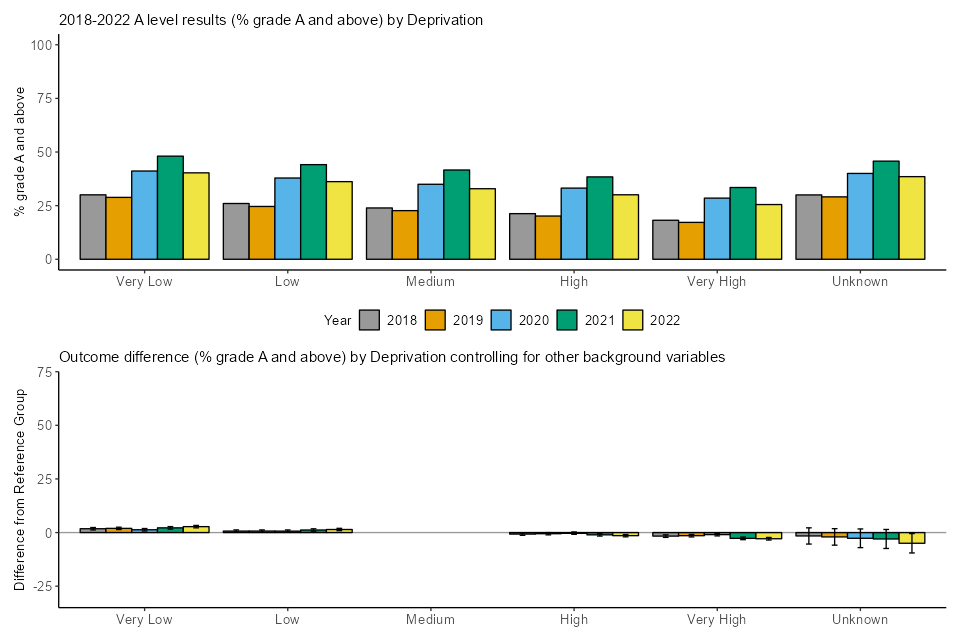
Figure AB.7 2018 to 2022 A level results (probability of grade A and above) by prior attainment and outcome difference after controlling for other background variables
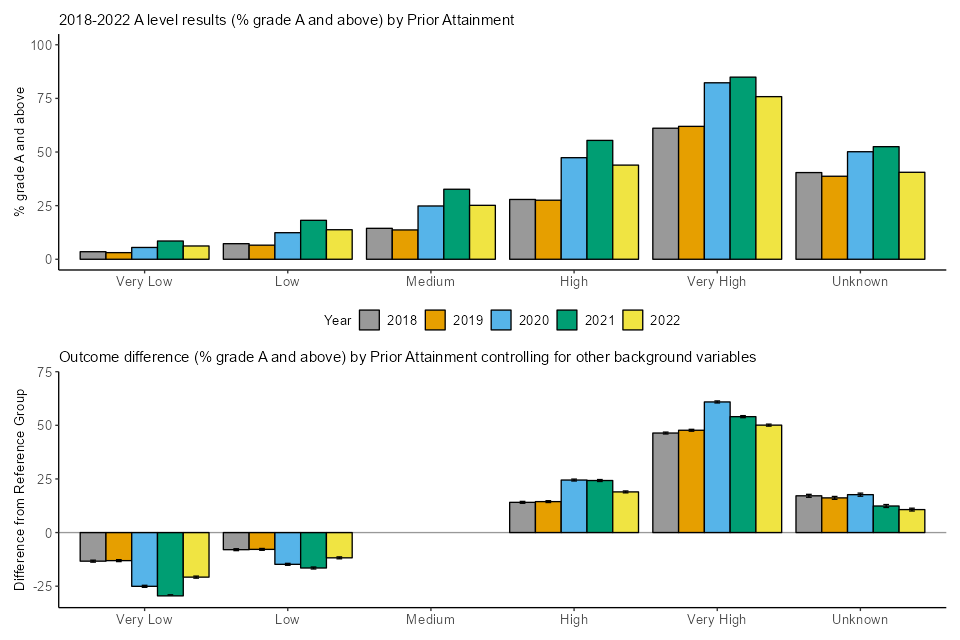
Figure AB.8 2018 to 2022 A level results (probability of grade A and above) by region and outcome difference after controlling for other background variables
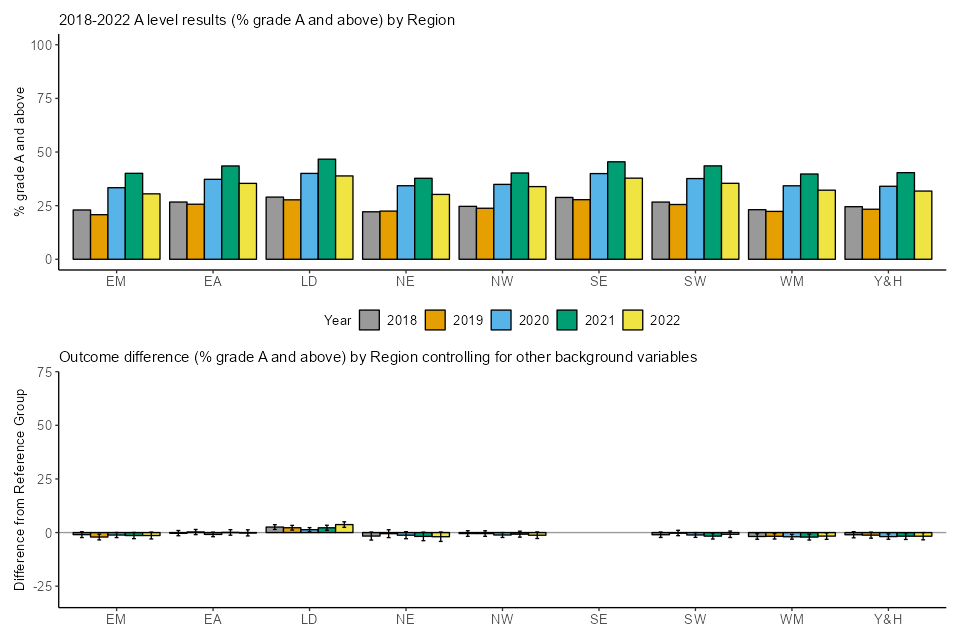
Figure AB.9 2018 to 2022 A level results (probability of grade A and above) by centre type and outcome difference after controlling for other background variables

Table AB. Summary of 2018 to 2022 relative A level outcome differences (in probability of grade A and above) after controlling for background variables
| Comparison | 2018 | 2019 | 2020 | 2021 | 2022 |
|---|---|---|---|---|---|
| Reference entry | 16.8% | 16.0% | 32.9% | 42.0% | 28.8% |
| Centre Type: Free Schools (Free) v Academies (Acad) | 1.8% | 3.0% | 1.4% | 0.1% | 2.0% |
| Centre Type: Further Education Establishment (FurE) v Academies (Acad) | -3.4% | -3.8% | -2.7% | -5.6% | -12.9% |
| Centre Type: Independent schools (Indp) v Academies (Acad) | 10.4% | 11.4% | 10.6% | 15.5% | 10.1% |
| Centre Type: Other v Academies (Acad) | -1.4% | 1.3% | 3.0% | 7.2% | -6.1% |
| Centre Type: Secondary Comprehensive School (SecComp) v Academies (Acad) | -1.1% | -1.3% | 0.4% | 0.6% | -0.9% |
| Centre Type: Secondary Modern or High School (SecMod) v Academies (Acad) | -2.3% | -1.1% | -0.1% | -0.8% | -4.0% |
| Centre Type: Secondary Selective School (SecSel) v Academies (Acad) | 2.5% | 2.8% | -2.2% | -0.9% | 5.6% |
| Centre Type: Sixth Form College (Sixth) v Academies (Acad) | -0.5% | 0.1% | -3.6% | -6.0% | -4.3% |
| Centre Type: Tertiary College (Tert) v Academies (Acad) | 1.0% | -0.2% | -3.4% | -6.2% | -6.2% |
| Ethnicity: Asian Bangladeshi (ABAN) v White British (WBRI) | -3.0% | -4.0% | -4.5% | -3.2% | -2.7% |
| Ethnicity: Asian Indian (AIND) v White British (WBRI) | -0.3% | -0.3% | 0.7% | 2.3% | 1.8% |
| Ethnicity: Any Other Asian Background (AOTH) v White British (WBRI) | -3.2% | -3.1% | -2.8% | -0.3% | -1.0% |
| Ethnicity: Asian Pakistani (APKN) v White British (WBRI) | -1.6% | -2.0% | -2.7% | -2.2% | -1.5% |
| Ethnicity: Black African (BAFR) v White British (WBRI) | -2.9% | -2.5% | -3.0% | -4.2% | -1.6% |
| Ethnicity: Black Caribbean (BCRB) v White British (WBRI) | -5.9% | -4.3% | -3.7% | -5.9% | -3.6% |
| Ethnicity: Any Other Black Background (BOTH) v White British (WBRI) | -3.6% | -2.9% | -3.4% | -3.2% | -2.7% |
| Ethnicity: Chinese (CHNE) v White British (WBRI) | 0.6% | 2.6% | 5.4% | 2.6% | 4.5% |
| Ethnicity: Any Other Mixed Background (MOTH) v White British (WBRI) | -0.8% | -0.1% | -2.0% | -1.7% | -0.9% |
| Ethnicity: Mixed White and Asian (MWAS) v White British (WBRI) | -0.7% | 0.5% | 0.6% | 0.2% | 1.4% |
| Ethnicity: Mixed White and Black African (MWBA) v White British (WBRI) | -1.9% | -2.0% | -2.3% | -2.7% | 0.6% |
| Ethnicity: Mixed White and Black Caribbean (MWBC) v White British (WBRI) | -2.1% | -2.2% | -2.1% | -3.8% | -2.7% |
| Ethnicity: Any Other Ethnic Group (OOTH) v White British (WBRI) | -0.6% | -0.9% | 0.4% | 0.2% | 0.6% |
| Ethnicity: White Irish (WIRI) v White British (WBRI) | 0.3% | 2.3% | -0.4% | 1.0% | 3.9% |
| Ethnicity: Any Other White Background (WOTH) v White British (WBRI) | 0.4% | 0.7% | 1.7% | 0.6% | 0.2% |
| Ethnicity: Unknown v White British (WBRI) | -1.5% | -1.6% | -2.1% | -1.6% | -1.2% |
| FSM: Eligible for FSM v Not Eligible for FSM (NotFSM) | -1.4% | -0.6% | -1.1% | -1.9% | -2.0% |
| FSM: Unknown v NotFSM | 4.2% | 4.2% | 3.4% | 6.3% | 7.8% |
| Gender: Male v Female | 3.4% | 2.5% | 0.0% | -1.9% | 0.5% |
| Deprivation: Very low v Medium | 1.8% | 2.0% | 1.3% | 2.2% | 2.8% |
| Deprivation: Low v Medium | 0.7% | 0.7% | 0.7% | 1.2% | 1.4% |
| Deprivation: High v Medium | -0.7% | -0.5% | -0.3% | -1.1% | -1.4% |
| Deprivation: Very high v Medium | -1.7% | -1.4% | -1.0% | -2.7% | -2.9% |
| Deprivation: Unknown v Medium | -1.6% | -2.0% | -2.7% | -3.0% | -5.0% |
| Major language: NotEnglish v English | -0.8% | 0.2% | -0.1% | 0.4% | 0.9% |
| Major language: Unknown v English | -2.8% | -2.5% | 0.9% | -2.7% | -1.4% |
| Prior attainment: Very low v Medium | -13.3% | -13.1% | -25.1% | -29.5% | -20.8% |
| Prior attainment: Low v Medium | -8.0% | -7.8% | -14.8% | -16.5% | -11.8% |
| Prior attainment: High v Medium | 14.1% | 14.4% | 24.5% | 24.3% | 19.0% |
| Prior attainment: Very high v Medium | 46.4% | 47.7% | 60.9% | 54.0% | 50.1% |
| Prior attainment: Unknown v Medium | 17.1% | 16.2% | 17.7% | 12.4% | 10.7% |
| Region: East Midlands (EM) v south-east (SE) | -1.0% | -2.1% | -1.1% | -1.4% | -1.4% |
| Region: East of England (EA) v south-east (SE) | -0.3% | 0.2% | -0.9% | 0.1% | -0.1% |
| Region: London (LD) v south-east (SE) | 2.6% | 2.2% | 1.3% | 2.2% | 3.7% |
| Region: north-east (NE) v south-east (SE) | -1.6% | -0.5% | -1.2% | -1.8% | -1.9% |
| Region: north-west (NW) v south-east (SE) | -0.5% | -0.5% | -1.1% | -0.7% | -1.2% |
| Region: South West (SW) v south-east (SE) | -1.0% | -0.2% | -1.1% | -1.7% | -0.8% |
| Region: West Midlands (WM) v south-east (SE) | -1.8% | -1.7% | -2.0% | -2.1% | -1.7% |
| Region: Yorkshire and the Humber (Y&H) v south-east (SE) | -1.0% | -1.2% | -1.9% | -1.7% | -1.7% |
| SEND: Has SEND v Does Not Have SEND (NoSEND) | 0.4% | 1.3% | -1.1% | -0.8% | 0.5% |
The top charts in Figures AB.1-9 show that all groups saw an increase in their probability of grade A and above in 2022 compared to 2019, and a decrease compared to 2021. The top row of Table AB shows the probability of an ‘average’ entry being awarded grade A and above in 2018 to 2022. The 2021 to 2022 decrease of 13.2 percentage points and the 2019 to 2022 increase of 12.8 percentage points are notable. This was expected as a result of the grading approach in 2022, which reflected a staging post between 2021 and 2019 grades.
From the bottom charts in Figures AB.1-9 as well as Table AB, using the multi-step method described above, we found that for the probability of attaining a grade 7 or above at A level:
- 27 of the 49 between-group comparisons showed no notable change from 2019 to 2022
- 26 of the 49 between-group comparisons showed no notable change from 2021 to 2022.
- we do not list notable changes for ‘unknown’ categories here, but these are described further in the Methodology section.
The notable 2019 to 2022 changes are:
- Students in further education colleges had lower outcomes than students in academies. The difference of 12.9 percentage points was 9.1 percentage points wider than in 2019, representing the widest difference of the years analysed.
- Students in tertiary colleges had lower outcomes than students in academies. The difference of 6.2 percentage points was 6.1 percentage points wider than in 2019.
- Students in independent schools had higher outcomes than students in academies. The difference of 10.1 percentage points was 1.3 percentage points narrower than in 2019, which means that in 2022 the difference is the smallest of any of the years observed.
- Students in ‘other’ centres had lower outcomes than students in academies. The difference of 6.1 reversed the difference observed in 2019 when students in other centres had higher outcomes than academy students.
- Students in sixth form colleges had lower outcomes than students in academies. The difference of 4.3 percentage points reversed the differences in 2019 when students in sixth form colleges had higher outcomes than academy students.
- Students in secondary selective schools had higher outcomes than students in academies. The difference of 5.6 percentage points was 2.8 percentage points wider than in 2019, and reverses the difference seen in 2020 and 2021 where outcomes for secondary selective students were lower than students in academies.
- Asian Bangladeshi and Asian Other students had lower outcomes than White British students. The differences of 2.7 and 1.0 percentage points respectively were 1.3 and 2.1 percentage points narrower than in 2019.
- Asian Indian students and Mixed White and Black African students had higher outcomes than White British students. The differences of 1.8 and 0.6 percentage points respectively reversed the differences in 2019 when Asian Indian students and Mixed White and Black African students had lower outcomes than White British students.
- FSM-eligible students had lower outcomes than FSM-ineligible students. The difference of 2.0 percentage points was 1.4 percentage points wider than in 2019, and at a similar level to 2021. The gap had reduced in 2019, and then subsequently widened in 2020 and 2021.
- Male students had higher outcomes than female students. The difference of 0.5 percentage points was 2.0 percentage points narrower than in 2019. This change reversed the difference from 2021 where male students had lower outcomes than female students.
- Students with very high deprivation, as measured by the IDACI index, had lower outcomes than students with medium deprivation. The difference of 2.9 percentage points was 1.4 percentage points wider than in 2019.
- Students with unknown major language had lower outcomes than students with English as major language. The difference of 1.4 percentage points was 1.1 percentage points narrower than in 2019.
- Students with very low and low prior attainment had lower outcomes than students with medium prior attainment. The differences of 20.8 and 11.8 percentage points were 7.7 and 3.9 percentage points wider than in 2019 respectively.
- Students with high, and very high prior attainment had higher outcomes than students with medium prior attainment. The differences of 19.0 and 50.1 percentage points were 4.5 and 2.4 percentage points wider than in 2019 respectively.
- Students in London had higher outcomes than students in the south-east. The difference of 3.7 percentage points was 1.5 percentage points wider than in 2019. Outcomes for students in London have been consistently higher than for students in the south-east since 2018, although the difference narrowed slightly in 2020. The difference in 2022 was the widest of the years included in the model.
The notable 2021 to 2022 changes are:
- Students in further education colleges had lower outcomes than students in academies. The difference of 12.9 percentage points was 7.4 percentage points wider than in 2021.
- Students in independent schools had higher outcomes than students in academies. The difference of 10.1 percentage points was 5.4 percentage points narrower than in 2021, when the difference was the largest of the years analysed.
- Students in ‘other’ centres and students in secondary comprehensive schools had lower outcomes than students in academies. The differences of 6.1 and 0.9 percentage points respectively reversed the differences in 2021 when students in other centres and those in secondary comprehensive schools had higher outcomes than academy students.
- Students in secondary selective schools had higher outcomes than students in academies. The difference of 5.6 percentage points reversed the difference in 2021 and 2020 when students in secondary selective schools had lower outcomes than academy students.
- Students in sixth form colleges had lower outcomes than students in academies. The difference of 4.3 percentage points was 1.6 percentage points grade narrower than in 2021. As noted in the 2019-21 section above, this was a reversal of a slightly positive difference observed in 2019, after the negative difference widened in both 2020 and 2021.
- Black African, Black Caribbean and Mixed White and Black Caribbean students had lower outcomes than White British students. The differences of 1.6, 3.6 and 2.7 percentage points were 2.5, 2.4 and 1.2 percentage points narrower than in 2021 respectively.
- Chinese and White Irish students had higher outcomes than White British students. The differences of 4.5 and 3.9 percentage points were 1.9 and 2.9 percentage points wider than in 2021 respectively.
- Mixed White and Black African students had higher outcomes than White British students. The difference of 0.6 percentage points reversed the difference in 2021 when Mixed White and Black African students had lower outcomes than White British students.
- Students with unknown FSM eligibility status had higher outcomes than FSM-ineligible students. The difference of 7.8 percentage points was 1.6 percentage points wider than in 2021.
- Male students had higher outcomes than female students. The difference of 0.5 percentage point reversed the difference in 2021 when male students had lower outcomes than female students.
- Students with unknown level of deprivation had lower outcomes than students with medium deprivation. The difference of 5.0 percentage points was 2.0 percentage points wider than in 2021.
- Students with unknown major language had lower outcomes than students with English as major language. The difference of 1.4 percentage points was 1.2 percentage points narrower than in 2021.
- Students with very low and low prior attainment had lower outcomes than students with medium prior attainment. The differences of 20.8 and 11.8 percentage points were 8.7 and 4.7 percentage points narrower than in 2021 respectively.
- Students with high and very high prior attainment had higher outcomes than students with medium prior attainment. The differences of 19.0 and 50.1 percentage points were 5.3 and 4.0 percentage points narrower than in 2021 respectively.
- Students in London had higher outcomes than students in the south-east. The difference of 3.7 percentage points was 1.5 percentage points wider than in 2021.
- Students with SEND had higher outcomes than students without SEND. The difference of 0.5 percentage point reversed the difference in 2021 and in 2020 when students with SEND had lower outcomes than students without SEND.
A level - probability of grade C and above
Figures AC.1-9 show breakdowns of 2018 to 2022 A level results (on the measure of probability of grade C and above) Each figure refers to one background variable included in our analysis.
For each figure:
- the top chart displays the raw breakdowns of results for the period 2018 to 2022. Because results of the very small Unknown/Neither gender group are suppressed out of concern for disclosure, there are no bars for the group on the charts for gender.
- the bottom chart presents the results of the modelling, showing the relative outcome differences of the subgroups defined under each variable relative to their respective reference group, after controlling for other variables. In these charts, there are no bars for the reference groups because that is the group that we are comparing to.
The relative outcome differences shown in the charts, as well as keys for acronyms, are given in table AC below, with further details in Appendices C and E.
Figure AC.1 2018 to 2022 A level results (probability of grade C and above) by gender and outcome difference after controlling for other background variables
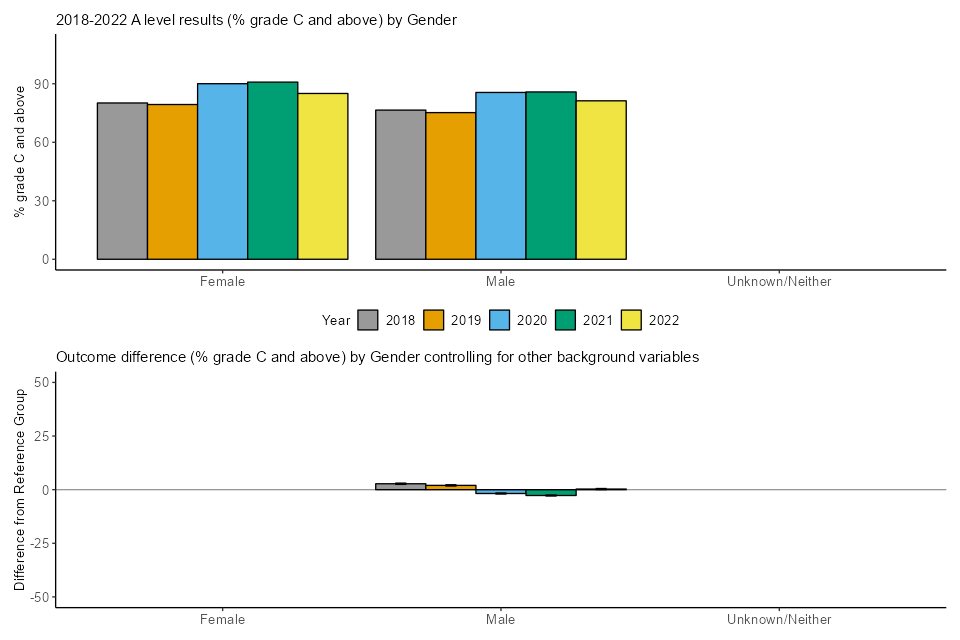
Figure AC.2 2018 to 2022 A level results (probability of grade C and above) by ethnicity and outcome difference after controlling for other background variables
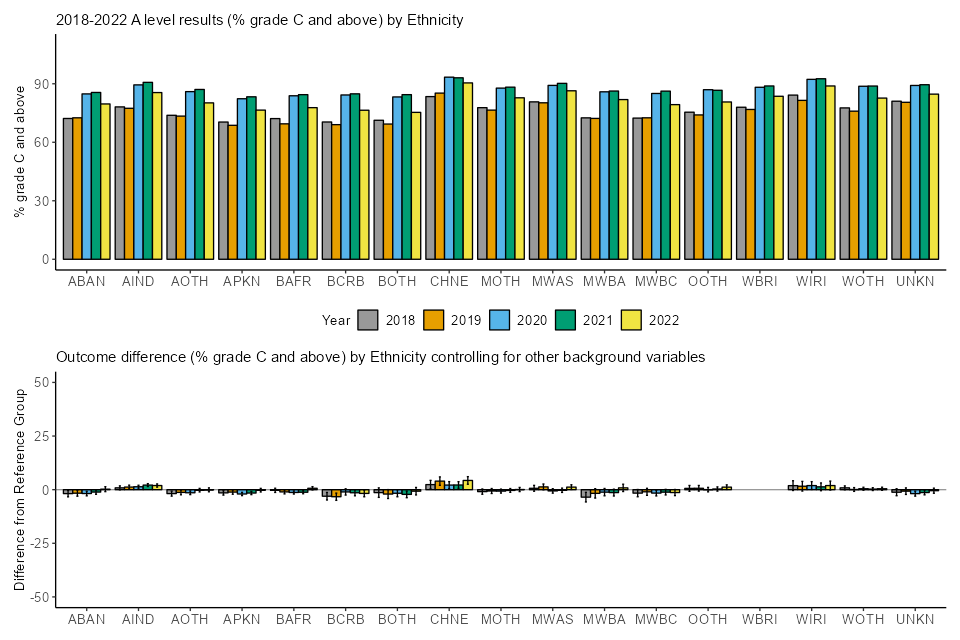
Figure AC.3 2018 to 2022 A level results (probability of grade C and above) by major language and outcome difference after controlling for other background variables
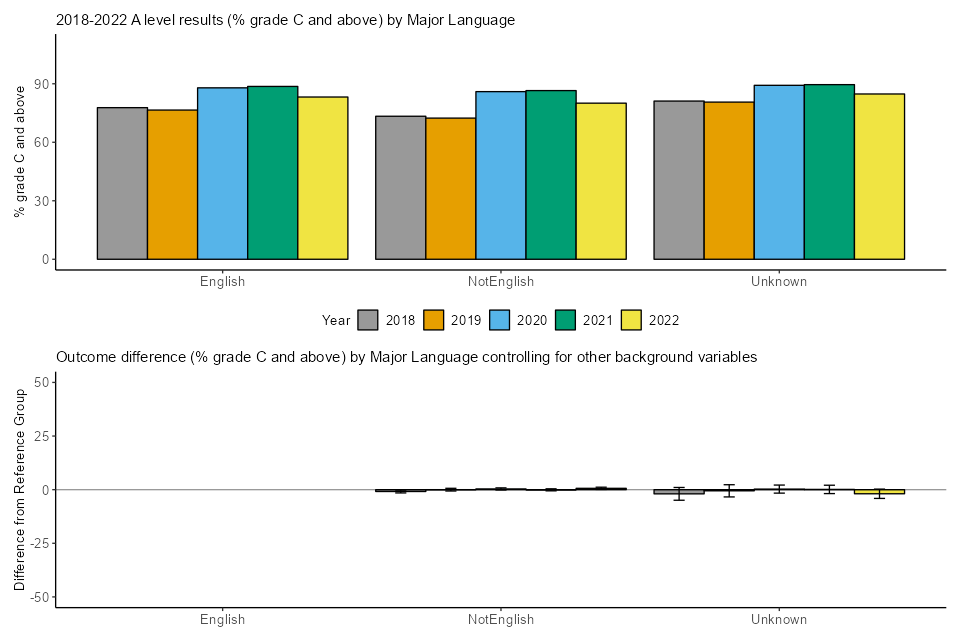
Figure AC.4 2018 to 2022 A level results (probability of grade C and above) by SEND status and outcome difference after controlling for other background variables

Figure AC.5 2018 to 2022 A level results (probability of grade C and above) by FSM eligibility status and outcome difference after controlling for other background variables
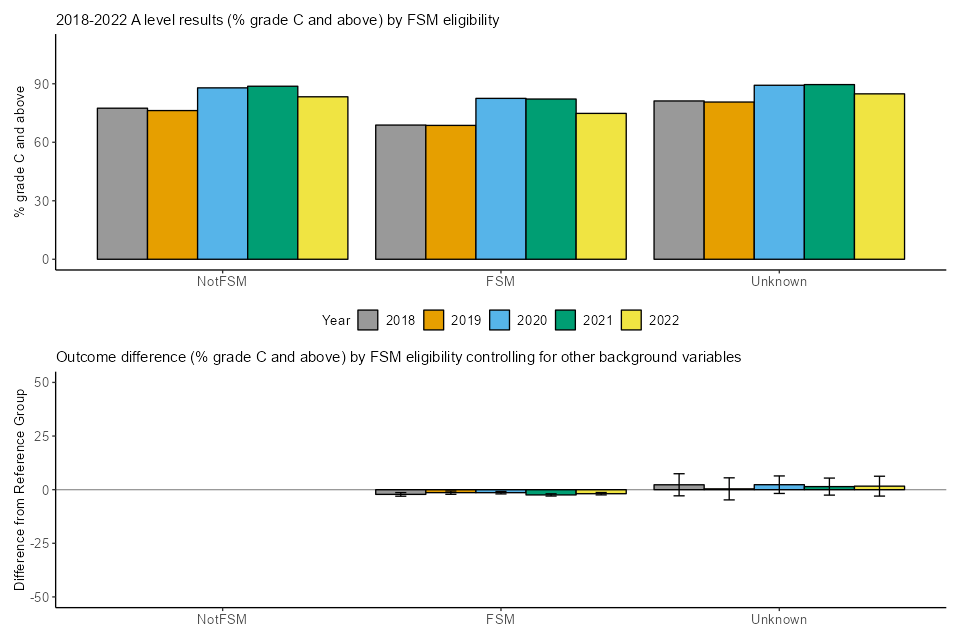
Figure AC.6 2018 to 2022 A level results (probability of grade C and above) by deprivation and outcome difference after controlling for other background variables
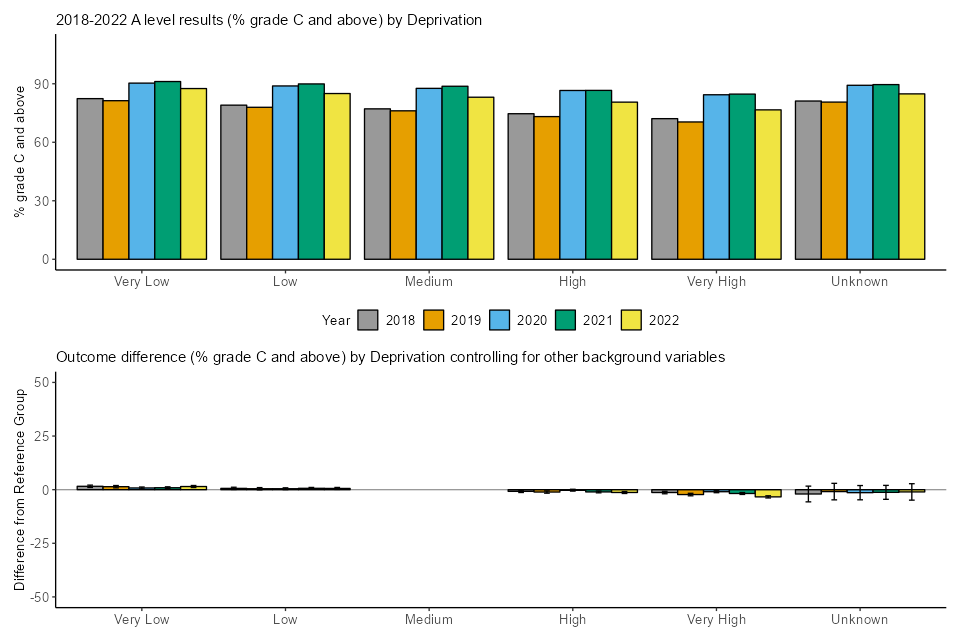
Figure AC.7 2018 to 2022 A level results (probability of grade C and above) by prior attainment and outcome difference after controlling for other background variables
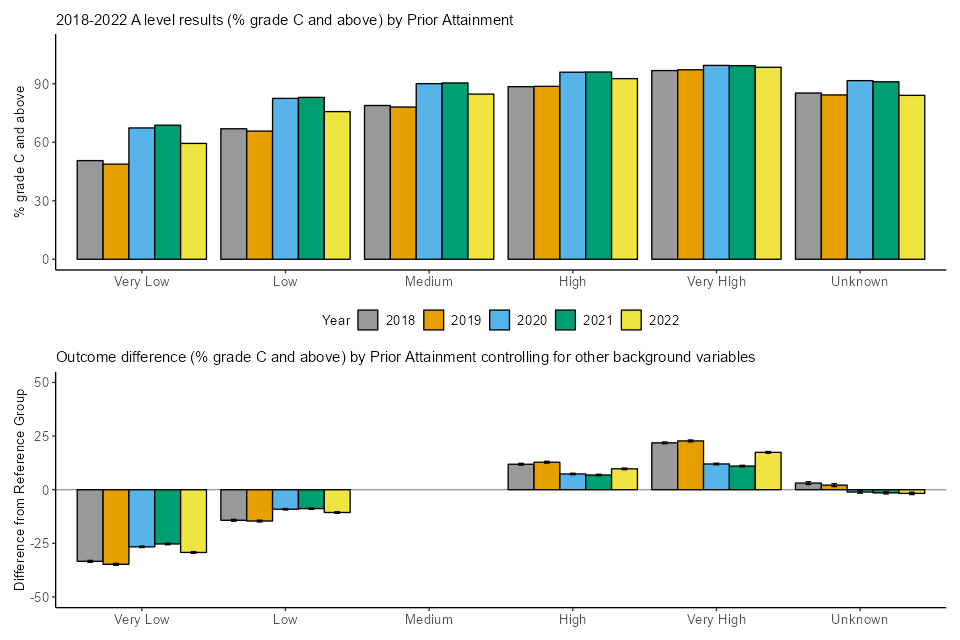
Figure AC.8 2018 to 2022 A level results (probability of grade C and above) by region and outcome difference after controlling for other background variables
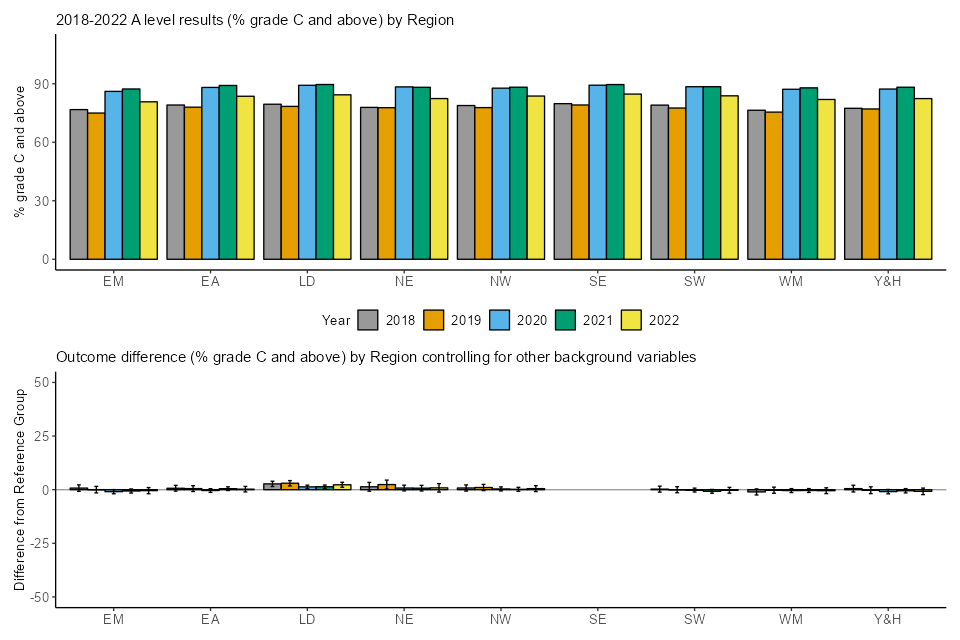
Figure AC.9 2018 to 2022 A level results (probability of grade C and above) by centre type and outcome difference after controlling for other background variables

Table AC. Summary of 2018 to 2022 relative A level outcome differences (in probability of grade C and above) after controlling for background variables
| Comparison | 2018 | 2019 | 2020 | 2021 | 2022 |
|---|---|---|---|---|---|
| Reference entry | 80.6% | 81.2% | 95.5% | 96.4% | 87.7% |
| Centre Type: Free Schools (Free) v Academies (Acad) | -2.8% | -1.0% | -2.5% | -1.7% | 0.2% |
| Centre Type: Further Education Establishment (FurE) v Academies (Acad) | -2.2% | -6.2% | -2.5% | -3.5% | -12.1% |
| Centre Type: Independent schools (Indp) v Academies (Acad) | 8.8% | 8.1% | 5.1% | 5.4% | 6.7% |
| Centre Type: Other v Academies (Acad) | -6.2% | -4.3% | 1.2% | 2.9% | -4.6% |
| Centre Type: Secondary Comprehensive School (SecComp) v Academies (Acad) | -1.2% | -1.5% | -0.4% | 0.0% | -0.7% |
| Centre Type: Secondary Modern or High School (SecMod) v Academies (Acad) | -6.5% | -8.5% | -2.9% | -1.8% | -4.5% |
| Centre Type: Secondary Selective School (SecSel) v Academies (Acad) | 2.1% | 2.9% | -0.7% | -0.5% | 3.8% |
| Centre Type: Sixth Form College (Sixth) v Academies (Acad) | 0.2% | -0.8% | -2.3% | -3.1% | -2.6% |
| Centre Type: Tertiary College (Tert) v Academies (Acad) | 3.1% | 0.6% | -2.1% | -3.5% | -2.4% |
| Ethnicity: Asian Bangladeshi (ABAN) v White British (WBRI) | -1.8% | -1.6% | -1.8% | -1.1% | 0.2% |
| Ethnicity: Asian Indian (AIND) v White British (WBRI) | 0.9% | 1.2% | 1.4% | 2.1% | 1.9% |
| Ethnicity: Any Other Asian Background (AOTH) v White British (WBRI) | -1.8% | -1.3% | -1.4% | -0.2% | -0.1% |
| Ethnicity: Asian Pakistani (APKN) v White British (WBRI) | -1.5% | -1.1% | -2.0% | -1.6% | -0.2% |
| Ethnicity: Black African (BAFR) v White British (WBRI) | -0.3% | -1.0% | -1.3% | -1.2% | 0.6% |
| Ethnicity: Black Caribbean (BCRB) v White British (WBRI) | -3.1% | -3.3% | -1.1% | -1.4% | -1.7% |
| Ethnicity: Any Other Black Background (BOTH) v White British (WBRI) | -1.4% | -2.0% | -1.7% | -2.2% | -0.7% |
| Ethnicity: Chinese (CHNE) v White British (WBRI) | 2.4% | 4.0% | 2.1% | 2.2% | 4.3% |
| Ethnicity: Any Other Mixed Background (MOTH) v White British (WBRI) | -0.9% | -0.6% | -0.7% | -0.4% | 0.1% |
| Ethnicity: Mixed White and Asian (MWAS) v White British (WBRI) | 0.6% | 1.3% | -0.6% | -0.3% | 1.2% |
| Ethnicity: Mixed White and Black African (MWBA) v White British (WBRI) | -3.5% | -1.7% | -1.2% | -1.4% | 0.8% |
| Ethnicity: Mixed White and Black Caribbean (MWBC) v White British (WBRI) | -1.6% | -1.0% | -1.6% | -1.2% | -1.3% |
| Ethnicity: Any Other Ethnic Group (OOTH) v White British (WBRI) | 0.6% | 0.6% | 0.0% | 0.3% | 1.2% |
| Ethnicity: White Irish (WIRI) v White British (WBRI) | 1.9% | 1.6% | 1.9% | 1.3% | 1.9% |
| Ethnicity: Any Other White Background (WOTH) v White British (WBRI) | 0.9% | 0.1% | 0.4% | 0.3% | 0.4% |
| Ethnicity: Unknown v White British (WBRI) | -1.2% | -0.7% | -1.9% | -1.3% | -0.5% |
| FSM: Eligible for FSM v Not Eligible for FSM (NotFSM) | -2.2% | -1.4% | -1.4% | -2.5% | -1.9% |
| FSM: Unknown v NotFSM | 2.3% | 0.4% | 2.3% | 1.4% | 1.6% |
| Gender: Male v Female | 2.8% | 2.0% | -1.8% | -2.7% | 0.3% |
| Deprivation: Very low v Medium | 1.6% | 1.4% | 0.8% | 0.9% | 1.5% |
| Deprivation: Low v Medium | 0.6% | 0.4% | 0.4% | 0.6% | 0.6% |
| Deprivation: High v Medium | -0.8% | -1.1% | -0.2% | -1.1% | -1.3% |
| Deprivation: Very high v Medium | -1.3% | -2.3% | -1.0% | -1.8% | -3.4% |
| Deprivation: Unknown v Medium | -2.0% | -0.9% | -1.4% | -1.3% | -1.1% |
| Major language: NotEnglish v English | -0.9% | 0.0% | 0.3% | -0.1% | 0.6% |
| Major language: Unknown v English | -2.0% | -0.5% | 0.3% | 0.1% | -1.9% |
| Prior attainment: Very low v Medium | -33.4% | -34.8% | -26.6% | -25.3% | -29.3% |
| Prior attainment: Low v Medium | -14.3% | -14.6% | -9.1% | -8.8% | -10.6% |
| Prior attainment: High v Medium | 11.9% | 12.8% | 7.3% | 6.8% | 9.7% |
| Prior attainment: Very high v Medium | 21.8% | 22.7% | 12.0% | 11.0% | 17.4% |
| Prior attainment: Unknown v Medium | 3.1% | 2.1% | -1.1% | -1.5% | -1.7% |
| Region: East Midlands (EM) v south-east (SE) | 0.7% | 0.0% | -0.9% | -0.6% | -0.5% |
| Region: East of England (EA) v south-east (SE) | 0.7% | 0.5% | -0.4% | 0.5% | 0.2% |
| Region: London (LD) v south-east (SE) | 2.7% | 3.0% | 1.3% | 1.4% | 2.3% |
| Region: north-east (NE) v south-east (SE) | 1.3% | 2.4% | 0.8% | 0.7% | 0.8% |
| Region: north-west (NW) v south-east (SE) | 0.8% | 1.0% | 0.3% | 0.2% | 0.5% |
| Region: south-west (SW) v south-east (SE) | 0.2% | 0.0% | -0.2% | -0.8% | -0.3% |
| Region: West Midlands (WM) v south-east (SE) | -1.1% | -0.3% | -0.4% | -0.4% | -0.5% |
| Region: Yorkshire and the Humber (Y&H) v south-east (SE) | 0.5% | -0.2% | -0.9% | -0.5% | -0.8% |
| SEND: Has SEND v Does Not Have SEND (NoSEND) | -0.6% | 0.3% | -1.4% | -2.1% | -0.5% |
The top charts in Figures AC.1-9 show that all groups saw a decrease in their probability of grade C and above in 2022 compared to 2021, and all, except the unknown prior attainment group also saw an increase compared to 2019.
The top row of Table AC shows the probability of an ‘average’ entry being awarded grade C and above in 2018 to 2022. The 2021 to 2022 decrease of 8.7 percentage points and the 2019 to 2022 increase of 6.5 percentage points are notable, as would be expected given the changes to grading in this period.
From the bottom charts in Figures AC.1-9 as well as Table AC, using the multi-step method described above, we found for the probability of attaining a grade C or above:
- 30 of the 49 between-group comparisons showed no notable change from 2019 to 2022
- 30 of the 49 between-group comparisons showed no notable change from 2021 to 2022.
- we do not list notable changes for ‘unknown’ categories here, but these are described further in the Methodology section.
The notable 2019 to 2022 changes are:
- Students in further education colleges had lower outcomes than students in academies. The difference of 12.1 percentage points was 5.9 percentage points wider than in 2019.
- Students in independent schools had higher outcomes than students in academies. The difference of 6.7 percentage points was 1.4 percentage points narrower than in 2019.
- Students in secondary modern schools had lower outcomes than students in academies. The difference of 4.5 percentage points was 4.0 percentage points narrower than in 2019.
- Students in sixth form colleges had lower outcomes than students in academies. The difference of 2.6 percentage points was 1.7 percentage points wider than in 2019.
- Students in tertiary colleges had lower outcomes than students in academies. The difference of 2.4 percentage points reversed the difference in 2019 when students in tertiary colleges had higher outcomes than academy students.
- Asian Other, Black Caribbean and Black Other students had lower outcomes than White British students. The differences of 0.1, 1.7 and 0.7 percentage points respectively were 1.2, 1.5 and 1.3 percentage points narrower than in 2019.
- Asian Bangladeshi, Black African and Mixed White and Black African students had higher outcomes than White British students. The differences of 0.2, 0.6 and 0.8 percentage points respectively reversed the differences in 2019 when Asian Bangladeshi, Black African and Mixed White and Black African students had lower outcomes than White British students.
- Male students had higher outcomes than female students. The difference of 0.3 percentage points was 1.7 percentage points narrower than in 2019.
- Students with very high deprivation had lower outcomes than students with medium deprivation. The difference of 3.4 percentage points was 1.1 percentage points wider than in 2019.
- Students with very low and low prior attainment had lower outcomes than students with medium prior attainment. The differences of 29.3 and 10.6 percentage points were 5.5 and 4.0 percentage points narrower than in 2019 respectively.
- Students with high and very high prior attainment had higher outcomes than students with medium prior attainment. The differences of 9.7 and 17.4 percentage points were 3.1 and 5.3 percentage points narrower than in 2019 respectively.
- Students with unknown prior attainment had lower outcomes than students with medium prior attainment. The difference of 1.7 percentage points reversed the difference in 2019 when students with unknown prior attainment had higher outcomes than students with medium prior attainment.
- Students in the north-east had higher outcomes than students in the south-east. The difference of 0.8 percentage point was 1.6 percentage points narrower than in 2019.
The notable 2021 to 2022 changes are:
- Students in further education colleges and students in secondary modern schools had lower outcomes than students in academies. The differences of 12.1 and 4.5 percentage points respectively were 8.6 and 2.7 percentage points wider than in 2021.
- Students in independent schools had higher outcomes than students in academies. The difference of 6.7 percentage points was 1.3 percentage points wider than in 2021, after the difference had narrowed in 2020 and 2021.
- Students in ‘other’ centres had lower outcomes than students in academies. The difference of 4.6 percentage points reversed the difference in 2021 when students in ‘other’ centres had higher outcomes than academy students.
- Students in secondary selective schools had higher outcomes than students in academies. The difference of 3.8 percentage points reversed the difference in 2021 when students in secondary selective schools had lower outcomes than academy students.
- Asian Bangladeshi, Black African, Mixed White and Asian and Mixed White and Black African students had higher outcomes than White British students. The differences of 0.2, 0.6, 1.2 and 0.8 percentage points respectively reversed the differences in 2021 when Asian Bangladeshi, Black African, Mixed White and Asian and Mixed White and Black African students had lower outcomes than White British students.
- Asian Pakistani and Black Other students had lower outcomes than White British students. The differences of 0.2 and 0.7 percentage points were 1.3 and 1.5 percentage points narrower than in 2021 respectively.
- Chinese students had higher outcomes than White British students. The difference of 4.3 percentage points was 2.1 percentage points wider than in 2021.
- Male students had higher outcomes than female students. The difference of 0.3 percentage points reversed the difference in 2021 when male students had lower outcomes than female students.
- Students with very high deprivation had lower outcomes than students with medium deprivation. The difference of 3.4 percentage points was 1.6 percentage points wider than in 2021.
- Students with very low and low prior attainment had lower outcomes than students with medium prior attainment. The differences of 29.3 and 10.6 percentage points were 4.0 and 1.8 percentage points wider than in 2021 respectively.
- Students with high and very high prior attainment had higher outcomes than students with medium prior attainment. The differences of 9.7 and 17.4 percentage points were 2.9 and 6.4 percentage points wider than in 2021 respectively.
- Students with SEND had lower outcomes than students without SEND. The difference of 0.5 percentage point was 1.6 percentage points narrower than in 2021.
GCSE - numeric grade
Figures GA.1-9 show breakdowns of 2018 to 2022 GCSE results on the numeric grade measure. Each figure refers to one background variable included in our analysis.
For each figure:
- the top chart displays the raw breakdowns of results for the period 2018 to 2022. Because results of the very small Unknown/Neither gender group are suppressed out of concern for disclosure, there are no bars for the group on the charts for gender.
- the bottom chart presents the results of the modelling, showing the relative outcome differences of the subgroups defined under each variable relative to their respective reference group, after controlling for other variables. In these charts, there are no bars for the reference groups because that is the group that we are comparing to.
The relative outcome differences shown in the charts, as well as keys for acronyms, are given in table GA below, with further details in Appendices C and E.
Figure GA.1 2018 to 2022 GCSE results (numeric grade) by gender and outcome difference after controlling for other background variables
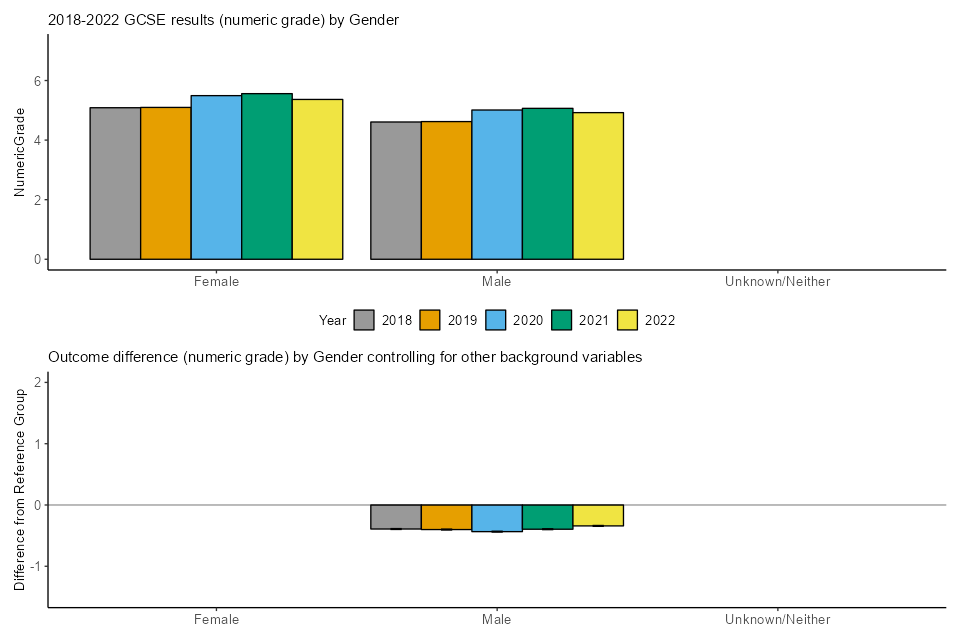
Figure GA.2 2018 to 2022 GCSE results (numeric grade) by ethnicity and outcome difference after controlling for other background variables
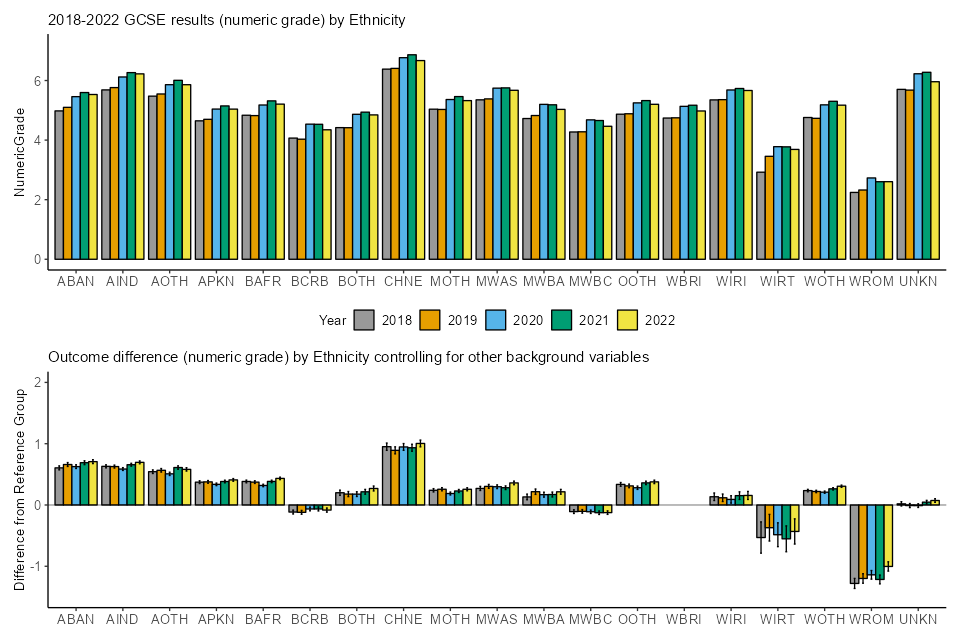
Figure GA.3 2018 to 2022 GCSE results (numeric grade) by major language and outcome difference after controlling for other background variables
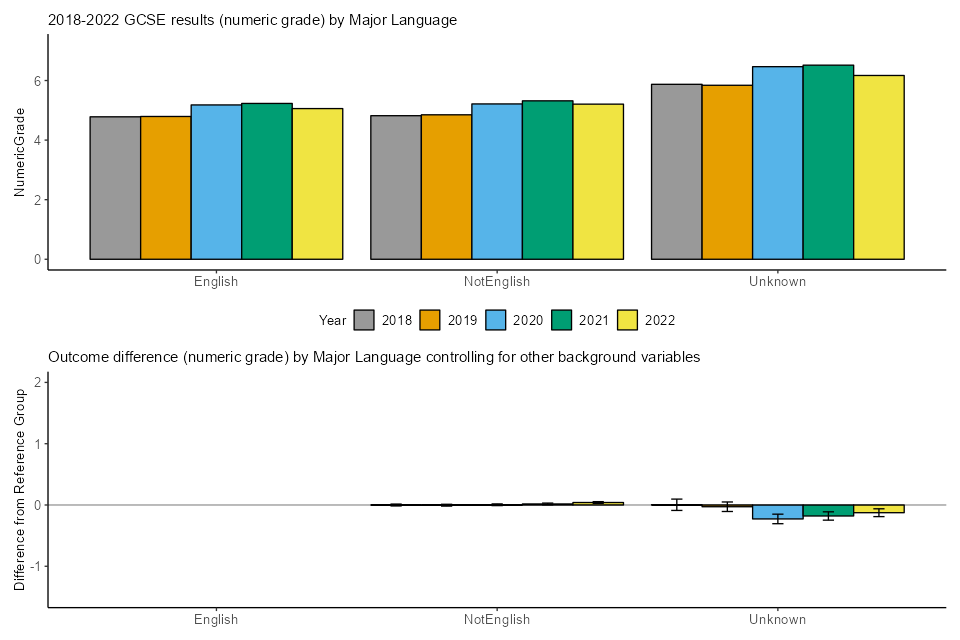
Figure GA.4 2018 to 2022 GCSE results (numeric grade) by SEND status and outcome difference after controlling for other background variables
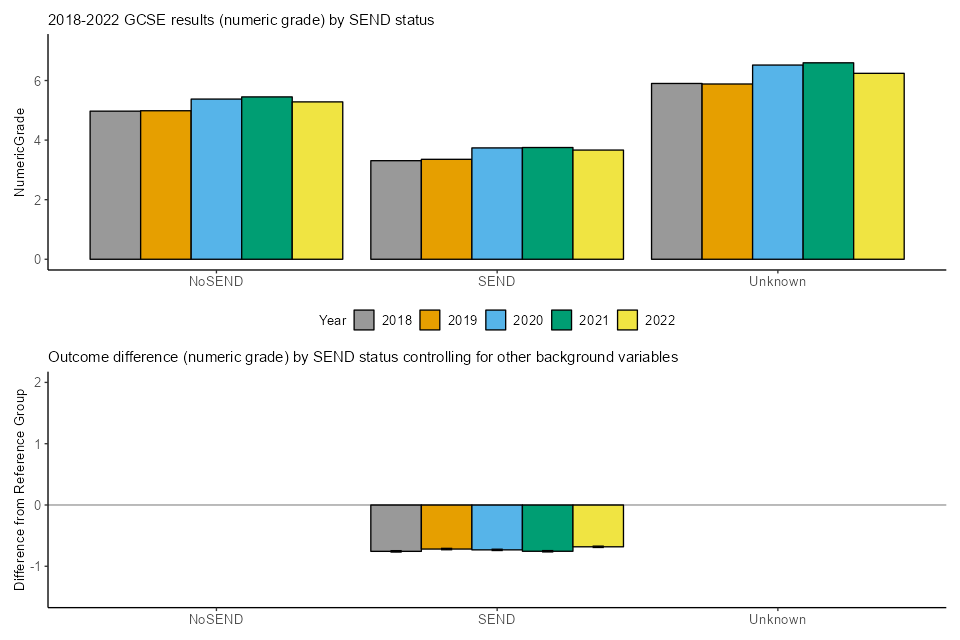
Figure GA.5 2018 to 2022 GCSE results (numeric grade) by FSM eligibility status and outcome difference after controlling for other background variables
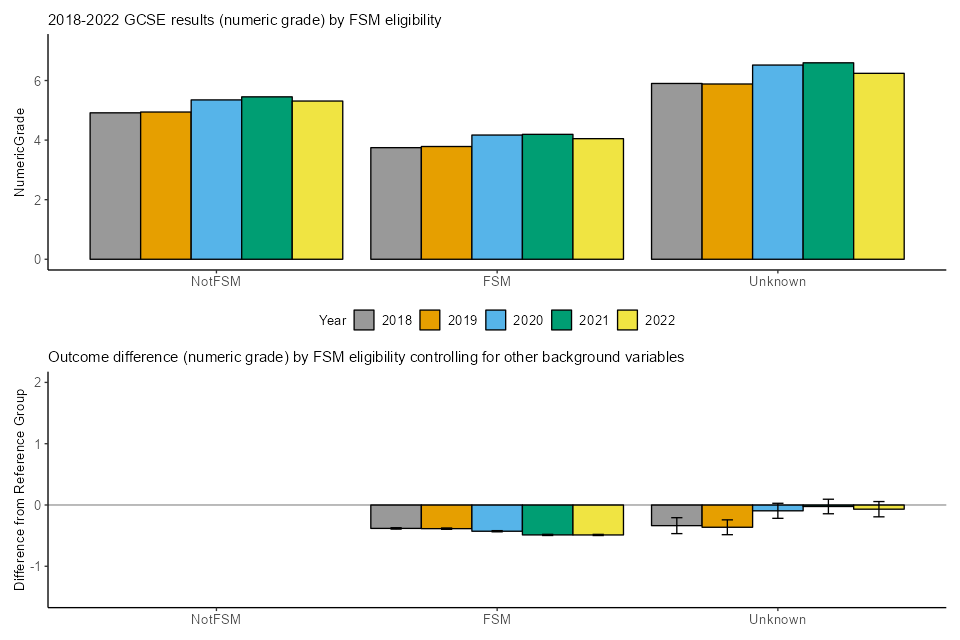
Figure GA.6 2018 to 2022 GCSE results (numeric grade) by deprivation and outcome difference after controlling for other background variables
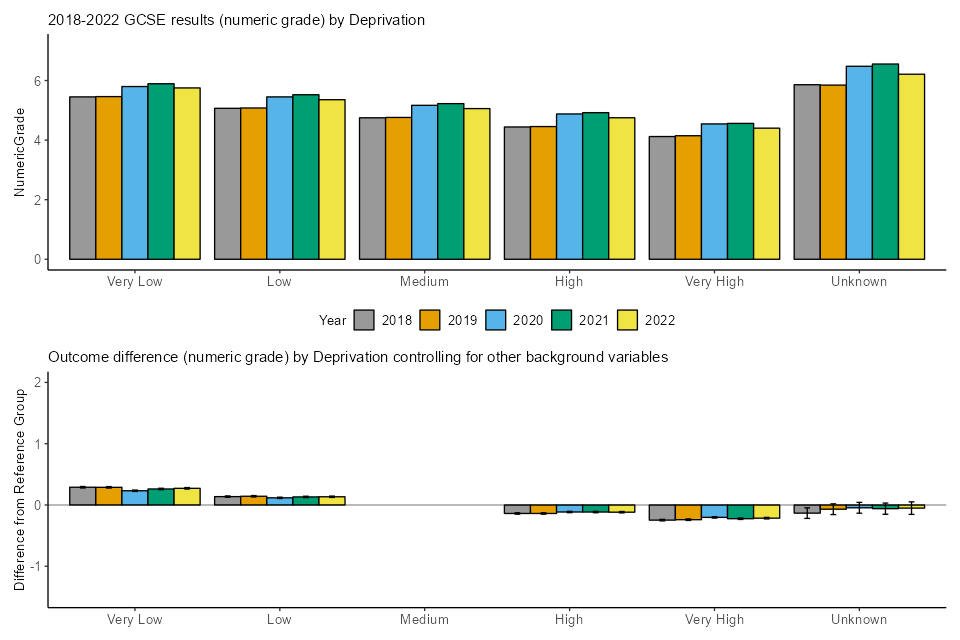
Figure GA.7 2018 to 2022 GCSE results (numeric grade) by prior attainment and outcome difference after controlling for other background variables

Figure GA.8 2018 to 2022 GCSE results (numeric grade) by region and outcome difference after controlling for other background variables
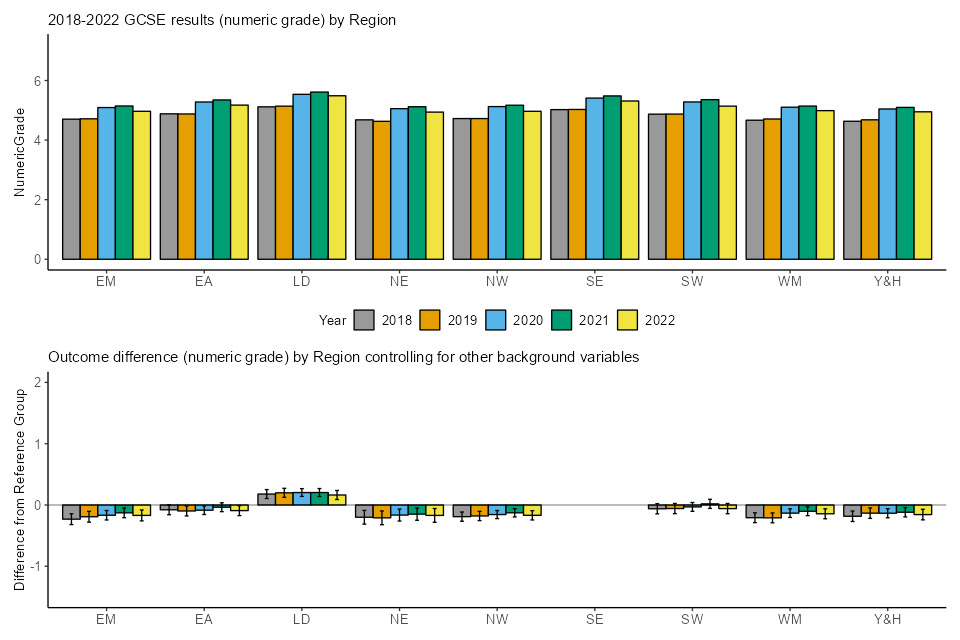
Figure GA.9 2018 to 2022 GCSE results (numeric grade) by centre type and outcome difference after controlling for other background variables

Table GA. Summary of 2018 to 2022 relative GCSE outcome differences (in numeric grade) after controlling for background variables
| Comparison | 2018 | 2019 | 2020 | 2021 | 2022 |
|---|---|---|---|---|---|
| Reference entry | 4.95 | 4.95 | 5.52 | 5.53 | 5.32 |
| Centre Type: Free Schools (Free) v Academies (Acad) | -0.20 | -0.21 | -0.06 | -0.05 | -0.29 |
| Centre Type: Further Education Establishment (FurE) v Academies (Acad) | -0.74 | -0.94 | -0.81 | -0.91 | -1.12 |
| Centre Type: Independent schools (Indp) v Academies (Acad) | 1.77 | 1.75 | 1.76 | 1.72 | 1.41 |
| Centre Type: Other v Academies (Acad) | -1.00 | -0.96 | -0.69 | -0.73 | -1.03 |
| Centre Type: Secondary Comprehensive School (SecComp) v Academies (Acad) | -0.06 | -0.06 | -0.04 | -0.03 | -0.05 |
| Centre Type: Secondary Modern or High School (SecMod) v Academies (Acad) | -0.25 | -0.22 | -0.16 | -0.16 | -0.21 |
| Centre Type: Secondary Selective School (SecSel) v Academies (Acad) | 0.87 | 0.85 | 0.73 | 0.71 | 0.84 |
| Centre Type: Sixth Form College (Sixth) v Academies (Acad) | 0.08 | 0.37 | 0.55 | 0.28 | 0.04 |
| Centre Type: Tertiary College (Tert) v Academies (Acad) | -0.55 | -0.58 | -0.43 | -0.49 | -0.83 |
| Ethnicity: Asian Bangladeshi (ABAN) v White British (WBRI) | 0.61 | 0.66 | 0.63 | 0.69 | 0.71 |
| Ethnicity: Asian Indian (AIND) v White British (WBRI) | 0.63 | 0.63 | 0.59 | 0.66 | 0.70 |
| Ethnicity: Any Other Asian Background (AOTH) v White British (WBRI) | 0.54 | 0.57 | 0.51 | 0.61 | 0.58 |
| Ethnicity: Asian Pakistani (APKN) v White British (WBRI) | 0.37 | 0.38 | 0.34 | 0.38 | 0.41 |
| Ethnicity: Black African (BAFR) v White British (WBRI) | 0.38 | 0.37 | 0.32 | 0.38 | 0.43 |
| Ethnicity: Black Caribbean (BCRB) v White British (WBRI) | -0.12 | -0.12 | -0.07 | -0.06 | -0.08 |
| Ethnicity: Any Other Black Background (BOTH) v White British (WBRI) | 0.20 | 0.18 | 0.18 | 0.22 | 0.27 |
| Ethnicity: Chinese (CHNE) v White British (WBRI) | 0.95 | 0.89 | 0.95 | 0.93 | 1.00 |
| Ethnicity: Any Other Mixed Background (MOTH) v White British (WBRI) | 0.24 | 0.26 | 0.19 | 0.23 | 0.26 |
| Ethnicity: Mixed White and Asian (MWAS) v White British (WBRI) | 0.27 | 0.30 | 0.30 | 0.28 | 0.36 |
| Ethnicity: Mixed White and Black African (MWBA) v White British (WBRI) | 0.13 | 0.22 | 0.17 | 0.17 | 0.22 |
| Ethnicity: Mixed White and Black Caribbean (MWBC) v White British (WBRI) | -0.11 | -0.10 | -0.11 | -0.13 | -0.12 |
| Ethnicity: Any Other Ethnic Group (OOTH) v White British (WBRI) | 0.34 | 0.31 | 0.28 | 0.36 | 0.38 |
| Ethnicity: White Irish (WIRI) v White British (WBRI) | 0.13 | 0.12 | 0.09 | 0.15 | 0.16 |
| Ethnicity: White Traveller of Irish Heritage (WIRT) v White British (WBRI) | -0.53 | -0.37 | -0.49 | -0.55 | -0.43 |
| Ethnicity: Any Other White Background (WOTH) v White British (WBRI) | 0.24 | 0.22 | 0.21 | 0.26 | 0.31 |
| Ethnicity: White Gypsy and Roma (WROM) v White British (WBRI) | -1.28 | -1.20 | -1.14 | -1.22 | -1.00 |
| Ethnicity: Unknown v White British (WBRI) | 0.02 | -0.01 | -0.01 | 0.05 | 0.07 |
| FSM: Eligible for FSM v Not Eligible for FSM (NotFSM) | -0.38 | -0.39 | -0.43 | -0.49 | -0.49 |
| FSM: Unknown v NotFSM | -0.34 | -0.36 | -0.09 | -0.02 | -0.07 |
| Gender: Male v Female | -0.39 | -0.40 | -0.43 | -0.40 | -0.34 |
| Deprivation: Very low v Medium | 0.29 | 0.29 | 0.23 | 0.26 | 0.27 |
| Deprivation: Low v Medium | 0.14 | 0.14 | 0.12 | 0.13 | 0.13 |
| Deprivation: High v Medium | -0.14 | -0.14 | -0.11 | -0.11 | -0.12 |
| Deprivation: Very high v Medium | -0.25 | -0.24 | -0.20 | -0.22 | -0.21 |
| Deprivation: Unknown v Medium | -0.13 | -0.07 | -0.05 | -0.06 | -0.05 |
| Major language: NotEnglish v English | 0.00 | 0.00 | 0.00 | 0.02 | 0.04 |
| Major language: Unknown v English | 0.00 | -0.03 | -0.23 | -0.18 | -0.13 |
| Prior attainment: Very low v Medium | -1.38 | -1.38 | -1.40 | -1.46 | -1.44 |
| Prior attainment: Low v Medium | -0.63 | -0.63 | -0.65 | -0.63 | -0.60 |
| Prior attainment: High v Medium | 0.70 | 0.71 | 0.70 | 0.69 | 0.66 |
| Prior attainment: Very high v Medium | 1.64 | 1.66 | 1.63 | 1.61 | 1.58 |
| Prior attainment: Unknown v Medium | -0.30 | -0.32 | -0.36 | -0.41 | -0.35 |
| Region: East Midlands (EM) v south-east (SE) | -0.23 | -0.19 | -0.17 | -0.13 | -0.17 |
| Region: East of England (EA) v south-east (SE) | -0.08 | -0.10 | -0.09 | -0.04 | -0.09 |
| Region: London (LD) v south-east (SE) | 0.18 | 0.20 | 0.20 | 0.20 | 0.16 |
| Region: north-east (NE) v south-east (SE) | -0.20 | -0.21 | -0.16 | -0.15 | -0.17 |
| Region: north-west (NW) v south-east (SE) | -0.19 | -0.18 | -0.16 | -0.13 | -0.17 |
| Region: south-west (SW) v south-east (SE) | -0.06 | -0.06 | -0.03 | 0.02 | -0.06 |
| Region: West Midlands (WM) v south-east (SE) | -0.21 | -0.21 | -0.13 | -0.10 | -0.14 |
| Region: Yorkshire and the Humber (Y&H) v south-east (SE) | -0.18 | -0.13 | -0.13 | -0.12 | -0.16 |
| SEND: Has SEND v Does Not Have SEND (NoSEND) | -0.76 | -0.72 | -0.73 | -0.76 | -0.68 |
The top charts in Figures GA.1-9 show that all groups saw an increase in their mean numeric grade in 2022 compared to 2019, and all except the White Gypsy and Roma group also saw a decrease compared to 2021. The top row of Table GA shows the grade awarded to an ‘average’ entry in 2018 to 2022. The 2021 to 2022 decrease of 0.21 of a grade and the 2019 to 2022 increase of 0.37 of a grade are notable, as would be expected given the changes to grading in this period.
From the bottom charts in Figures GA.1-9 as well as Table AA, using the multi-step method described above, we found that for GCSE:
- 44 of the 51 between-group comparisons (on gender, deprivation, major language, prior attainment, region and SEND) showed no notable change from 2019 to 2022.
- 44 of the 51 between-group comparisons (on FSM, gender, deprivation, major language, prior attainment, region and SEND) showed no notable change from 2021 to 2022.
- we do not list notable changes for ‘unknown’ categories here, but these are described further in the Methodology section.
The notable 2019 to 2022 changes are:
- Students in independent schools had higher outcomes than students in academies. The difference of 1.41 grade was 0.34 grade narrower than in 2019, having remained relatively stable throughout 2018 to 2021.
- Students in sixth form colleges had higher outcomes than students in academies. The difference of 0.04 grade was 0.34 grade narrower than in 2019. The gap widened during the pandemic, particularly in 2020, but is now at its narrowest compared to the other years included in this study.
- Students in tertiary colleges had lower outcomes than students in academies. The difference of 0.83 grade was 0.25 grade wider than in 2019.
- Chinese students had higher outcomes than White British students. The difference of 1 grade was 0.11 grade wider than in 2019.
- White Gypsy and Roma students had lower outcomes than White British students. The difference of 1 grade was 0.2 grade narrower than in 2019. This difference is now the narrowest of the years observed in this study.
- FSM-eligible students had lower outcomes than FSM-ineligible students. This difference of 0.49 grade was 0.1 grade wider than in 2019. This difference had also widened slightly in 2020 and 2021, before levelling in 2022 at a very similar point to 2021. On our other measure of deprivation, IDACI, we did not identify any notable changes, but we do see a slight narrowing of the difference between students in the very high deprivation group and those in the medium deprivation group, so the overall picture on deprivation is somewhat mixed.
The notable 2021 to 2022 changes are:
- Students in free schools had lower outcomes than students in academies. The difference of 0.29 grade was 0.24 grade wider than in 2021. This difference is more consistent, albeit slightly wider, than the difference seen prior to the pandemic, after having narrowed in 2020 and 2021.
- Students in further education colleges had lower outcomes than students in academies. The difference of 1.12 grade was 0.21 grade wider than in 2021.
- Students in ‘other’ centres had lower outcomes than students in academies. The difference of 1.03 grade was 0.31 grade wider than in 2021.
- Students in tertiary colleges had lower outcomes than students in academies. The difference of 0.83 grade was 0.35 grade wider than in 2021.
- Students in independent schools had higher outcomes than students in academies. The difference of 1.41 grade was 0.31 grade narrower than in 2021, after having remained fairly consistent between 2018 and 2021.
- Students in secondary selective schools had higher outcomes than students in academies. The difference of 0.84 grade was 0.13 grade wider than in 2021, and more in line with the differences seen prior to the pandemic.
- White Gypsy and Roma students had lower outcomes than White British students. The difference of 1 grade was 0.21 grade narrower than in 2021.
GCSE - probability of grade 7 and above
Figures GB.1-9 show breakdowns of 2018 to 2022 GCSE results on the measure of probability of grade 7 and above. Each figure refers to one background variable included in our analysis.
For each figure:
- the top chart displays the raw breakdowns of results for the period 2018 to 2022. Because results of the very small Unknown/Neither gender group are suppressed out of concern for disclosure, there are no bars for the group on the charts for gender.
- the bottom chart presents the results of the modelling, showing the relative outcome differences of the subgroups defined under each variable relative to their respective reference group, after controlling for other variables. In these charts, there are no bars for the reference groups because that is the group that we are comparing to.
The relative outcome differences shown in the charts, as well as keys for acronyms, are given in table GB below, with further details in Appendices C and E.
Figure GB.1 2018 to 2022 GCSE results (probability of grade 7 and above) by gender and outcome difference after controlling for other background variables
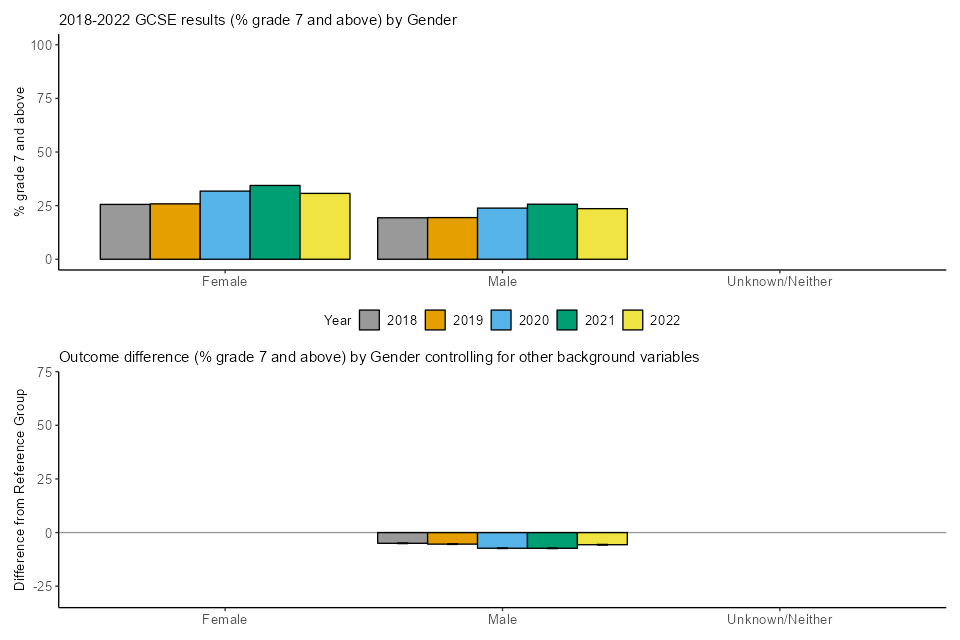
Figure GB.2 2018 to 2022 GCSE results (probability of grade 7 and above) by ethnicity and outcome difference after controlling for other background variables
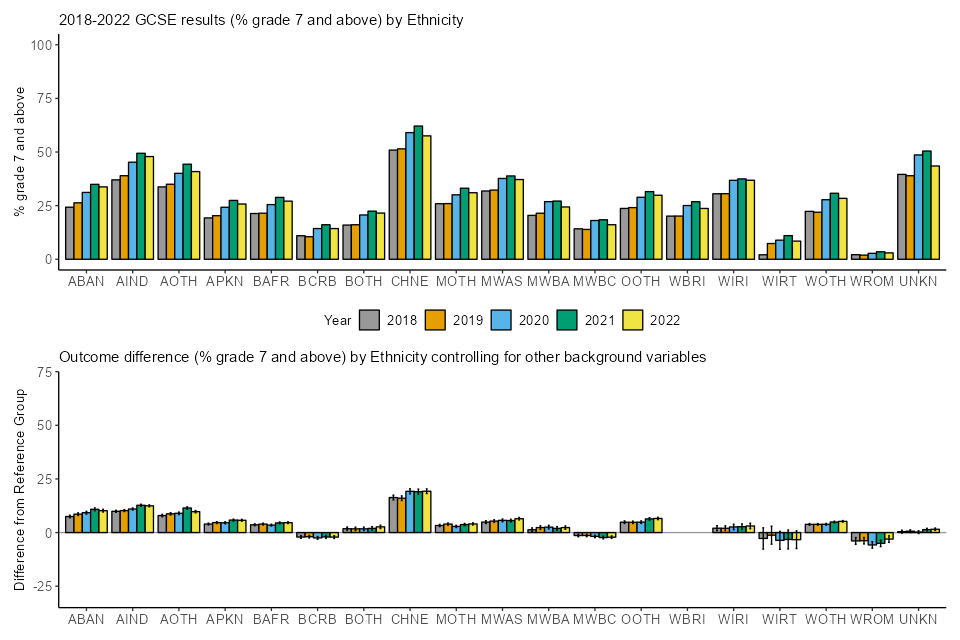
Figure GB.3 2018 to 2022 GCSE results (probability of grade 7 and above) by major language and outcome difference after controlling for other background variables
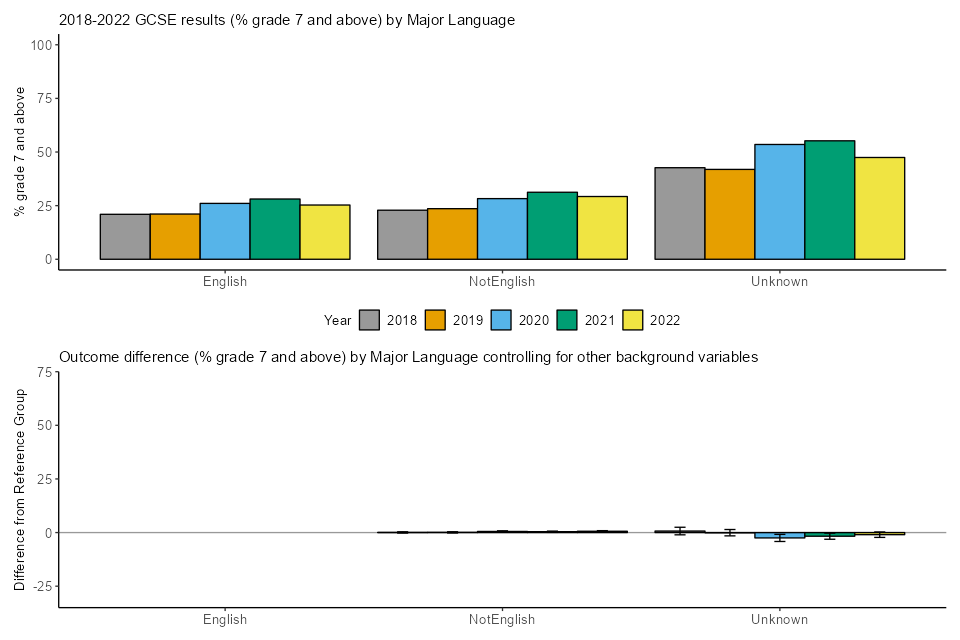
Figure GB.4 2018 to 2022 GCSE results (probability of grade 7 and above) by SEND status and outcome difference after controlling for other background variables
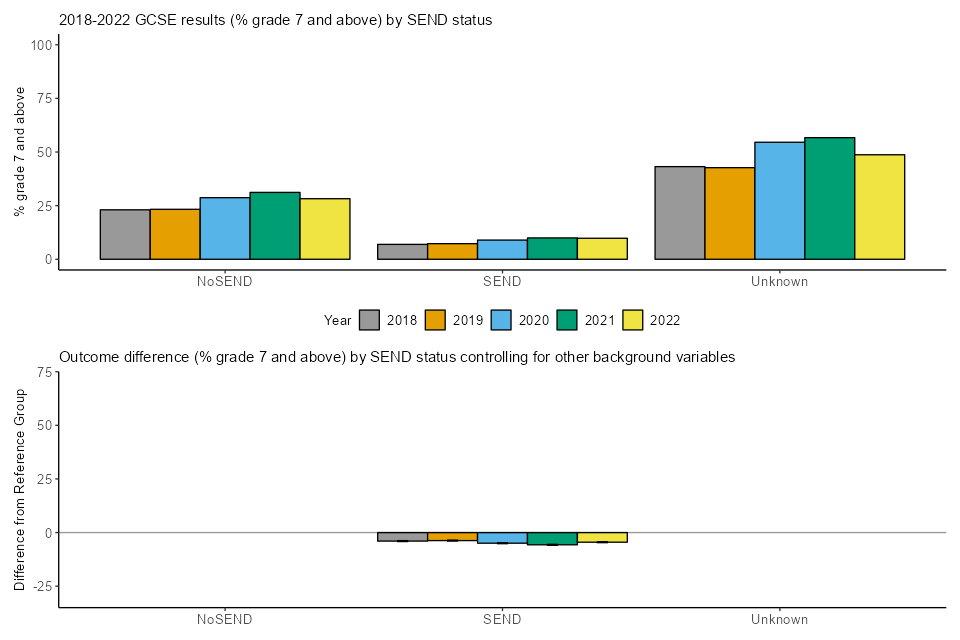
Figure GB.5 2018 to 2022 GCSE results (probability of grade 7 and above) by FSM eligibility status and outcome difference after controlling for other background variables

Figure GB.6 2018 to 2022 GCSE results (probability of grade 7 and above) by deprivation and outcome difference after controlling for other background variables
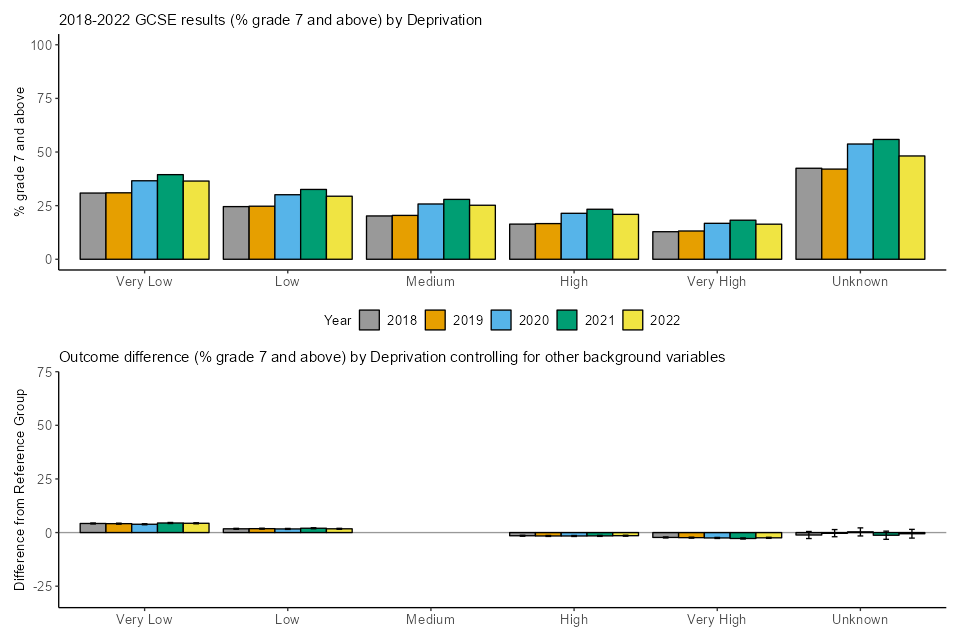
Figure GB.7 2018 to 2022 GCSE results (probability of grade 7 and above) by prior attainment and outcome difference after controlling for other background variables
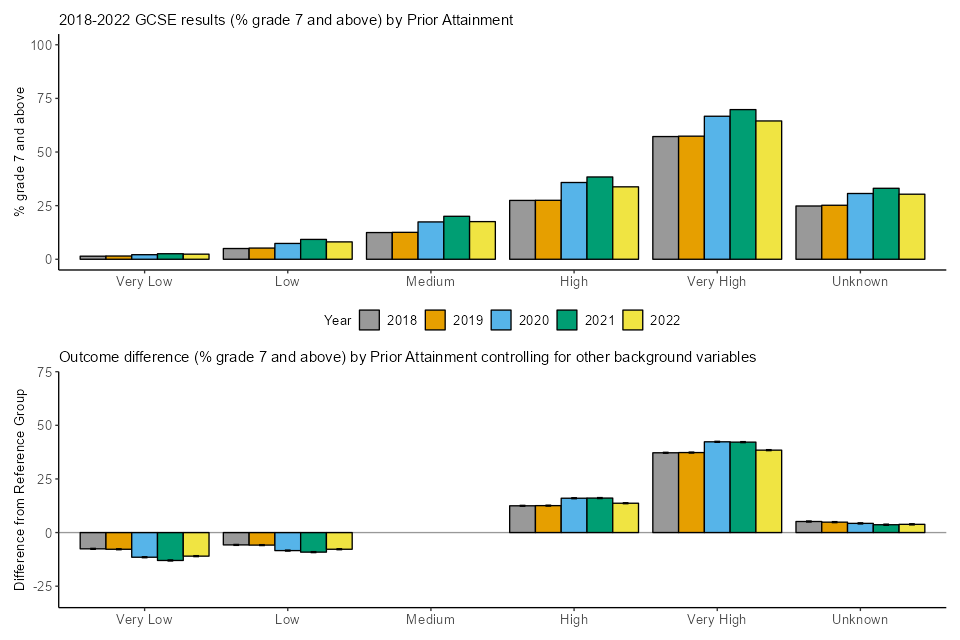
Figure GB.8 2018 to 2022 GCSE results (probability of grade 7 and above) by region and outcome difference after controlling for other background variables
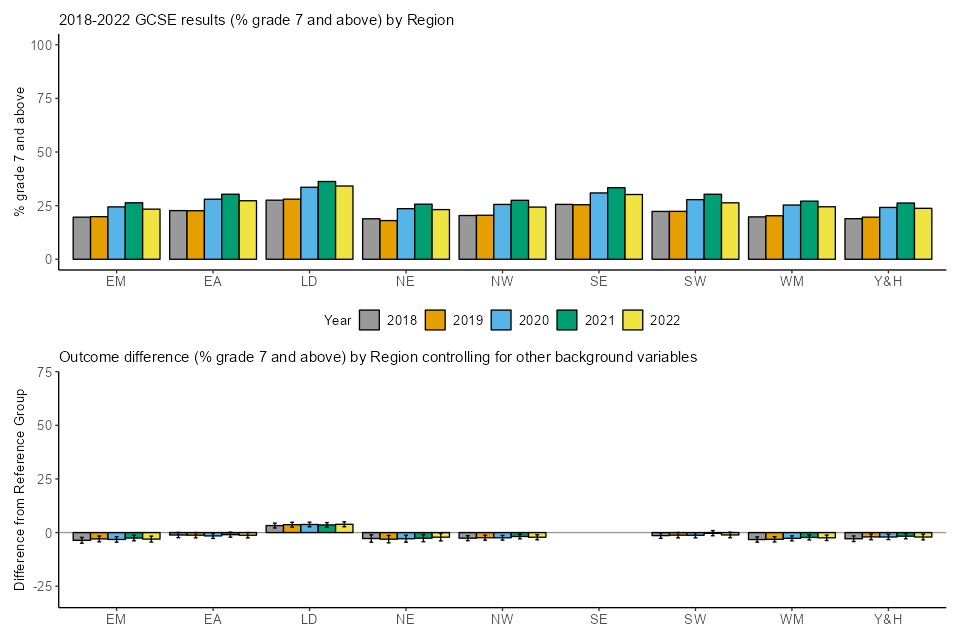
Figure GB.9 2018 to 2022 GCSE results (probability of grade 7 and above) by centre type and outcome difference after controlling for other background variables

Table GB. Summary of 2018 to 2022 relative GCSE outcome differences (in probability of grade 7 and above) after controlling for background variables
| Comparison | 2018 | 2019 | 2020 | 2021 | 2022 |
|---|---|---|---|---|---|
| Reference entry | 16.4% | 16.5% | 24.2% | 26.1% | 22.7% |
| Centre Type: Free Schools (Free) v Academies (Acad) | -1.1% | -1.5% | -0.2% | 1.0% | -1.4% |
| Centre Type: Further Education Establishment (FurE) v Academies (Acad) | -7.4% | -8.1% | -10.0% | -9.2% | -10.7% |
| Centre Type: Independent schools (Indp) v Academies (Acad) | 25.8% | 25.4% | 29.1% | 31.0% | 24.2% |
| Centre Type: Other v Academies (Acad) | -6.1% | -5.4% | -5.5% | -5.2% | -6.9% |
| Centre Type: Secondary Comprehensive School (SecComp) v Academies (Acad) | -1.6% | -1.7% | -1.4% | -1.0% | -1.8% |
| Centre Type: Secondary Modern or High School (SecMod) v Academies (Acad) | -3.9% | -3.7% | -3.6% | -2.8% | -4.3% |
| Centre Type: Secondary Selective School (SecSel) v Academies (Acad) | 16.0% | 16.6% | 15.3% | 14.1% | 16.9% |
| Centre Type: Sixth Form College (Sixth) v Academies (Acad) | -0.8% | 5.5% | 9.7% | 1.2% | -0.1% |
| Centre Type: Tertiary College (Tert) v Academies (Acad) | -6.9% | -6.9% | -6.4% | -5.5% | -6.0% |
| Ethnicity: Asian Bangladeshi (ABAN) v White British (WBRI) | 7.5% | 8.6% | 9.3% | 10.8% | 10.2% |
| Ethnicity: Asian Indian (AIND) v White British (WBRI) | 9.9% | 10.2% | 11.0% | 12.7% | 12.5% |
| Ethnicity: Any Other Asian Background (AOTH) v White British (WBRI) | 7.9% | 8.7% | 9.0% | 11.5% | 9.7% |
| Ethnicity: Asian Pakistani (APKN) v White British (WBRI) | 4.0% | 4.6% | 4.6% | 5.8% | 5.7% |
| Ethnicity: Black African (BAFR) v White British (WBRI) | 3.6% | 4.0% | 3.5% | 4.5% | 4.6% |
| Ethnicity: Black Caribbean (BCRB) v White British (WBRI) | -2.1% | -1.9% | -2.5% | -2.0% | -2.1% |
| Ethnicity: Any Other Black Background (BOTH) v White British (WBRI) | 1.8% | 1.7% | 1.7% | 1.9% | 2.7% |
| Ethnicity: Chinese (CHNE) v White British (WBRI) | 16.3% | 16.0% | 19.2% | 19.1% | 19.3% |
| Ethnicity: Any Other Mixed Background (MOTH) v White British (WBRI) | 3.3% | 4.0% | 2.9% | 3.7% | 4.0% |
| Ethnicity: Mixed White and Asian (MWAS) v White British (WBRI) | 4.9% | 5.4% | 5.7% | 5.6% | 6.5% |
| Ethnicity: Mixed White and Black African (MWBA) v White British (WBRI) | 1.3% | 2.3% | 2.5% | 2.0% | 2.3% |
| Ethnicity: Mixed White and Black Caribbean (MWBC) v White British (WBRI) | -1.4% | -1.4% | -1.8% | -2.3% | -2.1% |
| Ethnicity: Any Other Ethnic Group (OOTH) v White British (WBRI) | 4.8% | 4.8% | 4.9% | 6.4% | 6.6% |
| Ethnicity: White Irish (WIRI) v White British (WBRI) | 2.0% | 2.0% | 2.6% | 2.8% | 3.1% |
| Ethnicity: White Traveller of Irish Heritage (WIRT) v White British (WBRI) | -2.7% | -1.2% | -3.6% | -3.2% | -3.3% |
| Ethnicity: Any Other White Background (WOTH) v White British (WBRI) | 3.8% | 3.8% | 3.9% | 4.9% | 5.2% |
| Ethnicity: White Gypsy and Roma (WROM) v White British (WBRI) | -3.9% | -3.8% | -5.8% | -5.0% | -3.0% |
| Ethnicity: Unknown v White British (WBRI) | 0.4% | 0.6% | 0.2% | 1.4% | 1.5% |
| FSM: Eligible for FSM (FSM) v Not Eligible for FSM (NotFSM) | -2.8% | -2.9% | -4.0% | -5.0% | -4.5% |
| FSM: Unknown v NotFSM | -1.8% | -2.5% | 1.0% | 0.4% | -0.7% |
| Gender: Male v Female | -5.0% | -5.4% | -7.3% | -7.3% | -5.7% |
| Deprivation: Very low v Medium | 4.2% | 4.2% | 3.9% | 4.5% | 4.3% |
| Deprivation: Low v Medium | 1.8% | 1.8% | 1.7% | 2.0% | 1.8% |
| Deprivation: High v Medium | -1.5% | -1.6% | -1.6% | -1.6% | -1.5% |
| Deprivation: Very high v Medium | -2.3% | -2.4% | -2.5% | -2.8% | -2.4% |
| Deprivation: Unknown v Medium | -1.1% | -0.3% | 0.3% | -1.2% | -0.5% |
| Major language: NotEnglish v English | 0.1% | 0.1% | 0.5% | 0.4% | 0.6% |
| Major language: Unknown v English | 0.7% | -0.1% | -2.5% | -1.7% | -1.0% |
| Prior attainment: Very low v Medium | -7.6% | -7.8% | -11.5% | -13.0% | -11.0% |
| Prior attainment: Low v Medium | -5.8% | -5.8% | -8.4% | -9.1% | -7.8% |
| Prior attainment: High v Medium | 12.5% | 12.6% | 16.0% | 16.1% | 13.7% |
| Prior attainment: Very high v Medium | 37.2% | 37.3% | 42.3% | 42.2% | 38.4% |
| Prior attainment: Unknown v Medium | 5.2% | 4.9% | 4.3% | 3.7% | 3.8% |
| Region: East Midlands (EM) v south-east (SE) | -3.6% | -3.0% | -3.2% | -2.6% | -3.0% |
| Region: East of England (EA) v south-east (SE) | -1.1% | -1.2% | -1.6% | -1.0% | -1.3% |
| Region: London (LD) v south-east (SE) | 3.3% | 3.7% | 3.8% | 3.6% | 3.9% |
| Region: north-east (NE) v south-east (SE) | -2.8% | -3.1% | -2.9% | -2.6% | -2.2% |
| Region: north-west (NW) v south-east (SE) | -2.6% | -2.4% | -2.4% | -1.8% | -2.2% |
| Region: south-west (SW) v south-east (SE) | -1.4% | -1.2% | -1.3% | -0.3% | -1.1% |
| Region: West Midlands (WM) v south-east (SE) | -3.3% | -3.1% | -2.7% | -2.3% | -2.4% |
| Region: Yorkshire and the Humber (Y&H) v south-east (SE) | -2.9% | -2.0% | -2.1% | -1.7% | -2.1% |
| SEND: Has SEND v Does Not Have SEND (NoSEND) | -4.0% | -3.7% | -5.0% | -5.7% | -4.5% |
The top charts in Figures GB.1-9 show that all groups saw an increase in their probability of grade 7 and above in 2022 compared to 2019, and all except the tertiary college group also saw a decrease compared to 2021. The top row of Table GB shows the probability of an ‘average’ entry being awarded grade A and above in 2018 to 2022. The 2021 to 2022 decrease of 3.3 percentage points and the 2019 to 2022 increase of 6.3 percentage points are notable, as would be expected given the changes to grading in this period.
From the bottom charts in Figures GB.1-9 as well as Table GB, using the multi-step method described above, we found that:
- 32 of the 51 between-group comparisons showed no notable change from 2019 to 2022;
- 37 of the 51 between-group comparisons showed no notable change from 2021 to 2022.
- we do not list notable changes for ‘unknown’ categories here, but these are described further in the Methodology section.
The notable 2019 to 2022 changes are:
- Students in further education colleges and ‘other’ centres had lower outcomes than students in academies. The differences of 10.7 and 6.9 percentage points were 2.6 and 1.5 percentage points wider than in 2019 respectively.
- Students in independent schools had higher outcomes than students in academies. The difference of 24.2 percentage points was 1.2 percentage points narrower than in 2019.
- Asian Bangladeshi, Asian Indian, Asian Other, Asian Pakistani, Chinese, Mixed White and Asian, Any Other Ethnic Group, White Irish and White Other students had higher outcomes than White British students. The differences of 10.2, 12.5, 9.7, 5.7, 19.3, 6.5, 6.6, 3.1 and 5.2 percentage points were 1.6, 2.2, 1.0, 1.1, 3.3, 1.1, 1.8, 1.1 and 1.4 percentage points wider than in 2019 respectively.
- FSM-eligible students had lower outcomes than FSM-ineligible students. The difference of 4.5 percentage points was 1.7 percentage points wider than in 2019 and slightly narrower than in 2021, after having widened in both 2020 and 2021.
- Students with unknown FSM eligibility status had lower outcomes than FSM-ineligible students. The difference of 0.7 percentage points was 1.9 percentage points narrower than in 2019.
- Students with very low and low prior attainment had lower outcomes than students with medium prior attainment. The differences of 11.0 and 7.8 percentage points were 3.2 and 1.9 percentage points wider than in 2019 respectively.
- Students with high and very high prior attainment had higher outcomes than students with medium prior attainment. The differences of 13.7 and 38.4 percentage points were 1.1 and 1.1 percentage points wider than in 2019 respectively.
- Students with unknown prior attainment had higher outcomes than students with medium prior attainment. The difference of 3.8 percentage points was 1.0 percentage points narrower than in 2019.
The notable 2021 to 2022 changes are:
- Students in further education colleges, ‘other’ centres and secondary modern schools had lower outcomes than students in academies. The differences of 10.7, 6.9 and 4.3 percentage points were 1.5, 1.7 and 1.5 percentage points wider than in 2021 respectively.
- Students in independent schools had higher outcomes than students in academies. The difference of 24.2 percentage points was 6.8 percentage points narrower than in 2021. The difference had widened in 2020 and 2021, but is now the smallest difference seen across all years included in the model.
- Students in secondary selective schools had higher outcomes than students in academies. The difference of 16.9 percentage points was 2.9 percentage points wider than in 2021, following a slight narrowing of the difference in 2020 and 2021.
- Asian Other students had higher outcomes than White British students. The difference of 9.7 percentage points was 1.7 percentage points narrower than in 2021.
- White Gypsy and Roma students had lower outcomes than White British students. The difference of 3.0 percentage points was 2.0 percentage points narrower than in 2021.
- Students with unknown FSM eligibility status had lower outcomes than FSM-ineligible students. The difference of 0.7 percentage points reversed the difference in 2021 when students with unknown FSM eligibility had higher outcomes than FSM-ineligible students.
- Male students had lower outcomes than female students. The difference of 5.7 percentage points was 1.7 percentage points narrower than in 2021, after having widened in both 2020 and 2021.
- Students with very low and low prior attainment had lower outcomes than students with medium prior attainment. The differences of 11.0 and 7.8 percentage points were 2.0 and 1.3 percentage points narrower than in 2021 respectively.
- Students with high and very high prior attainment had higher outcomes than students with medium prior attainment. The differences of 13.7 and 38.4 percentage points were 2.4 and 3.7 percentage points narrower than in 2021 respectively.
- Students with SEND had lower outcomes than students without SEND. The difference of 4.5 percentage points was 1.2 percentage points narrower than in 2021 but wider than in pre-pandemic years.
GCSE - probability of grade 4 and above
Figures GC.1-9 show breakdowns of 2018 to 2022 GCSE results on the measure of probability of grade 4 and above. Each figure refers to one background variable included in our analysis.
For each figure:
- the top chart displays the raw breakdowns of results for the period 2018 to 2022. Because results of the very small Unknown/Neither gender group are suppressed out of concern for disclosure, there are no bars for the group on the charts for gender.
- the bottom chart presents the results of the modelling, showing the relative outcome differences of the subgroups defined under each variable relative to their respective reference group, after controlling for other variables. In these charts, there are no bars for the reference groups because that is the group that we are comparing to.
The relative outcome differences for the charts below, as well as keys for acronyms, are given in table GC below, with further details in Appendices C and E.
Figure GC.1 2018 to 2022 GCSE results (probability of grade 4 and above) by gender and outcome difference after controlling for other background variables

Figure GC.2 2018 to 2022 GCSE results (probability of grade 4 and above) by ethnicity and outcome difference after controlling for other background variables
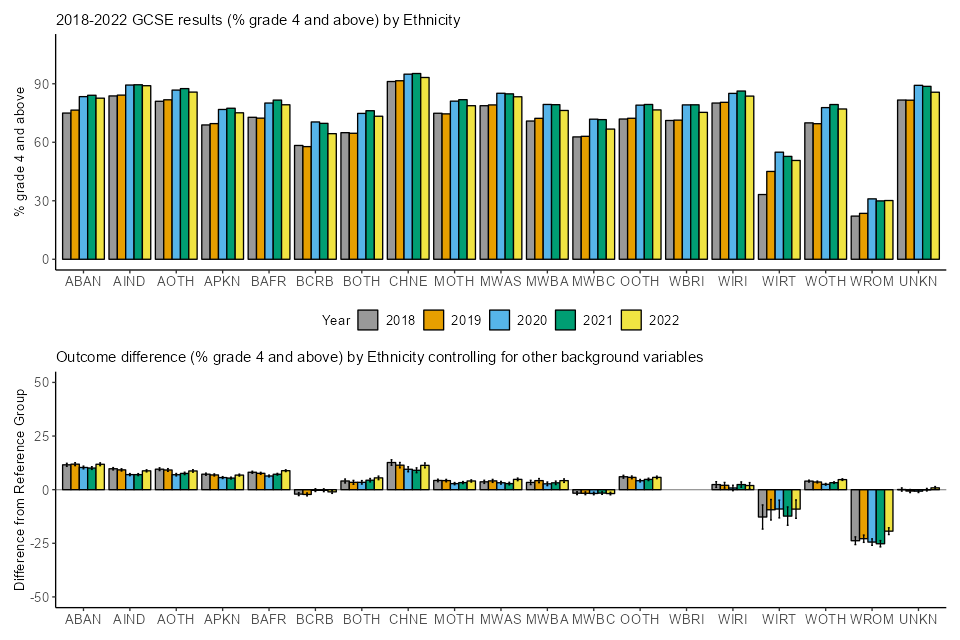
Figure GC.3 2018 to 2022 GCSE results (probability of grade 4 and above) by major language and outcome difference after controlling for other background variables
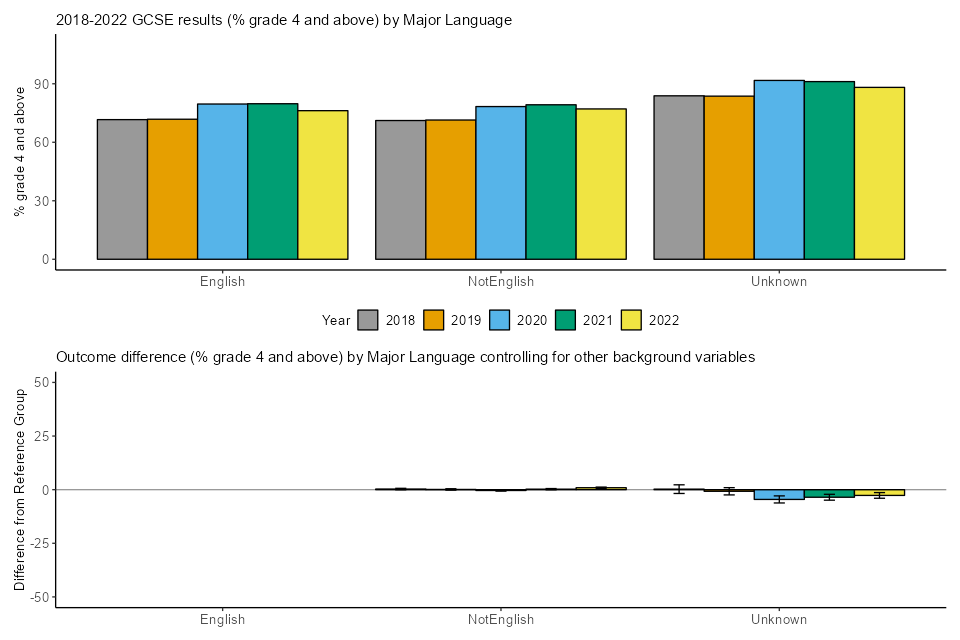
Figure GC.4 2018 to 2022 GCSE results (probability of grade 4 and above) by SEND status and outcome difference after controlling for other background variables
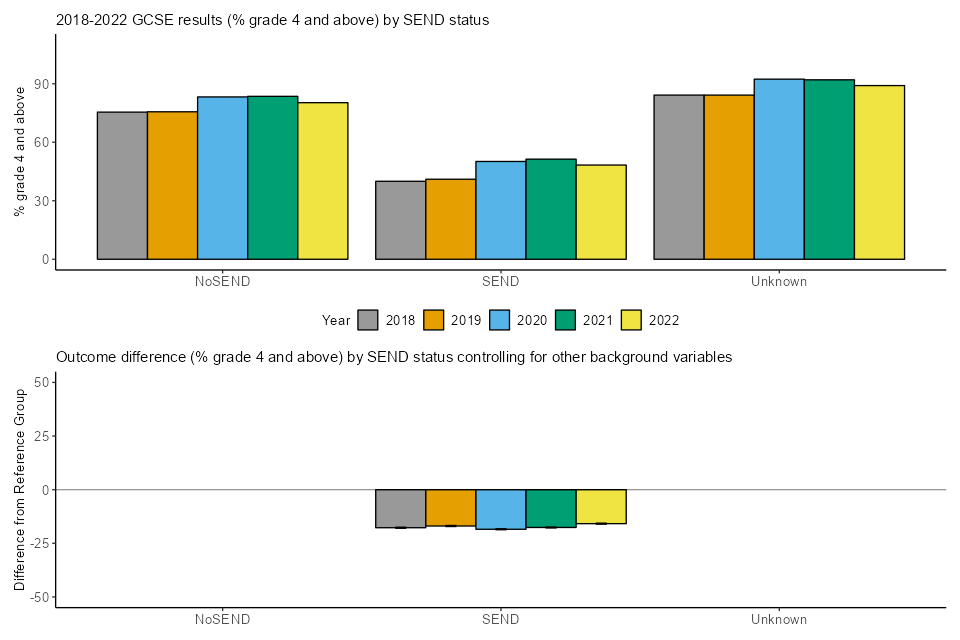
Figure GC.5 2018 to 2022 GCSE results (probability of grade 4 and above) by FSM eligibility status and outcome difference after controlling for other background variables
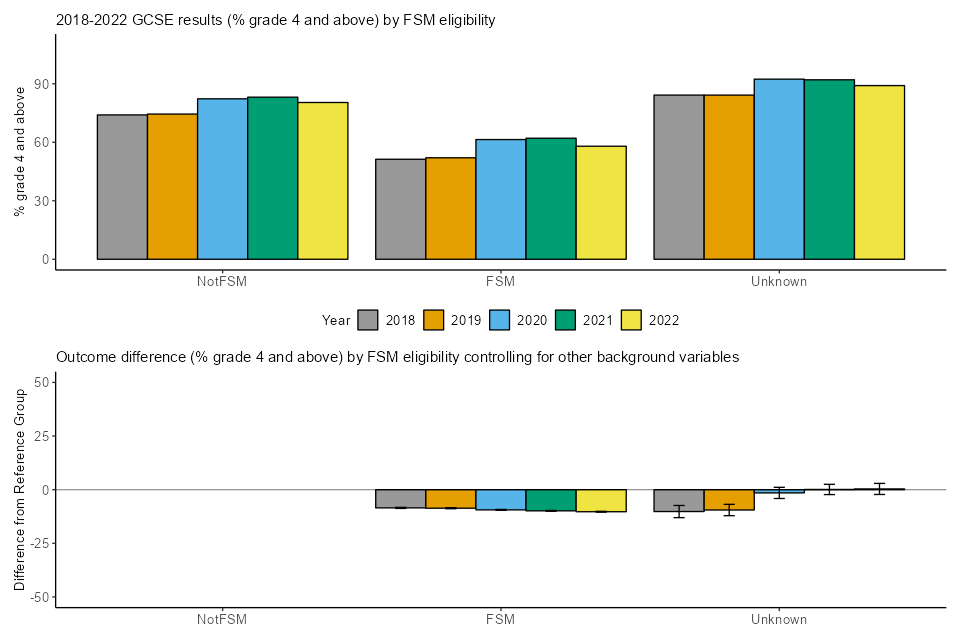
Figure GC.6 2018 to 2022 GCSE results (probability of grade 4 and above) by deprivation and outcome difference after controlling for other background variables
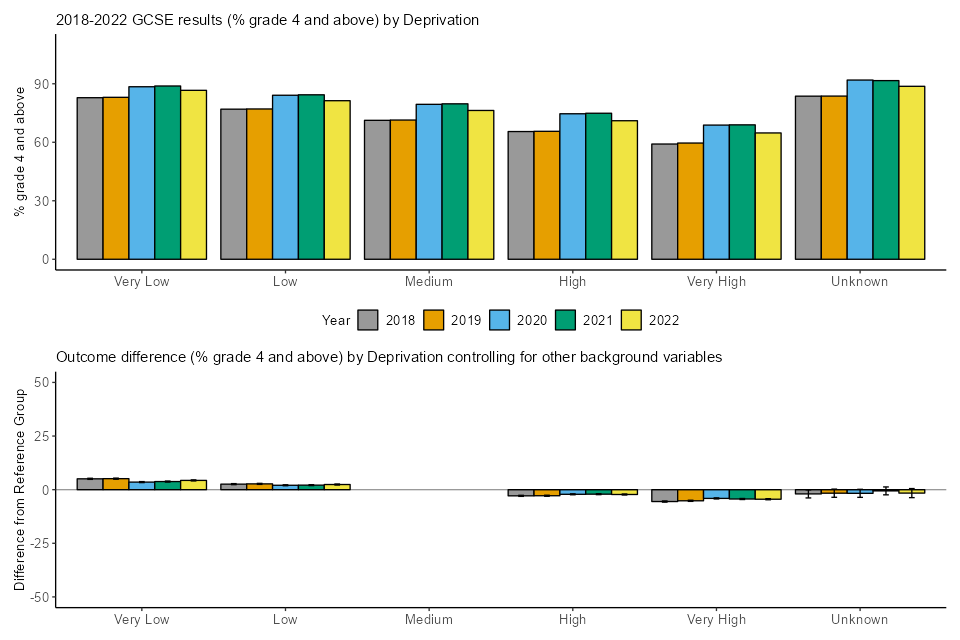
Figure GC.7 2018 to 2022 GCSE results (probability of grade 4 and above) by prior attainment and outcome difference after controlling for other background variables
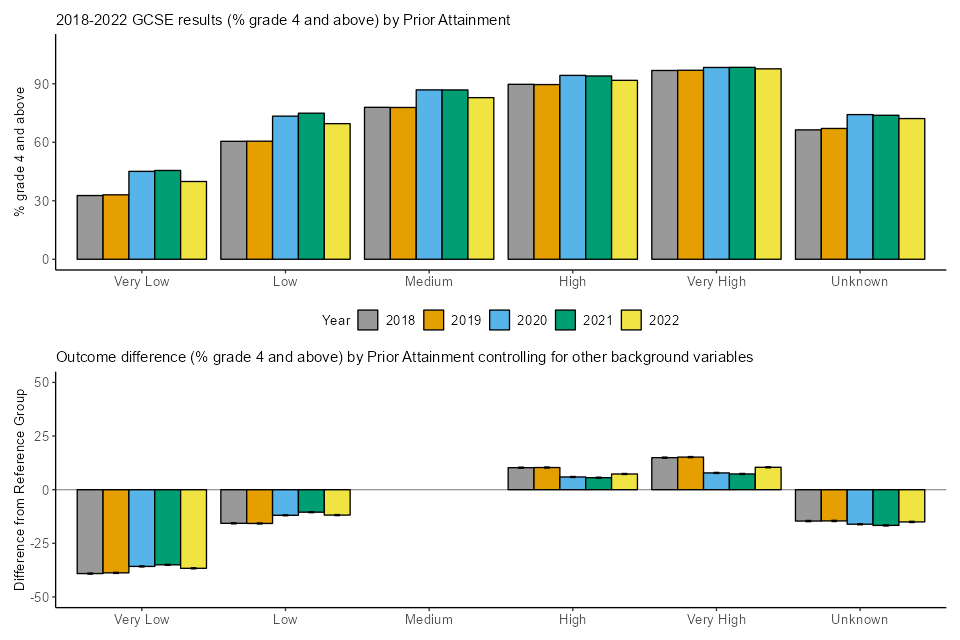
Figure GC.8 2018 to 2022 GCSE results (probability of grade 4 and above) by region and outcome difference after controlling for other background variables
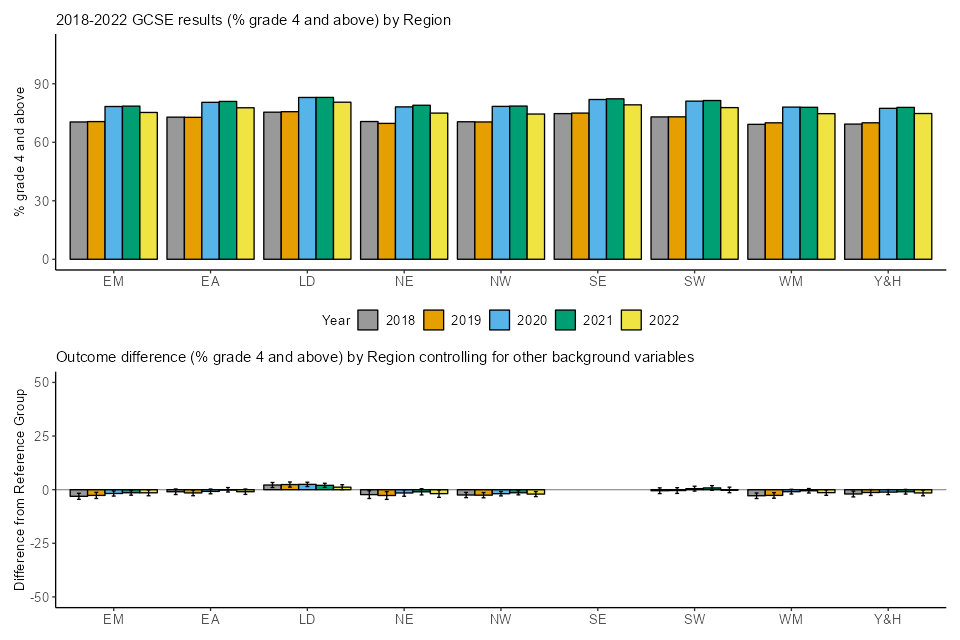
Figure GC.9 2018 to 2022 GCSE results (probability of grade 4 and above) by centre type and outcome difference after controlling for other background variables

Table GC. Summary of 2018 to 2022 relative GCSE outcome differences (in probability of grade 4 and above) after controlling for background variables
| Comparison | 2018 | 2019 | 2020 | 2021 | 2022 |
|---|---|---|---|---|---|
| Reference entry | 81.5% | 81.4% | 93.3% | 91.8% | 86.7% |
| Centre Type: Free Schools (Free) v Academies (Acad) | -3.1% | -3.6% | -1.5% | -2.0% | -5.6% |
| Centre Type: Further Education Establishment (FurE) v Academies (Acad) | -16.2% | -21.6% | -20.5% | -17.8% | -26.4% |
| Centre Type: Independent schools (Indp) v Academies (Acad) | 31.5% | 31.4% | 24.8% | 20.8% | 19.9% |
| Centre Type: Other v Academies (Acad) | -22.1% | -21.6% | -16.4% | -15.8% | -23.6% |
| Centre Type: Secondary Comprehensive School (SecComp) v Academies (Acad) | -0.4% | -0.5% | -0.1% | 0.0% | 0.0% |
| Centre Type: Secondary Modern or High School (SecMod) v Academies (Acad) | -3.5% | -3.0% | -1.5% | -2.6% | -2.4% |
| Centre Type: Secondary Selective School (SecSel) v Academies (Acad) | 9.8% | 9.1% | 6.7% | 6.2% | 7.4% |
| Centre Type: Sixth Form College (Sixth) v Academies (Acad) | 2.1% | 8.5% | 5.4% | 5.0% | 0.3% |
| Centre Type: Tertiary College (Tert) v Academies (Acad) | -7.7% | -8.6% | -9.1% | -8.1% | -18.5% |
| Ethnicity: Asian Bangladeshi (ABAN) v White British (WBRI) | 11.6% | 11.9% | 10.3% | 10.1% | 11.8% |
| Ethnicity: Asian Indian (AIND) v White British (WBRI) | 9.7% | 9.2% | 7.0% | 7.0% | 8.8% |
| Ethnicity: Any Other Asian Background (AOTH) v White British (WBRI) | 9.5% | 9.2% | 7.0% | 7.6% | 8.7% |
| Ethnicity: Asian Pakistani (APKN) v White British (WBRI) | 7.2% | 6.9% | 5.6% | 5.4% | 6.8% |
| Ethnicity: Black African (BAFR) v White British (WBRI) | 8.1% | 7.6% | 6.4% | 7.2% | 8.8% |
| Ethnicity: Black Caribbean (BCRB) v White British (WBRI) | -2.1% | -2.2% | -0.2% | -0.3% | -1.0% |
| Ethnicity: Any Other Black Background (BOTH) v White British (WBRI) | 4.0% | 3.4% | 3.4% | 4.4% | 5.5% |
| Ethnicity: Chinese (CHNE) v White British (WBRI) | 12.7% | 11.4% | 9.5% | 9.0% | 11.3% |
| Ethnicity: Any Other Mixed Background (MOTH) v White British (WBRI) | 4.3% | 4.2% | 2.8% | 3.3% | 4.1% |
| Ethnicity: Mixed White and Asian (MWAS) v White British (WBRI) | 3.7% | 4.1% | 3.2% | 2.8% | 4.8% |
| Ethnicity: Mixed White and Black African (MWBA) v White British (WBRI) | 3.4% | 4.2% | 2.7% | 3.2% | 4.2% |
| Ethnicity: Mixed White and Black Caribbean (MWBC) v White British (WBRI) | -1.6% | -1.7% | -1.8% | -1.6% | -1.8% |
| Ethnicity: Any Other Ethnic Group (OOTH) v White British (WBRI) | 6.0% | 5.7% | 4.2% | 4.8% | 5.7% |
| Ethnicity: White Irish (WIRI) v White British (WBRI) | 2.4% | 2.0% | 0.8% | 2.4% | 1.9% |
| Ethnicity: White Traveller of Irish Heritage (WIRT) v White British (WBRI) | -12.7% | -9.4% | -9.0% | -12.3% | -9.1% |
| Ethnicity: Any Other White Background (WOTH) v White British (WBRI) | 4.0% | 3.6% | 2.5% | 3.3% | 4.7% |
| Ethnicity: White Gypsy and Roma (WROM) v White British (WBRI) | -23.8% | -22.9% | -24.4% | -25.2% | -19.3% |
| Ethnicity: Unknown v White British (WBRI) | 0.1% | -0.6% | -0.7% | 0.0% | 0.8% |
| FSM: Eligible for FSM v Not Eligible for FSM (NotFSM) | -8.5% | -8.6% | -9.4% | -9.9% | -10.3% |
| FSM: Unknown v NotFSM | -10.2% | -9.5% | -1.5% | 0.1% | 0.3% |
| Gender: Male v Female | -7.2% | -7.3% | -6.6% | -5.0% | -4.9% |
| Deprivation: Very low v Medium | 5.1% | 5.1% | 3.5% | 3.8% | 4.3% |
| Deprivation: Low v Medium | 2.6% | 2.7% | 2.1% | 2.1% | 2.4% |
| Deprivation: High v Medium | -2.9% | -2.8% | -2.2% | -2.1% | -2.2% |
| Deprivation: Very high v Medium | -5.5% | -5.2% | -4.1% | -4.4% | -4.5% |
| Deprivation: Unknown v Medium | -2.0% | -1.6% | -1.7% | -0.6% | -1.6% |
| Major language: NotEnglish v English | 0.3% | 0.1% | -0.4% | 0.2% | 0.9% |
| Major language: Unknown v English | 0.2% | -0.8% | -4.5% | -3.5% | -2.7% |
| Prior attainment: Very low v Medium | -39.1% | -38.8% | -35.8% | -35.0% | -36.7% |
| Prior attainment: Low v Medium | -15.7% | -15.8% | -11.9% | -10.5% | -11.9% |
| Prior attainment: High v Medium | 10.3% | 10.3% | 5.9% | 5.6% | 7.3% |
| Prior attainment: Very high v Medium | 14.9% | 15.2% | 7.8% | 7.3% | 10.4% |
| Prior attainment: Unknown v Medium | -14.6% | -14.6% | -16.1% | -16.7% | -15.0% |
| Region: East Midlands (EM) v south-east (SE) | -3.1% | -2.7% | -1.8% | -1.4% | -1.5% |
| Region: East of England (EA) v south-east (SE) | -1.0% | -1.5% | -0.8% | -0.1% | -1.0% |
| Region: London (LD) v south-east (SE) | 2.2% | 2.4% | 2.5% | 2.0% | 1.2% |
| Region: north-east (NE) v south-east (SE) | -2.3% | -2.7% | -1.5% | -1.0% | -1.8% |
| Region: north-west (NW) v south-east (SE) | -2.5% | -2.6% | -1.9% | -1.4% | -2.1% |
| Region: south-west (SW) v south-east (SE) | -0.5% | -0.4% | 0.5% | 0.8% | -0.1% |
| Region: West Midlands (WM) v south-east (SE) | -2.8% | -2.7% | -0.9% | -0.5% | -1.4% |
| Region: Yorkshire and the Humber (Y&H) v south-east (SE) | -2.0% | -1.3% | -1.1% | -1.0% | -1.5% |
| SEND: Has SEND v Does Not Have SEND (NoSEND) | -17.7% | -16.9% | -18.5% | -17.6% | -15.8% |
The top charts in Figures GC.1-9 show that all except the White Gypsy and Roma group saw a decrease in their probability of attaining grade 4 and above in 2022 compared to 2021, and all except the sixth form college group also saw an increase compared to 2019.
The top row of Table GC shows the probability of an ‘average’ entry being awarded grade 4 and above in 2018 to 2022. The 2021 to 2022 decrease of 5.1 percentage points and the 2019 to 2022 increase of 5.3 percentage points are notable, as would be expected given the changes to grading in this period.
From the bottom charts in Figures GC.1-9 as well as Table GC, using the multi-step method described above, we found that:
- 28 of the 51 between-group comparisons showed no notable change from 2019 to 2022.
- 28 of the 51 between-group comparisons showed no notable change from 2021 to 2022.
- we do not list notable changes for ‘unknown’ categories here, but these are described further in the Methodology section.
The notable 2019 to 2022 changes are:
- Students in free schools, ‘other’ centres and tertiary colleges had lower outcomes than students in academies. The differences of 5.6, 23.6 and 18.5 percentage points were 2.1, 2.0 and 9.9 percentage points wider than in 2019 respectively.
- Students in independent schools and secondary selective schools had higher outcomes than students in academies. The differences of 19.9 and 7.4 percentage points were 11.5 and 1.7 percentage points narrower than in 2019.
- Black African, Black Other and White Other students had higher outcomes than White British students. The differences of 8.8, 5.5 and 4.7 percentage points were 1.2, 2.1 and 1.1 percentage points wider than in 2019 respectively.
- Black Caribbean and White Gypsy and Roma students had lower outcomes than White British students. The differences of 1.0 and 19.3 percentage points were 1.2 and 3.5 percentage points narrower than in 2019 respectively.
- FSM-eligible students had lower outcomes than FSM-ineligible students. The difference of 10.3 percentage points was 1.6 percentage points wider than in 2019, and had also widened in both 2020 and 2021
- Male students had lower outcomes than female students. The difference of 4.9 percentage points was 2.4 percentage points narrower than in 2019, and has been gradually narrowing since 2018
- Students with very low and low prior attainment had lower outcomes than students with medium prior attainment. The differences of 36.7 and 11.9 percentage points were 2.1 and 3.9 percentage points narrower than in 2019 respectively.
- Students with high and very high prior attainment had higher outcomes than students with medium prior attainment. These differences of 7.3 and 10.4 percentage points were 3.0 and 4.8 percentage points narrower than in 2019 respectively.
- Students in East Midlands and West Midlands had lower outcomes than students in the south-east. The differences of 1.5 and 1.4 percentage points were 1.2 and 1.3 percentage points narrower than in 2019 respectively.
- Students in London had higher outcomes than students in the south-east. The difference of 1.2 percentage points was 1.2 percentage points narrower than in 2019 when it stood at 2.4 percentage points.
- Students with SEND had lower outcomes than students without SEND. The difference of 15.8 percentage points was 1.1 percentage points narrower than in 2019.
The notable 2021 to 2022 changes are:
- Students in free schools, further education colleges, ‘other’ centres and tertiary colleges had lower outcomes than students in academies. The differences of 5.6 26.4, 23.6 and 18.5 percentage points were 3.7, 8.6, 7.8 and 10.4 percentage points wider than in 2021 respectively.
- Students in secondary selective schools had higher outcomes than students in academies. The difference of 7.4 percentage points was 1.2 percentage points wider than in 2021, having narrowed in both 2020 and 2021, but remains lower than in 2018 and 2019.
- Asian Bangladeshi, Asian Indian, Asian Other, Asian Pakistani, Black African, Black Other, Chinese, Mixed White and Asian, Mixed White and Black African, and White Other students had higher outcomes than White British students. The differences of 11.8, 8.8, 8.7, 6.8, 8.8, 5.5, 11.3, 4.8, 4.2 and 4.7 percentage points were 1.8, 1.8, 1.2, 1.4, 1.7, 1.1, 2.3, 2.0, 1.0 and 1.4 percentage points wider than in 2021 respectively.
- White Gypsy and Roma students had lower outcomes than White British students. The difference of 19.3 percentage points was 5.9 percentage points narrower than in 2021.
- Students with very low and low prior attainment had lower outcomes than students with medium prior attainment. The differences of 36.7 and 11.9 percentage points were 1.6 and 1.4 percentage points wider than in 2021 respectively.
- Students with high and very high prior attainment had higher outcomes than students with medium prior attainment. The differences of 7.3 and 10.4 percentage points were 1.7 and 3.1 percentage points wider than in 2021 respectively.
- Students with SEND had lower outcomes than students without SEND. The difference of 15.8 percentage points was 1.8 percentage points narrower than in 2021.
Vocational and technical qualifications
Methodology
Data
The analysis includes vocational and technical qualifications (VTQs) included in the Department for Education’s performance tables, specifically Level 1/2 Technical Awards and Technical Certificates, and Level 3 Applied Generals and Tech Level qualifications.
We evaluated the impact of each demographic and socioeconomic characteristic on students’ results this year, once other factors were controlled for. This allows us to examine the differences in attainment associated with gender, ethnicity and socioeconomic status, once other factors are controlled for, and how they have changed over several consecutive years from 2018 to 2022.
We focused on the students’ achievement of top grades rather than other points of the grading scale. The variety of grading scales used in these VTQs makes it difficult to select a meaningful and consistent midpoint. Additionally, if we were to break the analysis down by the different grading scales, the numbers would likely be too small to allow for meaningful statistical interpretation.
By ‘top grades’ we mean the single highest or best grade that can be achieved in each qualification, which will depend upon the particular grading structure that has been adopted.
We used data collected from 18 awarding organisations for 503 qualifications (not including any separate routes or pathways within those qualifications).
We analysed the qualification-level grades awarded to all learners in centres in England who took assessments for these qualifications during spring and summer. This period of time was chosen to be similar to the period the data was collected for previous years.
For historical context, we used data relating to awards issued for the same types of qualifications in 2018, 2019, and 2020, which was collected in 2020, and in 2021, which was collected in the same year. The specifics of that data have been described previously in the analysis of VTQ grades awarded in spring and summer 2020 and in the analysis of VTQ grades awarded in spring and summer 2021. The 2022 data covers slightly different periods, and the number of awarding organisations and qualifications is slightly different, but overall the data is very similar to previous years.
We collected results data from awarding organisations. We also obtained data on prior attainment from awarding organisations, and we used data from the Individualised Learner Record (ILR, maintained by the Education and Skills Funding Agency) and from the NPD, controlled by the DfE. These additional datasets were matched with the awards data. We used student first name, last name, date of birth, gender, qualification number and/or Unique Learner Number (ULN) to match the records for each student across the datasets. For cases which could not be uniquely matched, and those which could be matched but had no relevant information available on student characteristics of interest, we reported missing values in the corresponding fields of the combined datasets.
A full list of variables and their specification can be found in Appendix A. For ethnicity, categorisations were harmonised between the NPD and ILR for consistency and to align with the Government Statistical Service guidance where possible. This meant some groups were merged with one of the ‘other’ groups, as numbers were too small to include as a separate category. For example, ‘Gypsy or Irish Traveller’ students were merged into the ‘Any Other White Background’ group. Breakdowns of the frequencies of each of the categories can also be found in Appendix C.
Missing data rates are also given in Appendix B. Data on prior attainment and the background variables are missing to varying degrees. Tables X1 - X6 (in Appendix B) show the extent of missing data for each background variable used in our analysis. There was little missing data on gender, but data on prior attainment and other background variables were missing to varying degrees.
Where data was missing, we included the categories in the model as ‘unknown’ groups. We did observe some notable differences (see notable difference methodology below in section x) in some of these ‘unknown’ groups, which could indicate some degree of systematic change underlying the missing groups. The outcomes for the unknown categories are included in the tables in the results sections and in the charts in appendices.
We observed notable changes in the average marginal effects (see Modelling Overview) for the unknown categories for the following variables:
- FSM – across all qualification groups
- gender – for Level 1/2 Technical Awards and Level 3 Tech Levels
- IDACI – for Level 1/2 Technical Certificates and Level 3 Tech Levels
- prior attainment – for Level 1/2 Technical Certificates
Modelling overview
We used a generalised linear model (mixed effect logistic regression) to examine the probability of attaining a top grade, given the information on the characteristics of students clustered across centres. The student characteristics described previously were treated as fixed effects, and the student’s centre was treated as a random effect. This is because there may be factors affecting results that only students from the same schools or college have in common, such as the teaching materials used. The full model specification is given in Appendix D.
Within the logistic regression model, the estimates of the fixed effects’ parameters are of most interest for our analyses. These estimates quantify the relationship between each demographic or socioeconomic characteristic as well as prior attainment and the probability of attaining a top grade. Prior attainment is a strong predictor of grades and should be presented alongside the demographic or socioeconomic characteristics to facilitate a more accurate interpretation of effect size of variables.
Multi-way interactions between the demographic and socioeconomic variables listed above as well as prior attainment were not included in the analysis. This is because the small sample sizes would make the results less meaningful.
For each year separately, we show a measure of effect size of each variable on the probability of achieving the top grade. This is expressed in the form of the average marginal effect, representing an average difference in the probability of achieving top grades between two categories of a demographic or socioeconomic characteristic.
For example, the marginal effect for gender shows how the probability of achieving the top grade differs for male students (category of interest) compared to female students (reference category) when the remaining variables (other categories) are held constant. Through these measures, we can assess the difference in relative achievement of the top grade between different demographic groups.
Notable change criteria
Logistic regression models were run for each year individually. We then evaluated their outputs to identify which effects have changed between key years of comparison, considering both the statistical significance and the meaningfulness of the effects. We used a multi-step method (similar to that used for GQ analyses) to evaluate changes in effects between 2019 and 2022, and then repeated the process to evaluate changes between 2021 and 2022. The method consists of the following steps:
Step 1: identify which subgroups of students were statistically significantly more or less likely to achieve the top grade than the reference category in any year. That is, where the average marginal effects were statistically significantly different from zero (at 5% level of significance). Include the identified subgroups for consideration in subsequent steps. This step allows us to exclude from further investigation those subgroups that showed no difference in any year relative to the reference group and those whose estimates consistently had large standard errors and confidence intervals, suggesting the groups were too small in size and/or had much variability within the subgroup, making it hard for their effect difference to be estimated reasonably precisely.
Step 2: among the subgroups identified in Step 1, select those whose difference in the average marginal effects between 2019 and 2022 in absolute value was larger than the difference in average marginal effects between 2018 and 2019 in absolute value. This step considers how the size of the average marginal effects can change between two normal years, namely, 2018 and 2019, and identifies between-year changes that exceed normal between-year changes in magnitude.
Step 3: from the subgroups selected in Step 2, flag as ‘notable’ the subgroups whose 2019 to 2022 change in the average marginal effects was larger than plus or minus 5 percentage points.
The purpose of the method is to ensure that changes are only interpreted as being ‘notable’ if they appear to be larger than the normal fluctuations that might be expected in any year. However, smaller changes will also be discussed in the sections to follow where they are apparent in the graphs.
Results
The impact of demographic and socioeconomic characteristics on achieving the top grade is reported in the graphs and tables to follow (and also in Appendix E).
Asterisks alongside the categories in the graphs show which categories of demographic and socioeconomic characteristic were statistically significant from its respective reference category in 2022. A p-value indicates how likely it is that the difference occurred by chance. The asterisks represent p values, as follows:
- ***= p<0.001 which means that there is a 1 in 1000 chance that the difference occurred by chance
- **= p<0.01 which means there is a 1 in 100 chance that the difference occurred by chance
- *= p<0.05 which means there is a 1 in 20 chance that the difference occurred by chance.
In the graphs, confidence intervals are reported as horizontal lines around the points. Confidence intervals show the degree of possible error around the estimates, giving a range of plausible values rather than a definitive value.
Top grades over time for Level 1/2 qualifications
For Level 1/2 Technical Awards and Technical Certificates the average probability of attaining the top grade was 4.5% and 4.3% respectively in 2022, which is higher than in 2019 and lower than in 2021.
For Technical Awards there were no ‘notable’ changes, according to the criteria we previously outlined.
Figure V.1. Equalities analysis for Level 1/2 Technical Awards


Notes: The vertical dashed line shows the point at which one can say that there is no difference in the average probability of achieving top grades between the category being observed and the reference category. Asterisks show which groups were statistically significant from their respective reference category in 2022, where *** = p<0.001; ** = p<0.01; * = p<0.05.
Table V.1 Average marginal effects on the probability of achieving the top grade for Level 1/2 Technical Awards
| Factor | 2018 | 2019 | 2020 | 2021 | 2022 |
|---|---|---|---|---|---|
| Ethnicity: White Irish | -0.012 | 0.006 | -0.010 | -0.010 | -0.013 |
| Ethnicity: any other White background (AOWB) | -0.006 | 0.000 | 0.001 | 0.008 | 0.002 |
| Ethnicity: White and Black Caribbean | 0.003 | -0.004 | -0.004 | -0.008 | -0.005 |
| Ethnicity: White and Black African | 0.004 | 0.017 | 0.000 | 0.005 | 0.004 |
| Ethnicity: White and Asian | 0.024 | 0.016 | 0.019 | 0.017 | 0.014 |
| Ethnicity: any other Mixed or Multiple ethnic background (AOMMB) | 0.022 | 0.015 | 0.009 | 0.013 | 0.011 |
| Ethnicity: Indian | 0.032 | 0.015 | 0.042 | 0.050 | 0.029 |
| Ethnicity: Pakistani | 0.011 | 0.001 | 0.000 | 0.007 | -0.005 |
| Ethnicity: Bangladeshi | 0.035 | 0.022 | 0.021 | 0.031 | 0.018 |
| Ethnicity: Chinese | 0.085 | 0.039 | 0.084 | 0.084 | 0.083 |
| Ethnicity: any other Asian background (AOAB) | 0.020 | -0.003 | 0.029 | 0.023 | 0.019 |
| Ethnicity: African | 0.007 | 0.009 | -0.008 | 0.002 | 0.006 |
| Ethnicity: Caribbean | -0.002 | 0.008 | -0.006 | 0.004 | 0.003 |
| Ethnicity: any other Black, African or Caribbean background (AOBACB) | -0.003 | 0.006 | 0.016 | -0.002 | 0.003 |
| Ethnicity: any Other Ethnic Group (AOEG) | -0.001 | -0.002 | 0.014 | 0.010 | 0.002 |
| Ethnicity: Unknown | -0.002 | -0.016 | -0.011 | -0.008 | -0.004 |
| Gender: Male | -0.034 | -0.014 | -0.075 | -0.067 | -0.050 |
| Gender: Unknown | 0.397 | 0.296 | -0.104 | -0.079 | -0.007 |
| SEND: Yes | -0.033 | -0.030 | -0.051 | -0.053 | -0.040 |
| SEND: Unknown | -0.015 | 0.039 | -0.002 | -0.005 | 0.021 |
| FSM: Yes | -0.019 | -0.020 | -0.033 | -0.015 | -0.034 |
| FSM: Unknown | 0.022 | 0.022 | 0.013 | 0.062 | -0.010 |
| IDACI: Very low | 0.013 | 0.013 | 0.016 | 0.026 | 0.017 |
| IDACI: Low | 0.004 | 0.007 | 0.003 | 0.011 | 0.008 |
| IDACI: High | -0.002 | -0.001 | -0.009 | -0.007 | -0.001 |
| IDACI: Very high | -0.005 | -0.003 | -0.004 | -0.013 | -0.001 |
| IDACI: Unknown | -0.005 | -0.015 | -0.009 | 0.010 | 0.003 |
| Prior attainment: Very low | -0.043 | -0.033 | -0.065 | -0.064 | -0.051 |
| Prior attainment: Low | -0.028 | -0.020 | -0.036 | -0.034 | -0.028 |
| Prior attainment: High | 0.041 | 0.037 | 0.057 | 0.049 | 0.042 |
| Prior attainment: Very high | 0.130 | 0.117 | 0.180 | 0.173 | 0.146 |
| Prior attainment: Unknown | -0.003 | 0.003 | 0.003 | 0.001 | 0.006 |
For Technical Certificates several notable changes were observed. However, the confidence intervals are wide for this qualification group, meaning there is greater uncertainty over the findings. The notable changes below should therefore be treated with caution.
- Pakistani students were less likely to achieve top grades than White students in 2022. But the negative attainment gap for Pakistani students compared to White British students has narrowed from 8% in 2019 to 2% in 2022 respectively.
- Students in the ‘Any other ethnic background’ group were less likely to achieve top grades than their White British peers. The difference in the probability of attaining the top grade increased from 3% in 2019 to 9% in 2022.
- Students whose ethnic background was White and Black African as well as those whose background was White and Black Caribbean students were less likely to achieve top grades than White students in 2022. But the differences for both of these groups have narrowed. White and Black African students were on average 19% less likely to achieve top grades in 2019 compared to White students, but that difference has narrowed to being 4% less likely in 2022. Similarly, White and Black Caribbean students were on average 15% less likely to achieve top grades in 2019 compared to White students, and that has narrowed to being 2% less likely in 2022. The differences for both of these groups narrowed substantially in 2020 and have since stayed at a similar level.
- Students whose ethnicity was White and Asian were slightly more likely to achieve a top grade compared to White students in 2022. This difference of around 2% reversed a negative difference in 2019, when White and Asian students were 8% less likely to achieve a top grade.
- Students with very high prior attainment were on average 15% more likely than their average ability peers to achieve top grades in 2019, which reduced to 6% more likely in 2022.
Figure V.2 Equalities analysis for Level 1/2 Technical Certificates


Notes: The vertical dashed line shows the point at which one can say that there is no difference in the average probability of achieving top grades between the category being observed and the reference category. Asterisks show which groups were statistically significant from their respective reference category in 2022, where *** = p<0.001; ** = p<0.01; * = p<0.05.
Table V.2 Average marginal effects on the probability of achieving top grades for Level 1/2 Technical Certificates
| Factor | 2018 | 2019 | 2020 | 2021 | 2022 |
|---|---|---|---|---|---|
| Ethnicity: White Irish | -0.188 | 0.037 | -0.046 | 0.136 | 0.029 |
| Ethnicity: any other White background (AOWB) | -0.014 | -0.013 | -0.004 | -0.010 | -0.032 |
| Ethnicity: White and Black Caribbean | -0.093 | -0.147 | -0.035 | -0.034 | -0.024 |
| Ethnicity: White and Black African | -0.101 | -0.193 | -0.040 | -0.045 | -0.042 |
| Ethnicity: White and Asian | -0.123 | -0.078 | -0.074 | 0.001 | 0.016 |
| Ethnicity: any other Mixed or Multiple ethnic background (AOMMB) | -0.083 | -0.071 | -0.027 | -0.030 | -0.038 |
| Ethnicity: Indian | -0.110 | -0.033 | -0.049 | 0.003 | -0.012 |
| Ethnicity: Pakistani | -0.110 | -0.083 | -0.033 | -0.044 | -0.023 |
| Ethnicity: Bangladeshi | -0.141 | 0.008 | 0.035 | -0.005 | -0.045 |
| Ethnicity: Chinese | 0.016 | -0.029 | 0.075 | 0.157 | 0.061 |
| Ethnicity: any other Asian background (AOAB) | -0.026 | -0.082 | -0.031 | -0.019 | -0.028 |
| Ethnicity: African | -0.237 | -0.100 | -0.049 | -0.004 | -0.027 |
| Ethnicity: Caribbean | -0.179 | -0.124 | -0.111 | -0.022 | -0.075 |
| Ethnicity: any other Black, African or Caribbean background (AOBACB) | -0.250 | -0.132 | -0.049 | -0.061 | -0.049 |
| Ethnicity: any Other Ethnic Group (AOEG) | -0.082 | -0.032 | -0.083 | -0.038 | -0.094 |
| Ethnicity: Unknown | -0.081 | -0.020 | -0.031 | 0.001 | -0.032 |
| Gender: Male | -0.088 | -0.056 | -0.032 | -0.032 | -0.015 |
| Gender: Unknown | 0.256 | -0.098 | 0.062 | 0.120 | 0.099 |
| SEND: Yes | 0.152 | -0.018 | -0.015 | -0.015 | -0.026 |
| SEND: Unknown | 0.269 | 0.176 | 0.087 | 0.072 | 0.151 |
| FSM: Yes | -0.042 | -0.024 | -0.019 | 0.000 | -0.020 |
| FSM: Unknown | 0.206 | 0.229 | 0.204 | 0.263 | 0.003 |
| IDACI: Very low | 0.043 | 0.027 | -0.012 | 0.027 | 0.014 |
| IDACI: Low | 0.012 | 0.014 | -0.025 | 0.016 | -0.007 |
| IDACI: High | -0.047 | -0.017 | -0.058 | -0.004 | -0.002 |
| IDACI: Very high | -0.043 | -0.068 | -0.054 | -0.040 | -0.031 |
| IDACI: Unknown | -0.162 | -0.213 | -0.155 | -0.139 | 0.038 |
| Prior attainment: Very low | -0.174 | -0.053 | -0.042 | -0.044 | -0.005 |
| Prior attainment: Low | -0.187 | -0.044 | -0.025 | -0.035 | -0.011 |
| Prior attainment: High | 0.032 | 0.064 | 0.024 | 0.008 | 0.025 |
| Prior attainment: Very high | 0.162 | 0.148 | 0.110 | 0.059 | 0.063 |
| Prior attainment: Unknown | 0.099 | 0.057 | -0.008 | -0.001 | 0.054 |
Top grades over time for Level 3 qualifications
For Level 3 qualifications the average probability of attaining the top grade in Applied Generals and Technical Level qualifications was 10% and 14.5% respectively in 2022. This is higher than in 2019 and lower than in 2021.
For Level 3 qualifications the trends are similar to those reported for Level 1/2 qualifications. For Applied Generals, notable changes were seen, using our earlier defined criteria, with respect to prior attainment only. Students with a very high prior attainment were on average 23% more likely to achieve top grades compared to their peers with a medium prior attainment level in 2022. This is an increase by 8 percentage points compared to the outcomes in 2019.
Figure V.3 Equalities analysis for Level 3 Applied General qualifications


Notes: The vertical dashed line shows the point at which one can say that there is no difference in the average probability of achieving top grades between the category being observed and the reference category. Asterisks show which groups were statistically significant from their respective reference category in 2022, where *** = p<0.001; ** = p<0.01; * = p<0.05.
Table V.3. Average marginal effects on the probability of achieving top grades for Level 3 Applied General qualifications
| Factor | 2018 | 2019 | 2020 | 2021 | 2022 |
|---|---|---|---|---|---|
| Ethnicity: White Irish | -0.006 | -0.003 | -0.047 | -0.015 | -0.004 |
| Ethnicity: any other White background (AOWB) | -0.009 | -0.010 | -0.020 | -0.028 | -0.015 |
| Ethnicity: White and Black Caribbean | -0.010 | -0.018 | -0.037 | -0.031 | -0.022 |
| Ethnicity: White and Black African | -0.004 | -0.037 | -0.041 | -0.050 | -0.039 |
| Ethnicity: White and Asian | -0.008 | -0.020 | -0.016 | -0.024 | -0.011 |
| Ethnicity: any other Mixed or Multiple ethnic background (AOMMB) | -0.018 | -0.011 | -0.034 | -0.038 | -0.032 |
| Ethnicity: Indian | -0.005 | -0.001 | -0.006 | -0.009 | 0.002 |
| Ethnicity: Pakistani | -0.007 | -0.016 | -0.020 | -0.029 | -0.015 |
| Ethnicity: Bangladeshi | 0.001 | -0.012 | -0.022 | -0.024 | -0.011 |
| Ethnicity: Chinese | 0.020 | 0.009 | 0.000 | 0.018 | 0.010 |
| Ethnicity: any other Asian background (AOAB) | -0.011 | -0.020 | -0.046 | -0.037 | -0.016 |
| Ethnicity: African | -0.027 | -0.031 | -0.061 | -0.069 | -0.044 |
| Ethnicity: Caribbean | -0.019 | -0.031 | -0.061 | -0.035 | -0.054 |
| Ethnicity: any other Black, African or Caribbean background (AOBACB) | -0.037 | -0.023 | -0.059 | -0.053 | -0.064 |
| Ethnicity: any Other Ethnic Group (AOEG) | -0.012 | -0.010 | -0.028 | -0.027 | -0.022 |
| Ethnicity: Unknown | -0.005 | -0.004 | -0.017 | -0.029 | -0.018 |
| Gender: Male | -0.018 | -0.015 | -0.055 | -0.063 | -0.040 |
| Gender: Unknown | -0.056 | -0.068 | -0.185 | -0.093 | -0.067 |
| SEND: Yes | -0.005 | 0.001 | 0.003 | -0.014 | 0.011 |
| SEND: Unknown | -0.011 | 0.003 | -0.029 | -0.039 | 0.010 |
| FSM: Yes | 0.001 | -0.001 | -0.007 | -0.016 | -0.004 |
| FSM: Unknown | 0.016 | 0.012 | 0.016 | 0.051 | -0.018 |
| IDACI: Very low | 0.005 | 0.005 | -0.008 | 0.016 | 0.014 |
| IDACI: Low | 0.003 | 0.000 | -0.008 | 0.004 | 0.007 |
| IDACI: High | -0.002 | 0.000 | 0.005 | -0.002 | -0.005 |
| IDACI: Very high | -0.002 | 0.001 | 0.023 | 0.000 | -0.011 |
| IDACI: Unknown | 0.001 | -0.014 | -0.007 | 0.007 | 0.024 |
| Prior attainment: Very low | -0.016 | -0.021 | -0.065 | -0.080 | -0.063 |
| Prior attainment: Low | -0.011 | -0.014 | -0.036 | -0.048 | -0.042 |
| Prior attainment: High | 0.027 | 0.037 | 0.062 | 0.078 | 0.063 |
| Prior attainment: Very high | 0.125 | 0.154 | 0.234 | 0.265 | 0.229 |
| Prior attainment: Unknown | 0.020 | 0.029 | 0.025 | 0.017 | 0.025 |
For Tech Level qualifications several notable changes were observed. However, the confidence intervals are wide for this qualification group, meaning there is greater uncertainty over the findings. The notable changes below should therefore be treated with caution.
- White and Black African students were on average 1% more likely to achieve top grades than White students in 2022. This difference has reversed compared to both 2019 and 2021, when White and Black African students were less likely to achieve top grades than White leaners by 6% and 8% respectively.
- Students whose background was White and Asian were around 1% more likely to achieve top grades than White students in 2022. This reversed the differences seen in 2019 when White and Asian students were 7% less likely to achieve top grades than White students.
- Chinese students were on average 9% more likely to achieve top grades than the reference group of White students in 2022. This increased from 2019 when it was 1% and reversed the difference in 2021 when Chinese students were 2% less likely to achieve top grades than White students.
- Students from the Any Other Ethnic Group as well as students whose background was Any other Asian were around 1% and 2% more likely to achieve top grades than White students in 2022 respectively. This reversed the differences seen in 2019 when students from Any Other Ethnic Group were 6% less likely to achieve top grades than White students. The difference has also reversed for Any other Asian background students compared to 2021, when they were less likely to achieve top grades than White leaners by 4%.
Figure V.4 Equalities analysis for Level 3 Tech Level qualifications


Notes: The vertical dashed line shows the point at which one can say that there is no difference in the average probability of achieving top grades between the category being observed and the reference category. Asterisks show which groups were statistically significant from their respective reference category in 2022, where *** = p<0.001; ** = p<0.01; * = p<0.05.
Table V.4 Average marginal effects on the probability of achieving top grades for Level 3 Tech Level qualifications
| Factor | 2018 | 2019 | 2020 | 2021 | 2022 |
|---|---|---|---|---|---|
| Ethnicity: White Irish | 0.032 | -0.050 | 0.085 | -0.004 | 0.015 |
| Ethnicity: any other White background (AOWB) | 0.004 | -0.005 | -0.016 | -0.011 | 0.001 |
| Ethnicity: White and Black Caribbean | -0.043 | 0.000 | -0.026 | -0.013 | -0.021 |
| Ethnicity: White and Black African | -0.032 | -0.058 | -0.055 | -0.078 | 0.007 |
| Ethnicity: White and Asian | 0.001 | -0.066 | -0.004 | -0.020 | 0.010 |
| Ethnicity: any other Mixed or Multiple ethnic background (AOMMB) | -0.028 | -0.043 | 0.041 | -0.028 | -0.011 |
| Ethnicity: Indian | -0.031 | -0.015 | -0.031 | 0.019 | 0.026 |
| Ethnicity: Pakistani | -0.016 | -0.053 | -0.041 | -0.049 | -0.007 |
| Ethnicity: Bangladeshi | -0.048 | -0.027 | 0.008 | -0.007 | 0.006 |
| Ethnicity: Chinese | 0.027 | 0.011 | 0.043 | -0.023 | 0.091 |
| Ethnicity: any other Asian background (AOAB) | -0.019 | -0.022 | -0.017 | -0.038 | 0.018 |
| Ethnicity: African | -0.078 | -0.034 | -0.053 | -0.037 | -0.030 |
| Ethnicity: Caribbean | -0.049 | -0.012 | -0.038 | -0.050 | -0.022 |
| Ethnicity: any other Black, African or Caribbean background (AOBACB) | -0.049 | -0.068 | -0.014 | -0.052 | -0.024 |
| Ethnicity: any Other Ethnic Group (AOEG) | -0.014 | -0.062 | -0.032 | -0.044 | 0.005 |
| Ethnicity: Unknown | -0.045 | -0.034 | -0.024 | -0.019 | 0.012 |
| Gender: Male | -0.002 | -0.008 | -0.041 | -0.048 | -0.020 |
| Gender: Unknown | -0.049 | -0.044 | 0.027 | 0.038 | 0.040 |
| SEND: Yes | -0.013 | -0.019 | 0.002 | -0.014 | 0.022 |
| SEND: Unknown | 0.029 | 0.038 | 0.013 | 0.029 | 0.051 |
| FSM: Yes | -0.004 | 0.008 | -0.011 | -0.009 | -0.007 |
| FSM: Unknown | 0.087 | 0.095 | 0.072 | 0.091 | 0.007 |
| IDACI: Very low | 0.015 | 0.021 | 0.003 | 0.019 | 0.009 |
| IDACI: Low | 0.010 | 0.012 | -0.003 | -0.006 | 0.002 |
| IDACI: High | -0.004 | 0.003 | -0.017 | -0.032 | -0.012 |
| IDACI: Very high | -0.009 | -0.013 | 0.006 | -0.033 | -0.018 |
| IDACI: Unknown | -0.017 | -0.047 | -0.043 | -0.070 | 0.000 |
| Prior attainment: Very low | -0.025 | -0.043 | -0.064 | -0.070 | -0.053 |
| Prior attainment: Low | -0.009 | -0.020 | -0.037 | -0.034 | -0.037 |
| Prior attainment: High | 0.038 | 0.049 | 0.068 | 0.082 | 0.055 |
| Prior attainment: Very high | 0.161 | 0.182 | 0.243 | 0.249 | 0.214 |
| Prior attainment: Unknown | 0.062 | 0.067 | 0.027 | 0.029 | 0.028 |
It is important to note that all the observations made above focus only on the differences that have occurred between years. Attainment gaps with respect to most other student characteristics, such as most of the different ethnic groups and between students with different IDACI scores, have not changed in any meaningful way between years. This is true both for Level 1/2 and Level 3 qualifications.
Conclusion
This report presents an analysis of the relationships between results and student characteristics and other background variables, covering the period 2018 to 2022. We used multilevel regression modelling to estimate differences in results for groups of students, relative to a comparator group, after controlling for other variables including prior attainment.
Differences observed in 2018 and 2019 tell us that differences in exam results existed in pre-pandemic times and that these differences can vary from year to year even in normal times. We used a series of criteria to identify ‘notable’ changes that we considered to be practically significant while taking into consideration normal between-year fluctuations.
Although we identified some notable changes, summarised below, we did not find notable changes for most of the group-level comparisons we made.
For A Level, we found notable changes on all 3 results outcomes (average grade, probability of achieving grade A and above, and probability of achieving grade C and above) for a number of different centre types compared to either 2021 or 2019, specifically further education colleges, sixth form colleges, ‘other’ centre types and tertiary colleges, relative to academies. We also saw male students achieve higher outcomes than female students, a reversal of the difference observed in 2021 when male students had lower outcomes. The negative difference for Black African students narrowed in 2022 compared to 2021, relative to White British students.
At GCSE, we found notable outcomes on all 3 results outcomes (average grade, probability of achieving grade 7 and above, and probability of achieving grade 4 and above) for students in independent schools, further education colleges, ‘other’ centre types and secondary selective schools. We also observed a widening of the negative difference in outcomes for students eligible for FSM relative to 2019, but we did find the opposite result for IDACI, an alternative measure of socioeconomic status. In addition, the negative difference between White Gypsy and Roma students narrowed compared to White British students in 2021.
For VTQs, we found notable changes relating to some groups with different ethnic backgrounds who took Technical Certificates and Technical Levels. However, the number of students is relatively small and so these findings should be treated with caution. At Level 3, some differences with respect to prior attainment were observed for Applied Generals. The positive difference between students with very high prior attainment and students with medium/average prior attainment widened relative to 2019.
The modelling approach we took allowed us to overcome the limitations of simple breakdowns of results by groups of students. However, there are some limitations to this analysis. This report describes the changes that appear to have occurred. It is not possible to attribute cause to any of these changes, and many possible causal factors may be at play, including those related to the pandemic as well as other changes over time.
We have limited our modelling to the main effects of each of the variables considered, rather than including interaction effects between variables. There may, therefore, be relationships between different explanatory variables that could affect the findings reported here.
Additionally, data on some student background variables was missing in ways that correlated with other variables (see the Methodology sections for further information), that is it was not missing in a random way. There were also some notable changes in some of the ‘unknown’ categories (discussed further in the Methodology sections), suggesting something systematic underlying the changes in these groups. The pattern of missing data did, however, appear to be stable across the 5 years we analysed, so we can be confident that any changes in the effect of the background variables on results was not caused by a change in the completeness of that data from year to year.
Ofqual has carried out this analysis since 2020. In 2020 and 2021, to address the question of whether the different forms of assessment used during the pandemic had affected the so-called attainment gaps – differences in overall outcomes for different groups of students. With the return to exams and other formal assessments in 2022, this analysis considers any changes in those attainment gaps. Critically, this analysis looks at attainment gaps, and year-on-year changes, while controlling for other variables. This provides greater insight as to whether changes over time reflect real differences in student attainment.
The majority of the changes over time (comparing 2022 with 2021, and with 2019) showed no notable changes. Where there were notable changes, some gaps widened and others narrowed. It is impossible to draw conclusions about the cause of these differences, many of which existed before the pandemic.
[1] Changes to the wider benefits system as Universal Credit (UC) rolls out means that students who are eligible for FSM in a particular year remain eligible until the conclusion of the UC roll out regardless of any changes in their family circumstances, whereas previously students would cease to be eligible if they no longer met the criteria. Additionally, an increase in the FSM cohort was seen during the pandemic.