An analysis of grades awarded for VTQs in spring and summer 2021
Updated 12 August 2021
Applies to England

© Crown copyright 2021
This publication is licensed under the terms of the Open Government Licence v3.0 except where otherwise stated. To view this licence, visit nationalarchives.gov.uk/doc/open-government-licence/version/3 or write to the Information Policy Team, The National Archives, Kew, London TW9 4DU, or email: psi@nationalarchives.gov.uk.
Where we have identified any third party copyright information you will need to obtain permission from the copyright holders concerned.
This publication is available at https://www.gov.uk/government/publications/analysis-of-results-vtqs-2021/an-analysis-of-grades-awarded-for-vtqs-in-spring-and-summer-2021-level-3-qualifications
Authors
- Benjamin Cuff
- Kate Sully
Executive summary
The coronavirus (COVID-19) pandemic has continued to cause disruption to learning and assessments in 2021, as it did in 2020. The purpose of this report is to explore the grades that were awarded in light of these circumstances for a number of Vocational and Technical Qualifications (VTQs): Applied General qualifications and other Performance Table qualifications, Other General qualifications and Functional Skills qualifications, at Entry level to Level 3.
Data was collected from Awarding Organisations (AOs) on all learners in England awarded a grade this spring and/or summer for exams and other assessments (collectively referred to as ‘assessments’ in this report) taken between 24 March 2021 and 31 July 2021 (chosen to be consistent with data collected for previous years). Similar data for 2018, 2019, and 2020, that was collected in 2020, is also used for context.
Due to differences in the data collected for VTQs and General Qualifications (GCSEs and A levels), we are not always able to carry out the same analyses. For example, here we were unable to carry out analyses by centre type as we only have data for a single year, and so do not have a baseline to compare against.
Our findings do not suggest that there have been overall large changes in entry behaviour between 2020 and 2021. Those changes which exist largely reflect trends over time, and in several cases, volumes have been increasing over time.
When exploring the distributions of grades awarded across 2018, 2019, 2020 and 2021, the shapes of the distributions in most cases do not seem to have substantially changed this year compared to previous years. Changes exist in the proportions of top grades being issued in 2021 relative to previous years, but the direction and size of these changes vary across different qualification groupings. Two groups of Level 3 Performance Table qualifications (excluding Applied Generals) saw a relatively large increase in the proportion of top grades being awarded, but these were relatively low entry groups. An analysis of regional effects did not suggest that any particular regions had a greater degree of change than any other.
While it is possible that the impact of the pandemic could explain some of these changes, other explanations are equally likely, due to the general variability and diversity of the VTQ sector. The general ability of cohorts of learners might also have changed over time. Thus, while we can report the changes that have occurred at an aggregate level, we are not able to make any claims as to the cause of those changes.
Introduction
Purpose
COVID-19 has continued to cause disruption to learning and assessments in 2021, as it did in 2020. Similar to last year, a number of mitigation measures have been put in place in for VTQs. The purpose of this report is to examine the grades that were awarded in light of these circumstances for a number of VTQs.
We specifically focus on VTQs that tend to be used for progression to further or higher education, or for progression straight into employment, at Level 3. These are Applied General qualifications or qualifications otherwise included in the Department for Education’s performance tables (listed separately on gov.uk for key stage 4 qualifications and 16 to 18 qualifications, excluding project qualifications, Advanced Extension Awards, GCSE, AS and A levels), those having a qualification type of ‘Other General Qualification’, and Functional Skills qualifications.
The focus of this report is the volumes and grade distributions of grades issued for the 2021 VTQ cohort. A separate report has also been published examining outcomes for VTQ learners with different backgrounds (including protected characteristics and socioeconomic status) in 2021. A report covering both these topics, focusing on 2020 results, was published last year.
Equivalent reports have also been published for:
- summer 2021 results and student-level equalities analysis of GCSE, AS and A level
- 2021 VTQ results equalities analyses
Background information
This year, due to the ongoing impact of COVID-19 and its disruption to education, it was no longer viable for assessments to go ahead for some VTQs and other general qualifications. We consulted jointly, with the Department for Education, on the alternative arrangements for assessments. The outcome of this consultation was announced in February and the Vocational and technical qualifications Contingency Regulatory Framework (VCRF) was subsequently introduced. VTQ qualifications fulfil a range of purposes and the VTQ framework was designed to accommodate this.
Qualifications were divided into 3 main categories:
- Qualifications that require a demonstration of occupational or professional competence or proficiency. Here AOs had to carefully consider putting in place adaptations to assessments. These enabled as many learners as possible to obtain a result, without undermining the validity and reliability for those qualifications.
- Qualifications that are similar to, or delivered alongside, GCSEs, AS and A level and which are used for progression to further or higher education. It was not viable for exams and other assessments to continue as normal, so results have been decided wholly, or in part, using teacher-assessed grades (TAGs).
- Other qualifications used for progression but are different from GCSEs, AS and A levels. AOs continued to ensure that exams and assessments were available but TAGs could be used if learners were not able to safely access assessments.
Teacher-assessed grades
For those qualifications that have been awarded wholly, or in part, using teacher-assessed grades (TAGs), teachers were asked to submit either:
- a qualification-level TAG (like A levels and GCSEs) – this was a holistic judgement covering the whole qualification and taking into account completed assessment and a range of additional evidence
- a unit and/or component level TAG – this was a judgement of a learner’s performance in particular units or components
Vocational qualifications are typically modular and have a high proportion of teacher assessment. Most learners have already completed some assessments, many of which will have been marked and in some cases, moderated earlier in the course. Some learners will have carried forward Centre Assessed Grades, from 2020, for some units or components. In the autumn of 2020, most qualifications were adapted to maximise teaching time. This meant that some assessments were streamlined, for example by removing any elements that were duplicated elsewhere. Some external assessments went ahead in January 2021, although learners could choose to replace their result with a TAG.
TAGs were based on evidence of a learner’s achievement, with teachers drawing on a range of different types of appropriate evidence to inform their professional judgement about a learner’s result. The evidence used varied depending on the qualification. This may have included:
- performance on any assessment for the qualification even where it had not been fully completed
- performance on any class or homework assessments and mock exams taken over the course of study
- records of the learner’s performance over the course of study in the relevant qualification, for example progress review data, classwork, and participation in practical activities, demonstrations and performances
- any other relevant evidence
Quality assurance of teacher-assessed grades
Teachers or tutors made judgements about their learners’ performance using a variety of evidence. These judgements were first quality assured within centres and then by the relevant AO.
We required AOs to ensure each centre had effective arrangements in place to quality assure its TAGs before submitting them to the awarding organisation.
AOs provided guidance to centres on the range of evidence that could be considered in the judgement of a TAG. They advised on the process teachers and tutors should follow when determining TAGs and how to ensure that decisions are consistent.
AOs set out their requirements for centres’ internal quality assurance processes and the way in which teachers and tutors should consider the application of reasonable adjustments and special consideration. In all cases, a centre’s’ quality assurance approach should have included a check of results against previous cohorts who took the assessment for the same qualification in previous years. TAGs should also have been reviewed by other subject teachers and assessors as well as the relevant head of department or head of centre before submission.
Many AOs reviewed centres’ quality assurance policies and procedures as part of their quality assurance processes. Others provided policies to centres or adapted their normal verification or moderation processes to provide centres with additional support. Some AOs required centres to complete and return a ‘head of centre declaration’ when they submitted TAGs to confirm that they had complied with their internal quality assurance arrangements. Others confirmed this through their own monitoring and quality assurance processes.
After TAGs were submitted, AOs conducted their own quality assurance processes. AOs took approaches relevant to their qualifications and the part that TAGs had played in the final result. Some AOs did this through an extension of their normal centre monitoring, some asked centres to provide rationales for any results that looked unusual and also looked at work from centres selected at random. Other AOs looked at a sample of learner evidence, and many conducted a combination of these activities.
Results
Results days for GCSE and A levels have been brought forward and held in the same week (on the 10th and 12th of August, respectively). Results for VTQs used for progression to Further or Higher Education will be issued to students on or before these dates. AOs have put in place arrangements to facilitate this.
Analysis
Our analyses focus on qualifications regulated by Ofqual and include only learners in England. Our results analyses are based on data submitted to Ofqual by awarding organisations around 2 weeks before results are issued. Given this, there is likely to be a small amount of missing data for results that were not processed at that time. This is unlikely to impact on the overall trends, though, and any data that is missing is likely to be missing at random, rather than specifically affecting any individual groups of qualifications.
We have published a VTQ report which examines outcomes for learners with different protected characteristics and socio-economic status, and 2 separate reports for A level which focus on results and outcomes for learners with different protected characteristics and socio-economic status.
Data source
For the analyses contained within this report, we used data collected both last year and this year.
Data collected last year (in 2020) included results issued in 2018, 2019, and 2020. For the purposes of the current report, this was primarily used to provide a baseline. The specifics of that data have been described previously, although the details are much the same as described for 2021 below (previous data covered the period of 20 March to 31 July, and the numbers of AOs and qualifications slightly differed).
For 2021 awards, we collected Entry Level to Level 3 data from 35 AOs for 1,067 qualifications (not including any separate routes or pathways within those qualifications) that were an:
- Applied General qualification
- other type of Performance Table qualification, excluding project qualifications, Advanced Extension Awards, GCSE, AS and A levels
- Other General qualification; or a
- Functional Skills qualification
AOs were asked to provide to Ofqual the qualification-level grades awarded to all learners in centres in England who took or would have taken assessments for these qualifications between 24 March 2021 and 31 July 2021. This period of time was chosen to be consistent with data collected for previous years (which was based on the period covered by the Extraordinary Regulatory Framework (ERF). Where grades had not been fully finalised at the point of data submission, provisional grades were accepted for the purpose of these analyses. Fail grades have been reported where they were provided to us by AOs. However, it should be noted that not all AOs were able to report fail grades to us as part of this data collection. Results should be interpreted with that in mind.
Explanation of the grade distribution graphs
In the sections to follow, graphs are plotted to show changes in volumes over time and to show the distribution of grades that have been issued.
By plotting grade distributions, we can observe whether or not the shape of the distributions look similar in 2021 to previous years, to see whether they have remained broadly stable, and to see whether there have been any changes in the proportions of top grades being issued over time.
We primarily focus on the issuing of top grades, rather than the issuing of passing grades, as the percentage pass rate in our dataset is often close to 100% in all years, due to the fact that fail grades are often not reported in the data (see the Data source section). The percentages passing reported should therefore be interpreted with this in mind. For the same reason, grade distributions are not plotted for qualifications which use a simple pass or fail grading structure.
Grade distribution graphs throughout this report are only plotted for grading structures relating to 5 or more qualifications and 500 or more total results in 2021. Below these thresholds, we would normally expect less stability in grade distributions over time than for larger groups. It should be noted that even where we do report findings over time, it is challenging to make reliable comparisons for VTQs, where cohorts and qualifications are variable and diverse. VTQs are diverse in nature, and cohorts of learners can also vary quite considerably with regards to their numbers, their ages, and the centres and centre types they attend. The general ability of cohorts of learners might also have changed over time. As a result of these differences, which can vary over time, we cannot state with any degree of certainty what the cause of any changes in the distributions might be, as they could be caused by any number of factors.
Qualifications are combined according to Level and grading structure only. The qualifications included in each grouping might vary in a number of other ways, including by size and types of assessment. The intention behind the groupings used is to summarise the results at an aggregate level, but consistency within groups should not be assumed.
Unlike in GCSEs and A levels, where the top grade can either be a 9 (in reformed GCSEs) or an A* (in A levels), a large number of different grading structures are used in the VTQ sector, particularly for the Level 1 to Level 3 qualifications included in this report. We have therefore produced separate plots for each of these different structures. For example, some VTQs are graded on 1 to 7 scale, others are graded Pass to Distinction*. For this reason, comparisons with GCSEs and A levels are also difficult.
Also, unlike for the equivalent report on General Qualifications, we do not present analyses of centre types. This is because our dataset only includes centre type classifications for 2021, meaning we have no baseline to compare against. Some additional analysis by region is, however, presented towards the end of the report.
Entry level qualifications
Although our dataset contained outcomes related to a specific period of time in the year (24 March to 31 July in 2021), many Entry Level qualifications are internally assessed and so delivered on demand, meaning they can be taken at any point in the year. Results should be interpreted with that in mind.
When considered at the aggregate level (Figure 1), one can see a decrease over time, with relatively larger dip in volumes between 2019 and 2020. This dip is due to a decrease in volumes between 2019 and 2020 in Other General qualifications, which returned to 2019 levels in 2021 (Figure 2). For Functional Skills qualifications (also Figure 2), there has been a steady decrease over time.
Figure 1. Total grades over time for Entry Level qualifications
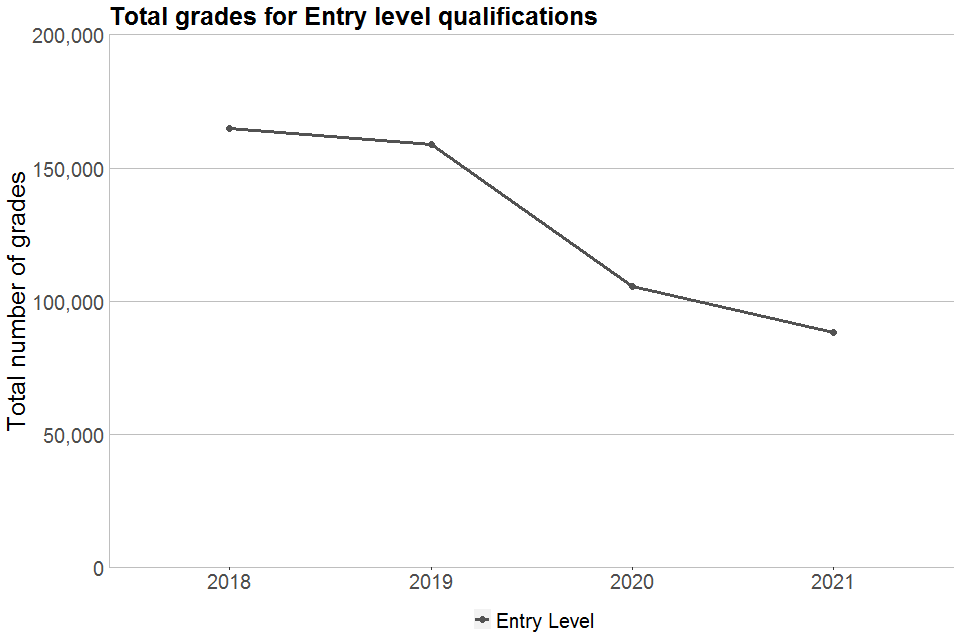
Line chart showing total grades awarded for Entry Level qualifications in 2018, 2019, 2020 and 2021
Figure 2. Total grades over time for Entry Level qualifications by qualification group
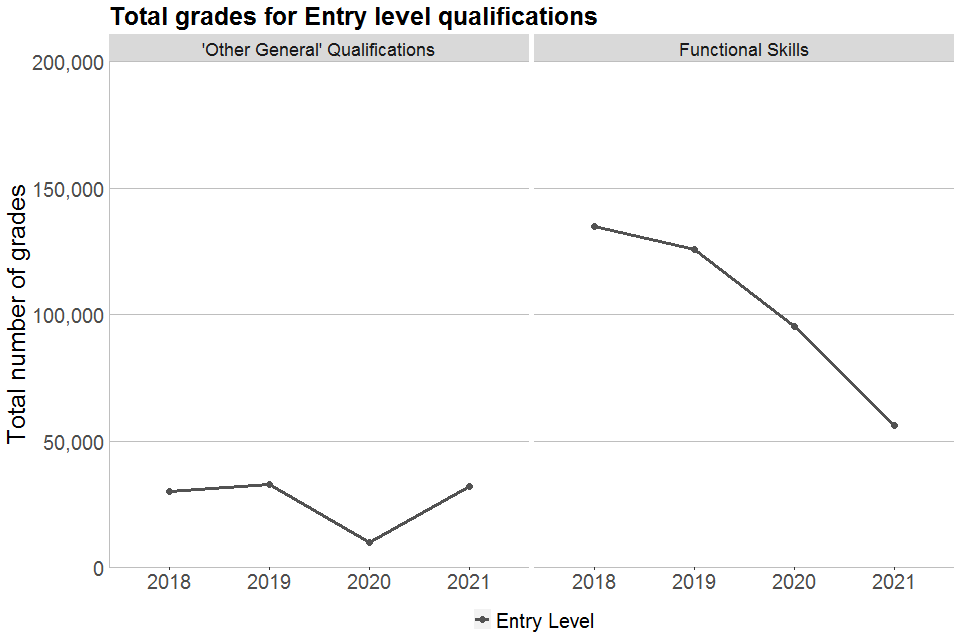
Line chart showing total grades awarded for 'Other General' and Functional Skills qualifications in 2018, 2019, 2020 and 2021
Figure 3 shows the grade distributions for Entry Level qualifications. The distribution has remained fairly stable over time, although the proportion of ‘Entry 3’ grades has steadily decreased over time. All qualifications included in Figure 3 were Other General qualifications, so further breakdowns are not given.
As noted previously, qualifications using a simple pass or fail grading structure are not included here, meaning that only qualifications using an Entry 1, Entry 2, Entry 3 grading structure are plotted, which includes 24% of the total entry size at Entry Level for 2021.
Figure 3. Grade distributions for Entry Level qualifications
Note: The numbers of qualifications and results given in the text boxes relate to 2021 only. Numbers of results have been rounded to the nearest 5.
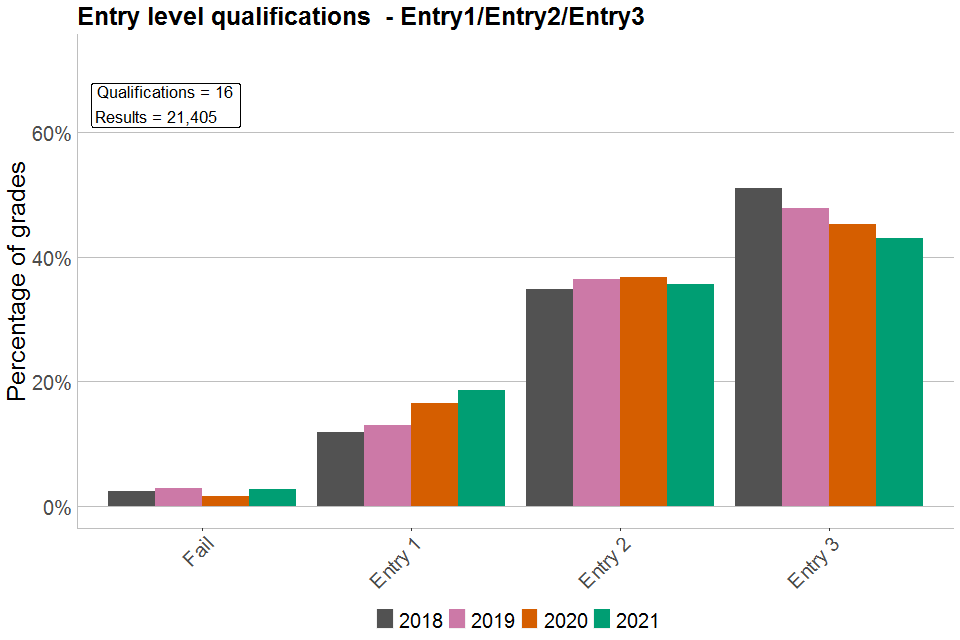
Bar chart showing percentages of each grade awarded in Entry Level qualifications
Level 1, Level 1/2, Level 2 qualifications
In this section, we include all qualifications included in this analysis at Level 1, Level 1/2, and Level 2. ‘Level 1/2’ qualifications are those that can be awarded at either Level 1 or Level 2. Due to their related nature, we shall discuss all these qualifications together, but they are presented separately in the charts to avoid combining results from different levels.
Overall, as shown in Figure 4, the total number of grades issued for Level 1 and Level 2 qualifications has steadily decreased over time. For Level 1/2 qualifications, there has been an increase over the past 4 years, with the difference between 2020 and 2021 being smaller than before.
When looking at a breakdown by qualification groups (Figure 5), the decrease in Level 1 and Level 2 qualifications seems primarily due to a decrease in Functional Skills qualifications at those levels. A rise in volumes for Performance Table qualifications explained the rise in Level 1/2 qualifications. Volumes for Other General qualifications not in performance tables have remained stable across each level.
Figure 4. Total grades over time for Level 1, Level 1/2, and Level 2 qualifications
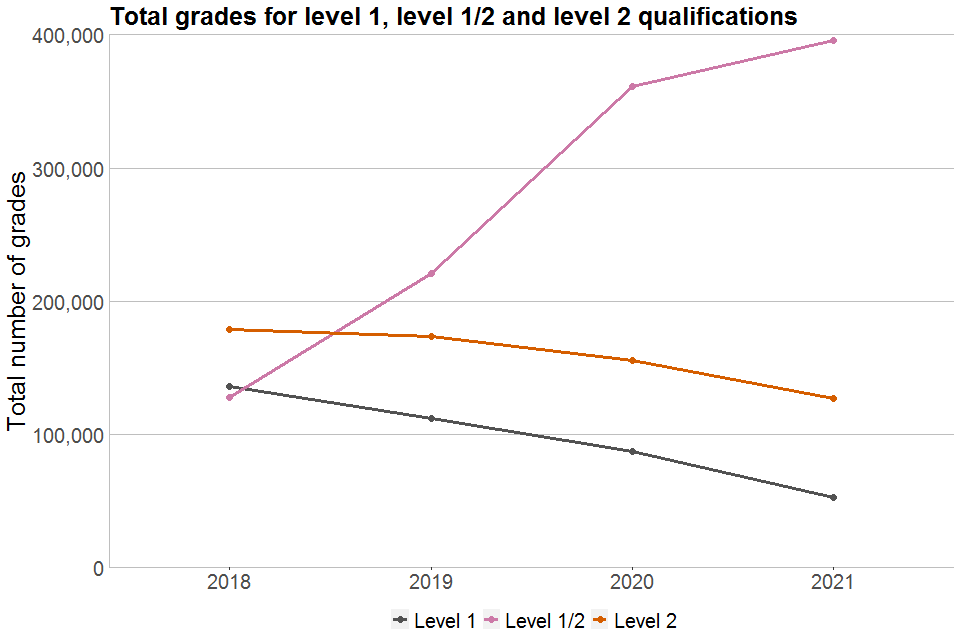
Line chart showing total grades awarded for Level 1, Level 1/2 and Level 2 VTQs in 2018, 2019, 2020 and 2021
Figure 5. Total grades over time for Level 1, Level 1/2, and Level 2 qualifications by qualification group
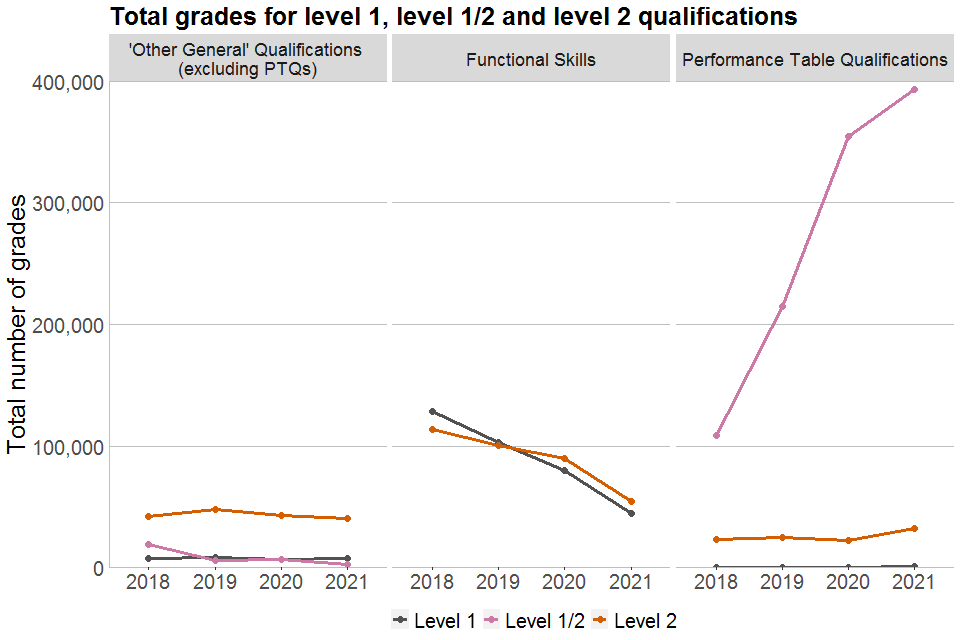
Line chart showing total grades awarded for Level 1, Level 1/2 and Level 2 'Other General', Functional Skills and Performance Table qualifications in 2018, 2019, 2020 and 2021
When looking at the grade distributions for Level 1 qualifications overall (Figure 6), the proportion of top grades being issued has decreased. For Pass to Distinction* qualifications, which has a relatively small entry, this appears to be following a trend from 2019, whereas for Pass to Distinction qualifications, this appears to be unique to 2021. All qualifications included in Figure 6 were Other General qualifications.
Figure 6. Grade distributions for Level 1 qualifications by grading structure
Note: The numbers of qualifications and results given in the text boxes relate to 2021 only. Numbers of results have been rounded to the nearest 5.
(a) P/M/D
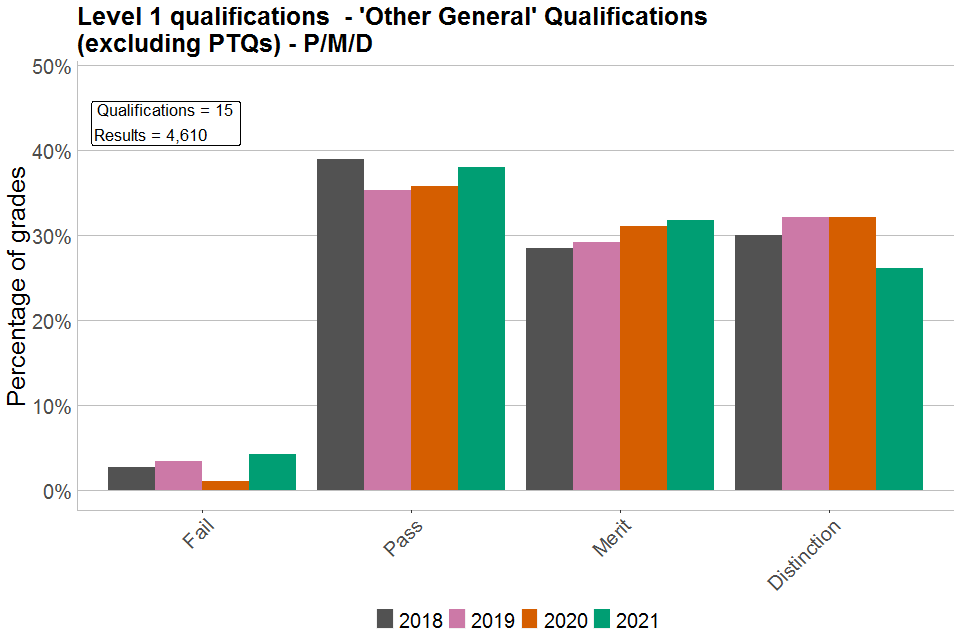
Bar chart showing percentages of each grade awarded in Level 1 'Other General' qualifications graded P/M/D
(b) P/M/D/D*
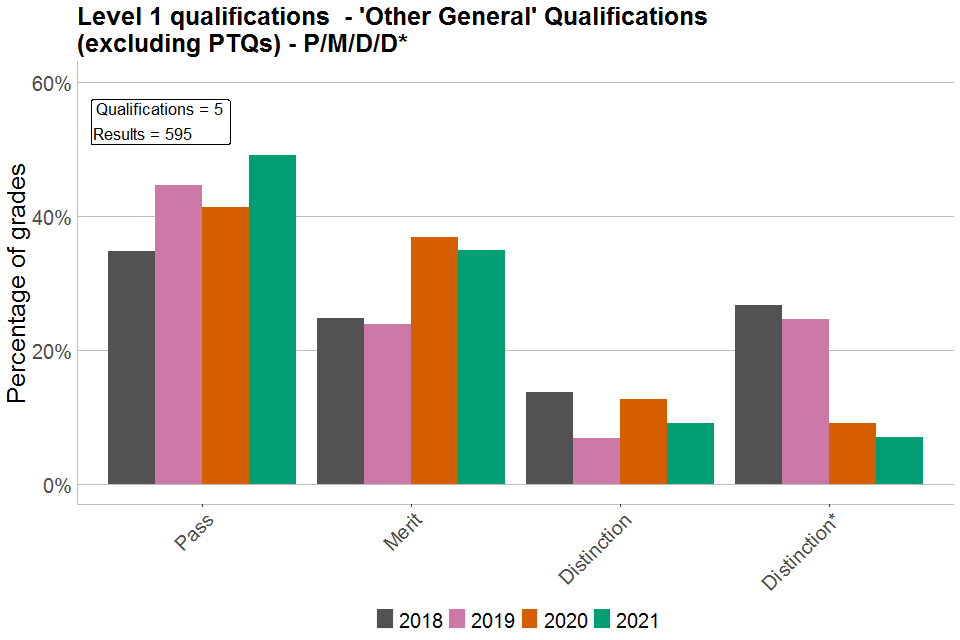
Bar chart showing percentages of each grade awarded in Level 1/2 'Other General' qualifications graded P/M/D/D*
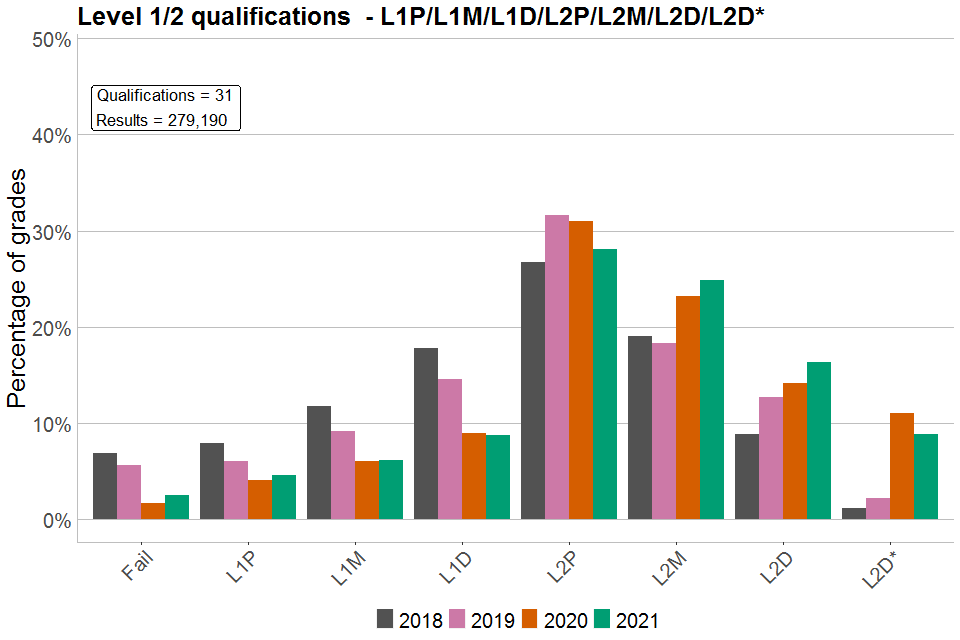
For Level 1/2 qualifications (Figure 7), the 2 grading structures with the highest number of results also showed a decrease in the number of top grades being issued, which in both cases followed a rise between 2019 and 2020. Overall, the proportion of Level 2 Passes (including higher grades) in these qualifications, however, remained relatively stable. Aside from these points, it is again notable that the general shape of the distributions has remained relatively stable over time.
Most of the qualifications in this subset were Performance Table qualifications, so the same trends apply for those qualifications included in Figure 8.
For Level 1/2 Other General qualifications not in performance tables (Figure 9), there has been an increase in the proportion of top grades being awarded between 2019 and 2021. It is worth noting that this is very small subset of qualifications.
Any changes in Level 1/2 qualifications over time should be interpreted in the context of the relatively large changes in entry size over time given in Figure 4 and Figure 5.
Figure 7. Grade distributions for Level 1/2 qualifications by grading structure
Note: The numbers of qualifications and results given in the text boxes relate to 2021 only. Numbers of results have been rounded to the nearest 5.
(a) L1P/L1M/L1D/L1D*/L2P/L2M/L2D/L2D*
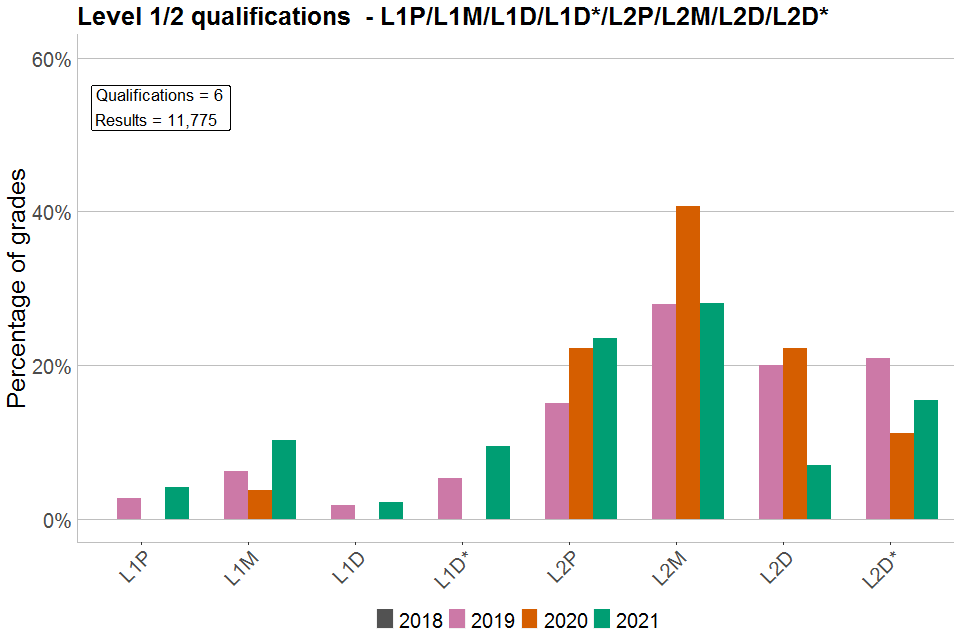
Bar chart showing percentages of each grade awarded in Level 1/2 qualifications graded L1P/L1M/L1D/L1D*/L2P/L2M/L2D/L2D*
(b) L1P/L1M/L1D/L2P/L2M/L2D/L2D*
Bar chart showing percentages of each grade awarded in Level 1/2 qualifications graded L1P/L1M/L1D/L2P/L2M/L2D/L2D*
(c) L1P/L2P/L2M/L2D/L2D*
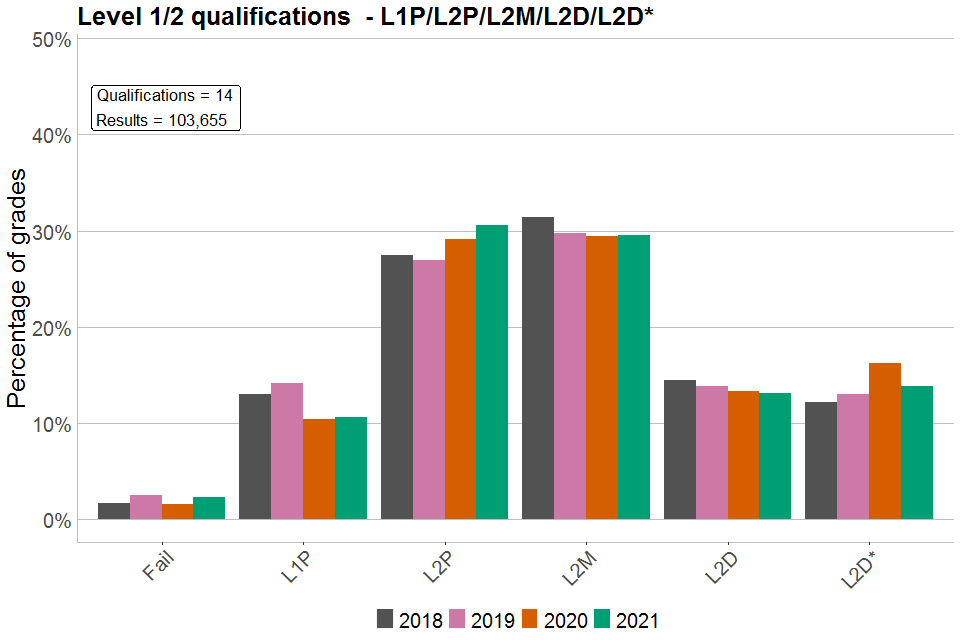
Bar chart showing percentages of each grade awarded in Level 1/2 qualifications graded L1P/L2P/L2M/L2D/L2D*
Figure 8. Grade distributions for Level 1/2 Performance Table qualifications by grading structure
Note: The numbers of qualifications and results given in the text boxes relate to 2021 only. Numbers of results have been rounded to the nearest 5.
(a) L1P/L1M/L1D/L1D*/L2P/L2M/L2D/L2D*

Bar chart showing percentages of each grade awarded in Level 1/2 PTQs graded L1P/L1M/L1D/L1D*/L2P/L2M/L2D/L2D*
(b) L1P/L1M/L1D/L2P/L2M/L2D/L2D*

Bar chart showing percentages of each grade awarded in Level 1/2 PTQs graded L1P/L1M/L1D/L2P/L2M/L2D/L2D*
(c) L1P/L2P/L2M/L2D/L2D*

Bar chart showing percentages of each grade awarded in Level 1/2 PTQs graded L1P/L2P/L2M/L2D/L2D*
Figure 9. Grade distributions for Level 1/2 Other General qualifications by grading structure
Note: The numbers of qualifications and results given in the text boxes relate to 2021 only. Numbers of results have been rounded to the nearest 5.
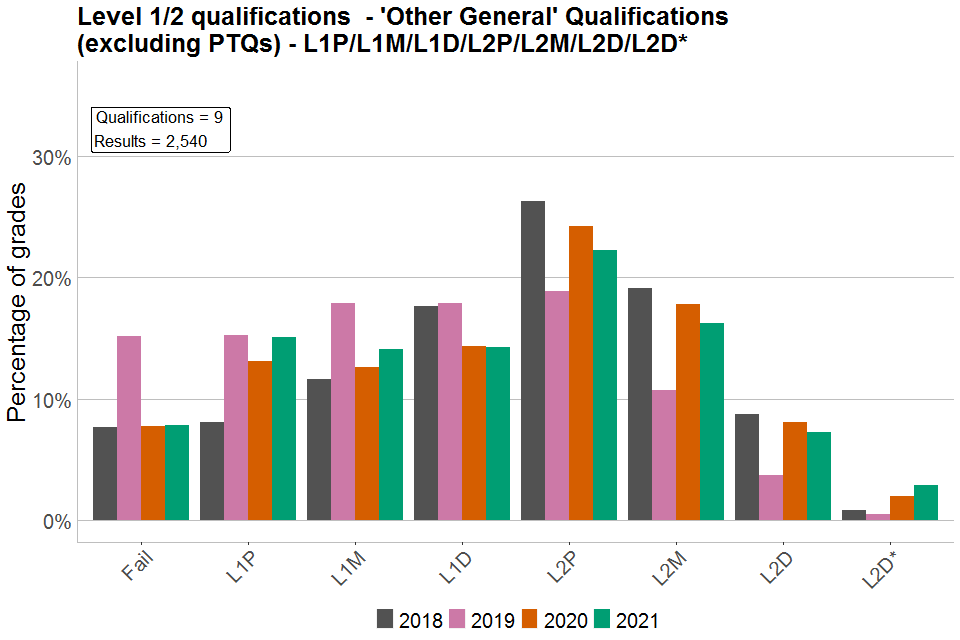
Bar chart showing percentages of each grade awarded in Level 1/2 'Other General' qualifications
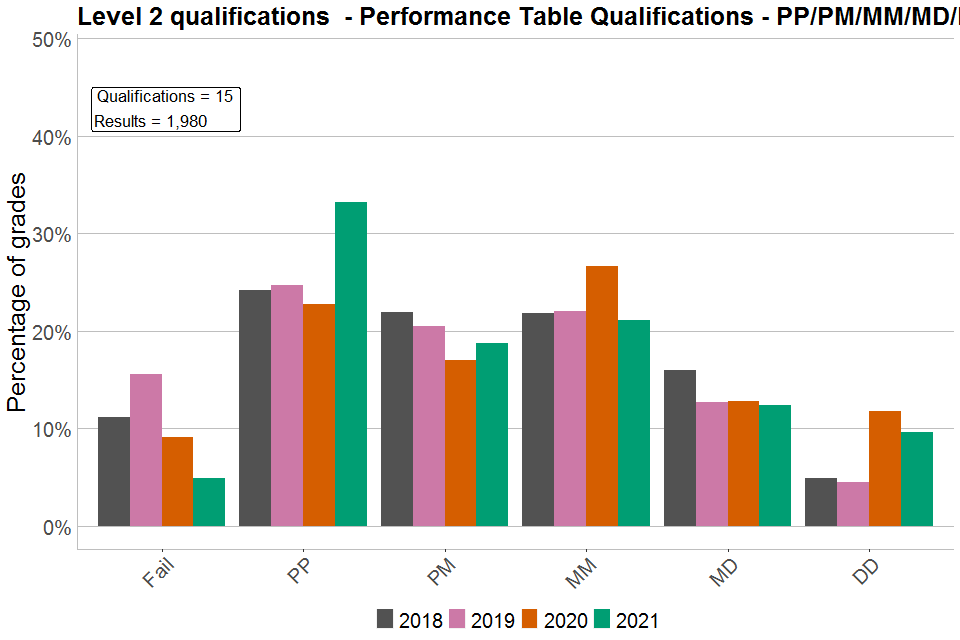
For Level 2 qualifications (Figure 10), the general shape of the distributions has again not substantially changed. In the 2 largest groups of qualifications – those using a Pass to Distinction scale and those using a Pass to Distinction* scale – the proportion of top grades increased between 2020 and 2021, with that increase being larger for the former than the latter. These same trends are also evident for Level 2 Performance Table qualifications (Figure 11). For Other General qualifications (Figure 12), there was a slight decrease in proportions of top grades for Pass to Distinction* qualifications.
Figure 10. Grade distributions for Level 2 qualifications by grading structure
Note: The numbers of qualifications and results given in the text boxes relate to 2021 only. Numbers of results have been rounded to the nearest 5.
(a) P/M/D
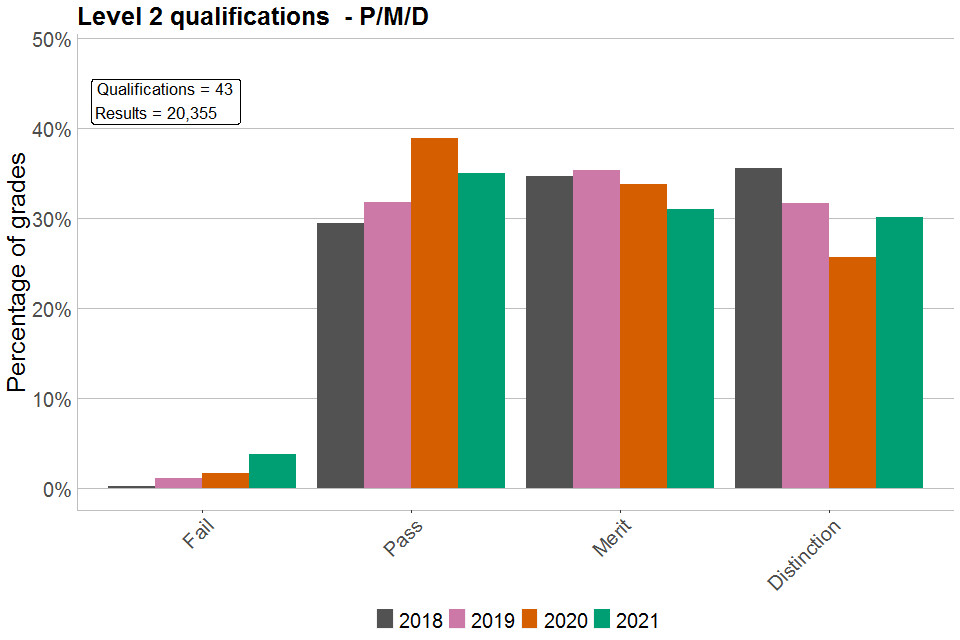
Bar chart showing percentages of each grade awarded in Level 2 qualifications graded P/M/D
(b) P/M/D/D*
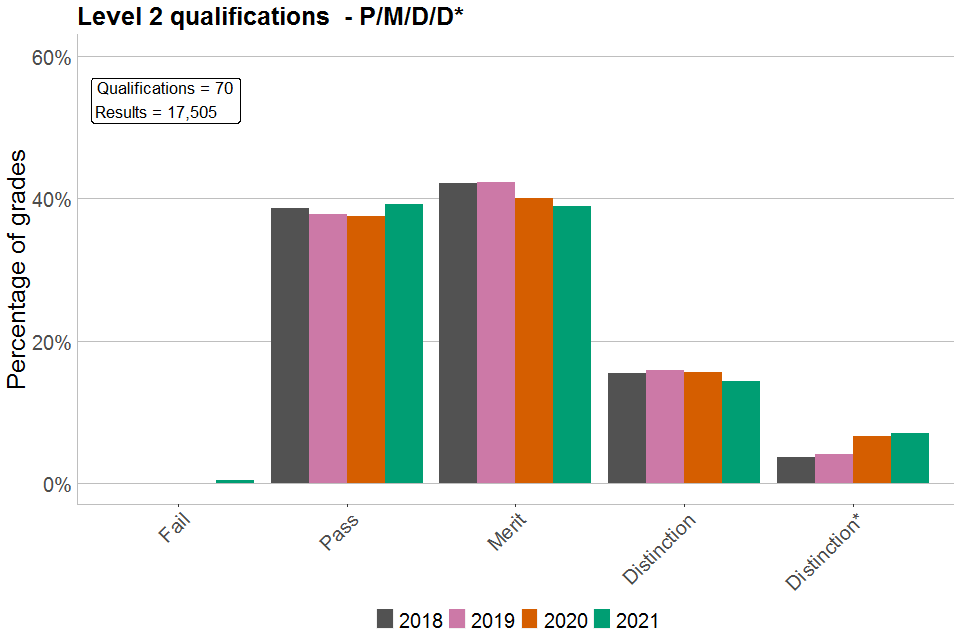
Bar chart showing percentages of each grade awarded in Level 2 qualifications graded P/M/D/D*
(c) PP/PM/MM/MD/DD
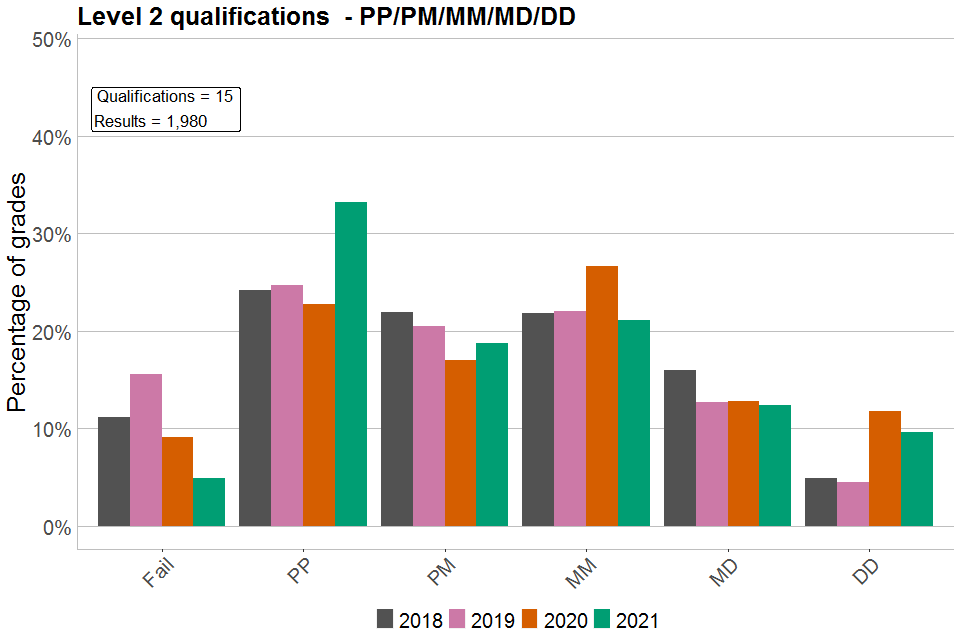
Bar chart showing percentages of each grade awarded in Level 2 qualifications graded PP/PM/MM/MD/DD
Figure 11. Grade distributions for Level 2 Performance Table qualifications by grading structure
Note: The numbers of qualifications and results given in the text boxes relate to 2021 only. Numbers of results have been rounded to the nearest 5.
(a) P/M/D
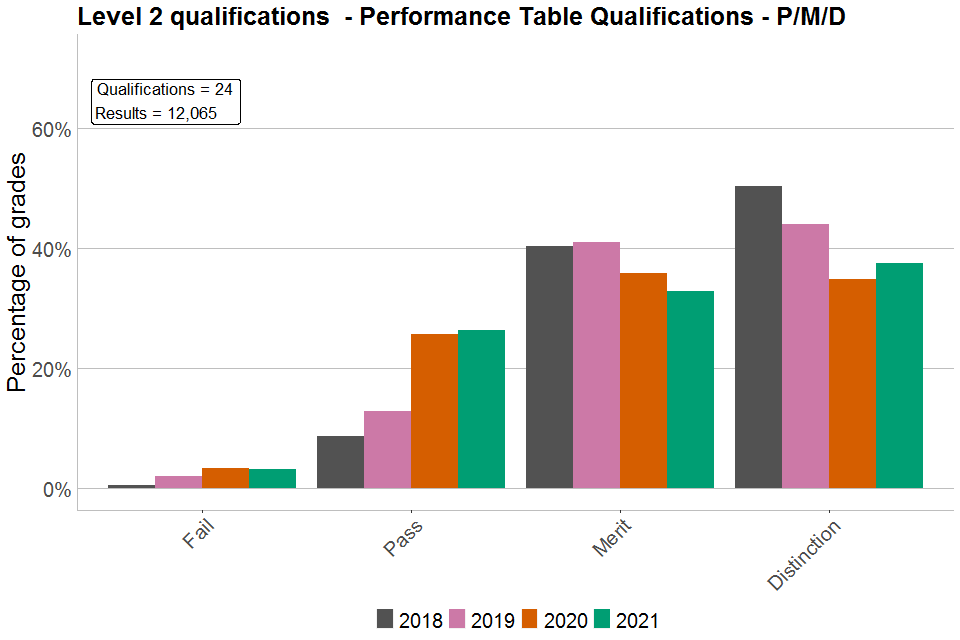
Bar chart showing percentages of each grade awarded in Level 2 PTQs graded P/M/D
(b) P/M/D/D*
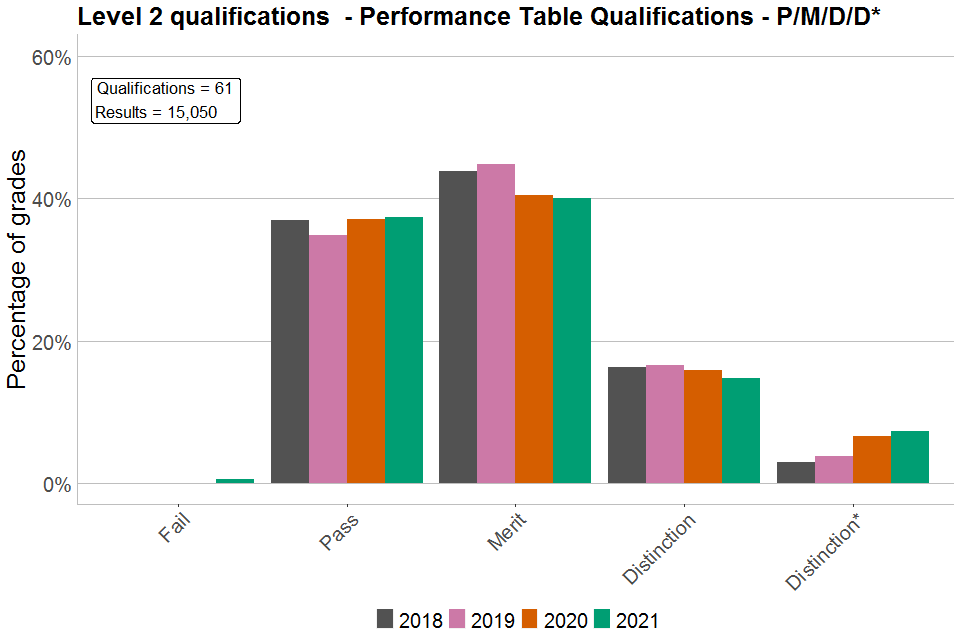
Bar chart showing percentages of each grade awarded in Level 2 PTQs graded P/M/D/D*
(c) PP/PM/MM/MD/DD
Bar chart showing percentages of each grade awarded in Level 2 PTQs graded PP/PM/MM/MD/DD
Figure 12. Grade distributions for Level 2 Other General qualifications by grading structure
Note: The numbers of qualifications and results given in the text boxes relate to 2021 only. Numbers of results have been rounded to the nearest 5.
(a) P/M/D
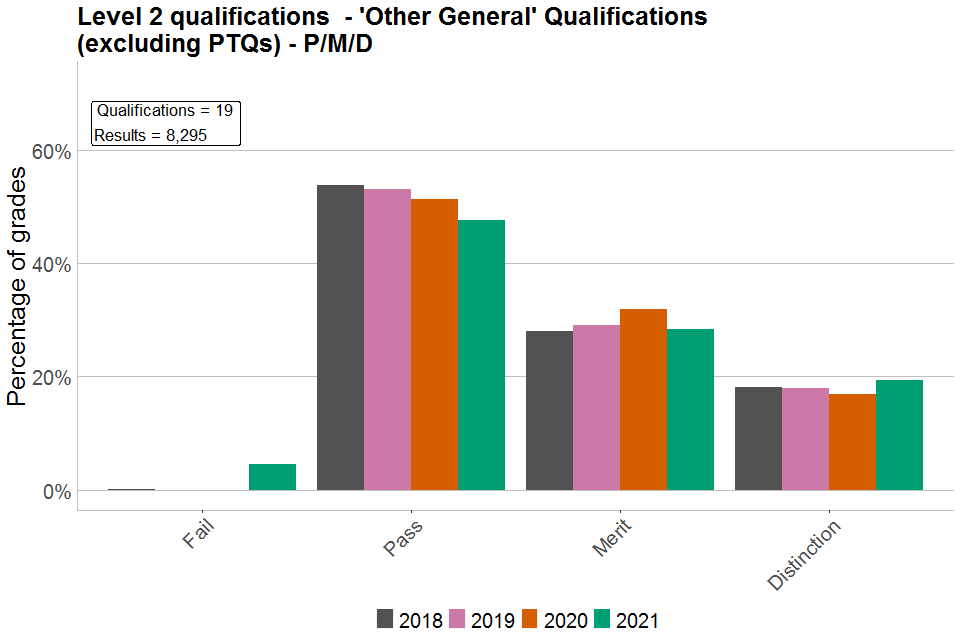
Bar chart showing percentages of each grade awarded in Level 2 'Other General' qualifications graded P/M/D
(b) P/M/D/D*
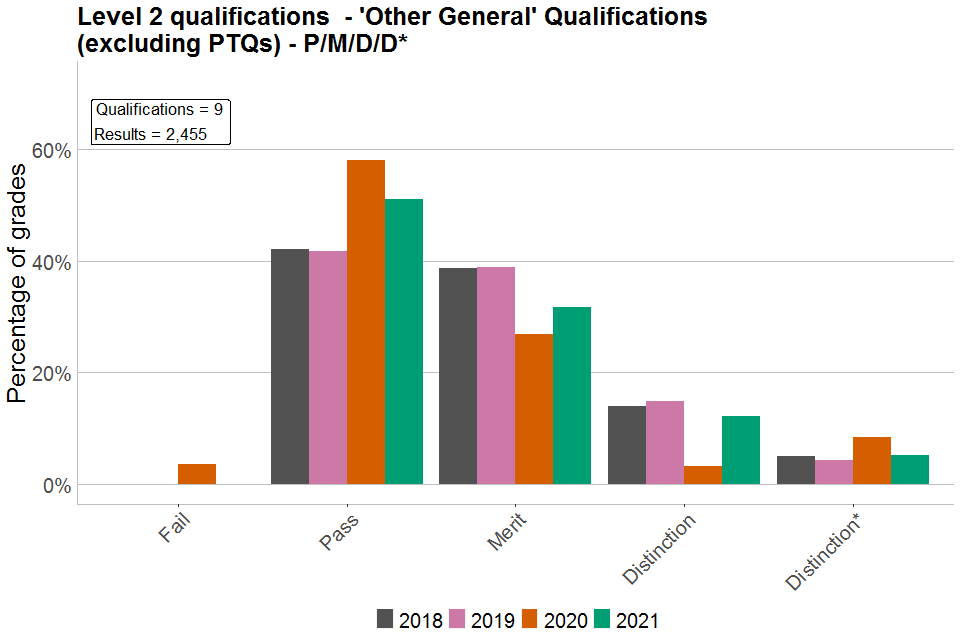
Bar chart showing percentages of each grade awarded in Level 2 'Other General' qualifications graded P/M/D/D*
Level 3 qualifications
Total volumes for Level 3 qualifications are shown in Figure 13. Here, there has been a rise in volumes over time, increasingly so in 2021 relative to 2020, which is primarily due to a rise in entries for Applied General qualifications (Figure 14; including some BTECs, Cambridge Technicals, and others). Numbers for other Performance Table qualifications have returned to 2019 levels, and numbers for Other General qualifications not in performance tables have remained relatively stable over time.
Figure 13. Total grades over time for Level 3 qualifications
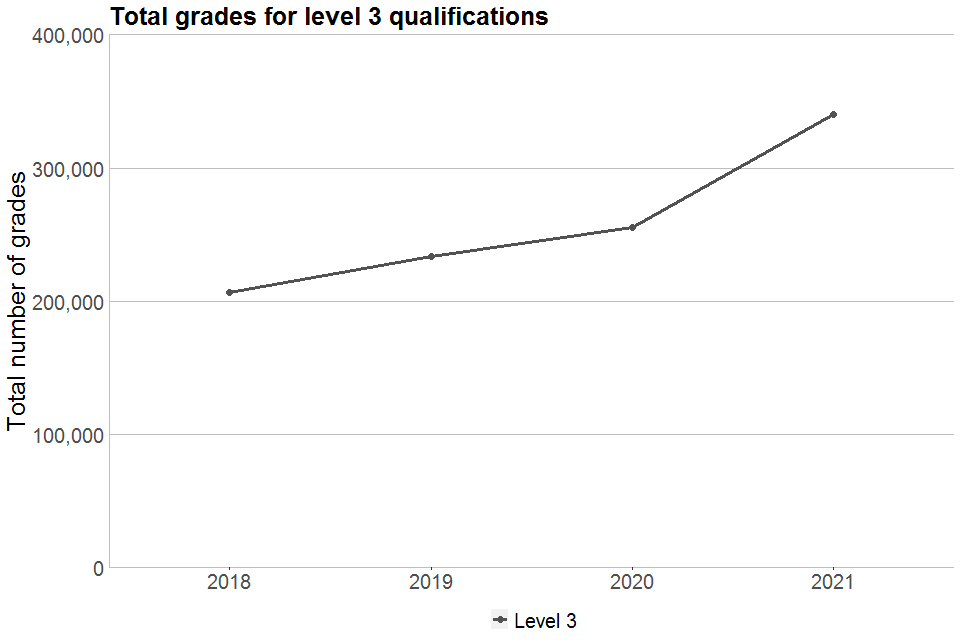
Line chart showing total grades awarded for Level 3 VTQs in 2018, 2019, 2020 and 2021
Figure 14. Total grades over time for Level 3 qualifications by qualification group
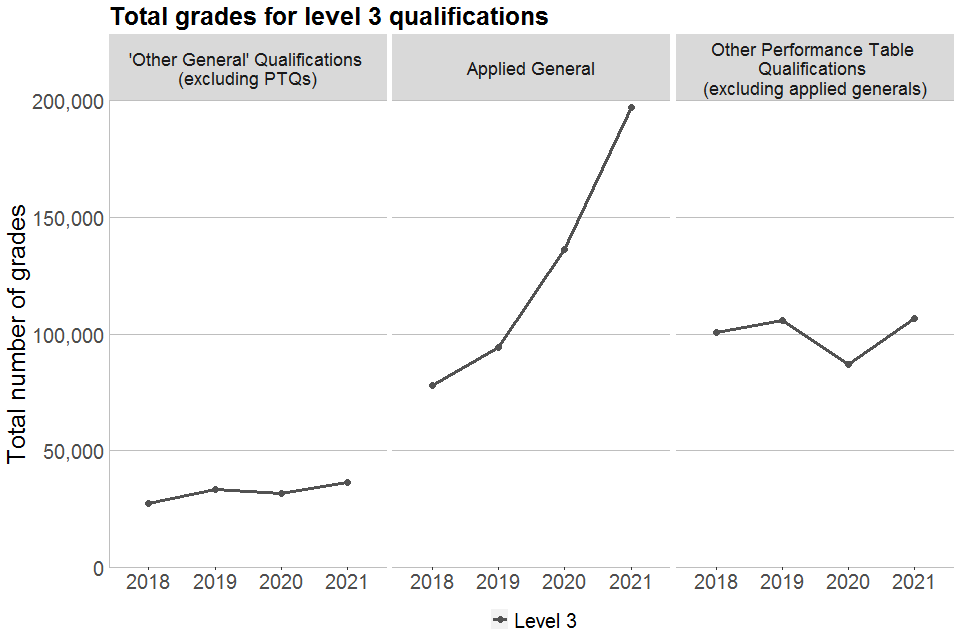
Line chart showing total grades awarded for Level 3 'Other General', Applied General and other Performance Table Qualifications in 2018, 2019, 2020 and 2021
A greater range of grading structures are used in the Level 3 qualifications included in our sample, compared to Entry Level and Level 1, 1/2, and Level 2. As Figure 15 shows, the general shape of the distributions has not substantially changed over time, suggesting a general level of stability over time.
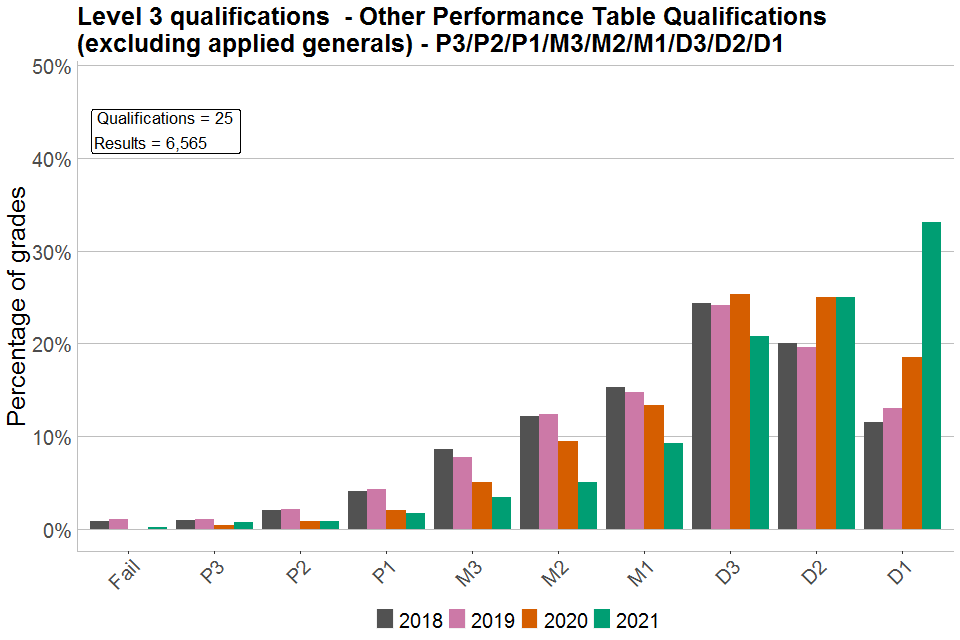
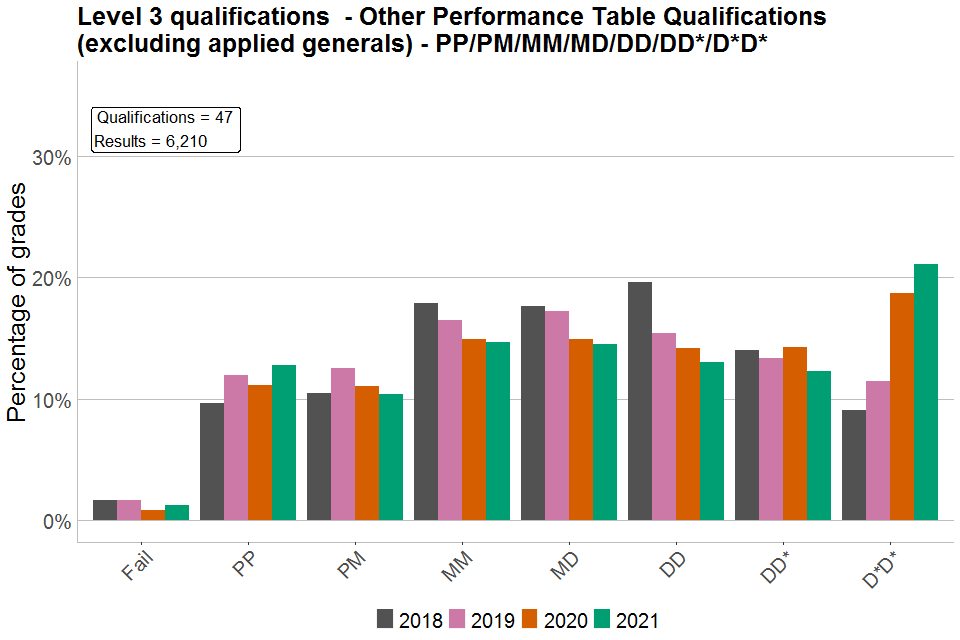
Like at Level 1/2, the picture is rather mixed with regards to the proportions of top grades being issued. In several larger groups of qualifications (for example, Pass to Distinction and double and triple-letter grade scales: PP to D*D* and PPP to D*D*D*), these proportions have increased. However, in the largest group (Pass to Distinction*), the proportion of top grades has decreased. For qualifications with the grades scale P3 to D1, there has been a relatively large increase in the proportion of top grades issued in 2021 compared to previous years. However, this is a small group of qualifications, with a relatively small number of results (6,565 results out of a total of over 340,000 at Level 3).
The same trends are reflected in Applied General qualifications (Figure 16), whereby the largest group (Pass to Distinction*) saw a slight decrease in the proportion of top grades being awarded, but qualifications using other grading structures saw an overall rise in these proportions.
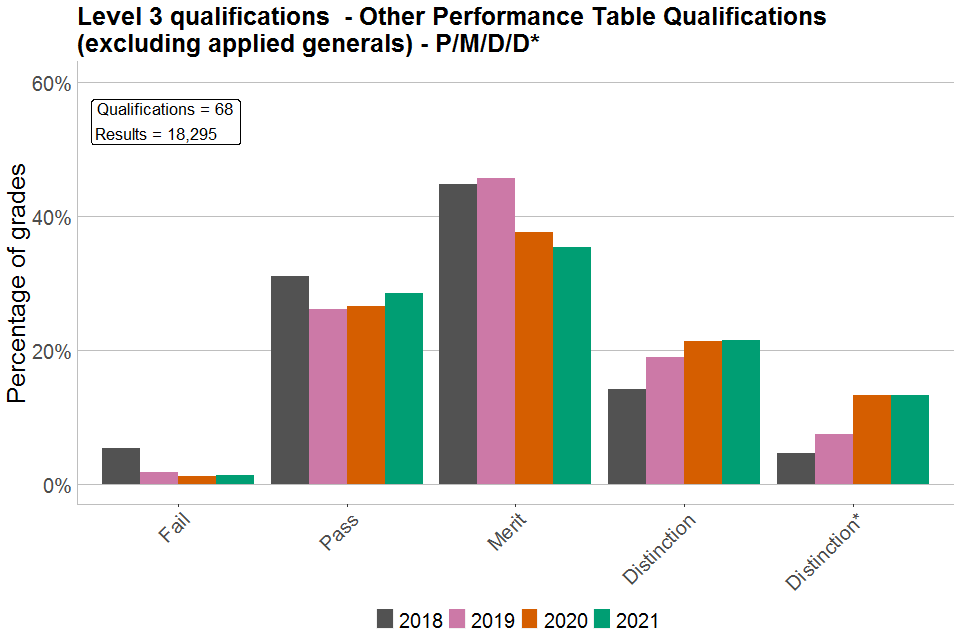
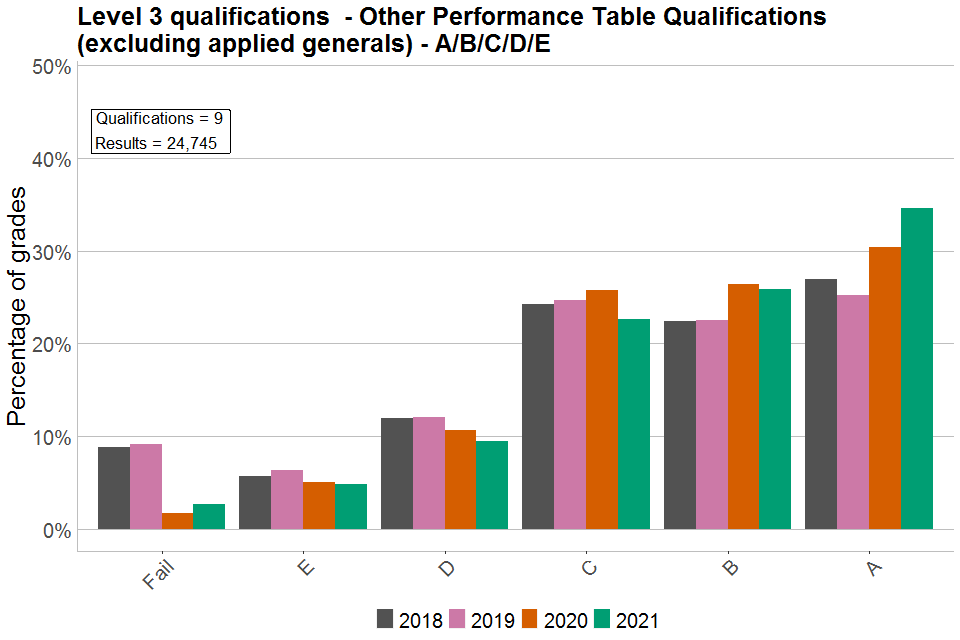
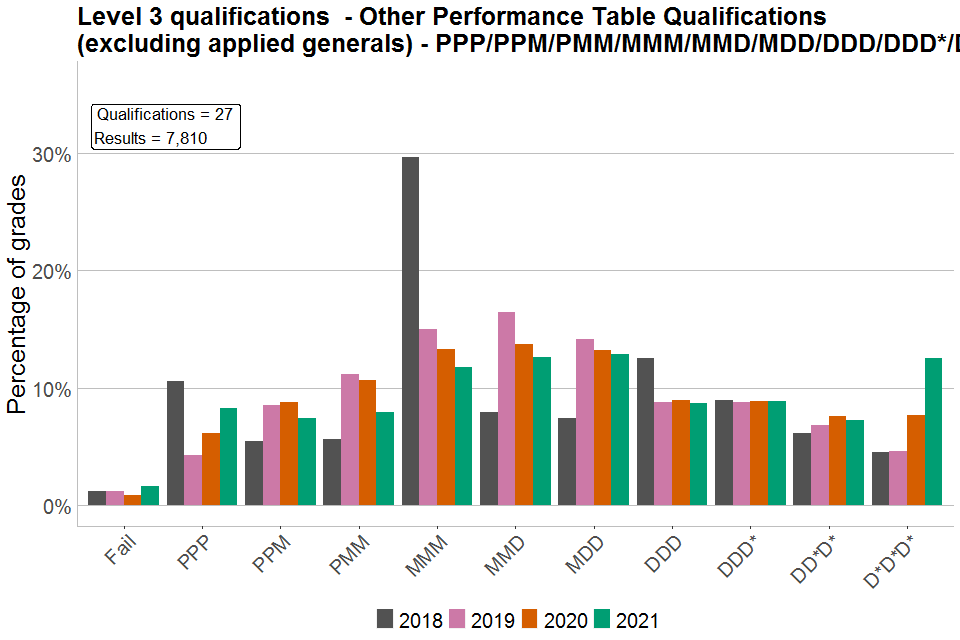
Similar trends overall were also seen for Other Performance table qualifications excluding Applied Generals (Figure 17), although some other grading structures also saw decreases in proportions of top grades. The P3 to D1 group again had an increase in the proportion of top grades as described above. The Pass to Distinction group also had a relatively large increase but was again a relatively small group compared to the Level 3 entry size overall.
Both grading structures used for Level 3 Other General qualifications not included in performance tables saw an increase in the proportion of top grades being awarded (Figure 18).
Figure 15. Grade distributions for Level 3 qualifications by grading structure
Note: The numbers of qualifications and results given in the text boxes relate to 2021 only. Numbers of results have been rounded to the nearest 5.
(a) 1/2/3/4/5/6/7
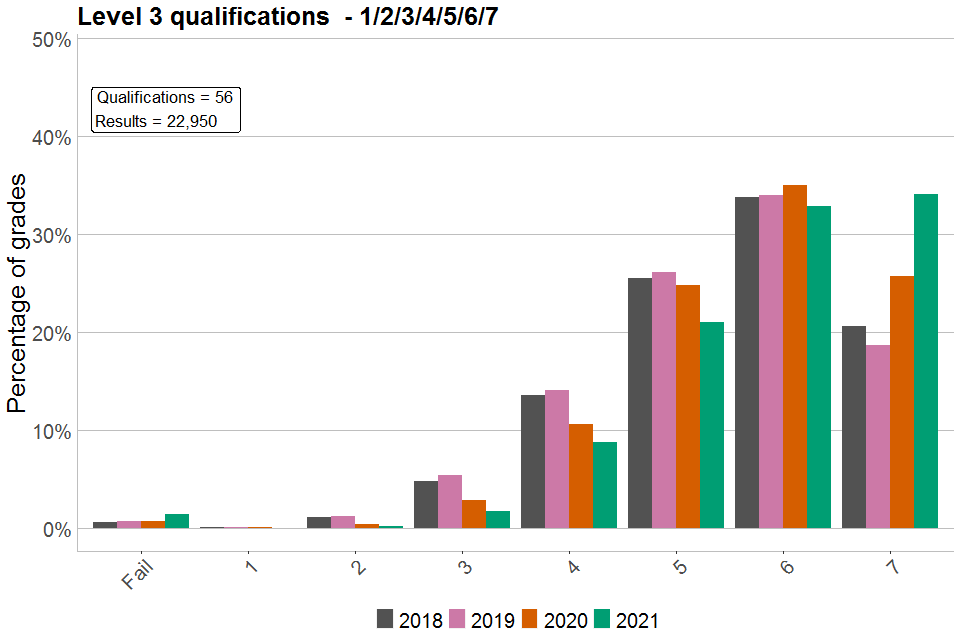
Bar chart showing percentages of each grade awarded in Level 3 VTQs graded 1/2/3/4/5/6/7
(b) A/B/C/D/E
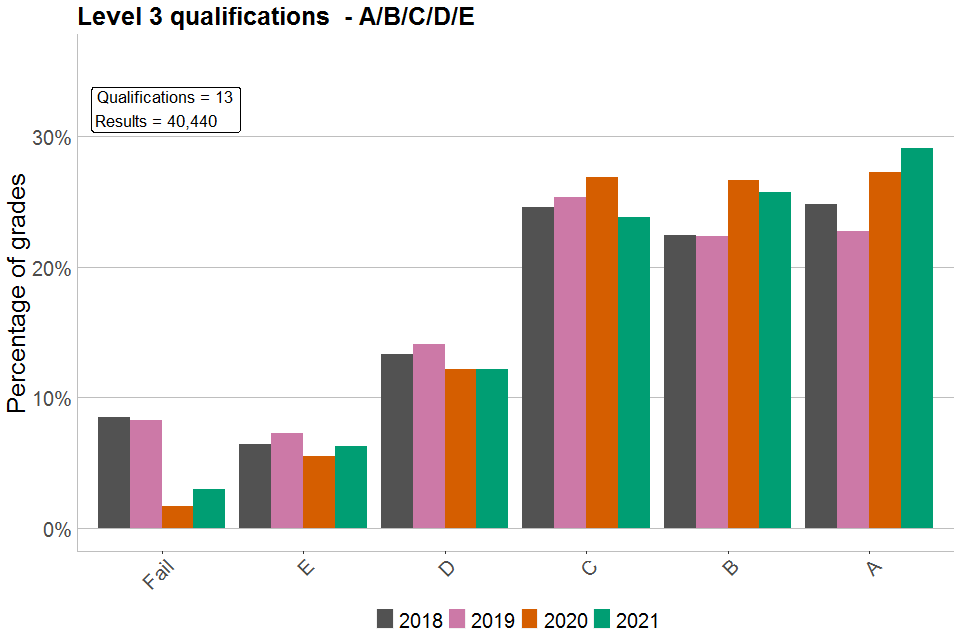
Bar chart showing percentages of each grade awarded in Level 3 VTQs graded A/B/C/D/E
(c) A*/A/B/C/D
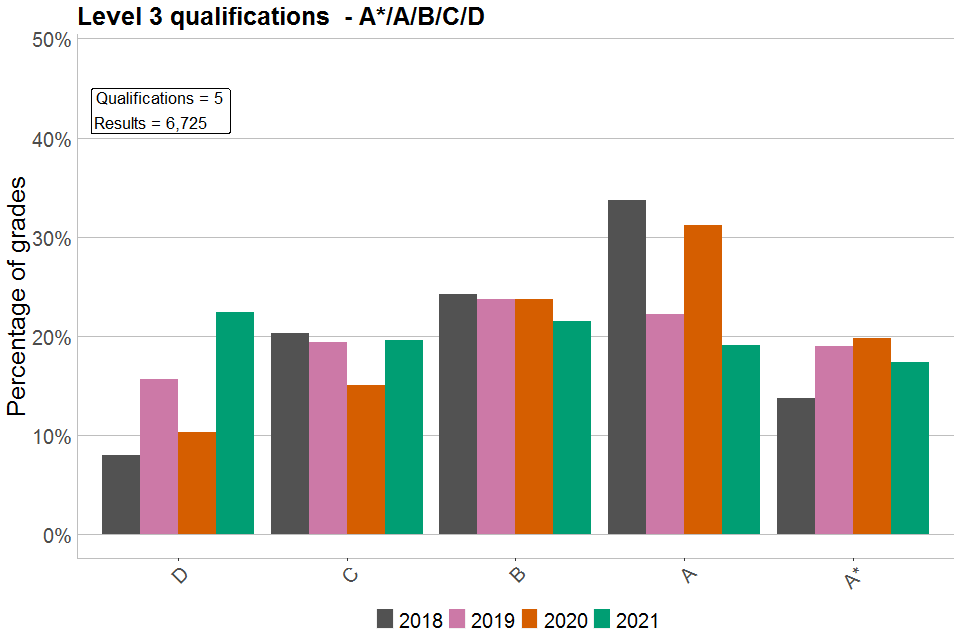
Bar chart showing percentages of each grade awarded in Level 3 VTQs graded A*/A/B/C/D
(d) P/M/D
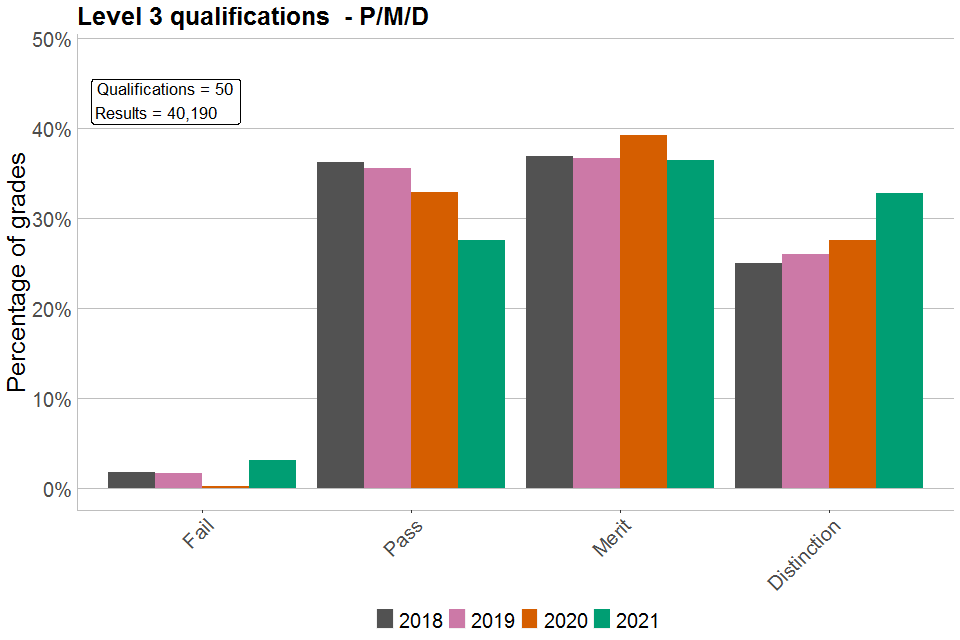
Bar chart showing percentages of each grade awarded in Level 3 VTQs graded P/M/D
(e) A*/A/B/C/D/E
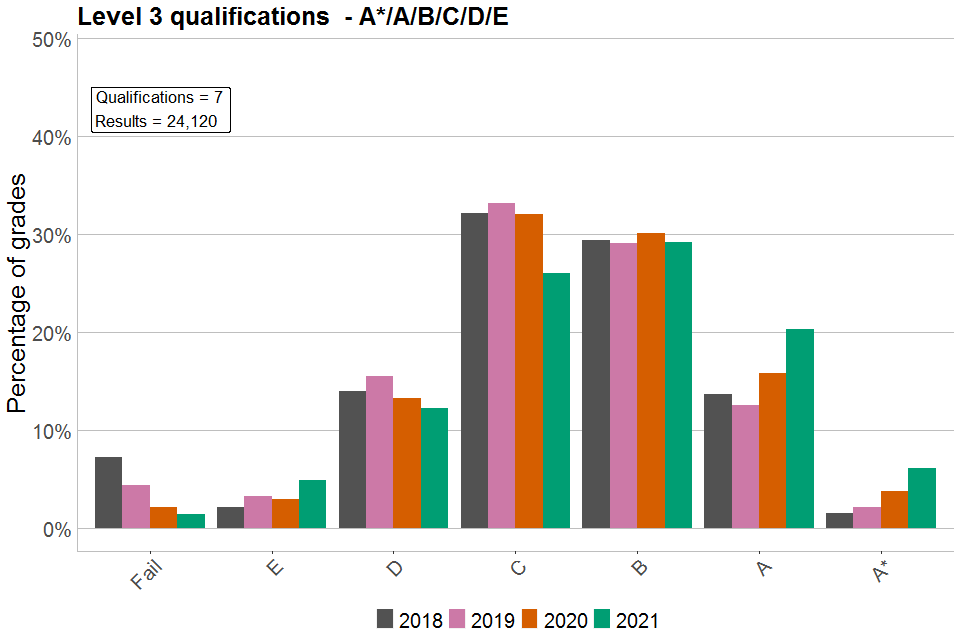
Bar chart showing percentages of each grade awarded in Level 3 VTQs graded A*/A/B/C/D/E
(f) P/M/D/D*
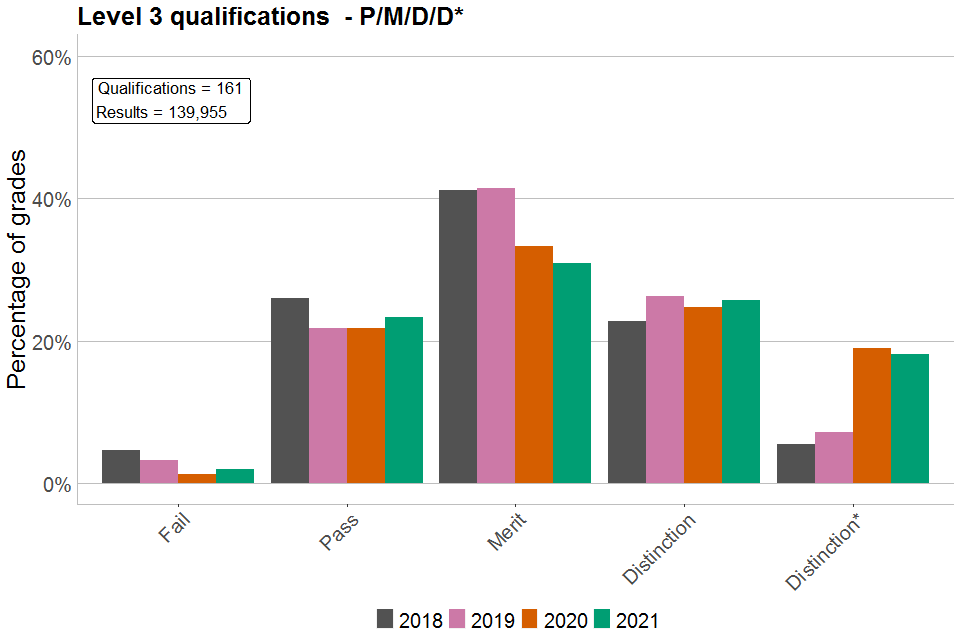
Bar chart showing percentages of each grade awarded in Level 3 VTQs graded P/M/D/D*
(g) P3/P2/P1/M3/M2/M1/D3/D2/D1
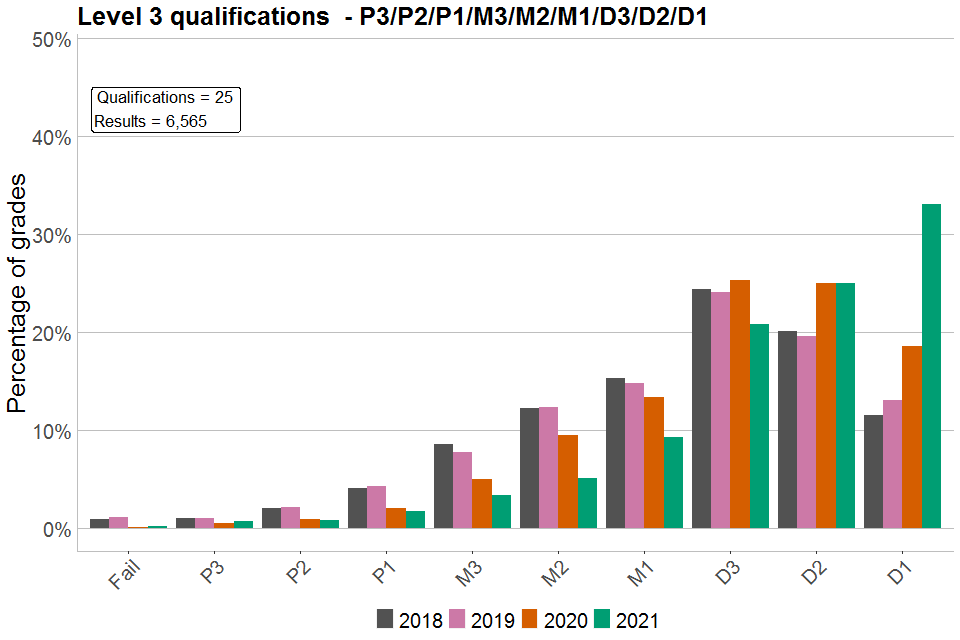
Bar chart showing percentages of each grade awarded in Level 3 VTQs graded P3/P2/P1/M3/M2/M1/D3/D2/D1
(h) PP/PM/MM/MD/DD/DD*/D*D*
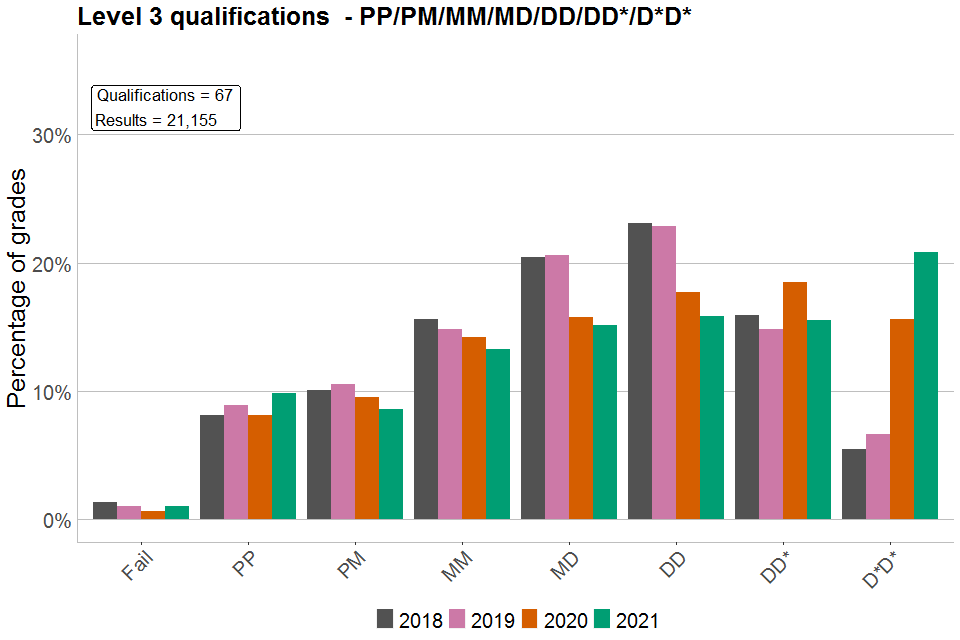
Bar chart showing percentages of each grade awarded in Level 3 VTQs graded PP/PM/MM/MD/DD/DD*/D*D*
(i) Pass/High Pass/Merit/High Merit/Distinction
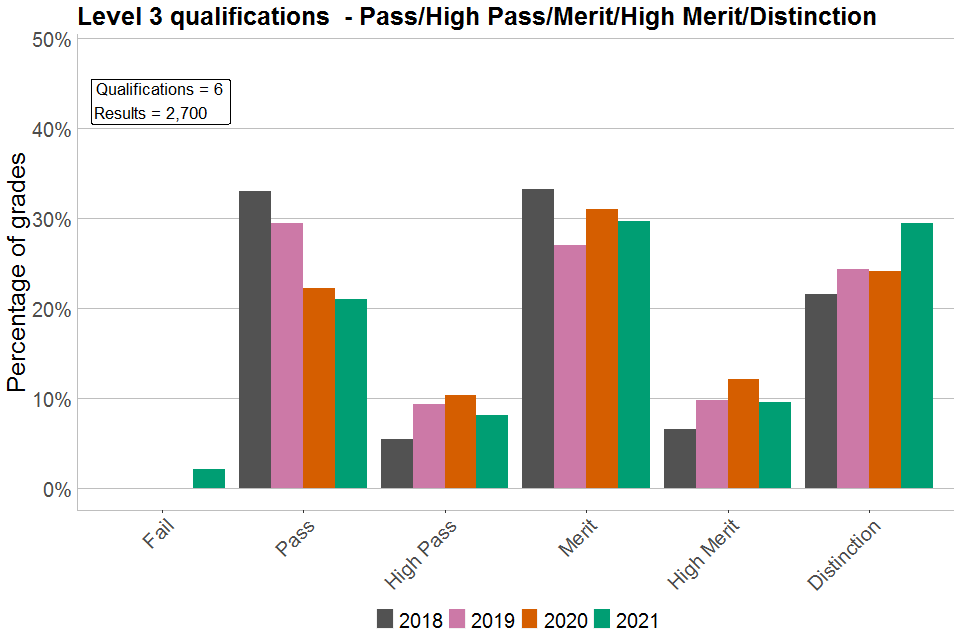
Bar chart showing percentages of each grade awarded in Level 3 VTQs graded Pass/High Pass/Merit/High Merit/Distinction
(j) PPP/PPM/PMM/MMM/MMD/MDD/DDD/DDD*/DD*D*/D*D*D*
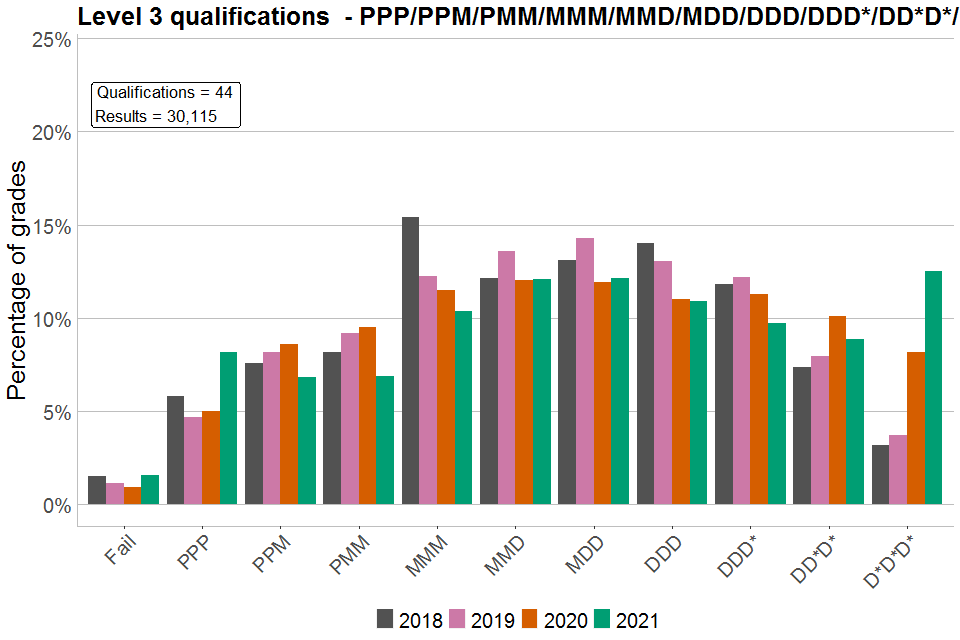
Bar chart showing percentages of each grade awarded in Level 3 VTQs graded PPP/PPM/PMM/MMM/MMD/MDD/DDD/DDD*/DD*D*/D*D*D*
Figure 16. Grade distributions for Level 3 Applied General qualifications by grading structure
Note: The numbers of qualifications and results given in the text boxes relate to 2021 only. Numbers of results have been rounded to the nearest 5.
(a) A*/A/B/C/D/E
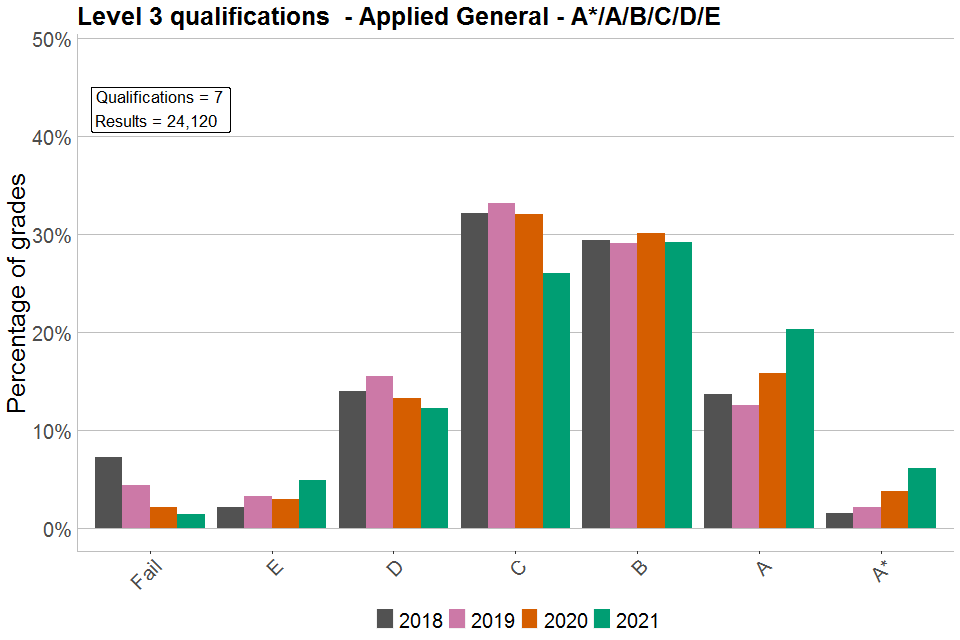
Bar chart showing percentages of each grade awarded in Level 3 Applied General qualifications graded A*/A/B/C/D/E
(b) PP/PM/MM/MD/DD/DD*/D*D*
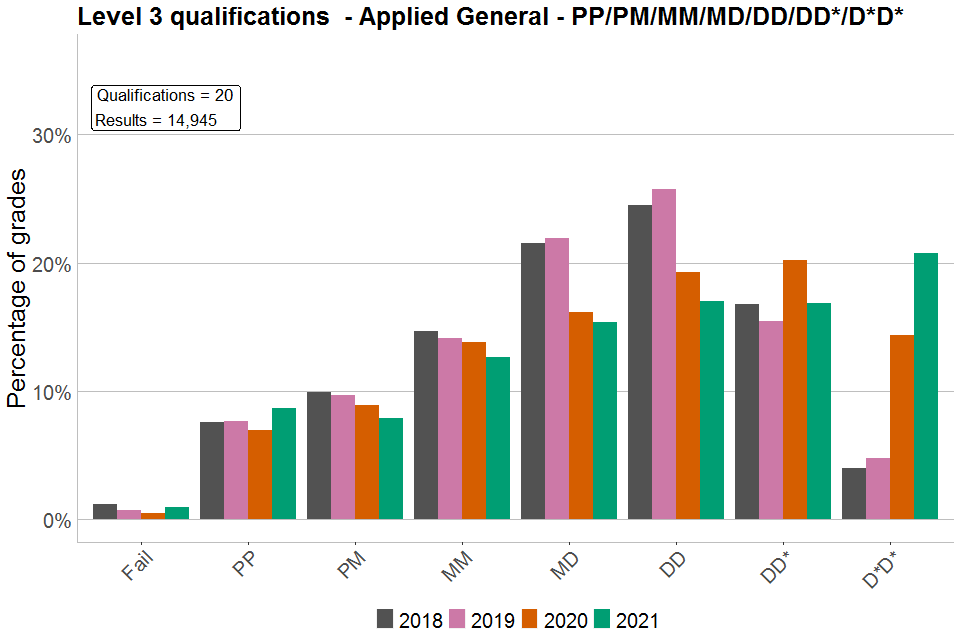
Bar chart showing percentages of each grade awarded in Level 3 Applied General qualifications graded PP/PM/MM/MD/DD/DD*/D*D*
(c) P/M/D/D*

Bar chart showing percentages of each grade awarded in Level 3 Applied General qualifications graded P/M/D/D*
(d) PPP/PPM/PMM/MMM/MMD/MDD/DDD/DDD*/DD*D*/D*D*D*

Bar chart showing percentages of each grade awarded in Level 3 Applied General qualifications graded PPP/PPM/PMM/MMM/MMD/MDD/DDD/DDD*/DD*D*/D*D*D*
Figure 17. Grade distributions for other Level 3 Performance Table qualifications by grading structure
Note: The numbers of qualifications and results given in the text boxes relate to 2021 only. Numbers of results have been rounded to the nearest 5.
(a) 1/2/3/4/5/6/7
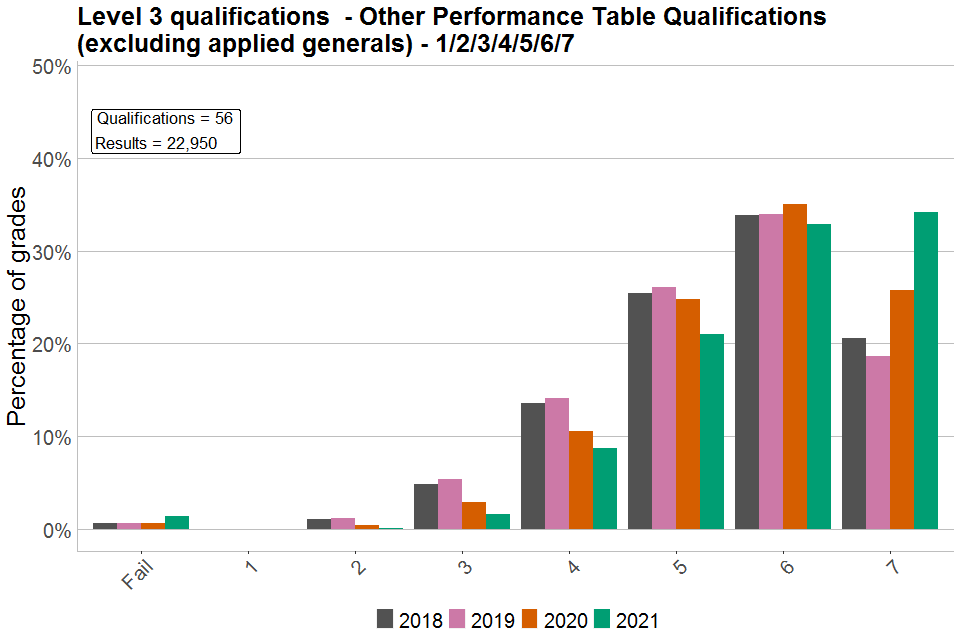
Bar chart showing percentages of each grade awarded in other Level 3 PTQs graded 1/2/3/4/5/6/7
(b) P/M/D
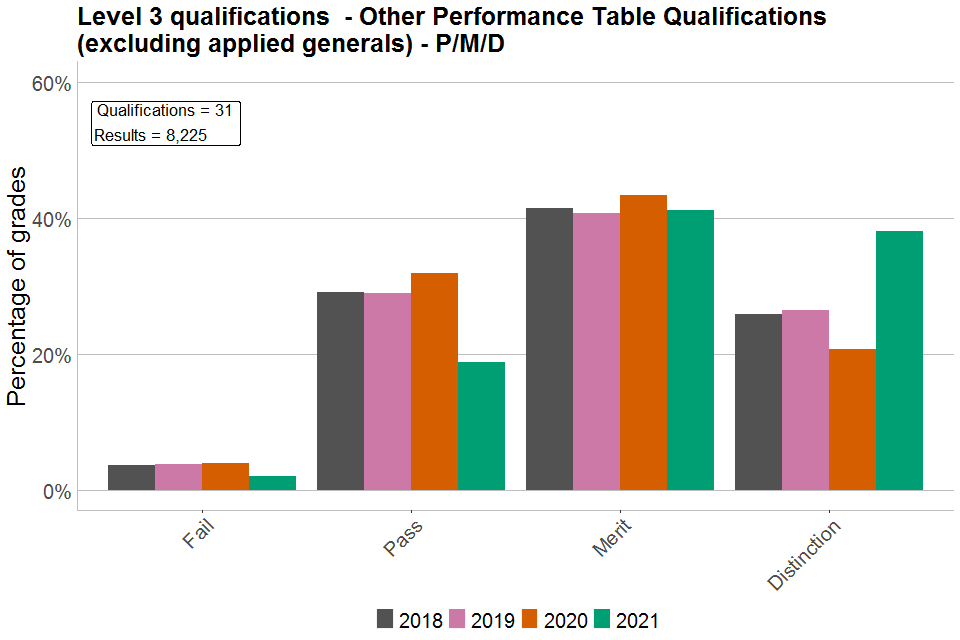
Bar chart showing percentages of each grade awarded in other Level 3 PTQs graded P/M/D
(c) A*/A/B/C/D
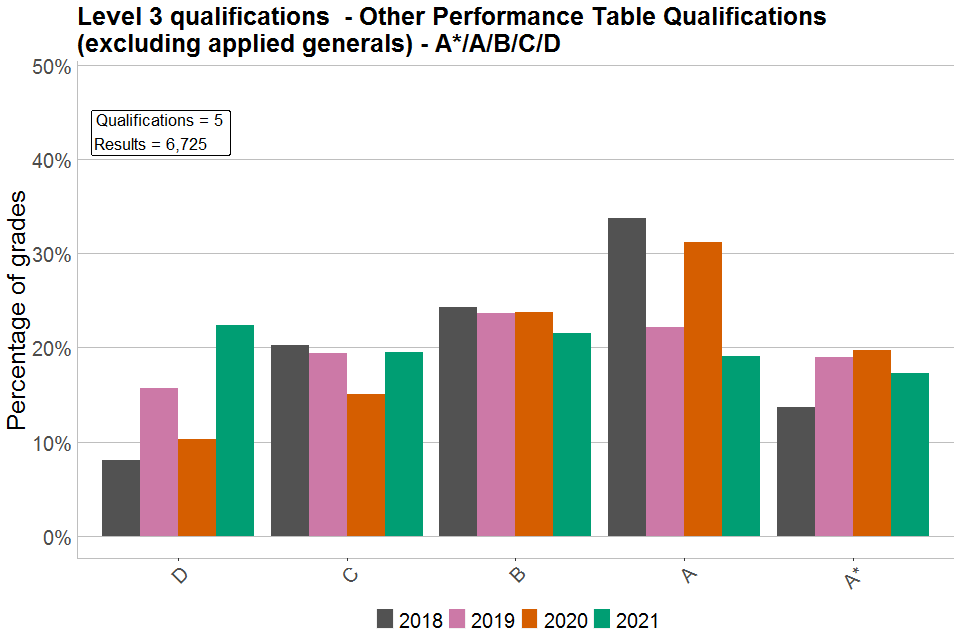
Bar chart showing percentages of each grade awarded in other Level 3 PTQs graded A*/A/B/C/D
(d) P/M/D/D*
Bar chart showing percentages of each grade awarded in other Level 3 PTQs graded P/M/D/D*
(e) A/B/C/D/E
Bar chart showing percentages of each grade awarded in other Level 3 PTQs graded A/B/C/D/E
(f) P3/P2/P1/M3/M2/M1/D3/D2/D1
Bar chart showing percentages of each grade awarded in other Level 3 PTQs graded P3/P2/P1/M3/M2/M1/D3/D2/D1
(g) PP/PM/MM/MD/DD/DD*/D*D*
Bar chart showing percentages of each grade awarded in other Level 3 PTQs graded PP/PM/MM/MD/DD/DD*/D*D*
(h) PPP/PPM/PMM/MMM/MMD/MDD/DDD/DDD*/DD*D*/D*D*D*
Bar chart showing percentages of each grade awarded in other Level 3 PTQs graded PPP/PPM/PMM/MMM/MMD/MDD/DDD/DDD*/DD*D*/D*D*D*
Figure 18. Grade distributions for Level 3 Other General qualifications by grading structure
Note: The numbers of qualifications and results given in the text boxes relate to 2021 only. Numbers of results have been rounded to the nearest 5.
(a) P/M/D
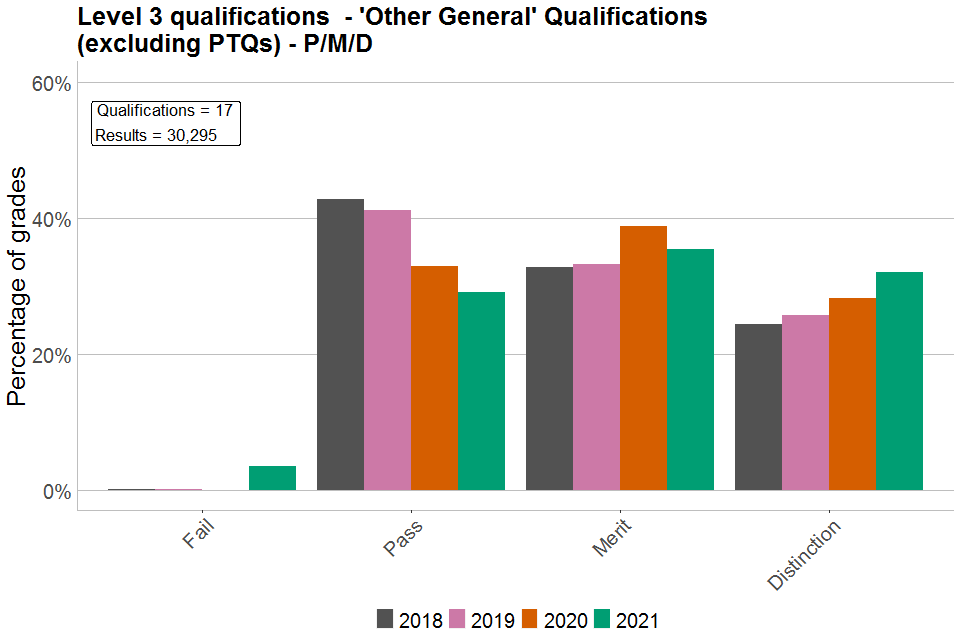
Bar chart showing percentages of each grade awarded in Level 3 'Other General' qualifications graded P/M/D
(b) P/M/D/D*
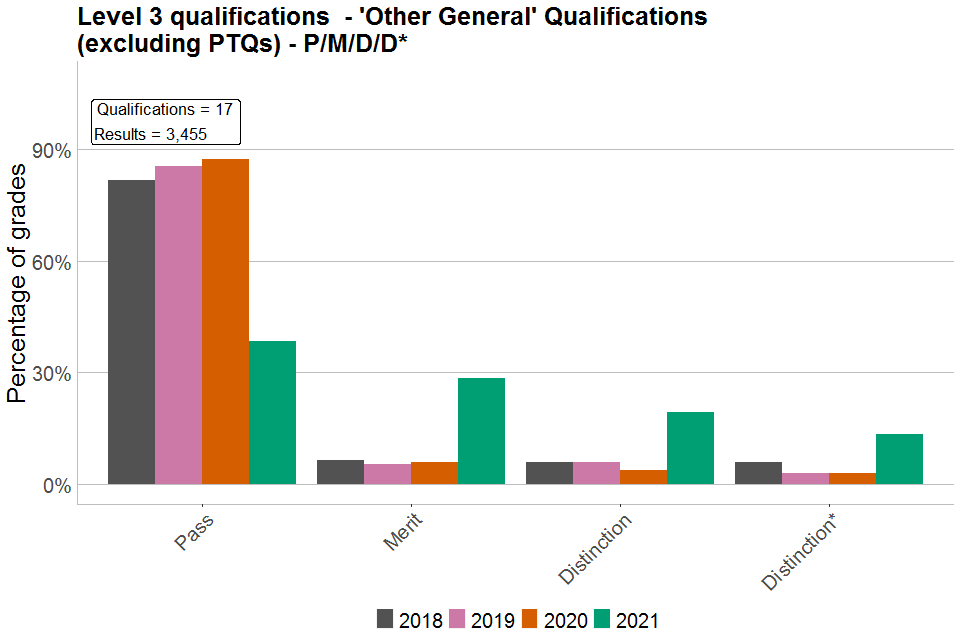
Bar chart showing percentages of each grade awarded in Level 3 'Other General' qualifications graded P/M/D/D*
Regional analysis
The purpose of this section is to explore whether any differences in the attainment of top grades appear to exist across different regions. We focus on top grades simply because the presentation of full grade distributions for every combination of grading structure and region would be overwhelming for the reader.
Figures 19 to 25 show that the degree of change for each region between 2018, 2019, 2020 and 2021 is relatively consistent, accounting for the fact that a degree of variation occurs every year. The changes occurring in 2021 from previous years for any 1 region do not seem out of the ordinary, relative to other regions, suggesting a relative picture of stability across regions.
Figure 19. Proportion of top grades issued by region – Level 1, 1/2, 2
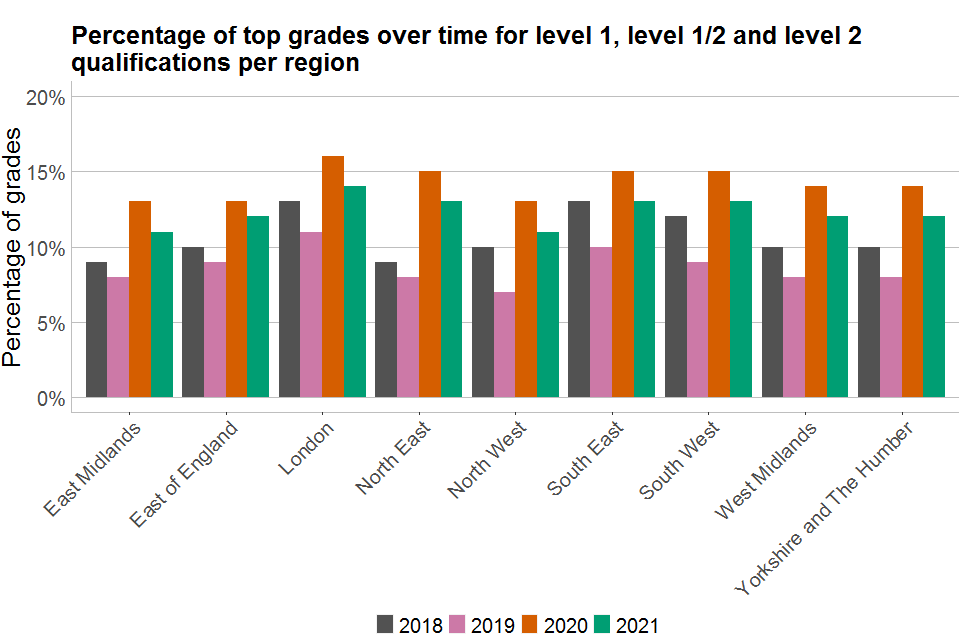
Bar chart showing a regional breakdown of percentages of top grades over time for all Level 1, Level 1/2 and Level 2 VTQs
Figure 20. Proportion of top grades issued by region – Level 1, 1/2, 2 Performance Table qualifications
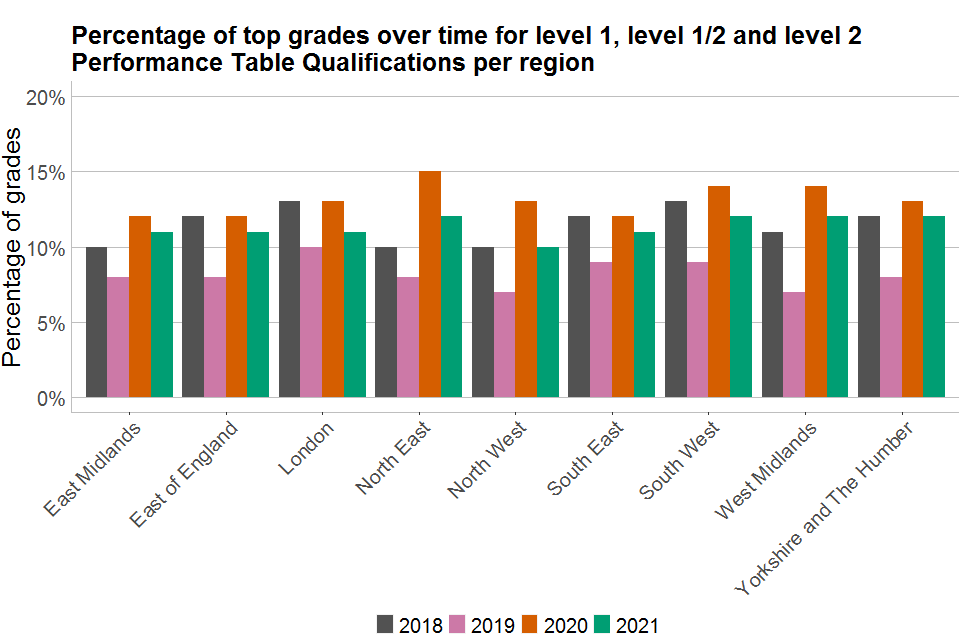
Bar chart showing a regional breakdown of percentages of top grades over time for Level 1, Level 1/2 and Level 2 PTQs
Figure 21. Proportion of top grades issued by region – Level 1, 1/2, 2 Other General qualifications
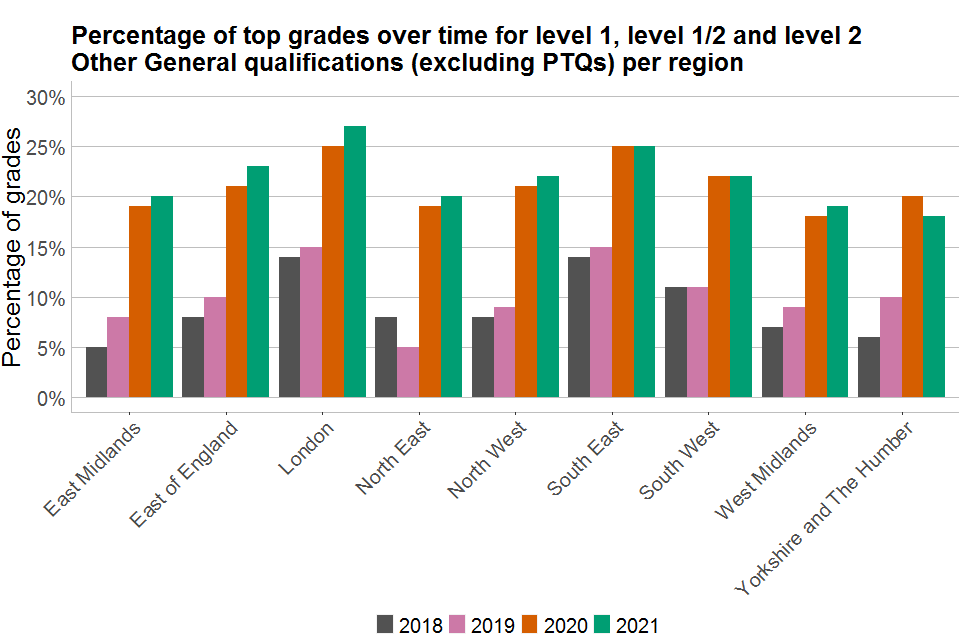
Bar chart showing a regional breakdown of percentages of top grades over time for Level 1, Level 1/2 and Level 2 'Other General' qualifications
Figure 22. Proportion of top grades issued by region – Level 3
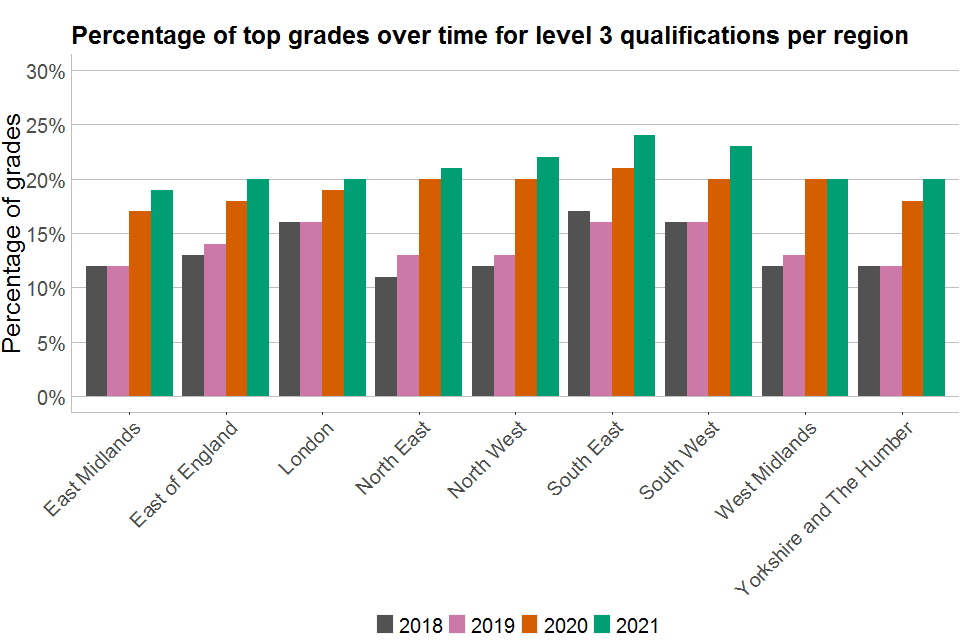
Bar chart showing a regional breakdown of percentages of top grades over time for all Level 3 VTQs
Figure 23. Proportion of top grades issued by region – Level 3 Applied General qualifications
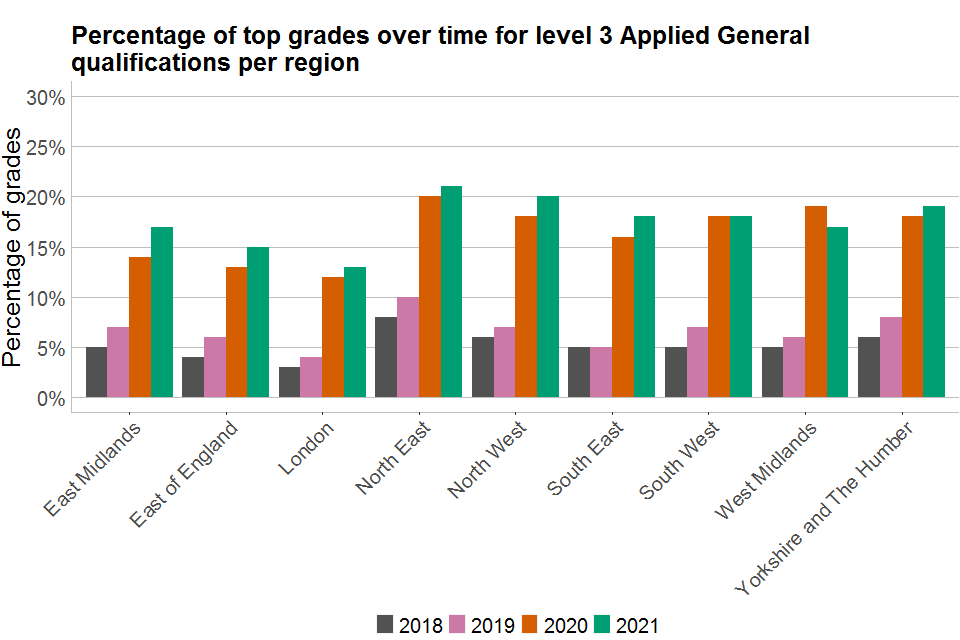
Bar chart showing a regional breakdown of percentages of top grades over time for all Level 3 Applied General qualifications
Figure 24. Proportion of top grades issued by region – Level 3 other Performance Table qualifications
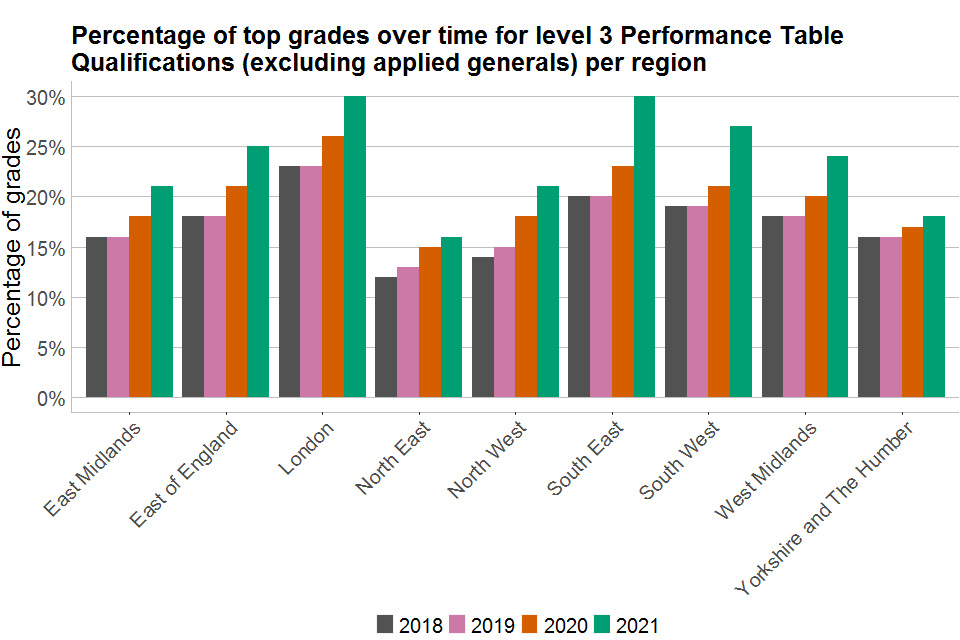
Bar chart showing a regional breakdown of percentages of top grades over time for all other Level 3 PTQs
Figure 25. Proportion of top grades issued by region – Level 3 Other General qualifications
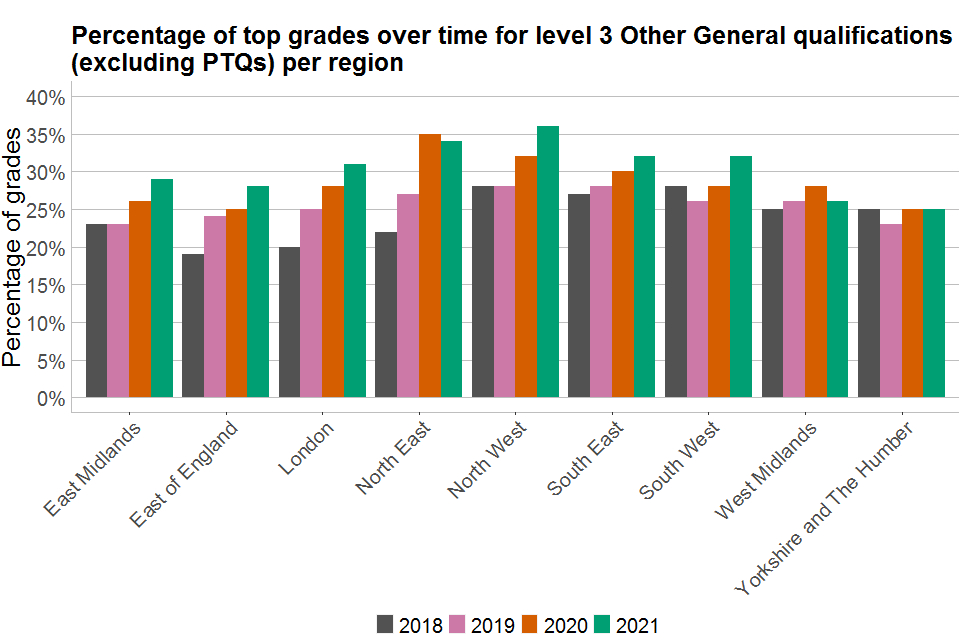
Bar chart showing a regional breakdown of percentages of top grades over time for Level 3 'Other General' qualifications
Summary
In terms of the volumes of results being issued, although some changes over time are apparent, the evidence does not suggest that there has been any sudden large notable change in entry behaviour this year. There has been a decrease in volumes for Functional Skills qualifications, but this appears to be an ongoing trend since at least 2018. Volumes for Performance Table qualifications at Level 1, 1/2 and Level 2 have been rising since 2018, although the increase between 2020 and 2021 is smaller than before. At Level 3, volumes for Applied General qualifications have also continued to rise over time. Although there was a reduction in entry size for other Level 3 Performance Table qualifications in 2020, this has recovered to 2019 volumes in 2021.
In terms of the distributions of grades being awarded, in most cases there have not been any substantial changes to the general shapes of the grade distributions at any qualification level, suggesting general stability across 2018, 2019, 2020 and 2021.
When focussing on the proportions of top grades being issued, the patterns of changes are mixed, with some qualification groupings seeing a decrease in proportions and others seeing an increase. This makes it difficult to draw any overarching conclusions for VTQs as a single group, instead reflecting the overall diversity of the market. One group of Level 3 Performance Table qualifications (with the grade scale P3 to D1) saw a large increase in the proportion of top grades being awarded this year compared to last (from 18.5% in 2020 to 33.1% in 2021). Another group (with the grade scale P/M/D) saw an increase from 21% in 2020 to 38% in 2021. However, these qualifications made up a relatively small proportion of the overall entry size at Level 3.
Further analyses did not suggest that any regions stand out as having a larger degree of change in the proportions of top grades being issued than any other region.
There are several factors that might help to explain the differences observed between groups of qualifications, and also the changes observed between years within each group, not necessarily related to the pandemic. To give just a few examples, different cohorts of VTQ learners may differ quite substantially with regards to their numbers, their ages, and the centres and centre types they attend. The general ability of cohorts of learners might also have changed over time. The qualifications contained within each of our groupings are also much more diverse than in GCSEs, AS and A levels, varying according to factors such as qualification size and types of assessment.
For each of the above reasons, it is important that the findings presented in this report should not be over-interpreted, particularly when trying to make causal attributions to the patterns observed. For example, although the patterns observed at the aggregate level may have been influenced by factors related to the pandemic, they may also simply reflect the other factors listed above, due to the normal general variability and diversity of VTQ sector. To fully untangle all of the possible contributing factors would require substantive consideration.
A final point to note is that VTQs can be assessed and awarded throughout the year. This is unlike GCSEs and A levels, which are primarily assessed in May and/or June each year. Volumes and results profiles might be different at different points in the year. Other VTQs not included within the scope of this work might also have different patterns of results.
In conclusion, while some changes in the pattern of results issued for this subset of VTQs in 2021 can be seen relative to previous years, we are unable to make claims as to the cause of such patterns. In addition, a small degree of change is to be expected in any given year and many of these changes are in line with those expectations. Nevertheless, it is notable that there does not seem to have been overall large changes in any single direction across the sector this year. This suggests there has not been any large systemic effects across the VTQ sector that have affected the profile of results.