Statistics on International Development: Final UK Aid Spend 2017
Published 29 November 2018

© Crown copyright 2018
This publication is licensed under the terms of the Open Government Licence v3.0 except where otherwise stated. To view this licence, visit nationalarchives.gov.uk/doc/open-government-licence/version/3 or write to the Information Policy Team, The National Archives, Kew, London TW9 4DU, or email: psi@nationalarchives.gov.uk.
Where we have identified any third party copyright information you will need to obtain permission from the copyright holders concerned.
This publication is available at https://www.gov.uk/government/statistics/statistics-on-international-development-final-uk-aid-spend-2017/statistics-on-international-development-final-uk-aid-spend-2017
Additional Tables and Annexes are available.
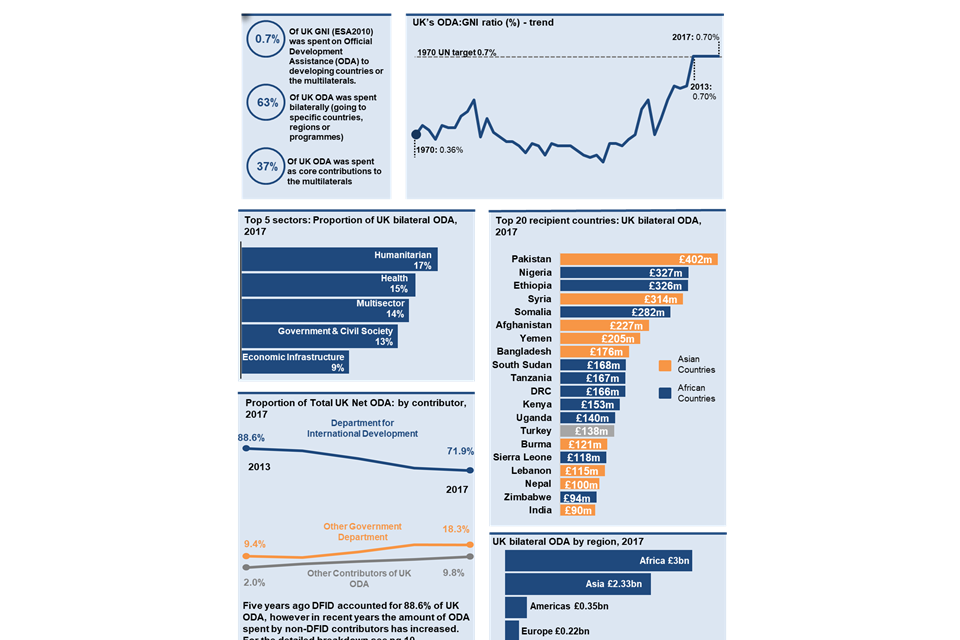
infographic View full size version of infographic: In 2017 the UK provided £14.1bn of Official Developmment Assistance
About this release
The publication focuses on the key international measure of official aid spend, known as Official Development Assistance (ODA). Box 1 explains the definition of ODA.
Box 1 - Key Definition: Official Development Assistance
Official Development Assistance (ODA) is produced according to standardised definitions and methodologies of the Organisation for Economic Cooperation and Development (OECD) Development Assistance Committee. ODA is defined as resource flows to developing countries and multilateral organisations, which are provided by official agencies (e.g. the UK Government) or their executive agencies, where each transaction meets the following tests:
- it is administered with the promotion of the economic development and welfare of developing countries as its main objective
- it is concessional, including grants and soft loans (Conveys a grant element of at least 25% calculated with a discount rate of 10%)
A glossary, explaining key terms used throughout this report, is available in Annex 1 of SID.
ODA is a calendar year cash flow measure and considers repayments as well as spend. (For more details see future developments in the background note).
It contains the release of finalised UK ODA spend figures for the calendar year, 2017, and includes total UK spend on ODA, including the UK’s ODA:GNI ratio; trends in the last 5 years (2013 to 2017 inclusive as shown in most tables) and key breakdowns by government department, recipient country or organisation, type of assistance and purpose.
This publication updates previous provisional figures of UK ODA for 2017 published in April 2018.
All data tables included in the publication are available to download in spreadsheet format. A full micro-dataset is also available in Open Data Standard format on the Statistics on International Development LINK.
Further information on the technical terms, data sources, quality and processing of the statistics in this publication are found in Annexes 1-4 LINK .
UK ODA spend figures for this publication are derived from:
- DFID’s ‘ARIES’ database of financial transactions relating to DFID payments and receipts, which is quality assured centrally to ensure that spend is in line with OECD definitions of ODA - this administrative source comprises 72% of total UK ODA in 2017
- similar financial transaction data from non-DFID departments, who also assess whether the spend is in line with the OECD definitions of ODA - these non-DFID sources account for around 27% in 2017
- estimated data, for some non-departmental components of ODA, such as Gift Aid spend on ODA eligible activity - these estimates are approximately 1% of ODA
Private spending or donations made to support developing countries, for example by the public, the voluntary sector or through remittances, is not part of the ODA definition and not covered in this publication. Information on this spend can be found in the Office for National Statistics, Living costs and Food Survey or the Charities Aid Foundation, UK giving report.
If there are any tables or data not available from this publication that you need for your own analysis, or if you have any thoughts about how to improve the publication, please contact the statistics team at: statistics@dfid.gov.uk.
UK ODA Flows
This section provides an overview of UK Official Development Assistance (ODA). It covers the amount of UK ODA spent, Gross National Income (GNI), the calculation of the ODA:GNI ratio, breakdowns of UK ODA spend by main delivery channel, and by Government Departments and other contributors.
The ODA:GNI Ratio
The ODA:GNI ratio presents the amount of UK Official Development Assistance (ODA) against Gross National Income (GNI).
The ODA:GNI target of 0.7% was first agreed internationally in 1970 by the United Nations General Assembly. The UK government made a commitment to invest 0.7% of GNI on ODA from 2013. In 2015 the International Development (Official Development Assistance Target) Act placed the commitment to spend 0.7% of GNI on ODA in UK law from 2015 and in each subsequent calendar year.
TABLE 1: GNI estimates and ODA:GNI Ratios, 2016 and 2017; Current Prices (£ millions)1,2 reports the ODA:GNI ratio for the calendar year 2017, based on the current international standard for measuring GNI, ESA 2010.
The UK provided a total of £14,059 million of ODA in 2017. This represented an increase of 5.1% (£682 million) between 2016 and 2017.
Table 1: GNI estimates and ODA:GNI Ratios, 2016 and 2017; Current Prices (£ millions)
The ODA:GNI ratio for 2017 was 0.70%, and therefore the UK met the 0.7% commitment, as set out by the International Development Act 2015.
Long Term Trends in UK ODA
Figure 1 shows the trend in UK ODA since 1970. Overall there has been a steady increase in the level of UK ODA since 1970, with a spike in 2005 and 2006 which was driven by high levels of debt relief, and then a steep increase in 2013 when the UK Government first met the 0.7% ODA:GNI target.
The jump in the level of ODA in 2016 (bars) reflects the switch to the European System of Accounts (ESA) 2010 methodology for measuring GNI and the consequent need to increase UK ODA to meet the 0.7% ODA target.
Figure 1: UK ODA levels (£ billions) and ODA:GNI ratios (%) 1970 - 20171
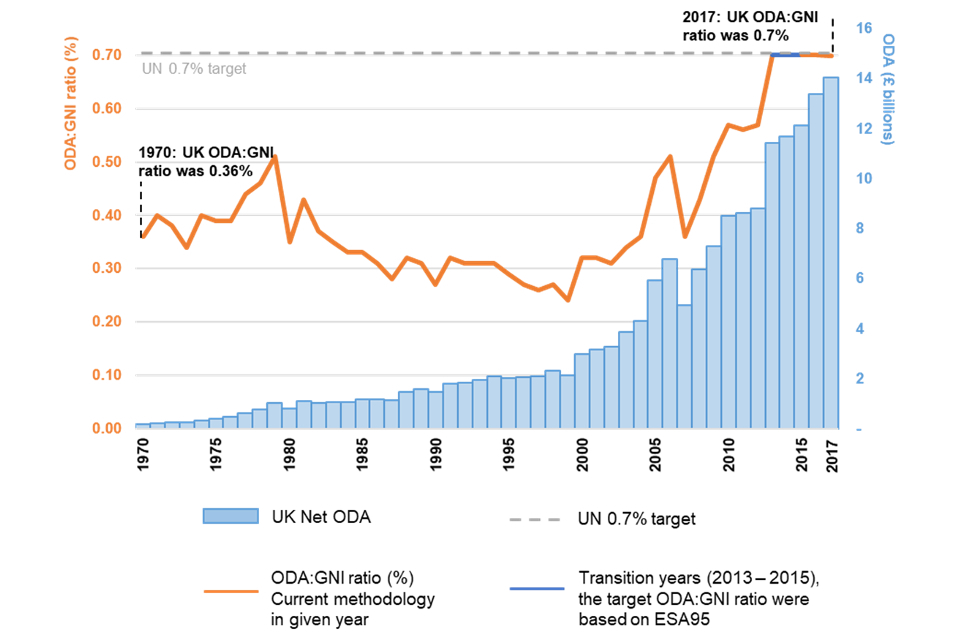
2013 -2015 were transition years when GNI based on ESA 1995 was used to calculate the ODA:GNI ratio. Underlying data for this graph can be found in the accompanying table ‘Statistics for International Development: Tables ’.
UK ODA by Main Delivery Channel
There are 2 main delivery channels for ODA: bilateral and multilateral. Bilateral ODA is earmarked spend which the donor has control over – this is usually ODA going to specific countries, regions or programmes. Bilateral ODA can be further subdivided into funding to multilateral organisations for specific programmes or in specific countries, known as ‘bilateral ODA through a multilateral organisation’, and funding spent through other delivery partners, such as Non-Governmental and Civil Society Organisations, research institutions and universities or directly by the government referred to as ‘Other bilateral’ ODA (Figure 2 ).
Multilateral ODA describes un-earmarked funds from national governments which are pooled with other donors’ funding and disbursed as part of the core budget of the multilateral organisation.
Table 2 shows the UK provided £5,256 million in core contributions to the multilaterals in 2017, an increase of £413 million (8.5%) on 2016. By comparison, £8,803 million of ODA was delivered through bilateral channels, an increase of £269 million (3.1%) on 2016.
Bilateral and multilateral loans, which are concessional in nature and meet the ODA criteria, together comprised 11.1% of UK ODA in 2017 compared with 6.1% in 2016. These were for financing bilateral projects in India, supporting disaster risk management, and multilateral programmes by the World Bank and the International Monetary Fund (IMF). The increase in 2017 were mainly due to large loans to the World Bank and the IMF.
Table 2: Total 2017 UK ODA by Main Delivery Channel
Figure 2: Total UK ODA by main delivery channel
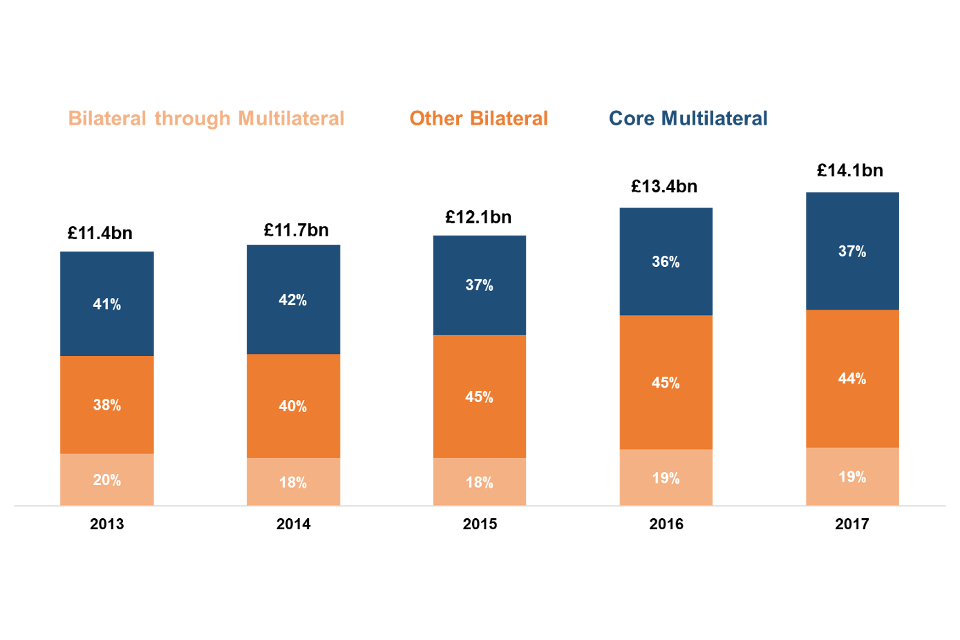
Note that “Bilateral through multilateral” is a component of bilateral aid.
Figure 2 presents the breakdown of total ODA by main delivery channel for 2013-2017. Bilateral ODA, which comprises bilateral ODA through multilateral organisations and ‘other bilateral’ ODA (e.g. ODA delivered through NGOs, Civil Society Organisations, research institutions and universities) has increased steadily in the last 5 years. By comparison, core multilateral ODA tends to vary as the contributions of national governments and the payment schedules of the receiving multilateral organisations are managed on different multi-year cycles.
Makeup of UK ODA by Government Department and other contributors of UK ODA
The overall amount of ODA spent in any given year is determined by the size of GNI. Departments’ and other ODA contributors’ percentage shares of the total change depending on their spending in the year. Table 3 shows the contribution of government departments and other contributors of UK ODA in 2017. It shows:
Main contributors of UK ODA
- DFID spent £10,104 million of ODA in 2017. This was an increase of £232 million (or 2.4%) compared with 2016. DFID’s ODA represented 71.9% of total UK ODA in 2017, compared with 73.8% in 2016
- ODA spent by departments other than DFID and other non-DFID contributors of UK ODA was £3,955 million in 2017, an increase of £450 million (or 12.8%) on 2016 - Non-DFID ODA represented 28.1% of total ODA in 2017, compared with 26.2% in 2016
- in 2017 the largest non-DFID ‘departmental’ or fund shares of ODA were: the Department of Business, Energy & Industrial Strategy (BEIS) (5.4% of ODA) - the Foreign and Commonwealth Office (4.5%), the Conflict, Stability and Security Fund (CSSF) (3.9%) - and the Home Office (2.4%).
- the largest other sources of ODA were the UK’s contribution to the IMF Poverty Reduction and Growth Trust (PRGT), which was £ 726 million (5.2% of UK ODA) and non-DFID EU attribution which was £445 million (3.2% of UK ODA). The IMF-PRGT supports low income countries, such as Afghanistan and Sierra Leone, with macroeconomic assistance, while non-DFID EU contributions include ODA eligible spend in peace, security, democracy, human rights and civil society.
Main ODA changes between 2016 and 2017
- IMF Poverty Reduction and Growth Trust ODA increased by £280 million, from £446 million in 2016 to £726 million to 2017
- the Foreign and Commonwealth Office ODA rose by £123 million, from £504 million in 2016 to £627 million in 2017. This reflected increased spend in governance, civil society, conflict resolution, peace and security sectors, and improvements to the methodology to better reflect ODA eligible frontline diplomatic activity costs
- Gift Aid spend on ODA increased by £74 million, from £90 million in 2016 to £164 million in 2017. This was mainly due to updated data sources for the estimate of Gift Aid for ODA eligible activity following a recent review (Gift Aid Methodology Review 2017 on Statistics on International Development: Final UK Aid Spend 2017)
- BEIS, which supports research and science, and tackles climate change in developing countries, spent £765 million of ODA in 2017. This was an increase of £70 million compared to 2016
- the UK’s contribution to the EU developmental budget (EU attribution) decreased by £92 million from £976 million in 2016 to £884 million in 2017, which reflected a lower share of the budget in 2017 and EU ODA disbursements
Figure 3: Breakdown of UK ODA by Government department and Other UK ODA contributors, 2013, 2016 and 2017
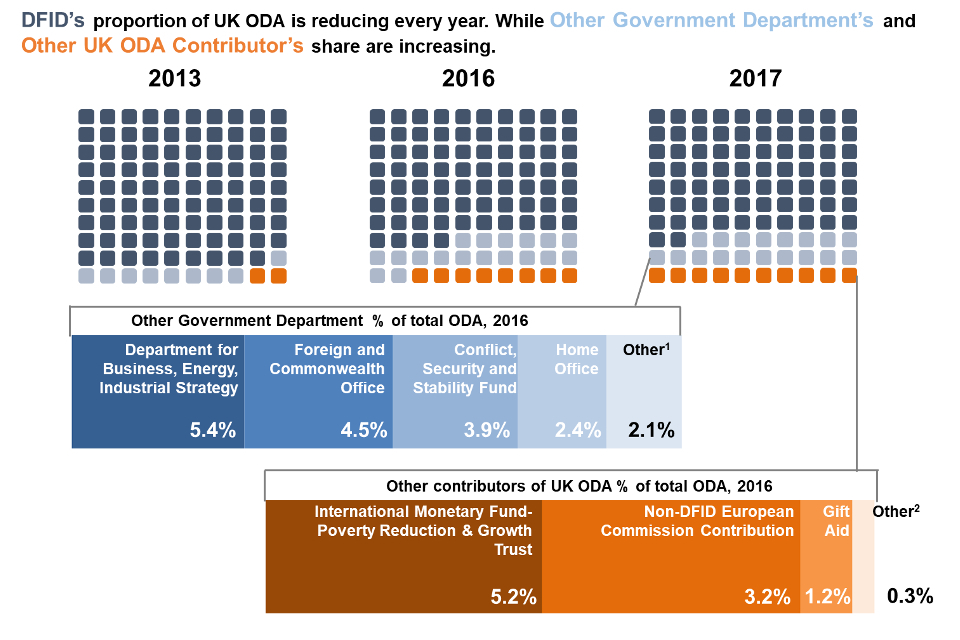
Other “other government departments”:, HM treasury, Department for Environment, Food and Rural Foods, Department for Health, Department for Education, Prosperity Fund, Department for Work and Pensions, HM Revenue and Customs, Ministry of Defence, Exports Credits Guarantee, Department for Culture, media and sports and Office for National Statistics Other “Other contributors of UK ODA”: BBC World Service, Scottish Government, Colonial Pensions administered by DFID and Welsh Government
Cross - Government Funds
Conflict, Stability and Security Fund
The Conflict, Stability and Security Fund (CSSF) is a cross-government fund which has a mix of ODA and non-ODA resources. Any National Security Council (NSC) department and related agency can bid for these funds. The NSC is responsible for the overall delivery of the CSSF while individual spending departments are responsible for managing CSSF spend.
In 2017 two additional departments were allocated CSSF funding: the Department for Environment Food and Rural Affairs and the Department of Health and Social Care. Foreign and Commonwealth Office remained the largest recipient, spending 69.4% of total CSSF ODA. Table 4 below shows CSSF by spending department in 2013 (i.e. 5 years ago), 2016 and 2017.
Table 4: Breakdown of CSSF/Conflict Pool ODA: by Government Department 2013, 2016 and 2017
The Prosperity Fund
The cross-government Prosperity Fund was first introduced in April 2016. It promotes economic reform and development in recipient countries. Departments bid for the funds and the Fund is overseen by a Ministerial Board that sets overall strategic direction, but individual departments are accountable for their own spending and delivery under the fund. In 2017, almost £46 million of ODA was delivered through the fund. Table 5 below shows the Prosperity Fund by spending department in 2016 and 2017.
Table 5: Breakdown of Prosperity Cross- Government Fund ODA by Government Department
Comparisons between UK and other International Donors
The analysis below is based on the provisional 2017 ODA data from all 29 Development Assistance Committee (DAC) Member countries, except the UK for which final 2017 ODA data is used. (To illustrate the impact of using provisional figures, DAC Members’ provisional ODA for 2015 was £86,123 million. This decreased to £86,023 million for final 2015 ODA – a 0.1% decrease).
ODA Flows and ODA:GNI Ratio by DAC Donors
Total ODA from DAC country donors (DAC ODA) in 2017 was £114 billion, representing an increase of 6.2% from the total of £107.3 billion in 2016. The UK’s share of the total was 12.3% in 2017.
Figure 4: Provisional ODA from DAC Donors, 20179
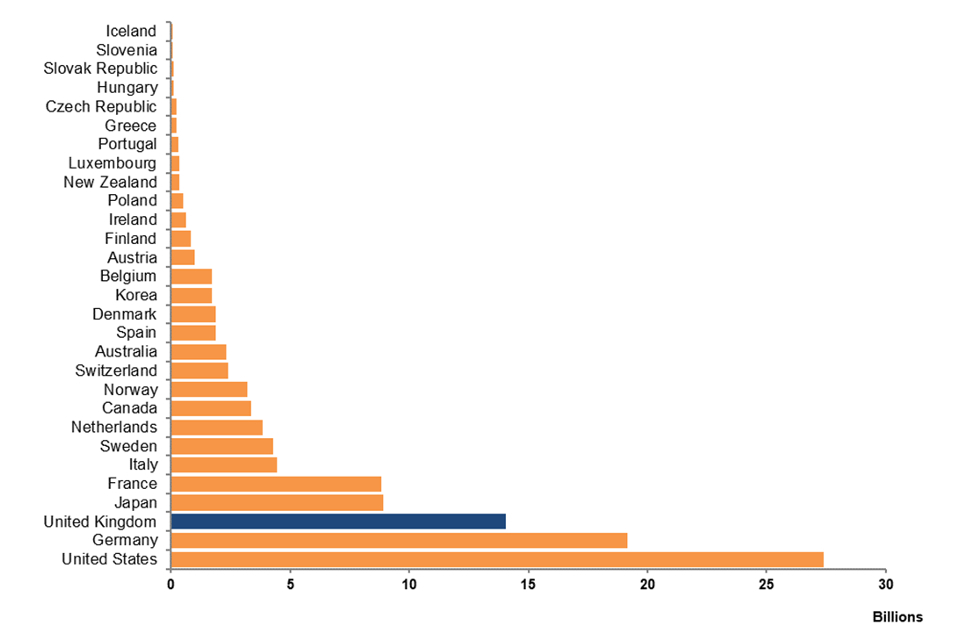
Figure 4 shows in 2017 the UK was the third largest DAC donor country in ODA spending terms. The largest spending donor remained the US (£27.4 billion), but this represented 0.18% as an ODA:GNI ratio (Figure 5 below). By comparison Sweden spent £4.3 billion (around an one sixth of the US spend) but its ODA:GNI ratio was 1.01 % (Figure 5) – showing that Sweden spends a larger share of its national income on ODA. In 2017 Germany was the second largest DAC donor country after the US.
Figure 5 shows 5 DAC members (Sweden, Luxembourg, Norway, Denmark, and the UK) met or exceeded the UN target for an ODA:GNI ratio of at least 0.70% in 2017, compared with 6 DAC members in 2016. In 2017 the UK was the fifth largest contributor on an ODA:GNI ratio basis, with a final ratio of 0.70%, compared with 2016 when the UK was sixth. Germany fell from fifth place in 2016 to sixth in 2017 and this corresponded with it slipping below the UN target. The fall in Germany’s ODI:GNI ratio in 2017 was attributed to lower levels of ODA-eligible in-donor refugee costs compared with 2016.
Other significant movers in 2017 included Spain who fell by 6 places from 14th in 2016 to 20th in 2017 due to its debt relief for Cuba contributing to Spain’s ODA spending much more in 2016 than in 2017. France rose by 2 places from 12th in 2016 to 10th in 2017 because of an increase in its bilateral lending and contributions to multilateral organisations in 2017, especially to the UN bodies.
Figure 5: DAC Donors’ provisional ODA:GNI ratio and rank, 2016 and 2017
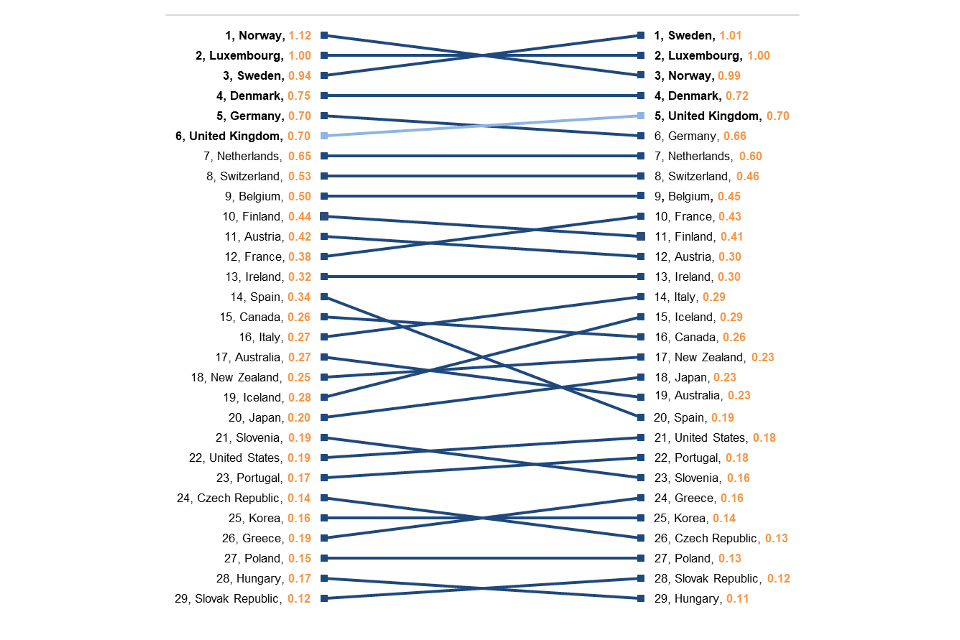
Figure 5 above is based on the provisional 2017 ODA data from all 29 Development Assistance Committee (DAC) Member countries, except the UK for which final 2017 ODA data is used
Total DAC ODA Flows by Recipient Country
(Total DAC and UK ODA data were sourced from the OECD DAC website. See also Table C6 in the accompanying Tables)
The latest available data for total DAC ODA by recipient region and country is for 2016. UK ODA data by recipient region and country used here is also for 2016, keeping the data comparable.
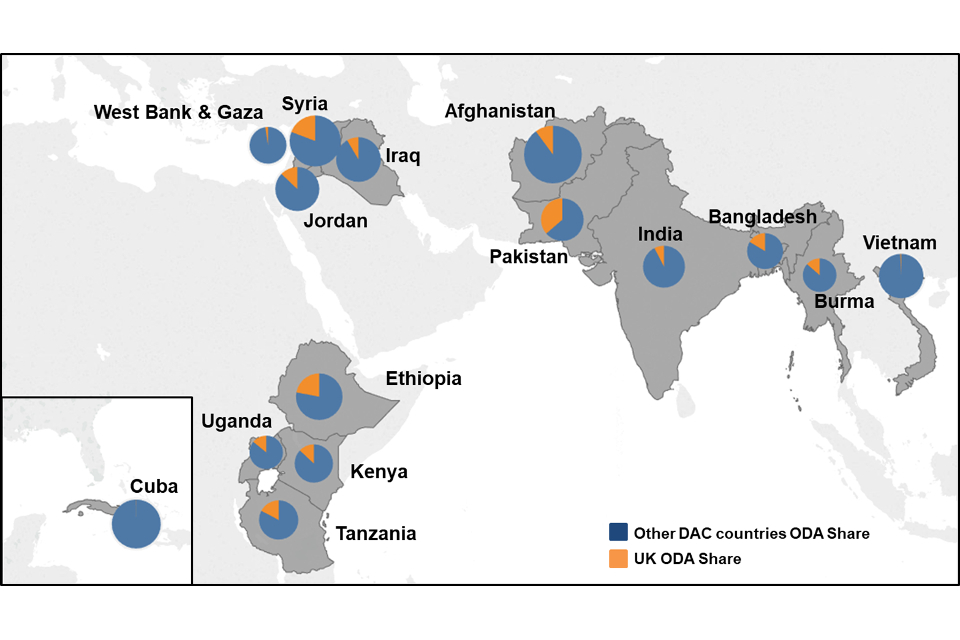
Figure 6 shows the largest 15 receiving countries of DAC ODA in 2016, and the UK’s share in these countries. The UK’s share of total DAC ODA exceeded 15% in 5 of the 15 countries: Syria, Ethiopia, Pakistan, Tanzania, and Bangladesh. Of the five highest recipient countries of DAC ODA in 2016 (Afghanistan, Syria, Cuba, Ethiopia, and Iraq), three (Syria, Ethiopia, and Afghanistan) were among the top five UK ODA recipients. Syria was the second largest recipient of DAC ODA, reflecting the international community’s humanitarian support to the conflict-affected country. Pakistan, the largest recipient of UK ODA overall, was ranked 8th in terms of DAC ODA spending.
Figure 6: Map of the top fifteen highest recipients of total DAC Members ODA Spend and UK’s Share by Country, 2016
Analysis of UK ODA spend
Regional / Country Breakdowns of Bilateral ODA Spend
Bilateral ODA is spend that does not take the form of a core contribution to a multilateral organisation (As defined on the OECD DAC list of ODA-eligible international organisations). This includes spend to a specific country or region as well as spend to multiple countries and/or regions (for some multi-country/region programmes, the current administrative system does not allow recording of spend by individual recipients. Improvements to the system are being considered but for this publication, where this is the case spend is reported as bilateral ODA spend with no single benefitting country or region). It also includes spend in a specific sector for which there are no designated benefitting country/countries or region(s) or where benefitting countries are not known until the end of the programme (The Global Partnership for Education is an example of a sectoral-specific fund where amounts allocated to countries is not known in advance) .
Bilateral ODA spend by region
In 2017, around two thirds (or £5.9bn) of the UK’s bilateral ODA was allocated to a specific country or region. The remaining spend cannot be assigned to a specific country or region, as described in section 3.1.4.
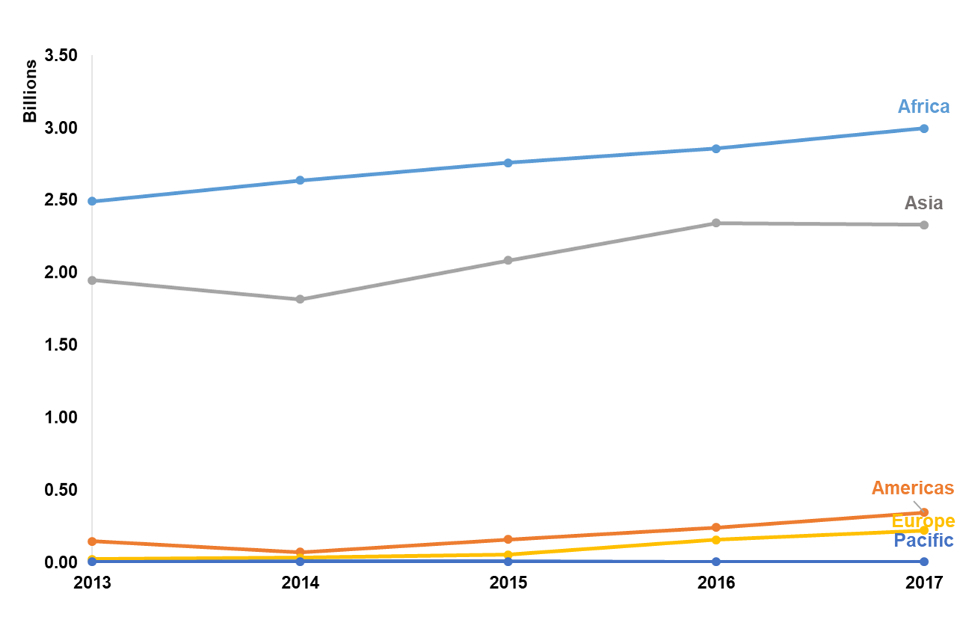
Africa continues to account for the largest percentage share of UK bilateral ODA allocated to a specific country or region, with 50.8% (£3.0bn). This is in line with Africa’s percentage share in 2016 (£2.9bn of £5.6bn in total).
Asia remains the second largest recipient of UK bilateral ODA in 2017 with 39.5% (£2.3bn), followed by the Americas with 5.9% (£0.3bn), Europe with 3.8% (£0.2bn) and the Pacific with 0.1% (less than £10 million).
Figure 7: UK bilateral ODA by receiving region, £ billions: 2013 to 2017
Changes in the Regional Flow of UK Bilateral ODA
Africa: 51% of UK Bilateral ODA
2017: Bilateral ODA to Africa increased by 4.8% from £2,858 million in 2016 to £2,996 million in 2017, a change of £138 million that was largely accounted for by increases in humanitarian spend in Somalia, Uganda and the Democratic Republic of Congo.
Over 5 years: Many of the countries (over 60%) classified as “Least Developed Countries” on the OECD DAC list of recipient countries are in Africa and they account for a significant share of UK bilateral ODA overall. Therefore, Africa has consistently received the largest amount of ODA. Bilateral ODA to Africa has increased steadily over the last 5 years, with spend in 2017 (£2,996m) being 20.1% higher than it was in 2013 (£2,494m).
Asia: 39% of UK Bilateral ODA
2017: In 2017, the volume of bilateral ODA to Asia was £2,330 million. Despite increases in humanitarian spend to countries including Yemen and the West Bank and Gaza Strip, the overall bilateral spend to Asia decreased slightly from 2016, by 0.6% (£14m). This was due to lower levels of ODA to Jordan and Pakistan, countries which had seen significant increases in spend in 2015 and 2016.
Over 5 years: Since 2013, spend to Asia has increased by 19.6% from £1,949 million to £2,330 million in 2017. Between 2013 and 2014 bilateral ODA to Asia reduced by £131 million to £1,818 million, due to lower levels of ODA to Pakistan, the Middle East region and Bangladesh – the same areas that had seen large increases in 2013. Between 2014 and 2016 spending in Afghanistan and Syria, in particular, resulted in ODA spend to Asia increasing by 29%.
The Americas: 6% of UK Bilateral ODA
2017: In 2017 the Americas received £346 million of UK bilateral ODA, an increase of £104 million on 2016. Most of this spend was for infrastructure development in both the Caribbean and South America.
Over 5 years: Volumes of bilateral ODA to the Americas is on a lower scale than those to Africa and Asia. Bilateral ODA to the Americas has increased from £148 million in 2013 to £346 million in 2017. In 2014 it fell due to the closing of a transport sector programme in Guatemala, however ODA levels recovered in 2015 and have increased since then.
Europe: 4% of UK Bilateral ODA
2017: Europe received £223 million of UK bilateral ODA in 2017, a 42.5% (£66m) increase on the previous year. The most significant increase was seen in Turkey (£42m increase since 2016) to support displaced refugees in the Syria Crisis with vital supplies, health and education.
Over 5 years: Like the Americas, ODA spend in Europe (European countries that received ODA in 2016 were: Albania, Belarus, Bosnia-Herzegovina, Former Yugoslav Republic of Macedonia, Kosovo, Moldova, Montenegro, Serbia, Turkey and Ukraine) is small compared to Asia and Africa. Bilateral ODA to Europe has grown steadily from £24 million in 2013 to £223 million in 2017.
Pacific
A very small proportion of bilateral ODA goes to the Pacific, between 0.1 and 0.2% (or less than £10m).
Bilateral ODA spend by Country
In 2017, the UK provided bilateral assistance to 138 countries.
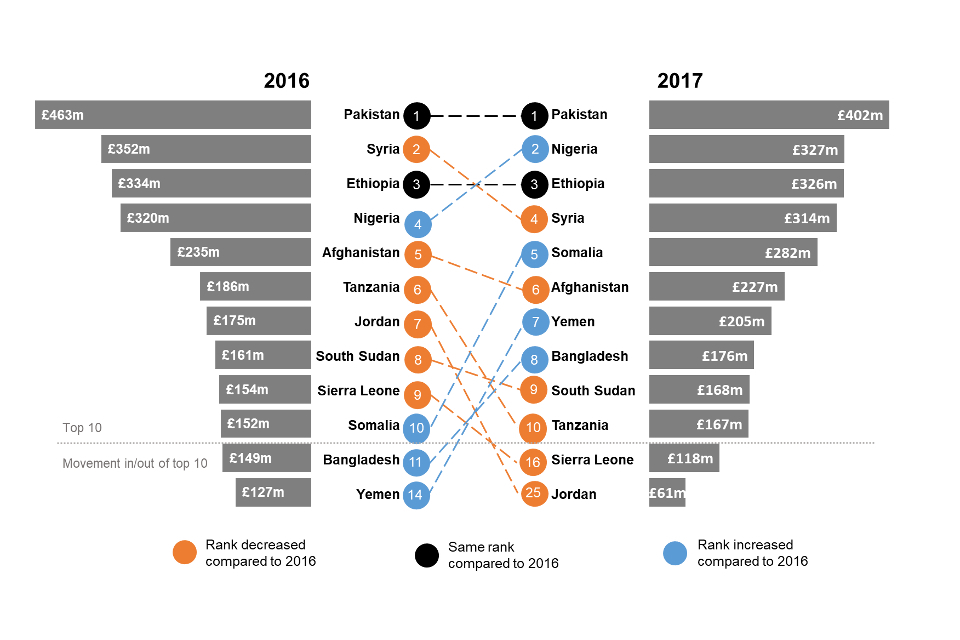
- in 2017 the top 3 recipients of UK bilateral ODA were Pakistan (£402m), Nigeria (£327m) and Ethiopia (£326m) spend to these countries accounted for 21.7% of total country-specific UK bilateral ODA.
- the volume of ODA to Pakistan decreased from £463 million in 2016 to £402 million in 2017, however it remained the top recipient of bilateral ODA for the third year running
- Somalia and Yemen saw the biggest increases in bilateral ODA; they rose in ranking from 10th and 14th place to 5th and 7th respectively spend in Somalia increased from £152 million in 2016 to £282 million in 2017, consisting largely of humanitarian spend for conflict and disaster affected populations - similarly, humanitarian assistance to Yemen saw ODA spend increase from £127 million in 2016 to £205 million in 2017
- Jordan saw the largest reduction in ODA funding, with spend decreasing from £175 million in 2016 to £61 million in 2017. This follows a spike in spend in 2016, driven by spend to support displaced refugees in Jordan from the Syrian Crisis
- the total UK bilateral ODA spend to the top 5 recipient countries decreased from £1,704 million in 2016 to £1,652 million in 2017 - as a percentage share of total country-specific UK bilateral ODA the top 5 accounted for 34.0% of the total in 2017, a slight reduction from 2016 when they comprised 35.2% of the total
Figure 8: Top 10 Recipients of UK Bilateral ODA
For detailed breakdowns of spend to the top 20 recipients, please see Table 6 in the tables Statistics on International Development 2017 document.
Income groups
ODA eligible countries are classified into 4 groups – Least Developed, Other Low Income, Lower Middle Income and Upper Middle Income Countries. These are based on gross national income per capita published by the World Bank. The list of countries is reviewed every 3 years by the OECD-DAC. The most recent update was in autumn 2017 effective from 1st January 2018, therefore the 2017 data presented in this report relates to the previous list of ODA eligible countries.
- total UK bilateral ODA to Least Developed and Other Low Income Countries increased by 9.0% (£234m) to £2,826 million in 2017 - this reflects a shift in spending away from Upper Middle Income Countries (UMICs) (including Jordan, Brazil and Iraq) and to a lesser extent Lower Middle Income Countries (LMICs) (including Pakistan and Syria), all of which experienced relatively large increases in bilateral ODA in 2016 (Figure 9)
- least Developed and Other Low Income Countries therefore continue to account for the largest proportion of bilateral ODA spend in 2017 – at 57.9% of UK country-specific spend.
- spending to LMICs represented 27.9% of UK country specific bilateral ODA in 2017, compared to 29.0% in 2016
- spending to UMICs represented 14.2% in 2017 compared to 17.4% in 2016
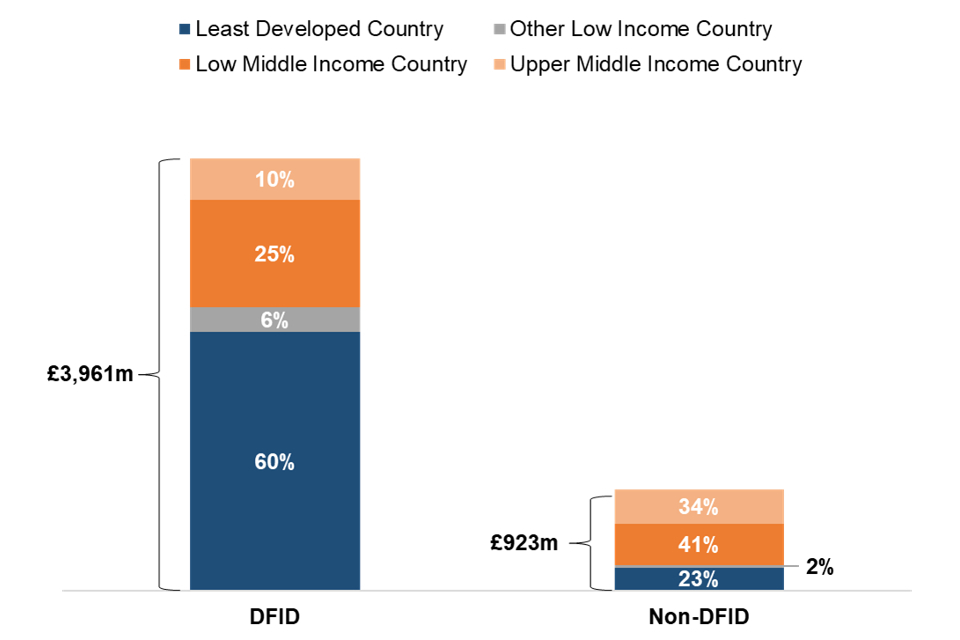
- DFID is the main spender of UK bilateral country-specific ODA (£3,961m or 81.1%). The majority (65.5%) of DFID’s spend went to Least Developed or Other Low Income Countries in 2017 - non-DFID contributors spent £922m in 2017, 40.8% of which went to LMICs, 34.0% to UMICs and 25.2% to Least Developed or Other Low Income Countries. This is illustrated in Figure 10
Figure 9: Breakdown of Country-Specific UK Bilateral ODA by Country Income Group - 2013, 2016 and 2017
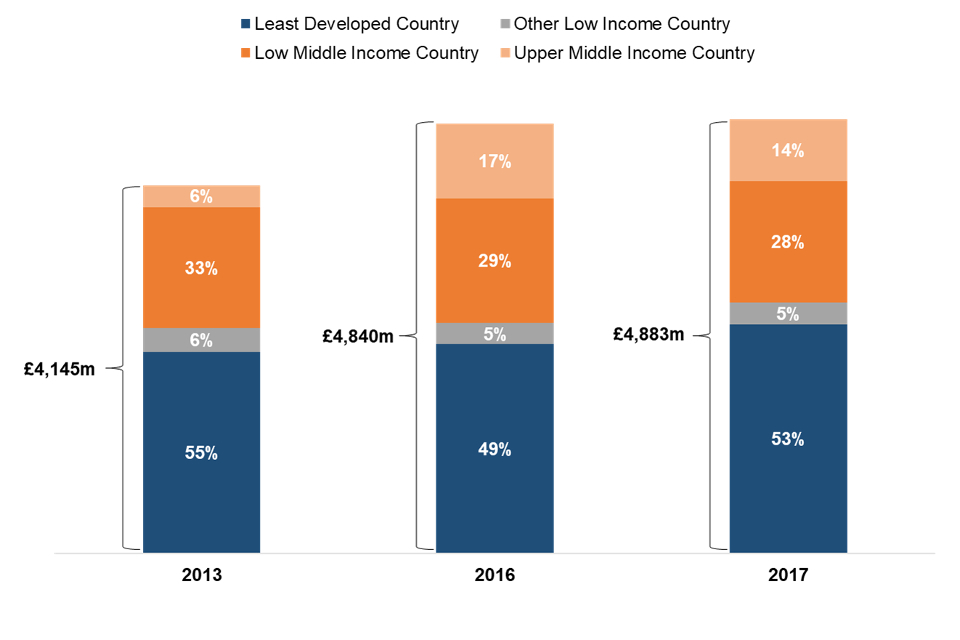
Figure 10: DFID and Non-DFID Breakdown of Country-Specific UK Bilateral ODA 2017
Bilateral ODA Spend by Region and Government Department and Other Contributors of UK ODA
(Please see Table C5 in Tables: Statistics on International Development 2017 for underlying data.)
In 2017, 94.1% of DFID’s bilateral ODA went to countries in Africa and Asia - £4,166 million. Africa has consistently been the largest recipient of DFID region-specific ODA since 2010, with a share of 58.6% in 2017(see Figure 11).
By contrast, the largest recipient of non-DFID region-specific ODA is generally Asia. In 2017, non-DFID ODA contributors spent £759 million in Asia, accounting for 51.4% of their total spend. Non-DFID contributors also spend a larger proportion of their ODA in Europe and the Americas (21.1%) compared to DFID (5.8%).
Figure 11 also shows the regional breakdown of DFID and Non-DFID bilateral ODA five years ago in 2013. In 2017 regional spend has remained broadly similar to the profile seen in 2013, although the level of ODA has increased over the years in line with the UK Aid Strategy.
Figure 11: Breakdown of DFID and non-DFID, Country/region Specific Bilateral ODA by Region, 2017
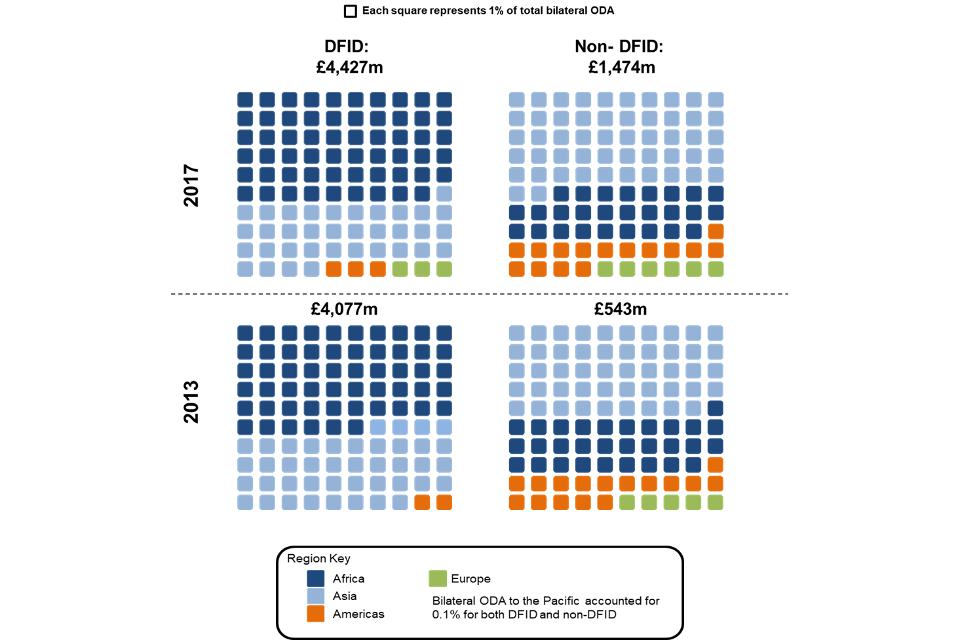
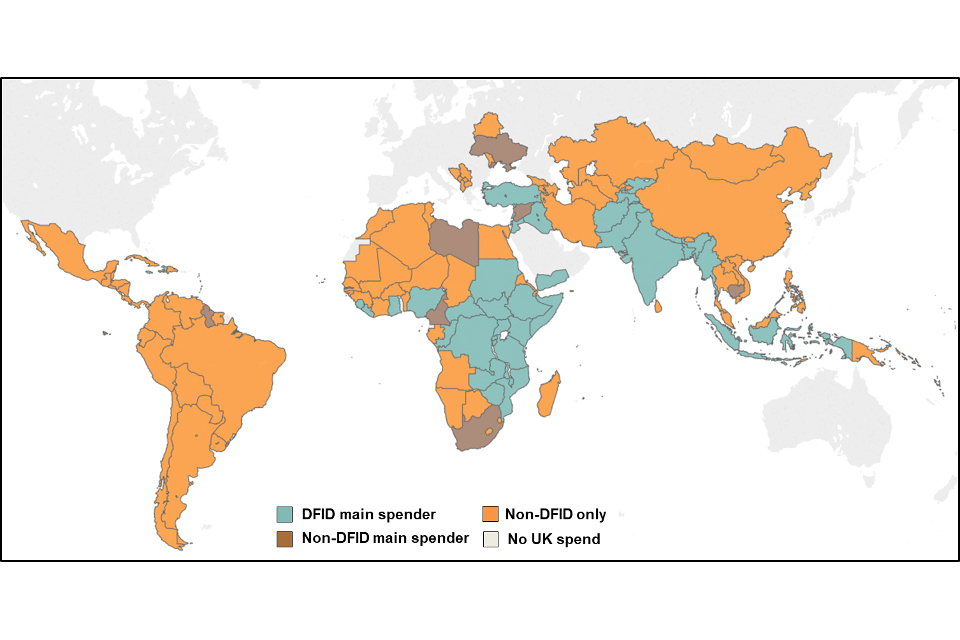
Figure 12 below shows:
- DFID provides most of its ODA to priority countries in Sub-Saharan Africa and Asia
- other UK Government Departments and other contributors of ODA provide their ODA in smaller amounts to a much larger spread of countries across the world
- DFID’s contribution to Asian countries is concentrated in the Middle East region (Syria, Lebanon etc.) and south and central Asia. Non-DFID sources contribute to Asian countries across the whole region
- a similar trend is seen in Africa – DFID spend is concentrated mainly on central, southern and eastern Africa while non-DFID spend is spread across the whole region
Figure 12: UK bilateral ODA footprint by DFID and Non-DFID country spending, 2017
Bilateral ODA Spend with No Single Benefitting Country or Region
In 2017 approximately a third of bilateral ODA was made up of spend that was not assigned to a single benefitting country or region. This comprises, for example, centrally-funded research and other global public goods or programmes that develop policies that benefit several developing countries that cannot be meaningfully recorded to a single benefitting country or region. It also consists of ODA with no country flow as such, for example costs to support asylum seekers in the UK.
- forty per cent of spend within this ‘Unspecified’ category consists of project-type interventions and includes expenditure on multi-country or multi-region projects as outlined these are programmes where it is not possible to directly assign exact spend to the benefitting countries or regions in the current administrative system (We are investigating whether geocoded data in DFID’s system will allow multiple benefitting countries and regions to be recorded in these statistics)
- twenty-one per cent of the unspecified ODA was allocated to supporting international development work and refugees in the UK or another developed country, while 15% was for specific programmes or funds managed by international organisations in a specific sector with no designated benefitting countries.
- a further 12% consists of core support to Non-governmental Organisations (NGOs) or other delivery partners, such as research institutions, where often the research outcomes will affect a wide range of developing countries
Figure 13: Breakdown of UK Bilateral ODA, 2017
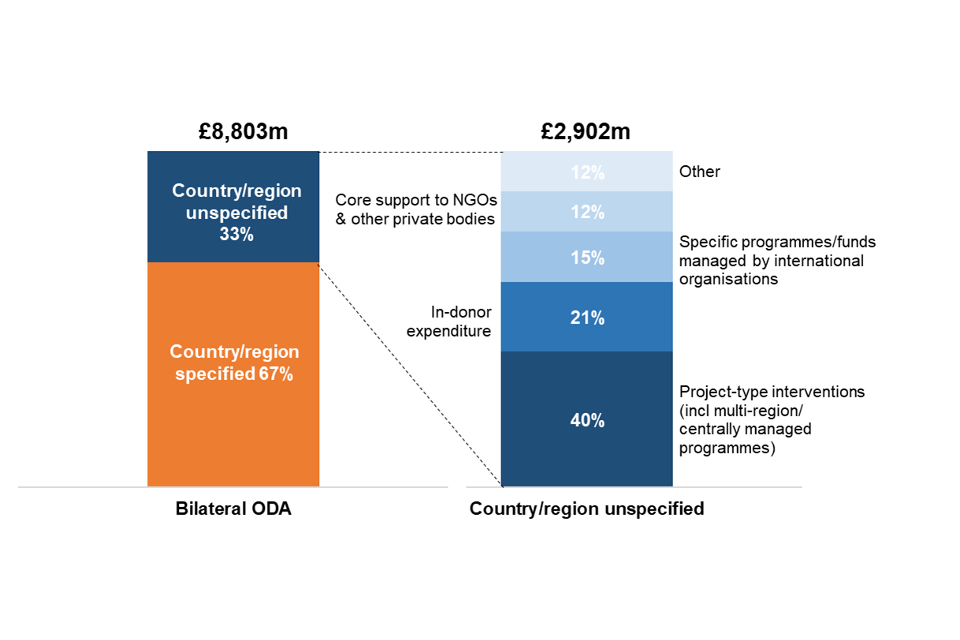
Totals may sum to more than 100% due to rounding
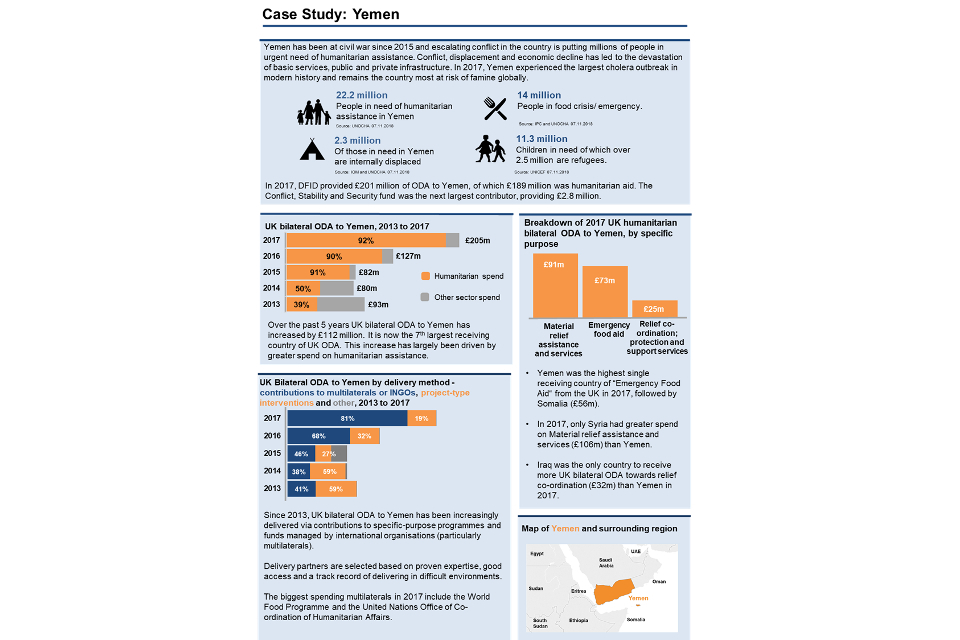
infographic View full size version of infographic: Case Study :Yemen
Broad Sector Breakdown of Bilateral ODA Spend
Bilateral ODA spend by sector in 2017
UK ODA can be classified into broad sectors depending on the social, economic or humanitarian assistance area it supports. For more information on what is included in the broad sectors please see Annex 1 of this publication. A single project can allocate spend to 1 or more broad sectors. The OECD DAC methodology has changed in 2017 to allow reporting of spend against multiple broad sectors, and this approach is used throughout this section. Prior to this, the methodology required that all spend for a given project be reported against the sector in which the largest percentage of spend occurred. With this methodology change, 2017 data are not directly comparable with those in the previous years, and so the focus will be on the sector breakdown of bilateral ODA spend in 2017 rather than trends over time.
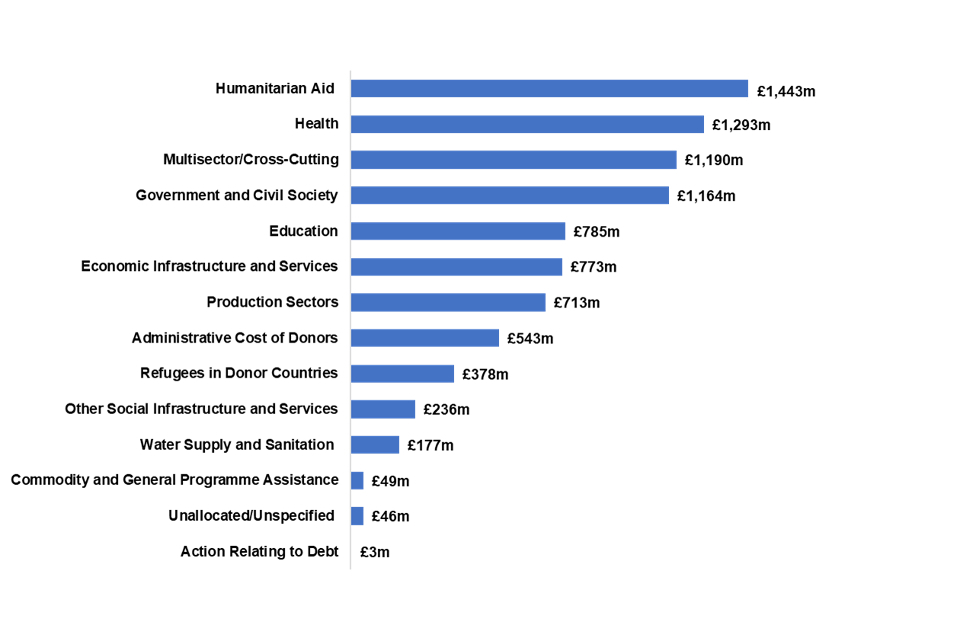
Figure 14 provides an overview of bilateral ODA spent by broad sector in 2017 and a more detailed breakdown of the sectors is given in Additional Table A7. The 5 largest sectors by bilateral spend in 2017 were:
- Humanitarian Aid – £1,454 million (16.5%) the 3 main recipients of humanitarian spend were Somalia (£200m), Yemen (£189m) and Syria (£140m) – countries which are affected by conflict and instability
- health - £1,293 million (14.7%) - within health, the top 3 spending areas were medical research (£247m), reproductive health care (£181m) and basic healthcare (£162m)
- Multisector/Cross-Cutting – £1,190 million (13.5%) in this sector £884 million was spent on areas such as research, urban and rural development and planning, and multisector aid, and £306 million on general environment protection, including environmental policy and administrative management
- Government and Civil Society (for example, engaging citizens in Nigeria to enhance scrutiny of public expenditures) - £1,164 million (13.2%) includes public policy, human rights, conflict prevention and resolution, and peace and security the main countries benefitting from this spend included Afghanistan, Nigeria, Syria, Somalia and Pakistan
- Education - £785 million (8.9%) the top 3 areas for education spend are primary education (£327m), education policy and administrative management (£133m) and higher education (£94m)
The percentage share of total bilateral ODA of the 5 largest sectors in 2017 was 66.9%.
Figure 14: Broad Sector breakdown of UK Bilateral ODA, 2017 (£ millions)
Broad Sector Breakdown of Bilateral ODA Spend by Government Department and other contributors of UK ODA
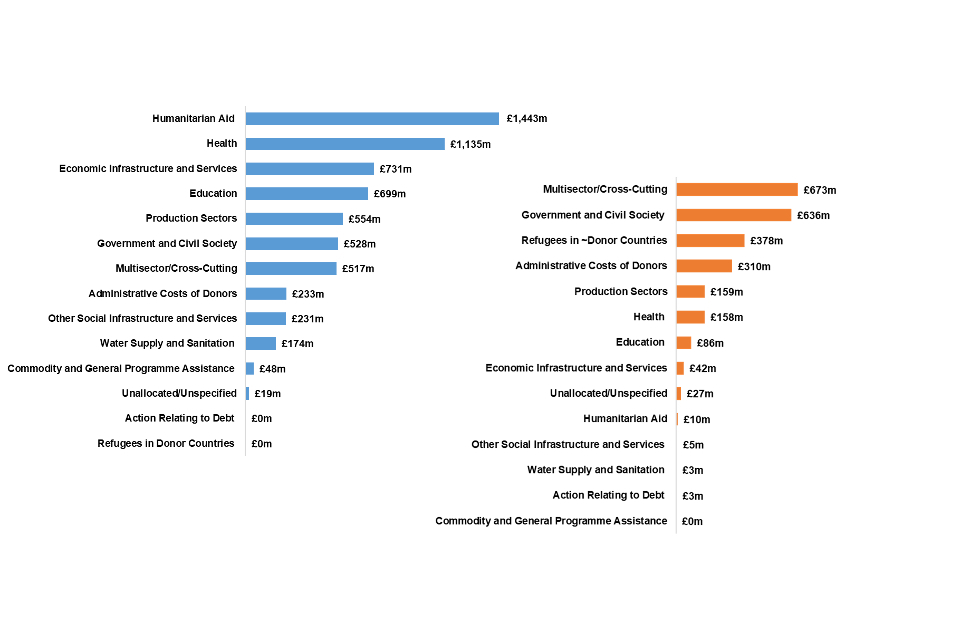
Figure 15 below provides a breakdown of sector spend by DFID and all Other Government Departments and other contributors of ODA (non-DFID).
- for DFID, the largest sector spend was ‘Humanitarian Aid’ followed by ‘Health’, ‘Economic Infrastructure and Services’ (i.e. Transport and Storage, Communications, Energy and Energy policy, Banking and Financial services and Business services) and ‘Production Sectors’ (i.e. Agriculture, Forestry, Fishing, Industry, Mining, Construction, Trade Policy & Regulation, Tourism)
- non-DFID spend is on a smaller scale the largest sectors of non-DFID spend were ‘Multisector/Cross-Cutting’ (i.e. Environmental Protection, Research, Rural and Urban development), ‘Government and Civil Society’, ‘Refugees in Donor Countries’ (only the first 12 months of stay are ODA eligible) and ‘Administrative Costs of Donors’, which includes ODA eligible frontline diplomatic activity costs
Figure 15: DFID’s and Other Government Departments’ and Other Contributors of ODA (non-DFID) Spend by Sector (2017, £ millions)
Broad Sector Breakdown of Bilateral ODA Spend by top 10 recipients of UK bilateral ODA
Figure 16 below provides a breakdown of the top 10 recipient countries of UK bilateral ODA in 2017, and their highest sector spend in each year since 2013. The breakdown in 2017 is not directly comparable to that for the previous years due to the methodology change described above. However, Figure 16 illustrates the trend between 2013 and 2017.
Figure 16: Top 10 recipients of UK bilateral ODA, by largest sector spend
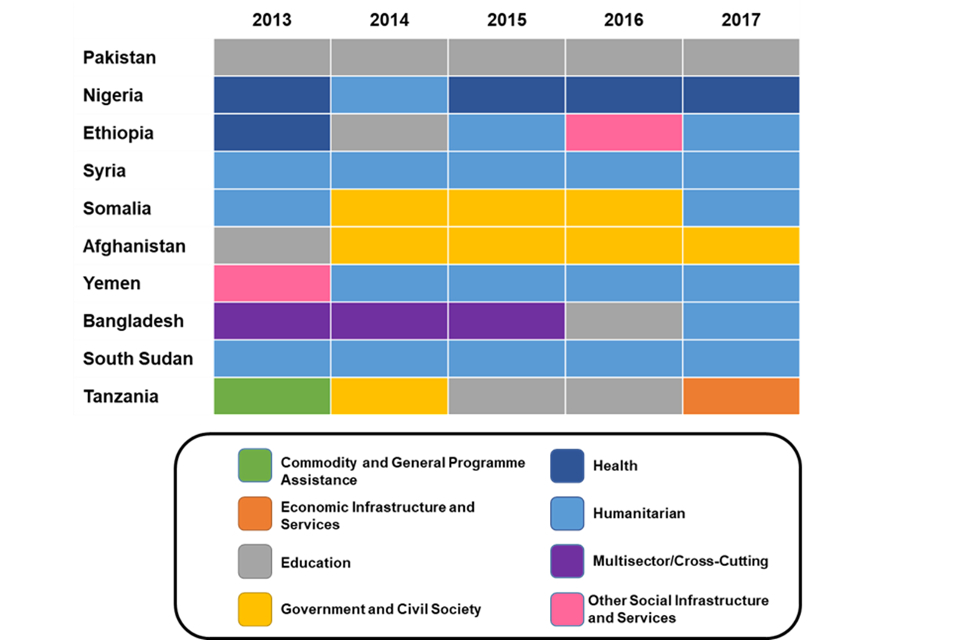
- some countries in the top 10 consistently receive most UK ODA for the same sector year on year (e.g. Pakistan, Syria, South Sudan), while for others the sectors tend to change (e.g. Ethiopia, Tanzania, Bangladesh)
- in Ethiopia, ‘Education’, ‘Health’ and ‘Humanitarian Aid’ all receive a significant proportion of ODA each year, and the sector which is the highest spending depends on the commencement and/or conclusion of large projects. For example, ‘Other Social Infrastructure and Services’ was the highest spending sector in 2016 due to a single large spending project. A similar situation arises in Tanzania where high levels of spend can occur across a range of different sectors each year
- in Pakistan, ODA spend on ‘Education’ has been consistently high over the past 5 years (approximately £120m per year), however while this sector remains a priority area, spend in other areas such as ‘Economic Infrastructure and Services’ has also increased substantially from £2m in 2013 to £92m in 2017
- ‘Humanitarian Aid’ was the sector which received the highest UK ODA in 6 countries out of the top 10 for 2017
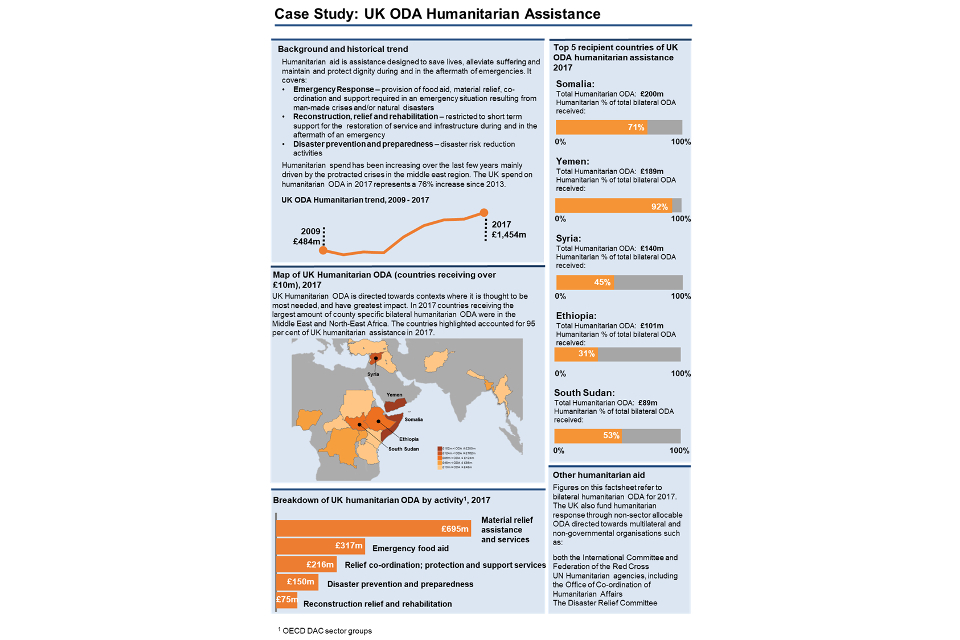
infographic 3 View full size version of infographic: Case Study :UK ODA Humanitarian Assistance
Multilateral Funding
UK Multilateral Funding by Organisation
The UK works with a wide range of organisations with very different roles in development – for example, to respond to humanitarian need, to develop infrastructure to support economic growth, or to ensure that particular diseases are tackled in line with the best available evidence. Multilateral organisations are an essential part of the international system for humanitarian and development ODA. They can work in a wider range of countries than individual donor governments, offer economies of scale in their operations and expertise, and often have the legitimacy to work in politically sensitive situations. In doing so, they enable donor governments, such as the UK, to support humanitarian and development work in a far wider range of countries.
Table 6 shows the top 20 multilateral organisations that received the most core funding (Multilateral ODA) in 2016 and 2017.
- the top 5 multilaterals’ shares represented almost 71% of total multilateral ODA in 2017, compared with 68% in 2016. The International Development Association (IDA) (part of the World Bank Group) remained the largest recipient of UK multilateral ODA, accounting for around a quarter of the total in 2017
- four of the 5 top receiving organisations of UK multilateral ODA in 2017 were among the top 5 multilaterals in 2016, with the Global Fund replacing the African Development Fund for fifth position in 2017
- among the top 5 multilateral recipients in 2017, UK contributions to IDA and the International Monetary Fund – Poverty Reduction and Growth Trust Fund were larger in 2017 than they were in 2016, while the contribution to the EC- development budget was smaller in 2017 compared with 2016 due to a small fall in the UK’s share of the budget and a lower level of EU disbursements
Table 6: Top Twenty Recipients of UK core funding to Multilateral Organisations (Multilateral ODA)
UK Multilateral Funding by Extending Agency
Table 7 shows UK ODA by delivery channel and agency extending the funding.
- most of the UK’s multilateral ODA is provided through DFID’s funding of multilateral organisations - DFID accounted for 72.1% (£3,791 million) of total UK multilateral ODA; a slight fall from 2016, when DFID accounted for 72.3% (£3,502 million) of the UK total
- the Department for Business, Energy and Industrial Strategy was the largest non-DFID department to provide UK multilateral ODA in 2017, accounting for 2.4% (£128 million) of the UK total, primarily made up of core contributions to the Climate Investment Funds and Green Climate Fund
- in 2017, the contribution of government departments other than DFID to the European Commission development budget (non-DFID EU Attribution) was 8.5% (£445 million) of the UK multilateral total
- over the last 5 years, UK multilateral ODA from non-DFID contributors has grown by over threefold, from £449 million in 2013 to £1,465 million in 2017, reflecting an increase in core contributions from Other Government Departments, as well as a methodology improvement for apportioning the Other Government Departments’ share of the EU development budget
Details on the funding of multilaterals in 2016 and 2017 are available online in Additional Table A8.
Table 7: Breakdown of UK ODA: by Government Department and Other Contributors and delivery channel
Multilateral Core Funding and Imputed Multilateral Shares
When DFID or other UK government departments provide core funding to multilateral organisations, the funding is pooled with other donors’ funding and disbursed as part of the core budget of the multilaterals. It is therefore not possible to directly track the use of UK funding for core multilateral purposes. However, to provide an indication of the destination and sector of UK multilateral ODA, overall percentages of ODA disbursements by the relevant multilateral organisations are used to impute a UK estimate.
This publication uses the reported OECD DAC breakdown of ODA disbursements for each multilateral organisation to estimate what percentage of DFID and UK core contributions are spent in each country and sector. Where a multilateral organisation does not report its disbursements to the DAC but the multilateral is only mandated to work in a particular country, region or sector, we allocate all of its core contributions to the relevant country, region or sector. If a multilateral organisation does not report to the DAC but works in multiple sectors and/or countries then its core contributions are not allocated to a country or sector.
The DAC publish detailed information of the multilaterals’ country and sector spending in December, and because of this timing the latest estimates are available for 2016 as shown in this publication. Additional Tables A9 and A10 show imputed multilateral shares of UK Multilateral ODA by sector and country respectively. These shares should be taken as indicative estimates rather than exact amounts of funding, and they are dependent upon multilateral organisations returning disbursement data to the DAC.
In 2016, most multilateral organisations, representing around 85% of the UK’s total core multilateral funding, made returns by sector and country to the OECD DAC. The latest estimates include a list of multilaterals that reported sector and country information in Table A9 and A10. The estimates will be incomplete for the non-reporting multilateral organisations, whose data will be allocated to the unspecified country or sector category.
Background notes
ODA Spending monitoring and reporting
The UK commitment to spend 0.7% of GNI on ODA is based on final ODA spending data and a Gross National Income (GNI) estimate for the previous calendar year, published by the ONS at the end of September.
UK ODA spend includes DFID spend, non-DFID departmental spend and other sources of ODA (such as EU attribution and Gift Aid). DFID and HMT monitor spend by other departments and funds during the current year and estimate the likely contribution from non-departmental sources of ODA. DFID and HMT also monitor movements in GNI during the year using estimates of GNI produced by the ONS and GNI forecasts published by the independent Office for Budget Responsibility (OBR). While DFID manages its own spending on ODA, DFID has no control over GNI nor the spending by other government departments and other sources of ODA. After final decisions on UK ODA spending are made the GNI estimate can still shift due to later economic data for the year becoming available, so can the amount of ODA spent by other government departments and ODA contributions from non-departmental sources.
DFID is responsible for collating data and reporting spend on ODA to the Organisation of Economic Development and Co-operation (OECD), including the ODA/GNI percentage.
The ONS produced a first preliminary estimate of GNI for 2017 in March 2018. In the spring DFID compiled preliminary ODA data for 2017 from its financial management system (ARIES) and from aggregate spending returns of the other government departments and other contributors to UK ODA. The first estimate of GNI and preliminary ODA data were used to calculate the provisional estimate of the ODA:GNI ratio, published in April.
Between the spring and the autumn the ODA spending of DFID and other government departments are finalised. Other government departments will provide project-level details that allow the ODA spend data to be quality assured against OECD DAC rules. The ONS will release a further update of GNI for 2017, which is published in the September. The final ODA data and the updated September GNI estimate for 2017 are used to calculate the final ODA:GNI ratio in this publication, and to report to the OECD.
ODA:GNI Ratio
The Office for National Statistics (ONS) publish revisions to Gross National Income (GNI) estimates as more economic data becomes available. The provisional ODA:GNI ratio is always based on the GNI estimate published in March and the final ratio is based on the GNI estimate published by the ONS in September. To enable comparability against international ODA data we do not revise the back series to take account of any further revisions made to the GNI estimates.
In-donor refugee costs
The reporting directives for ODA are governed by the OECD’s Development Assistance Committee (DAC) and include temporary sustenance to refugees in donor countries for the first 12 months of stay. There are two main types of support in this area of UK ODA: support to asylum seekers and resettlement programmes, for which Home Office is the lead government department. Costs are also reported by the Department for Education (DfE), Department for Health and Social Care (DHSC), Department for Work and Pensions (DWP) and HM Revenue and Customs (HMRC).
In 2017, the DAC agreed clarifications to the reporting directives to improve consistency, comparability and transparency of how in-donor refugee costs are reported. Following this, DFID initiated a statistical review of the UK’s ODA reporting in this area. Full terms of reference for the review can be found online.
The review has assessed the full range of in-donor refugee support for alignment with newly agreed ODA guidelines and ensured sound methodologies for calculations are used throughout. The review has also considered the appropriateness of the data sources in each contributor’s estimates. The review’s findings have been considered by DFID’s Chief Statistician and will be implemented for future reporting of UK ODA spend statistics in ‘Statistics on International Development’.
The main findings of this review are:
- confirmation of the main areas and methodologies of UK reporting of ODA-eligible in-donor refugee costs as remaining viable under DAC’s clarified directives
- removal of administrative costs for processing of asylum applications from ODA reporting
- removal of costs for assistance to asylum seekers from non-ODA countries from ODA reporting
- improved methodologies for estimating and applying education and health unit costs
- inclusion of early years education support in ODA reporting
- removal of education support to UASC over 16 from ODA reporting
CDC Capital Partners PLC – reporting from 2015
A previous internal quality review recommended that DFID statisticians consider whether the UK’s approach to how CDC reports ODA is in line with the international rules and best practice in this area. Following a public consultation in 2014/15, DFID changed its reporting of CDC ODA such that now the capital flow from the UK government to CDC is scored as ODA, rather than CDC’s net disbursements. In 2017, the UK provided a capital increase of £336 million to CDC, which counts as ODA.
EU Attribution
The final estimate for the UK share of EU Development Budget on ODA (EU Attribution) in 2017 is £911 million compared to £1,031 million in 2016. EU attribution fluctuates from year to year because the EU works on a seven year programming cycle and the EU development disbursements in a given year can vary. Exchange rate fluctuations as well as changes in the UK’s share of the budget affect the UK’s contribution to the EU’s ODA-eligible development spend. The estimate in 2017 is based on published data from the European Commission.
In Table 3, £27.5 million for the UK’s assessed contribution to ODA eligible EU civilian peacekeeping missions is reported in these statistics by the Conflict, Stability and Security Fund, as the fund responsible for spending. This avoids double counting in Table 3 and does not affect the overall EU attribution figure.
Listing of UK Government Departments and other UK contributors of UK ODA other than DFID’s main ODA activities in 2017
To supplement the ODA statistics from other Government Departments and UK contributors shown in the publication, we have included information in the table below on the main ODA activities departments other than DFID have supported in 2017. The table aims to respond to users’ requests for more details on non-DFID ODA.
| Government Department or Other contributor of UK ODA | Main ODA funded activity in 2016 |
|---|---|
| BBC World Service | BBC World Service contributes to the BBC’s international news mission to address the global gap in provision of trusted news, by broadcasting and distributing accurate, impartial and independent news and analysis of the highest quality. In developing countries the BBC World Service aims, through journalism that contributes to accountability and good governance, to improve the welfare and economic development of citizens. |
| Conflict, Stability and Security Fund (CSSF) | CSSF’s main activities in 2016 were: Tackling conflict and building stability overseas, Improve capacity and accountability of security and justice actors, Strengthening the rules-based international order and its institutions including women, peace and security, Crisis Response and Resilience, Tackling Serious and Organised Crime, Preventing violent extremism |
| Department for Business, Energy and Industrial Strategy (BEIS) | BEIS ODA is spent through the International Climate Fund (ICF), jointly managed by DFID, BEIS and DEFRA. The ICF seeks change in developing countries to tackle emissions by supporting low carbon development and shifting markets in favour of clean and green. BEIS also funds the Newton fund and Global Challenges Research Fund (GCRF). The Newton fund uses the UK’s strength in research and innovation to support economic development, social welfare, and to develop capacity in 15 developing countries. The GCRF aims to ensure that UK research takes a leading role in addressing the problems faced by developing countries. |
| Department for Culture, Media and Sport (DCMS) | From 2016/17 onwards the £30m Cultural Protection Fund supports countries mainly in Middle Eastern conflict zones to protect and restore their cultural heritage. |
| Department for Education (DfE) | All of DfE’s ODA is for the support of asylum seekers in the first 12 months after they make a claim for asylum in the UK. This support relates to the provision of publicly-funded education services to child and unaccompanied child asylum seekers of compulsory school age. |
| Department for Environment, Food and Rural Areas (DEFRA) | International Climate Fund (ICF): investing in forestry projects that secure biodiversity benefits, promote more sustainable land use and agriculture practices, and contribute to global food security. The Darwin Initiative: a global competitive grant scheme that funds projects in developing countries and our UK Overseas Territories to help them better manage their natural resources. Illegal Wildlife Trade (IWT) Challenge Fund: funds projects in developing countries to develop sustainable livelihoods for communities affected by illegal wildlife trade; strengthen law enforcement and the criminal justice system; and reduce demand for the products of the illegal wildlife trade. |
| Department of Health (DH) | The Department of Health pays an annual subscription to the World Health Organisation (WHO) - a proportion of which is ODA eligible. It also takes the overall lead for the Government’s engagement with the organisation. DH ODA includes: support of asylum seekers in the first 12 months after they make a claim for asylum in the UK. This support relates to the provision of publicly-funded health services; the Fleming Fund – which focuses on improving data and surveillance of Antimicrobial Resistance (AMR) in low and middle income countries (LMICs) where drug resistant infections have a disproportionate effect, and the Vaccine Network. |
| Department for Work and Pensions (DWP) | DWP pays an annual core contribution to the International Labour Organisation (ILO). Approximately 60% of this funding is assessed as ODA eligible. DWP has a model for estimating the administration and benefit costs of the Vulnerable Persons Relocation (VPR) scheme. |
| Foreign and Commonwealth Office (FCO) | The FCO provided £504m of ODA in 2016 through core departmental policy programmes, international subscriptions and aid-related frontline diplomacy. FCO policy programmes supported a wide range of UK foreign policy and UK Aid priorities in the majority of DAC listed countries. As well as scholarships, FCO programmes include small-scale interventions in support of diplomatic activity and longer-term capacity building. This work contributes to strengthening global peace, security, governance or prosperity in support of the UK Aid Strategy. The most significant allocations are: Chevening Scholarships Programme and the Magna Carta Fund for Human Rights and Democracy. |
| HM Revenue and Customs (HMRC) | HMRC supports developing countries revenue authorities to improve their tax administration functions and tax policies to increase revenue collection, providing economic integration, stability and growth. |
| HM Treasury (HMT) | HMT ODA relates to administrative costs to undertake development related activities. HMT also oversee the UK’s contribution to the Asian Infrastructure Investment Bank. |
| Home Office (HO) | The Home Office’s ODA expenditure consists mostly of support for destitute asylum seekers (adults, families and unaccompanied children) in the first twelve months after they make a claim for asylum in the UK. This support provides mainly accommodation and subsistence payments, but also includes advisory services. Support is also provided for refugees or those in need of humanitarian protection (including children) under the Gateway Protection and Syrian Vulnerable Persons Protection. The Home Office also supports projects to build the capacity and capability of recipient countries to deal with border security, drug smuggling, modern slavery and child protection online. |
| Ministry of Defence (MoD) | In 2017, the MOD spent £6.1m on a range of ODA-eligible activities, including training in human rights, rule of law, international humanitarian law, protection of civilians in conflict and maritime law; UK Hydrographic Office support to international partners in maritime charting; a retraining programme for locally-employed staff in Afghanistan and Refugee assistance in Cyprus. MOD also supported the delivery of ODA-eligible activities funded by the Conflict, Stability and Security Fund and Prosperity Fund”. |
| Prosperity Fund | Projects undertaken in 2016/17 included improving the environment for business, healthcare, and access to financial services, urban planning and energy infrastructure. The projects helped lay the groundwork for the multiyear programmes operating from 2017/18 onwards. |
| Scottish Government | In 2016 the Scottish Government continued its ongoing partnership agreement with the Government of Malawi; it supported projects in three other countries in Sub Saharan Africa (Rwanda, Tanzania and Zambia) and in 3 countries in South Asia (Bangladesh, India and Pakistan). The Scottish Government also provides humanitarian funding to support crises as they occur, including during 2016, the Malawi food security crisis and the DEC Yemen crisis appeal. |
| Welsh Assembly | The Welsh Assembly supports the Wales for Africa programme, which aims to help deliver the Sustainable Development Goals. It also provides small grants to organisations based in Wales to promote development awareness. |
Scope
This publication presents information on the UK’s spending on Official Development Assistance (ODA). It includes data from the Devolved Administrations of the UK, as well as government departments and other contributors to UK ODA. Data relating to both Bilateral and Multilateral ODA are included in the scope of this publication. This publication does not include information on:
- results achieved in international development through the UK’s ODA spend
- Development Tracker you can explore details of the individual development projects that the UK is funding by using the Development Tracker - this allows you to filter projects by country and sector, and view further details about the project as published in documents such as the business case and annual review the tracker uses open data on development projects, compliant with the International Aid Transparency Initiative (IATI) standard, to show where funding by the UK Government and its partners is going and ‘trace’ it through the delivery chain
- the UK’s non-ODA development spend - a separate set of tables containing National Statistics for DFID’s Gross Public Expenditure on Development (GPEX) for 2016/17. GPEX statistics show DFID’s gross spending on development, including spending to countries and organisations that are not ODA-eligible Further information on the definition of GPEX. GPEX statistics for 2017/18 will be published in early 2019, and will be made available on the GOV.UK website
What’s changed in this release?
The estimate of Gift Aid spend on ODA eligible activity is updated to reflect more recent data from charities and Her Majesty Revenue and Customs. This is included in the final UK ODA spend figures for 2017 and it follows a review of the methodology previously announced in this publication (Gift Aid Methodology Review 2017 on Statistics on International Development: Final UK Aid Spend 2017) The FCO’s ODA eligible frontline diplomatic activity costs for 2017 reflect improvements to the methodology to capture these costs.
Final UK ODA statistics for 2017 include multiple sector code reporting, which allows up to 10 different sectors to be reported for a project activity. This replaces the previous single sector code reporting for 2016 data and earlier years, where only the highest spending sector was reported against the project activity, as a whole. Section 3.2 of this publication uses the multiple sector code reporting.
Future developments
The OECD will introduce the ‘Grant Equivalent’ (GE) headline measure of ODA with 2018 ODA statistics. The GE is designed to allow ODA loans to be compared on a similar basis as ODA grants, by counting only the grant element of the loan in ODA. The grant element of a loan will be calculated according to its level of concessionality such that a highly concessional loan will be credited more grant-like than a loan with low concessional terms. This new approach to measuring ODA is therefore expected to incentivise lending to least developed countries. The OECD will also continue collect and report ODA statistics on the current cash flow basis.
Most of the UK bilateral funding is in the form of grants, and therefore the new “grant-equivalent” basis for reporting ODA is expected to have minimal effect on total UK ODA.
Uses and users
The main purpose of these statistics is to provide timely statistics of ODA expenditure by the UK government. They are published prior to the release of final ODA statistics by the OECD DAC for all OECD members.
During a consultation conducted in 2014, users told us that they use the statistics for a variety of purposes: preparing material for briefs; PQs and public correspondence; inclusion in reports and reviews, and providing data for research and monitoring. The users represent the government, civil society and non-government organisations, students and academia and the media.
We are always keen to enhance the value of these statistics and welcome your feedback either via our Statistics User Group or via email statistics@dfid.gov.uk.
Data Quality
Calendar year financial transaction data are used to compile UK ODA spend statistics. These are extracted from DFID’s ARIES database, and the detailed data is subject to input errors from spending teams. The risk of input error is relatively low for estimates of total spend, and by country/region, and relatively higher for spending by sector (where there is sometimes ambiguity, especially for projects or programmes that cut across sectors) and by funding channel. The quality assurance Annex 4 describes the steps that have been taken by DFID statisticians to minimise these kinds of input errors, and to produce UK ODA statistics.
The figure presented for the Welsh Assembly Government and Scottish Government represents their estimated spend for the financial year 2017/18 and are used as a proxy for their calendar year 2017 spend. The Welsh Assembly Government and Scottish Government are currently reviewing their reporting procedures with a view to being able to report calendar year figures going forward.
Data Revisions
DFID data for this publication is based on an extract of the ARIES database taken in May 2018, after the end of the calendar year 2017 and financial year 2017/18. Other Government Department data are collected during May and June, and are quality assured over the summer. Where we do have to revise information included in this publication, we will follow the procedures set out in or revisions policy, available here.
Minor revisions for previous years’ data
2016 ODA figures
Revisions to 2016 ODA figures were previously reported in the April release of Statistics on International Development.
Publication Cycle
DFID releases two editions of Statistics on International Development over the year:
- provisional UK Aid spend will be published in the spring, and includes a preliminary estimate of the UK’s ODA/GNI ratio for the previous calendar year
- final UK Aid spend is usually published in the autumn. This publication confirms the UK’s ODA/GNI ratio for the previous year, as well as including more detailed analysis of the UK’s Bilateral and Multilateral ODA, and includes the microdata used to produce the publication
Related Statistics and Publications
- DFID’s Annual Report provides information on DFID’s results achieved, spending, performance and efficiency, and the OECD DAC aid statistics
- other related publications include, the 0.7% ODA/GNI target
National Statistics
The United Kingdom Statistics Authority has designated these statistics as National Statistics, in accordance with the Statistics and Registration Service Act 2007 and signifying compliance with the Code of Practice for Official Statistics. Designation means the statistics carry the National Statistics label and conform with the standards summarised in the box below:
status
Contact Details
For enquiries (non-media) about the information contained in this publication, or for more detailed information, please contact:
Michael Morris
Department for International Development
22 Whitehall
London
SW1A 2EG
Telephone: 020 7023 0497
E-mail: statistics@dfid.gov.uk
For media enquiries please contact the DFID Press Office on 020 7023 0600.
For further information on development issues and DFID policies, please contact the Public Enquiry Point on 0845 300 4100.