Planning and Preparing for Later Life 2024
Updated 14 August 2025

© Crown copyright 2025
This publication is licensed under the terms of the Open Government Licence v3.0 except where otherwise stated. To view this licence, visit nationalarchives.gov.uk/doc/open-government-licence/version/3 or write to the Information Policy Team, The National Archives, Kew, London TW9 4DU, or email: psi@nationalarchives.gov.uk.
Where we have identified any third party copyright information you will need to obtain permission from the copyright holders concerned.
This publication is available at https://www.gov.uk/government/publications/planning-and-preparing-for-later-life-2024/planning-and-preparing-for-later-life-2024
DWP research report no. 1103.
A report of research carried out by National Centre for Social Research (Nat Cen) on behalf of the Department for Work and Pensions.
Crown copyright 2025.
You may re-use this information (not including logos) free of charge in any format or medium, under the terms of the Open Government Licence.
Or write to:
Information Policy Team
The National Archives
Kew
London
TW9 4DU
Email: psi@nationalarchives.gov.uk
This document/publication is also available on the GOV.UK website.
If you would like to know more about DWP research, email socialresearch@dwp.gov.uk
First published July 2025.
ISBN 978-1-78659-862-2
Views expressed in this report are not necessarily those of the Department for Work and Pensions or any other government department.
Executive summary
Planning and Preparing for Later Life is a nationally representative survey of adults aged 40 to 75 in Great Britain commissioned by the Department for Work and Pensions. The 2024 survey, which collected data from 4,036 adults via an online survey at the end of 2024, is the second in the survey series. It provides an opportunity to understand more about how people prepare for retirement and how this process may have been affected by changes to economic circumstances and pensions policy since the first wave of data collection in 2020 to 2021.
This report presents some key findings from the survey and covers:
- The Later Life Landscape: including background context of people’s working arrangements and pension provision as they approach retirement. According to PPLL, 24% of 40 to 75 year olds were fully retired and a further 10% were semi-retired. 75% of people had a private pension, though this was less common among the self-employed, people on low incomes and renters.
- Expectations around retirement: Most people expected to fund their retirement at least in part through the State Pension, with 44% of 40 to 75 year olds not yet retired expecting half or more of their income in retirement to come from the State Pension. 65% of people said the State Pension amount was very important or important in their decision around when to retire. The median age at which people expected to retire was 66 whereas the median ideal age at which people wanted to retire was 60.
- Planning for retirement: Most people (59%) started saving for their retirement in their 20s or 30s while people generally started actively planning for their retirement in their 50s (45% of people who were semi-retired and 40% of people who were fully retired). 53% of people had used at least one source of information in the past 12 months to help them plan for retirement. However, only 18% had used regulated advice or guidance (a financial advisor or Pension Wise).
- Income adequacy in retirement: People aged 40 to 75 were less confident that they would be able to achieve the lifestyle they wanted in retirement in 2024 compared with 2020/2021. 41% of people aged 40 to 75 said they ’had no idea’ how much income they would need in retirement. 33% of those who had some idea of their income needs said they would need a higher proportion of their current income in retirement than they expected to have.
- Pension decision making: People who had already accessed their pension were generally confident about the decision they had made (rating their confidence an average of 7.3 on a 0 – 10 scale). However, 77% of DC pension holders aged 40 to 75 and yet to access their DC pension did not have a clear plan for how to do so. 21% did not know they had to make a choice of how to access their pension.
A separate report, looking at people’s willingness to pay for pension products and services, is also available.
Acknowledgements
This research was commissioned by the Department for Work and Pensions (DWP) and was carried out by the National Centre for Social Research (NatCen) in collaboration with WPI Economics, the Institute for Employment Studies (IES) and Pensions Policy Institute (PPI). The authors would like to thank Inez Gallagher, Kieran Phillips, Sarah Kate O’Grady, Matthew Lawless and Rachel Riggs for their support during the project.
The successful delivery of the Planning and Preparing for Later Life Survey relied on input from a wide range of people at NatCen, including survey programmers Pamela Ritchie and Jatin Bhatt, data managers Migle Aleksejunaite and Martin Hogg, statisticians Christos Byron and Tobi Li, Telephone Unit managers Sonia Shirvington and Joy Linstead, the telephone interviewers working on the project, and Alun Humphrey, Head of Household Surveys at NatCen. Head of NatCen’s Questionnaire Design and Testing hub Joanna D’Ardenne, along with Sophie Pilley, oversaw the cognitive testing of the questions. Helena Wilson also worked on the questionnaire. The segmentation analysis was carried out by Sam Beardsworth and Ekaterina Khriakova.
We would like to thank James Edgar, Rob Fontana-Reval and Edward McPherson at WPI Economics for their invaluable expertise around asking questions to capture people’s willingness to pay for pension products and services. Lauren Wilkinson and John Upton at the Pensions Policy Institute and Zofia Bajorek and Jonny Gifford at the Institute for Employment Studies provided useful feedback on both the survey questionnaire and the report.
Author details
The report was written by Sarah Butt, Bethany Chapman, Olivia Cottis Black, Amy Dyer and Sinead Palmer at the National Centre for Social Research.
Glossary
Annuity: A form of insurance policy that consumers can buy with their pension pot. This will typically provide the consumer with a guaranteed income for life, or for a fixed number of years.
Automatic Enrolment: A legal requirement that every employer must automatically enrol its workers into a quantifying pension scheme subject to certain criteria. Employers gradually enrolled all eligible workers into qualifying pension schemes between 2012 and 2018.
Default pathways for accessing Defined Contribution pension: The government is legislating in the Pension Schemes Bill introduced in 2025 to require pension providers to offer pension holders a default option for how to access their DC pension. Under this approach pension providers would propose an option for the pension holder based on what they know about the pension holder’s needs and financial circumstances. The pension holder would be consulted on the default solution and would have the option to choose an alternative if they wanted. The survey referred to a version of this policy, using the language of ‘default pathway’ to describe a situation where a decumulation decision is made by a provider on behalf of a pension holder. The survey did not specify that the pension holder would be able to choose an alternative option like in the measures proposed in the Pension Schemes Bill.
Defined Benefit (DB): A scheme in which the benefits are defined in the scheme rules and build up regardless of the contributions paid and investment returns. The benefits are most commonly related to members’ earnings at the point they leave the scheme or retire, and the length of their pensionable service. These are also known as ‘final salary’ or ‘salary-related’ schemes. DB benefits are guaranteed or underwritten by the sponsoring employer.
Defined Contribution (DC): A scheme in which a member’s benefits are determined by the value of the pension fund. The value of the fund at any time depends on contributions and performance of investments.
Financial literacy: Respondents’ financial literacy score was calculated based on their answers to 3 financial questions. These questions were the same as those used in the Financial Conduct Authority’s Financial Lives survey.
Income drawdown: Flexi-access income drawdown products involve investing a pension pot into a fund or funds which allow the consumer flexible access. The consumer can withdraw funds when they want and use this as an income. Income drawdown providers offer a range of different funds, with different investment objectives, risks, and levels of charges.
Midlife MOT: A Midlife MOT is a service for individuals in mid-life that helps them take stock of their finances, skills and health, and enables them to better prepare for their retirement and build financial resilience. A Midlife MOT can take the form of a discussion (such as the Job Centre Plus Midlife MOT group sessions) or a web-based tool such as the DWP Midlife MOT website which was launched in 2023.
Pension Wise: A free and impartial service set up by the Government in 2015 offering guidance for people regarding Pension Freedoms introduced in the 2014 UK budget. The service is available to people aged 50 years and over with a DC pension to help them understand what they can do with their pension pot(s). Guidance is delivered via telephone, face to face appointments, or online.
Retirement Pack: Packs pension providers are required to send to people 4-6 months before they may be accessing their pension. Packs are aimed at ensuring people receive timely, relevant and adequate information about their retirement options to enable them to make an informed decision about accessing their pension savings. Some pension providers (those regulated by the Financial Conduct Authority) are now also required to provide a single page summary retirement pack from age 50, and every 5 years after that, until the pension pot is accessed. Retirement packs are sometimes referred to as ‘wake-up packs’.
Semi-retirement: The report distinguishes between people who are fully retired and people who are semi-retired. Survey respondents over 50 were given the opportunity to self-define their retirement status as “not yet retired”, “semi-retired” but doing some paid work/may do some paid work in the future or “fully retired” and not intending to do any more paid work.
Simple Annual Benefit Statement: A short document (no more than 2 pages) provided by pension providers to people with Defined Contribution pensions which sets out: how much money people have in their pension pot, how much they are likely to have by the time they retire and what they could do to give themselves more money in retirement.
State Pension Age (SPa): The age at which an individual can claim their State Pension.
Abbreviations
AE: Automatic Enrolment (into workplace pension)
DB: Defined Benefit (pension)
DC: Defined Contribution (pension)
PLSA: Pensions and Lifetime Savings association
PPLL: Planning and Preparing for later Life Survey
SP: State Pension
SPa: State Pension age
TRR: Target Replacement Rate
Summary
The Planning and Preparing for Later Life Survey (PPLL) 2024 was commissioned by the Department for Work and Pensions (DWP) to provide up to date information on people’s attitudes and behaviours around planning for retirement. This survey is the second in the series, following on from the first wave of PPLL conducted in 2020 to 2021.
The 2024 survey had 4 main objectives:
- to understand attitudes and behaviours around pension saving and planning for later life
- to provide evidence to support policy development around income adequacy in retirement
- to gather evidence on attitudes and knowledge around the State Pension system
- to gather evidence on the value consumers place on DWP products, policies and services
PPLL collected data from a nationally representative sample of 4,036 adults aged 40 to 75 in Great Britain. Data were collected via a 45 minute online self-completion survey (with the option to complete via the telephone on request) between 30 October and 7 December 2024.
The sample for the survey was drawn from respondents to the 2022 to 2023 and 2023 to 2024 Family Resources Surveys aged 40 to 75 who had agreed to be contacted for further research. The data have been weighted to ensure that findings can be generalised to the population of 40 to 75 year olds in Great Britain. The final data have been calibrated against ONS mid-year population estimates and Labour Force Survey estimates to ensure that they closely resembled the target population in terms of sex, age and region.
Read a separate report discussing survey findings on people’s willingness to pay for different products and services.
The later life landscape: This chapter presents headline findings from the survey on the working and pension saving habits of the 40 to 75 population covered by the report. The chapter also presents the results of a segmentation analysis identifying 5 different groups within the 40 to 75 year old population with different levels of preparedness for retirement. Key findings include:
- 24% of 40 to 75 year olds were fully retired and 10% were semi-retired. From the age of 65, there was a sharp increase in the proportion of people who said they were fully retired (66% of people aged 65 to 69).
- 60% of people 40 to 75 in paid work said they wanted to work less as they approached retirement. When asked what would help them keep working longer, 46% of people who had not yet retired from paid work mentioned working fewer hours or being able to take more holidays.
- 75% of people aged 40 to 75 had a private pension. People on lower incomes, renters and with a long-term limiting health condition were less likely to have a private pension. 54% of people without a pension mentioned not being able to afford it as a reason for not having a pension.
- 38% of 40 to 75 year olds had no savings, while a further 2 in ten (20%) had savings of under £15,000. 78% of social renters and 66% of private renters reporting having no savings, compared with 17% of people who owned their home outright.
- A segmentation analysis revealed 5 distinct groups with different levels of preparedness for retirement among the 40 to 75 population (including those already retired and those yet to retire). This included 14% of the population who were classed as “Secure and Confident” but also 16% who were classed as “Unprepared and financially vulnerable”.
Expectations for retirement: This chapter presents findings on the importance of the State Pension in people’s planning for retirement, including people’s knowledge of and understanding of the State Pension and whether they expect to retire above or below State Pension age. Key findings include:
- Around two-thirds (65%) of people below State Pension age said the amount of State Pension they receive would be very important or important in their decision on when to retire.
- 52% of people below State Pension age said they had ever checked their State Pension age while 41% had ever checked what the amount of State Pension they might receive is. These proportions increased with age.
- One in ten people below SPa were able to identify the full rate of the new State Pension (although not all people in this age group would be entitled to this amount). However, a further 35% were within 10% of the actual figure. People were far more likely to underestimate (71%) than to overestimate (19%) the amount.
- The median ideal retirement age for 40 to 75 year olds who had not yet retired was 60. However, the median expected retirement age was 66, with 72% of people who had not yet retired expecting to retire later than their ideal age.
- 44% of people expected to retire before their State Pension age. Working beyond State Pension age was more common among the self-employed, people without a Private Pension, people on low incomes and renters.
Planning for retirement: This chapter presents findings on when people start planning for retirement, the information sources they use to plan for retirement and how actively engaged they are in managing any private pensions. Key findings include:
- People were most likely to say they started saving for their retirement in their 20s or 30s with 59% having done so. People started actively planning for their retirement at a later age. 45% of people who were semi-retired and 40% of people who were fully retired started planning in their 50s, with only 22% of semi-retired people (21% fully retired) starting earlier.
- 52% of 40 to 75 year olds had used at least one source of information to help them plan for retirement in the last 12 months. 33% had used less formal information sources such as family and friends or their employer whereas only 16% had used a regulated source of advice or guidance (either an independent financial advisor or Pension Wise).
- How confident people felt making decisions about pensions varied. The mean confidence score on a 0 to 10 scale was 5.1. Nearly half (48%) of 40 to 75 year olds rated their confidence between 6 and 10 on the scale but 13% rated their confidence as 0. People with high financial literacy, who had used regulated advice or guidance in the last 12 months and with a private pension felt more confident making decisions about pensions.
- Engagement with private pensions was limited. Most DC pension holders aged 40 to 75 (79%) recalled having received a simple annual benefit statement. However, only 46% of all private pension holders aged 40 to 75 said they had reviewed the value of their private pension in the last 12 months while 25% had reviewed the investment strategy of their pension.
- 24% of private pension holders aged 40 to 75 said they found it fairly or very difficult to keep track of their pension. The government is developing a pensions dashboard to help people keep track of their pension(s). Most people aged 40 to 75 said they would be very (50%) or fairly likely (31%) to use a pensions dashboard.
Income adequacy in retirement: This chapter presents findings on how confident people are that they will be able to achieve the lifestyle they want in retirement, their expectations for their income and expenditure in retirement, and the extent to which housing tenure plays a role in that. Key findings include:
- People aged 40 to 75 were less confident that they would be able to achieve the lifestyle they wanted in retirement in 2024 compared with 2020/2021. When asked to rate their confidence on a scale from 0 to 10 the mean confidence score in 2024 was 4.7, compared with 5.8 in 2020 to 2021.
- 41% of people aged 40 to 75 said they ’had no idea’ how much income they would need in retirement. This figure was higher among younger age groups and the less financially secure, that is those on lower incomes and renters compared with owner occupiers.
- Among people who had some idea of the income they would need in retirement, the median estimated income needed was £24,000 - below the PLSA threshold of £31,700 for a single person to live a moderate lifestyle. However, £24,000 is broadly in line with what a median earner would need to achieve their Target Replacement Rate.
- 33% of people aged 40 to 75 who had not yet fully retired from paid work and who had some idea of their income needs said they would need a higher proportion of their current income in retirement than they expected to have.
- 82% of people aged 40 who had not yet retired expected to fund their retirement at least in part via a private pension. People with a private pension were more likely than people without a private pension to also have access to other sources of income in retirement including savings and investments. Nearly half (49%) of people without a private pension expected 90-100% of their income in retirement to come from the State Pension.
- People varied in how reliant they expected to be on their partner’s income in retirement. On average, women rated their level of reliance on a partner (5.3 on a 0 – 10 scale) higher than men did (3.0 on a 0 – 10 scale).
- 68% of 40 to 75 year olds who had not yet retired expected to own their own home outright by the time they fully retired from paid work. Among those who did not expect to own their own home, the main reason given (by 80%) was not being able to afford it.
Pension decision making: This chapter presents findings on when and how people choose to access their Defined Contribution Pension, how confident people feel making decisions around accessing their pension and what, appetite there is for pension providers to offer default benefit options for accessing pensions:
- Among people who had already accessed their pension, the average age at which they did so was 60. Employees, people on higher incomes, and those buying a home with a mortgage were all more likely to have accessed a pension by age 60.
- 53% of people aged 40 to 75 wanted their pension to provide them with a guaranteed income for life. This compares with 31% who wanted a flexible income and 12% who wanted a flexible income up to a certain age and then a guaranteed income thereafter. Younger age groups and people with smaller pension savings were the most likely to want a guaranteed income for life.
- The majority (77%) of DC pension holders yet to access their pension did not have a clear plan for how to do this. This includes 56% who knew they had to make a choice but did not have a clear plan, and 21% who were not aware they had to make a choice. Only 22% had a clear plan.
- 41% of DC pension holders who knew they had to make a choice said they planned to take an annuity compared with 58% who planned to move their pension into flexi-income drawdown. 67% said they would take some of their pension as a cash lump sum while only 16% planned to fully cash in their pension.
- People aged 55 and over who had accessed their DC pension since 2015 were generally confident that they had made the right choice to meet their retirement goals. Asked to rate their confidence on a scale from 0 to 10, the mean score was 7.3.
- 83% of people who had accessed a DC pension since 2015 had taken at least some of their pension as a lump sum. 37% of people who took a partial lump sum used it for a one-off purchase while 30% paid off debts. Most people (87%) were either very or quite satisfied with their decision to take a lump sum.
1. Introduction
This report presents new evidence on planning for retirement among 40 to 75 year olds. The findings are based on analysis of a representative survey of 4,036 40 to 75 year olds in Great Britain conducted in November and December 2024.
Research aims
The Planning and Preparing for Later Life Survey (PPLL) 2024 was commissioned by the Department for Work and Pensions (DWP) to provide up to date information on people’s attitudes and behaviours around planning for retirement. It is the second in the survey series, following on from the first wave of PPLL conducted in 2020 to 2021.
Since the 2020 to 2021 survey was conducted, the context in which people are planning for retirement has changed. People’s employment and financial circumstances may have been affected by the legacy of the COVID-19 pandemic as well as the rising cost of living experienced since 2022. In addition, the pensions policy landscape has continued to evolve with the government publishing its response to the latest State Pension age Review and announcing a new Pension Schemes Bill in the 2024 King’s Speech. The new survey provides evidence to inform future developments.
The 2024 survey had 4 main objectives:
- to understand attitudes and behaviours around pension saving and planning for later life
- to provide evidence to support policy development around income adequacy in retirement
- to gather evidence on attitudes and knowledge around the State Pension system
- to gather evidence on the value consumers place on DWP products, policies and services
Policy context and research questions
This report focuses on people’s attitudes and behaviour in 3 key areas: awareness of, and expectations around, the State Pension; people’s level of active engagement with planning for retirement and, in particular, managing any private pensions they might have; and people’s expectations around, and confidence in, having an adequate income in retirement.
As described more fully in the next chapter, the UK has an ageing population. This has necessitated changes to State Pension arrangements to ensure that the system can be sustained and remain consistent with the principle that people should spend around a third of their adult life in receipt of the State Pension. The new State Pension was introduced in 2016. Legislation has also been introduced to increase the State Pension age (SPa) from 66 to 67 between 2026 and 2028 and to 68 from 2044 to 2046. As recommended in the 2023 State Pension age review, these increases will be retained, though the timing of the increase to age 68 remains under review (Neville-Rolfe, 2022; GOV.UK, 2023). The review also acknowledged the importance of continuing to regularly monitor State Pension age and financial awareness, particularly amongst vulnerable groups and young people, to support improvements and feed into ongoing communications and education activity. PPLL 2024 provides an opportunity to understand more about the extent to which people are aware of changes to the State Pension, including their State Pension age, as well as how their expectations of the State Pension may influence their decisions around when to retire.
Increased life expectancy and a later SPa necessitate that people continue working for longer, not only for the economic benefits working provides, but also the potential improvements to health and wellbeing (Neville-Rolfe, 2022). This in turn requires recognition of barriers that people may face to working in later life and that older workers may need additional support. Adults aged 55 to 64 are the ones most likely to be providing unpaid care for example (FRS, 2025) and may require flexible working arrangements to accommodate these caring needs. The gap in labour market participation between younger and older people has narrowed and the age at which people are leaving the workforce has increased (ONS, 2024). Nevertheless, many people leave the labour market before they reach State Pension age. In 2024, only 40% of 65 year olds were in paid work (DWP, 2024). PPLL 2024 provides evidence on how people’s expected age of retirement varies across the population as well as what people want from work as they get older and what might enable them to stay in the workforce for longer.
The private pensions landscape has also seen considerable changes in recent years. The introduction of Automatic Enrolment has led to a significant increase in the proportion of people with private pension provision (DWP, 2024). However, there remain gaps in pension coverage – for example for part-time and self-employed workers. Furthermore, increased pensions enrolment has not necessarily led to an increase in pensions engagement and may mean people are complacent about their workplace pensions (DWP, 2023). The move away from Defined Benefit (DB) to Defined Contribution (DC) pensions (The Pensions Regulator, 2024) along with the introduction of Pension Freedoms in 2015 - which allowed people to access their pension from age 55 and take a cash lump sum - has raised questions about whether people are sufficiently well informed and making the best decisions about how to access their pensions (The People’s Pension, 2021). The government has introduced a number of products and services such as Pension Wise and the Midlife MOT website to help people make informed choices. It is also seeking to introduce new policies to address specific issues such as the proliferation of small pension pots. However, questions remain about how aware people are of these services, their attitudes towards them and the likely take up. PPLL 2024 can shed light on this, as well as providing evidence on how people engage with and make decisions about how to access their DC pensions.
Finally, questions remain around whether people will have an adequate income to live on in retirement. The move from DB to DC pensions risks leaving people with less pension income than would previously have been the case (Lane, Clark and Peacock, 2022). The potential impact on retirement incomes of small pot sizes is further exacerbated by the risk of people taking the short-term decision to take a large proportion of their income as a cash lump sum rather than using it to purchase an annuity (The People’s Pension, 2021). The introduction of Automatic Enrolment in 2012 alongside a mandatory 8% minimum contribution from 2019 should help to increase pension pot sizes. However, the benefits of those arrangements will take time to be realised. Analysis from DWP, which assumes that pension holders convert all of their pension into an annuity, suggests that as many as 44% of people retiring in the 2030s will not reach their Target Replacement Rate (TRR, that is the percentage of pre-retirement earnings an individual would need to achieve to meet an adequate income in retirement After Housing Costs), although this will fall to 36% of people due to retire in the 2050s (DWP, 2023). A higher proportion of renters (47%) compared with home owners (37%) are predicted to not meet their TRR (After Housing Costs) (DWP, 2023). This is notable in light of declining rates of home ownership (see findings from the English Housing Survey) and the likelihood that a higher proportion of retired people in future cohorts will be in the rented sector. PPLL 2024 provides an opportunity to assess how realistic people’s expectations for their income in retirement are and who is/is not confident that they will be able to achieve an adequate standard of living in retirement.
Methodology
The Planning and Preparing for Later Life survey collected data from a nationally representative sample of 4,036 adults aged 40 to 75 in Great Britain. Data were collected via a 45 minute online self-completion survey (with the option to complete via the telephone on request) between 30 October and 7t December 2024.
The sample for the survey was drawn from respondents to the 2022 to 2023 and 2023 to 2024 Family Resources Surveys aged 40 to 75 who had agreed to be contacted for further research. The sample consisted of all 40 to 75 year olds who were sampled for FRS 2023 to 2024 between April and September 2023 as well as a random sample of respondents aged 40 to 75 who responded to FRS 2022 to 2023. A total sample of 14,069 individuals was invited to complete the survey. Responses were received from 4,036 individuals, 29% of the issued sample.
The data have been weighted to ensure that findings can be generalised to the population of 40 to 75 year olds in Great Britain. The final data have been calibrated against ONS mid-year population estimates and Labour Force Survey estimates to ensure that they closely resembled the target population in terms of sex, age and region.
Some of the questions in PPLL 2024 were also asked in 2020 to 2021 allowing for comparisons to be made over time. There is, however, a need for caution when looking at change over time given a change in methodology between 2020 to 2021 (when the survey was conducted solely on the telephone) and 2024 (when the survey moved online). Where the change in methodology may have particularly influenced the comparability of findings this is flagged in the report.
Further details of the survey methodology can be found in the accompanying Technical Report.
Data from the 2020 to 2021 and 2024 surveys are publicly available via the UK Data Service.
This report
Outline of the report
The report is divided into 5 substantive chapters covering: The later life landscape: This chapter sets the scene for the rest of the report. It presents:
- external evidence on the ageing population, employment patterns among older workers and trends in private pension participation to provide context for the PPLL findings
- headline findings from PPLL on the characteristics of the 40 to 75 population covered by the report regarding their working life and pension saving habits
- a discussion of the underlying economic and personal circumstances of the 40 to 75 population and how these may combine to influence retirement planning
- the results of a segmentation analysis which identifies 5 different groups within the 40 to 75 year old population with different levels of preparedness for retirement
Expectations for retirement: This chapter presents findings from the PPLL survey on:
- how important is the State Pension in people’s planning for retirement?
- what do people know about the State Pension, including their State Pension age?
- when do people expect to retire from paid work? Who is more/less likely to continue working beyond State Pension age?
Planning for retirement: This chapter presents findings from the PPLL survey on:
- when do people start planning for retirement?
- what information sources do they use to plan for retirement?
- how confident are people taking decisions about pensions?
- how actively engaged are people in managing their private pension?
Income adequacy in retirement: This chapter presents findings from the PPLL survey on:
- how confident are people that they will be able to achieve the lifestyle they want in retirement?
- how much money do people expect to need in retirement?
- how does this compare with what they expect their retirement income to be?
- how do people expect to fund their retirement?
- what is the role of housing wealth in retirement?
Pension decision making: This chapter presents findings from the PPLL survey on:
- when do people access their pensions?
- how do they access their Defined Contribution pensions?
- how confident are people in the decisions they make around accessing their pension?
- what appetite, if any, is there for pension providers to offer default options for accessing pensions?
The report is accompanied by tables which show the results broken down by demographic subgroups.
Caveats and limitations
This report contains bivariate analysis only. It considers how people’s experiences of and requirements around preparing for retirement may vary by characteristics including age, gender, retirement status, employment status, income, tenure and financial knowledge (see Chapter 2 for more on how these characteristics are defined). However, many of these factors will of course be interrelated. For example, women tend to have lower incomes than men and there is a positive association between income and financial literacy. Where a difference between men and women is observed, it is not possible to determine, from the analysis in this report, whether this difference is the result of differences in income or financial literacy between men and women or another factor. The data will be made publicly available via the UK Data Service for people wishing to conduct further analysis.
Retirement planning is closely related to age. PPLL findings, which apply only to those aged 40 to 75, may therefore look somewhat different to those from other sources which cover the whole adult population.
When discussing the association between income and pension planning, the focus is on respondents’ individual income from all sources (including, but not limited to, paid work). Focusing on individual income rather than household income or wealth may not fully reflect people’s overall economic circumstances or the resources they can utilise when planning for retirement. Nevertheless, given the focus of this report is on how individuals, rather than households, plan for retirement, findings are most commonly discussed in terms of individual income. A further breakdown of selected results by household income is provided in selected accompanying tables.
The information on pensions reported in this survey is based on individuals’ self-reports of the pensions they hold. It should be borne in mind that people may not know or be able to recall every detail of their pensions. PPLL is not intended to provide complete or precise estimates of people’s pension holdings. Figures presented here, for example regarding the number of pensions people hold or their pension pot size, may differ from data available from other sources such as from pension providers. Nevertheless, despite some possible inaccuracies in recall, the PPLL pensions data provide a valuable opportunity to evaluate how much people know/can report regarding their pensions and to explore how people’s pension saving may be related to a wide range of other factors including their personal, family and employment situation.
Reporting conventions
Where the report discusses differences between groups defined by a particular characteristic (such as age or sex) on a particular measure, or differences over time between 2020 to 2021 and 2024, the differences can be assumed to be statistically significant at the 5% significance level unless otherwise stated.
The statistical tests used in this report only allow us to identify whether the relationship between 2 variables is significant overall. Multiple tests of significance between different categories of a variable were not performed. For example, a passage which reports that saving increased with age may illustrate this by saying x% of 40 to 49 year olds had savings compared with y% of those 65+. The overall relationship between age and savings will have been tested for statistical significance but the specific difference between x% and y% will not have been tested separately.
Numbers quoted in the text or displayed in figures which combine 2 or more answer categories are calculated based on unrounded numbers and so may differ slightly from the rounded numbers shown in the accompanying tables. Don’t know and refusal responses are excluded from table bases unless otherwise stated. This may mean that the bases shown in tables for sub-groups will not always sum to the base shown in the total column. For the same reason, tables with the same base description, for example “All respondents” may include different numbers of respondents. Percentages less than 0.5% are shown in tables with a *. ‘-‘ indicates that no one selected that response option. Numbers shown in [ ] were calculated on a base size of less than 50.
2. Later life landscape
- 24% of 40 to 75 year olds were fully retired and 10% were semi-retired. From the age of 65, there was a sharp increase in the proportion of people who said they were fully retired (66% of people aged 65 to 69).
- 60% of people 40 to 75 in paid work said they wanted to work less as they approached retirement. When asked what would help them keep working longer, 46% of people who had not yet retired from paid work mentioned working fewer hours or being able to take more holidays.
- 75% of people aged 40 to 75 had a private pension. People on lower incomes, renters and with a long-term limiting health condition were less likely to have a private pension. 54% of people without a pension mentioned not being able to afford it as a reason for not having a pension.
- 38% of 40 to 75 year olds had no savings, while a further 2 in 10 (20%) had savings of under £15,000. 78% of social renters and 66% of private renters reporting having no savings, compared with 17% of people who owned their home outright.
- A segmentation analysis revealed 5 distinct groups with different levels of preparedness for retirement among the 40 to 75 population (including those already retired and those yet to retire). This included 14% of the population who were classed as “Secure and Confident” but also 16% who were classed as “Unprepared and financially vulnerable”.
This chapter provides an overview of the 40 to 75 year old population covered by this report, giving context for the rest of the findings. It highlights the long-term trends around the ageing population, older people in the workforce and increased pensions enrolment that shape the current later life landscape. It then goes on to discuss PPLL survey findings with respect to the experience of work in later life, including what people want from work as they get older and what might encourage people to remain in the workforce for longer. Next, it considers findings on private pension provision, who has a pension, what type, and how many. The chapter also considers the wider socio-economic and demographic characteristics of the 40 to 75 population and the range of circumstances – caring responsibilities, health, home ownership, financial literacy – that might influence retirement decisions and experiences.
The chapter ends by presenting the results of a segmentation analysis which identifies 5 different groups within the 40 to 75 year old population with different levels of preparedness for retirement.
An ageing population
The population is ageing (ONS, 2025a, 2025b). This trend is driven by increases in life expectancy as well as the baby boomer generation born in the 1960s reaching retirement age. Between mid-2022 and mid-2032, the number of people in the UK at State Pension age is projected to increase by 1.7 million, from an estimated 12.0 million to 13.7 million people (a 13.8% increase). In mid-2022, there were 6.1 million people aged 75 and over, making up 9.1% of the population. By mid-2047, this is projected to increase to 10 million, representing 13% of the total UK population. People aged 65 in 2023 can expect to live on average a further 19.8 years for males and 22.5 years for females. At the same time, declining fertility rates mean that there are projected to be fewer children in the population by mid-2032 and 2047 compared with 2022. These trends have implications for the future funding of the State Pension system as well as individuals’ thinking around retirement, when to retire, and how much they will need to fund their retirement.
Work in later life
People are now remaining in the workforce for longer. Although the employment rate among the 50 to 64 year old age group decreased between 2019 and 2023, the overall trend over the last 30 years was one of increased employment among this age group. The employment rate for 50 to 64 year olds stood at 70.9% in 2024 compared with 57.2% in 1995. The economic inactivity rate of people aged 65 has decreased over the last decade, from 72.8% in 2014 to 58.1% in 2024. The average age at which people exit the labour market is now at its highest since records began in 1984; 65.7 years old for men and 64.5 for women (ONS, 2024).
Alongside this general upward trend in older working people, it is important to bear in mind that people’s experiences can vary and that some groups may face greater barriers to working later in life. For example, people in low-paid and physically demanding jobs are up to 6 times more likely to leave the workforce due to ill health compared with those in managerial and professional occupations (TUC, 2021). At the same time, work is becoming more transient, as shown by the growth in the gig economy. This may exclude workers from pension provision altogether, or leave them with a more fragmented provision consisting of multiple small pension pots (DWP, 2024). Since 2018 UK workers aged 55-64 with long-term health conditions have become more likely to be economically inactive (Litsardopoulos et al., 2025). This section looks in more detail at people’s experiences of paid work in later life.
Employment and retirement rates
Data from the PPLL survey showed that nearly a quarter (24%) of people aged 40 to 75 were fully retired, and a further 10% were semi-retired[footnote 1].
People started to report being retired from age 50, with more initially considering themselves semi- than fully- retired (6% of people aged 50 to 54 semi-retired compared with 1% fully retired). From the age of 65, there was a sharp increase in the proportion of people who said they were fully retired, with 66% of people aged 65 to 69 saying this (compared with 19% who were semi-retired). A minority of people had delayed retiring until later, with 10% of 70 to 75 year olds saying they were semi-retired and a further 4% not retired (see Chapter 3 for more on people’s expectations around their age of retirement). (Table 2.01 and Figure 2.1).
Figure 2.1 Retirement status, by age
| Age | Not retired % | Semi-retired % | Fully retired % |
|---|---|---|---|
| 40 to 44 | 100% | 0% | 0% |
| 45 to 49 | 100% | 0% | 0% |
| 50 to 54 | 93% | 6% | 1% |
| 55 to 59 | 77% | 14% | 9% |
| 60 to 64 | 55% | 21% | 23% |
| 65 to 69 | 16% | 19% | 66% |
| 70 to 75 | 4% | 10% | 85% |
Source: Planning and Preparing for Later Life Survey 2024
Base: All adults 40 to 75 (n=4,036)
The proportion of 40 to 75 year olds who said they had fully retired in 2024 (24%) was slightly lower than in 2020/2021 (27%). However, more people said they were semi-retired in 2024 (10% compared with 8%). (Table 2.01_Trend).
Most people aged 40 to 75 were in paid work, either as employees (52%) or self-employed (8%). The proportion of people in paid work started to decline from age 55, with only 72% of 55 to 59 year olds in paid work compared with 84% of 50 to 54 year olds. The proportion of 60 to 64 year olds in paid work was even lower at 54%. (Table 2.02 and Figure 2.2).
Figure 2.2 Employment status, by age
| Age | Employee % | Self-employed % | Not working % | Fully retired % |
|---|---|---|---|---|
| 40 to 44 | 79% | 7% | 14% | 0% |
| 45 to 49 | 72% | 8% | 20% | 0% |
| 50 to 54 | 75% | 8% | 15% | 2% |
| 55 to 59 | 57% | 14% | 20% | 9% |
| 60 to 64 | 46% | 9% | 22% | 23% |
| 65 to 69 | 16% | 8% | 11% | 66% |
| 70 to 75 | 6% | 3% | 5% | 85% |
Source: Planning and Preparing for Later Life Survey 2024
Base: All adults 40 to 75 (n=4,036)
A sizeable minority of people aged 40 to 75 (16%) were not currently in paid work, but did not consider themselves to be fully retired. This group included people who were unemployed, in full-time education, or looking after the home as well as people who were economically inactive due to ill-health. Among those who defined themselves as semi-retired, around half (54%) were in paid work, including 18% who were self-employed, while the remaining 46% were not in paid work.
Of those not in paid work and not fully retired, the majority said they definitely (27%) or probably (45%) expected to return to paid work. This expectation was similar to that in 2020/2021 (66%). (Table 2.03 and 2.03_Trend).
Type of work
The majority of 40 to 75 year olds in paid work were employees. Only 16% of workers were currently self-employed. However, rates of self-employment increased notably from the age of 55 onwards. Around 1 in 5 (22%) people aged 55 to 59 in paid work were currently self-employed, rising to over a third of those aged 66 to 69 (37%) or 70 to 75 (38%). Self-employment may offer opportunities for people to keep working longer in life, with many potentially taking up new roles prior to full retirement. People who were semi-retired were especially likely to currently be self-employed – 37% compared with 14% of those not yet retired. The overall rate of self-employment among 40 to 75 year olds has declined since 2020 to 2021, when 20% were currently self-employed and 33% had at least some experience of self-employment, compared with 16% and 27% respectively in 2024. This decline may be related to a sharp drop in self-employment following the COVID-19 pandemic (ONS, 2022). (Table 2.04, 2.04_Trend and Figure 2.3).
Figure 2.3 Whether people in paid work currently or ever self-employed, by age
| Age | Currently self-employed % | Ever self-employed % |
|---|---|---|
| 40 to 44 | 10% | 17% |
| 45 to 49 | 14% | 25% |
| 50 to 54 | 11% | 22% |
| 55 to 59 | 22% | 34% |
| 60 to 64 | 17% | 31% |
| 65 to 69 | 37% | 45% |
| 70 to 75 | 38% | 43% |
Source: Planning and Preparing for Later Life Survey 2024
Base: Adults 40 to 75 in paid work (n=1,984)
Overall, nearly two-thirds of people aged 40 to 75 in paid work were working full-time (64%). The proportion of people working part-time increased with age. Over two-thirds of 65 to 69 year olds (69%) were working less than 35 hours a week, while around half (52%) of those aged 70 to 75 were working fewer than 16 hours a week. Nearly all of those who were semi-retired worked part-time (92%) compared with less than a third of people who were not retired (31%). Women were more likely to work part-time (51% compared with only 22% of men), as were those self-employed. The higher rates of part-time working among the self-employed are consistent with the higher rates of self-employment among the semi-retired. (Table 2.05).
Around half of 40 to 75 year olds had jobs they described as either very (18%) or fairly (37%) physically active. There was no evidence that the proportion of people in physically active jobs declined with age. This suggests that many people are keeping physically active through employment in later life. (Table 2.06).
Most people in paid work (77%) reported being satisfied with their current work arrangements, including 33% who were very satisfied. Levels of satisfaction did not vary much by age, although the oldest workers (perhaps remaining in the workforce through choice) were the most likely to report being very satisfied with 57% of workers aged 70 to 75 saying this. Satisfaction with working arrangements had declined since 2020 to 2021. In 2024 33% said they were very satisfied compared with 44% in 2020/2021. (Table 2.07, 2.07_trend and Figure 2.4).
Figure 2.4 Satisfaction with current working arrangements 2020 to 2021 and 2024
| Age | Very satisfied % | Satisfied % | Neither satisfied nor dissatisfied % | Dissatisfied % | Very dissatisfied % |
|---|---|---|---|---|---|
| PPLL 2020 to 2021 | 44% | 44% | 6% | 4% | 2% |
| PPLL 2024 | 33% | 45% | 16% | 5% | 1% |
Source: Planning and Preparing for Later Life Survey: 2020 to 2021 and 2024
Base: Adults 40-75 in paid work (2024: n=1,982, 2020 to 2021: n=1,241)
What do people want from work as they approach retirement?
This section looks specifically at what people aged 40 to 75 currently in paid work but not yet retired want from paid work as they approach retirement, and what might enable them to keep working for longer.
Most people (60%) said they wanted to work less than currently as they approached retirement, while only 3% said they wanted to work more. The proportion of people saying they wanted to work less decreased with age, with more people instead saying they wanted to work the same amount. This likely reflects the fact people approaching retirement had already reduced their working hours. (Table 2.08 and see Table 2.05).
The majority of people in paid work wanted to continue working for the same company as they approached retirement (62%). One in ten (10%) said they wanted to continue being self-employed, while a similar proportion (9%) said they wanted to become self-employed. This is consistent with the move towards self-employment among older, semi-retired workers described above. (Table 2.09 and see Table 2.04).
Around 1 in 4 (27%) workers said they would like to decrease their responsibilities in various ways as they approached retirement, such as taking responsibility for fewer tasks (18%). Among workers that did not indicate a desire to decrease responsibility, 16% said they would like to increase their responsibilities as they approached retirement, for example by managing more staff (9%) or larger projects (10%). People in the 40 to 44 age group – and furthest from retirement – were most likely to want an increase in responsibility. The findings point to the fact that different people may have different expectations and requirements of work as they approach retirement. (Table 2.10 and 2.11).
A quarter of people in paid work mentioned wanting to reduce the amount of physical activity in their job as they approached retirement, either by adapting their existing job (16%) or changing job (9%). The desire to reduce physical activity was particularly prevalent among those with a limiting health condition. This group were more likely to want to adapt their current job (24%), than those without a limiting condition (14%). Unsurprisingly, the more physically active a person’s current job, the more likely they were to want to reduce this activity as they approached retirement. However, still only 56% of people whose current job was very physically active wanted a reduction in physical activity as they approached retirement, with 38% wanting to adapt their current job and 18% wanting to change jobs. (Table 2.12).
When asked what would help them to work longer, people most frequently mentioned being able to work fewer hours or take more holidays (46%), closely followed by more flexible working (39%). Fewer people mentioned being able to take on a less demanding role (19%) or being able to access their pension while still working (19%). One in 4 (25%) said nothing would encourage them to work longer. Perhaps not surprisingly, this figure increased with age, with 37% of people aged 60 to 64 saying nothing would help them to keep working longer. This was also the case for 32% of people who were already semi-retired. (Table 2.13 and Figure 2.5).
Figure 2.5 What would help keep working longer before retirement
| Reasons | Percentage |
|---|---|
| Being able to work fewer hours or take more holidays | 46% |
| More flexible working | 39% |
| Being able to take on a less demanding role | 19% |
| Being able to access pension while still working | 19% |
| Your employer being actively supportive of your caring needs | 16% |
| Work-place adjustments for health condition or disability | 15% |
| Change in your employer or workplace attitudes towards older workers | 10% |
| None of the above | 25% |
Source: Planning and Preparing for Later Life Survey 2024
Base: Adults 40 to 75 not fully retired (n=2,474)
Note: Respondents could select more than one category so figures may sum to more than 100%
Pension provision
The introduction of Automatic Enrolment (AE) into a workplace pension led to a significant increase in the proportion of people with a private pension, specifically a workplace pension. The proportion of people with a workplace pension has stabilised in recent years but has increased significantly since the introduction of AE from 2012. Between 2012 and 2023, the number of employees enrolled in a workplace pension increased from 10.7 million (55% of eligible employees) to 20.8 million (88% of eligible employees) (DWP, 2024).
The move away from Defined Benefit (DB) to Defined Contribution (DC) pensions, which started in the mid-1990s as DB schemes became too expensive to support, has continued, The Pensions Regulator, (2024) estimates that the number of DB schemes has declined by an average of 3% a year since 2021. Data from the Wealth and Assets surveys shows that DC pensions generally provide less pension wealth than DB pensions (ONS, 2025).
Who has a private pension?
Data from the PPLL survey showed that three-quarters (75%) of people aged 40 to 75 in 2024 held a private pension. This proportion is similar to 2020/2021 (76%). People aged 40 to 49 (68%) were less likely to have a private pension than older age groups but otherwise there were not large differences observed by age. People aged 50 to 54 (81%) were the most likely to have a private pension. The level of private pension provision did vary significantly depending on people’s wider economic position. (Table 2.14):
- People who were self-employed (62%) or not working (42%) were less likely than employees (85%) – who have the benefit of automatic enrolment into a workplace pension – to have any private pension provision.
- Renters (55% of private renters and 48% of social renters) were less likely than those buying their home with a mortgage or who owned their home outright to have a pension (85% and 82%, respectively).
- People on lower incomes were less likely to have a private pension. Only around half (54%) of people with an income of less than £12,500 a year had a private pension compared with nearly everyone (95%) with an income of £53,000 a year or more.
- People with a limiting health condition were less likely than people without to have a private pension (58% compared with 81%).
Figure 2.6 Reasons for not having a private pension
| Reasons | Percentage |
|---|---|
| Can’t afford to pay into a pension | 54% |
| It’s too late to start a pension | 18% |
| Don’t know enough about pensions/not interested | 15% |
| Will rely on other sources of income in retirement | 15% |
| Don’t think will live that long | 12% |
| Not working at the moment/still in education | 11% |
| Don’t trust pensions | 6% |
| It’s too early to start a pension | 5% |
| Saving for something else e.g. buying a home | 4% |
Source: Planning and Preparing for Later Life Survey 2024
Base: Adults 40 to 75 without a pension (n=671)
Respondents could select more than one category so figures may sum to more than 100%
The strong association between a person’s financial situation and whether or not they had a pension is mirrored in the reasons people gave for not having a pension. The main reason given – mentioned by 54% of people without a pension – was not being able to afford contributions. This is the same as 2020 to 2021 when 53% of people without a private pension gave this as a reason. Older age groups also mentioned that it was too late to start a pension, with 17% of 55 to 59 year olds and 26% of 60 to 64 year olds giving this as a reason. (Table 2.15, 2.15_trend and Figure 2.6).
Nearly half (47%) of people with a private pension had a single pension. Nearly a quarter (22%) of people had 3 or more. This is a similar picture to 2020 to 2021. (Table 2.16 and 2.16_trend).
Types of pensions held
Workplace and personal pensions
Most people 40 to 75 with a private pension (85%) had a workplace pension. Workplace pensions were far more common than personal pensions, which were held by only 27% of private pension holders. Personal pensions were more common among older age groups. At least 1 in 3 pension holders aged 55 and over had a personal pension compared with only around one in ten aged 40 to 44 (12%). Conversely, younger age groups were more likely to hold a workplace pension, most likely following the introduction of automatic enrolment (see DWP, 2024). Nearly all private pension holders aged 40 to 44 (93%) or 45 to 49 (94%) had a workplace pension. (Table 2.17 and 2.18).
Figure 2.7 Proportion of pension holders with a personal or workplace pension, by employment status
| Pension | Employee % | Self-employed % | Not working % | Fully retired % |
|---|---|---|---|---|
| Personal pension | 21% | 60% | 29% | 32% |
| Workplace pension | 91% | 65% | 80% | 81% |
Source: Planning and Preparing for Later Life Survey 2024
Base: Adults 40 to 75 with a pension (n=3,208)
Self-employed people were 3 times as likely as employees to have a personal pension (60% compared with 21%). Employees (91%) were more likely than the self-employed to have a workplace pension. However, around two-thirds (65%) of self-employed pension holders had a workplace pension, presumably from a period of previous employment. (Figure 2.7).
There was no change in the proportion of pension holders with a workplace pension between 2024 and 2020 to 2021 (85%). However, the proportion of pension holders with a personal pension fell slightly, from 31% to 27%. (Table 2.17_trend and 2.18_trend).
Defined contribution and defined benefit pensions
Defined contribution (DC) pensions were much more common than Defined Benefit (DB) pensions. 72% of people aged 40 to 75 with a private pension had a DC pension, compared with 42% who had a DB pension. Consistent with the shift away from DB pensions, younger people were less likely than older people to have a DB pension. Only 27% of pension holders aged 40 to 44 had a DB pension, compared with 56% of 70 to 75 year olds. Conversely, 80% of pension holders aged 40 to 44 had a DC pension, compared with 59% of 70 to 75 year olds. Overall, the proportion of 40 to 75 year olds with a DC or DB pension is comparable to 2020/2021 (72% and 44% respectively, Table 2.19_trend and 2.20_trend, Table 2.19 and 2.20 and Figure 2.8).
Figure 2.8 Proportion of pension holders with a DB or DC pension, by age
| Age | DC pension % | DB pension % |
|---|---|---|
| 40 to 44 | 80% | 27% |
| 45 to 49 | 79% | 30% |
| 50 to 54 | 78% | 40% |
| 55 to 59 | 73% | 43% |
| 60 to 64 | 71% | 47% |
| 65 to 69 | 61% | 52% |
| 70 to 75 | 59% | 56% |
Source: Planning and Preparing for Later Life Survey 2024
Base: Adults 40 to 75 with a pension (DC pension = 3,039, DB pension= 2,987)
Figure 2.9 shows the mix of different types of pensions held by people. Around 1 in 5 people (19%) had a mix of DC and DB pensions. Relatively few people (8%) held multiple DB pensions. It was more common (26%) for people to hold multiple DC pensions. The mix of pensions held by people in 2024 looked very similar to the mix 90% of pensions held in 2020 to 2021, although there was an increase (from 23%) in the proportion with multiple DC pensions. (Table 2.21 and 2.21_trend)
Figure 2.9 Mix of private pensions held
| Pensions | Percentage |
|---|---|
| 1x DC pension only | 30% |
| 1x DB pension only | 18% |
| Multiple DC pensions (no DB) | 26% |
| Multiple DB pensions (no DC) | 8% |
| Mix of DB and DC pensions | 19% |
Source: Planning and Preparing for Later Life Survey 2024
Base: Adults 40 to 75 with a pension (n=2,862)
Current status of private pension
Fewer than half of people aged 40 to 75 with a pension and who had not yet retired (46%) were actively saving into a pension. The proportion of people actively saving varied by age and was highest (60%) among those aged 50 to 54. Employees were more likely to be saving (63%) than the self-employed (21%) or those not in work (4%). (Table 2.22).
Two-thirds (67%) of people aged 55 and over had accessed their pension. The proportion who had accessed their pension increased sharply between the age of 55 and 64. Only 33% of 55 to 59 year olds had accessed a pension, compared with 62% of 60 to 64 year olds. Chapter 6 looks in more detail at when and how people decide to access their pensions. (Table 2.23).
Pension size
The size of Defined Contribution (DC) pension pots varied considerably. Around 3 in ten people (31%) who had not yet accessed their pension had total pension savings of £100,000 or more. However, around 2 in ten (21%) had total pension savings of £10,000 or less. Larger pensions were more common among older age groups and, perhaps not surprisingly, among people with higher incomes. People with an income of £53,000 or more a year were almost 3 times as likely to have total pension savings of £100,000 or more than people with an income of less than £12,500 a year (61% compared with 21%). Men (40%) were more likely than women (21%) to have total pension savings of £100,000 or more. This is likely related to differences in employment (including higher part-time working among women) and income by gender, as described elsewhere in this chapter. (Table 2.24).
Most people (74%) who had not yet accessed their pension expected an income of less than £10,000 a year from their DB pension. (Table 2.25).
Figures presented here regarding the total value of people’s pension pots, or the income generated from DB pensions, are estimates only. Pension holders gave a banded estimate for the pot size/estimated income from each pension held. These estimates have been summed together using the mid-point of the relevant band to produce an overall estimate. Only 32% of pension holders consulted pension statements when providing figures. The figures provide an indication of what people perceive their pension holdings to be and which groups are likely to have more/less generous pensions. More precise estimates on actual pension size are available from other sources (see, for example, the Wealth and Assets survey).
Economic and personal circumstances
The next section of this chapter looks in more detail at different aspects of the economic and personal circumstances of people aged 40 to 75. This provides an insight into the experiences of people who have already retired as well as highlighting factors which might influence people’s planning for and decisions around retirement, including decisions around working in later life.
The findings highlight how many of these characteristics are interconnected, with, for example, a strong association between income and financial literacy or gender and income. These overlaps should be borne in mind when considering the findings presented throughout this report. It is not possible, from the findings presented here, to determine which, if any, of these characteristics specifically is driving the attitudes and behaviour reported on.
Economic circumstances
People who were semi- or fully retired tended to have lower incomes than people who had not yet retired. 34% of people who had semi-retired and 32% of people who had fully retired had an income of less than £12,500 a year, compared with 20% of people aged 40 to 75 who had not yet retired. Chapter 5 discusses income adequacy in retirement in more detail. (Table 2.26 and Figure 2.10).
Figure 2.10 Income, by retirement status
| Status | Under £12,500 % | £12,500 to under £32,500 % | £32,500 to under £53,000 % | £53,000+ % |
|---|---|---|---|---|
| Not retired | 20% | 39% | 25% | 16% |
| Semi-retired | 34% | 37% | 19% | 10% |
| Fully retired | 32% | 50% | 14% | 3% |
Source: Planning and Preparing for Later Life Survey 2024
Base: All adults 40-75 (n=3,720)
Women were around twice as likely as men to have an income of less than £12,500 (32% compared with 16%). As discussed below and in Chapter 5, women were more likely to expect to be financially dependent on a partner in retirement than men. Focusing on individual income rather than household income or wealth may not fully reflect people’s overall economic circumstances or the resources they can utilise when planning for retirement.
Nevertheless, given the focus of this report is on how individuals, rather than households, plan for retirement, findings are most commonly discussed in terms of individual income. A further breakdown of results by household income is provided in selected accompanying tables.
The majority of 40 to 75 year olds were owner occupiers, either buying with a mortgage (30%) or owning their property outright (44%). The proportion of people who owned their own home was strongly associated with age. Nearly 8 in ten 70 to 75 year olds (79%) owned their own home outright, compared with around one in ten (11%) of 40 to 44 year olds. Although most people who were fully retired owned their own home outright (80%), not all retirees had the financial security afforded by home ownership. 6% of people who were fully retired were still paying a mortgage, while 14% were renting, either from a private landlord or social housing. (Table 2.27 and Figure 2.11).
Figure 2.11 Tenure, by age
| Age | Rent-free % | Social rent % | Private rent % | Buying with mortgage (inc. shared ownership) % | Own outright % |
|---|---|---|---|---|---|
| 40 to 44 | 2% | 9% | 28% | 50% | 11% |
| 45 to 49 | 0% | 19% | 15% | 50% | 16% |
| 50 to 54 | 1% | 15% | 8% | 46% | 30% |
| 55 to 59 | 1% | 17% | 9% | 30% | 43% |
| 60 to 64 | 2% | 16% | 6% | 15% | 61% |
| 65 to 69 | 1% | 10% | 5% | 8% | 76% |
| 70 to 75 | 1% | 11% | 6% | 3% | 79% |
Source: Planning and Preparing for Later Life Survey 2024
Base: All adults 40-75 (n=3,885)
Whether or not people have savings, in addition to or instead of any private pension provision, is likely to be important when it comes to how people fund their retirement and their expected standard of living in retirement (see Chapter 5). Overall, nearly 4 in ten (38%) 40 to 75 year olds had no savings, while a further 2 in ten (20%) had savings of under £15,000[footnote 2]. There was considerable variation in the level of savings people had. Older people were more likely than younger people to have savings. However, 24% of 65 to 69 year olds and 21% of 70 to 75 year olds had no savings. People who were renting – and thus did not have access to housing wealth – were less likely to have savings. 78% of social renters and 66% of private renters reported having no savings, compared with 17% of people who owned their home outright. Some of this difference may be explained by the fact that both savings and home ownership increase with age. However, it points to the potential financial vulnerability of renters. (Table 2.28 and Figure 2.12).
Figure 2.12 Total savings, by tenure
| Savings | Own outright % | Buying with mortgage (inc. shared ownership) % | Private rent % | Social rent % |
|---|---|---|---|---|
| No savings | 17% | 39% | 66% | 78% |
| <£15,000 | 16% | 27% | 23% | 16% |
| £15,000-£59,999 | 23% | 19% | 5% | 5% |
| £60,000-£99,999 | 14% | 4% | 1% | 1% |
| £100,000 or more | 31% | 10% | 5% | 0% |
Source: Planning and Preparing for Later Life Survey 2024
Base: All adults 40 to 75 (n=3,600)
Note: Savings exclusive of any private pension provision
Health, caring and dependants
Around half (49%) of 40 to 75 year olds reported having financial dependants. Around a third (36%) had children who were financially dependent on them, and just over 1 in 5 (22%) had a spouse or partner that was dependent on them. Men were more likely than women to have a spouse or partner as a financial dependent (36% compared with 8%). People under the age of 50 were especially likely to have children who were financially dependent on them. Chapter 5 looks in more detail at how reliant people expect to be on their partner’s income in retirement. (Table 2.29).
It was relatively uncommon for people who were semi- or fully retired to have a family member who was fully financially dependent on them. However, 7% of people who were semi-retired and 4% of people who were fully retired had at least one other person who was fully dependent on them. (Table 2.30).
Around a third of people (34%) aged 40 to 75 said they provided unpaid care to friends or family members, a small decrease since 2020 to 2021 (37%). Women (38%) were more likely to provide unpaid care than men (29%). Semi-retired people were more likely to be providing unpaid care (42%) compared with people who were not yet or fully retired (both 33%). It is not, however, possible to determine, whether both semi-retirement and caring are related to age or whether caring responsibilities influenced people’s decision to become semi-retired. People on lower incomes were more likely to be providing unpaid care, with 39% of people with an income of less than £12,500 doing so compared with 27% of those with an income of £53,000 or more. Again, it is not possible to determine the nature, if any, of a causal link between unpaid care and income from these findings. (Table 2.31).
People’s health status may affect their capacity to work and, therefore, their financial situation, as they approach retirement. Just over a quarter (28%) of people aged 40 to 75 reported having a long-term limiting health condition. The proportion with a health condition increased with age, with around a third (35%) of those aged 65 and over reporting a long-term limiting health condition. Women (33%) were more likely than men (23%) to report a health condition. People not in paid work (58%) were more likely than the self-employed (23%) or employees (19%) to report a health condition. Consistent with this association between employment and health, people on lower incomes were also more likely to report having a long-term limiting health condition. (Table 2.32).
Financial literacy
How well informed and knowledgeable people are about pensions and other financial matters is likely to be an important factor in how people approach planning for retirement. Chapters 3 and 4 look in more detail at people’s specific knowledge about pensions, including the State Pension. This section looks at people’s overall level of financial literacy, that is, their familiarity with financial concepts such as earning interest on savings.
A financial literacy score was calculated based on people’s answers to 3 financial questions. These questions were the same as those used in the Financial Conduct Authority’s Financial Lives survey, which assess understanding of basic financial concepts: calculating interest on savings, the effect of compound interest, and the impact of inflation on purchasing power of savings. Nearly half (48%) of people aged 40 to 75 got all 3 questions correct and were classed as having high financial literacy. This is higher than for the population as a whole (42% according to the 2022 Financial Lives survey). A quarter (25%) got none or only one of the questions correct and were classed as having low financial literacy. Levels of financial literacy varied considerably, with the following groups more likely to have high financial literacy. (Table 2.33 and Figure 2.13):
- Financial literacy was highest in the 55 to 59 and 60 to 64 age groups (55% of whom had high financial literacy). This is the group most likely to be faced with decisions around how to take their pension. Related to this, financial literacy was highest among the semi-retired, 65% of whom had high financial literacy.
- Men (58%) were more likely than women (39%) to have high financial literacy.
- People who were self-employed (56%) or employed (49%) were more likely to have high financial literacy than those not working (and not yet fully retired) (35%).
- Higher incomes were strongly associated with higher financial literacy. Most people with an income of £53,000 or more (82%) had high financial literacy, compared with 38% of people with an income of less than £12,500.
Figure 2.13 Financial literacy, by income
| Literacy | Under £12,500 % | £12,500 to under £32,500 % | £32,500 to under £53,000 % | £53,000+ % |
|---|---|---|---|---|
| Low financial literacy | 34% | 27% | 18% | 5% |
| Medium financial literacy | 28% | 31% | 25% | 14% |
| High financial literacy | 38% | 42% | 57% | 82% |
Source: Planning and Preparing for Later Life Survey 2024
Base: All adults 40 to 75 (n=3,830)
When considering how attitudes and behaviour around planning for retirement vary between subgroups, it is important to bear in mind the associations between financial literacy, income, and other socio-demographic characteristics as described in this chapter. Based on the descriptive findings presented in this report it is not possible to determine which of these factors, if any, is the cause of any differences observed. The findings can point to associations only.
Preparedness for retirement: A typology
Planning and preparing for retirement is complex. How and when people plan for retirement, and their resulting expectations for and experiences of retirement will be influenced by many factors. To take account of how these different factors may combine to explain people’s level of preparedness for retirement, Partitioning Around Medoids (PAM) Clustering was used to divide the population into distinct groups or segments. This technique helps identify groups of people that are as similar as possible within each group and as different as possible between different groups, based on their responses to selected questions. Different models with different numbers of segments were tested. The final model was chosen based on statistical measures of how well the model fit the data and the interpretability of the resulting segments (see Technical Annex for more information).
Segments were defined using the following characteristics:
- current financial resources: Income, tenure, savings
- level of engagement with retirement planning: When they started saving for retirement, whether they reviewed value of pension in last 12 months, and whether they know the income they will need in retirement
- pensions knowledge: Self-assessed pensions knowledge, confidence in making pensions decisions, and objective financial literacy
- expectations for retirement: Confidence in being able to afford their desired lifestyle, whether they expect expenditure in retirement to go up/down, and reliance on State Pension/private pension as a source of income
The resulting segmentation can be used to identify those groups which may need additional support to successfully prepare for retirement, their relative prevalence in the population and the demographic profile of these groups.
Five distinct groups of people aged 40 to 75 were identified based on their level of preparedness for retirement:
- Unprepared and financially vulnerable (16%): This group had few financial resources at their disposal. They were likely to be renting, to have an income of less than £12,500 a year, and to have little or no savings. They expected to be heavily reliant on the State Pension in retirement and were generally not confident that they would be able to obtain the standard of living they wanted. Most had not yet started saving for retirement, and a high proportion had not thought about their income needs or expenditure in retirement.
- Informed but insecure (24%): Many of this group had started planning for retirement in their 20s to 40s. They had thought about their income and expenditure needs and had medium to high levels of financial literacy. However, this group was not confident in their ability to make decisions about pensions, and many rated their own pensions knowledge as patchy or basic. They were not particularly confident that they could achieve the standard of living they wanted in retirement and expected their expenditure to go up in retirement. This group was not renting, but many had no savings, and they were likely to have an income of less than £32,500 a year.
- Equipped but unengaged (27%): This group was moderately financially secure. They were not renting and mostly had incomes between £12,500 and £53,000 a year. Some, though not all, had reasonable levels of savings. They were relatively confident they could achieve the standard of living they wanted in retirement. They expected to be able to use a private pension as well as the State Pension to fund their retirement. Many had started saving for retirement in their 20s or 30s, and most rated their knowledge of pensions as at least reasonable. However, this group was not actively engaged in pensions planning and were unlikely to have reviewed the value of their private pension in the last year.
- Financially stable and planning (20%): This group was similar to the “Equipped but unengaged” group in many ways. They were also moderately financially secure and relatively well prepared for retirement. They expected to be able to use a private pension as well as the State Pension to fund their retirement. The key difference was that unlike the “Equipped but Unengaged” this group was actively engaged in pensions planning, and most had reviewed the value of their private pension in the last year.
- Secure and confident (14%): This group was generally confident that they would be able to achieve the lifestyle they wanted in retirement. They were more likely to expect to fund their retirement through a private pension rather than the State Pension. Most were financially literate and rated their knowledge of pensions as good. Their confidence was underpinned by high levels of financial security. They were very unlikely to be renting, most had incomes of at least £32,500 a year, and high levels of savings. This group were also actively engaged in pensions planning, and most had reviewed the value of their private pension in the last year.
The different segments have different demographic profiles:
Age group
- The “Secure and confident” group tended to be older than average, with only 29% of this group being under 55 (compared with 60% of the “Unprepared and financially vulnerable” group). This suggests that low levels of preparedness may be related to age and subject to change. However, 4 in ten (40%) of the “Unprepared and financially vulnerable” group were aged 55 or over, and 1 in 7 (14%) was aged 65 or over. (Table 2.02_segment).
Sex
- The “Secure and confident” group had a higher proportion of men (73%) than women (27%). Conversely the “Informed but insecure” group was predominantly women (65%). (Table 2.03_segment).
Retirement status
- Most of the “Unprepared and financially vulnerable” group (84%) had not yet retired, again suggesting that their situation may improve before they reach retirement age. However, 10% of this group had already fully retired. Comparing the “Equipped but unengaged” and “Financially stable and planning” groups, a higher proportion of the former were already fully retired (33% compared with 16%), which may explain their lower levels of engagement. However, around half (56%) of the “unengaged” group had not yet retired. (Table 2.04_segment).
Employment status
- Rates of self-employment were highest among the “Secure and Confident” group (11%) and the “Informed but insecure” group (10%). A high proportion of people in the “Unprepared and financially vulnerable” group were not yet retired but also not in paid work (49%). (Table 2.05_segment). Private pension ownership
- Only 22% of people in the “Unprepared and financially vulnerable” group had a private pension, as did 56% of the “Informed but insecure” group. At least 90% of people in the other 3 groups had a private pension. This included the “Equipped but unengaged” group, 90% of whom had a private pension. (Table 2.06_segment). Health
- 54% of people in the “Unprepared and financially vulnerable” group had a long-term limiting health condition. The incidence of long-term limiting illness was also relatively high among the “informed but vulnerable group” (36%). In contrast, only 13% of the Secure and Confident” group had a long-term limiting illness.
3. Expectations for retirement
- Around two-thirds (65%) of people below State Pension age said the amount of State Pension they receive would be very important or important in their decision on when to retire.
- 52% of people below State Pension age said they had ever checked their State Pension age while 41% had ever checked what the amount of State Pension they might receive is. These proportions increased with age.
- One in ten people below Spa were able to identify the full rate of the new State Pension amount to the nearest pound (although not all people in this age group would be entitled to this amount). However, a further 35% were within 10% of the actual figure. People were far more likely to underestimate (71%) than to overestimate (19%) the amount.
- The median ideal retirement age for 40 to 75 year olds who had not yet retired was 60. However, the median expected retirement age was 66, with 72% of people who had not yet retired expecting to retire later than their ideal age.
- 44% of people expected to retire before their State Pension age. Working beyond State Pension age was more common among the self-employed, people without a Private Pension, people on low incomes and renters.
This chapter looks at people’s expectations around, and knowledge of, the State Pension and whether people expect to retire before or after State Pension age. It looks at how important a factor the State Pension is likely to be in people’s decisions around when to retire. In light of recent changes to the State Pension, it also considers how aware people are of their State Pension age, the current State Pension amount and how the new State Pension introduced in 2016 works. The chapter presents findings on the age at which people expect to retire, how this compares to when they would ideally like to retire, and which groups of people are more/less likely to retire before they reach State Pension age. The chapter ends by looking at whether and why people opt to return to the workforce after retiring.
Expectations around and knowledge of the State Pension
As discussed further in Chapter 5, many people expect to use the State Pension as a source of income in retirement. Some groups in particular (people on low income, social renters, people without a private pension) expected to be reliant on the State Pension for the majority of their retirement income. This section looks in more detail at how the State Pension factors into people’s thinking around when they will retire and whether people are fully informed about their State Pension entitlement.
The importance of the State Pension
Nearly two-thirds of all people below State Pension age (65%) said that the amount of State Pension they receive would be very important or important in their decision on when to retire, with 40% saying it would be very important. (Table 3.01).
Some groups were more likely to say that the State Pension amount would be very important in their decision on when to retire than others. These are generally the same groups who expect to be most reliant on the State Pension as a source of income (see Chapter 5). Women were more likely than men to say the State Pension amount was very important (44% compared with 36%). People with lower incomes were more likely than those with higher incomes to say the State Pension amount was very important. People with an income of £12,500 or less (42%) were twice as likely to say it was very important than those with incomes of £53,000 or more (20%). (Figure 3.1).
Figure 3.1 How important amount of State Pension received will be on decision on when to retire, by income
| Income | Very important % | Important % | Moderately important % | Somewhat important % | Not important at all % |
|---|---|---|---|---|---|
| Income: Under £12,500 | 42% | 22% | 14% | 5% | 16% |
| Income: £12,500 to under £32,500 | 50% | 24% | 11% | 6% | 9% |
| Income: £32,500 to under £53,000 | 37% | 28% | 18% | 8% | 9% |
| Income: £53,000+ | 20% | 26% | 24% | 14% | 15% |
Source: Planning and Preparing for Later Life 2024
Base: All adults below State Pension age (40 to 65) (n = 2,566)
Younger people were also more likely to say that the State Pension would be important in their decision to retire. 69% of people aged 40 to 44 felt the State Pension amount was an important or very important factor in retiring, while only 61% of those aged 60 to 64 felt the same.
Self-rated knowledge of the State Pension
Before being asked about specific aspects of the State Pension (their State Pension age for example), people were asked to rate their knowledge of the State Pension overall. A majority of people aged 40 to 75 (58%) said they had at least a reasonable knowledge of the State Pension, with 38% saying they had a reasonable, basic knowledge and 20% saying they had a good knowledge. However, nearly a quarter of people (23%) said their knowledge was very patchy and almost 1 in 5 (18%) said they had little or no knowledge. There has been a small increase in the proportion of people rating their State Pensions knowledge as good since 2020/2021 (from 17% to 20% in 2024). (Table 3.02, 3.02_trend).
As was found to be the case when asking about any aspect of the State Pension, the closer people got to their State Pension age the better informed they were. Over 3 quarters of people above the State Pension age (77%) said they had good or reasonable knowledge, while only around half of people below the State Pension age (53%) said the same.
People’s rating of their own knowledge was reasonable. It was consistently the case that people with higher rated self-knowledge knew more about the State Pension. For example, 78% of those who said they had a good knowledge of the State Pension accurately identified their SPa compared with 32% of those who said they had little or no knowledge (see Table 3.06 and discussion below). Nevertheless, as is discussed in the section on the new State Pension below, there is also some evidence that people tended to overestimate their knowledge.
Knowledge of State Pension age
Around half of people (52%) below State Pension age (SPa) said they had ever checked their SPa. This was similar to the proportion in 2020 to 2021 (51%). The likelihood of having checked their SPa increased as people grew closer to their SPa. Over 3 quarters of people aged 60 to 64 (75%) had checked compared with only 35% of those aged 40 to 44. (Table 3.03 and 3.03_trend, Figure 3.2).
Figure 3.2 Whether checked State Pension age or amount, by age
| Age | Checked SPa % | Checked SP amount % |
|---|---|---|
| 40 to 44 | 35% | 22% |
| 45 to 49 | 42% | 24% |
| 50 to 54 | 45% | 37% |
| 55 to 59 | 58% | 51% |
| 60 to 64 | 75% | 64% |
| 65 | 94% | 84% |
Source: Planning and Preparing for Later Life 2024
Base: All adults below State Pension age (40-65) (Minimum n = 2,571)
Most people who had checked their SPa (86%) used the Gov.uk website to check it. The majority said they found the information either very easy (49%) or fairly easy (47%) to find. Older age groups were more likely to say they found it easy to access information, with, for example, 54% of people aged 55 to 59 saying it was very easy compared with 42% of people aged 50 to 54. This may be because older age groups are better informed and have received guidance from other sources, for example their employer or pension provider, on preparing for retirement. (Table 3.04 and 3.05).
Figure 3.3 Whether correctly identified State Pension age, by whether or not checked SPa
| Checked or not | Accurately identified SPa % | Overestimated SPa % | Underestimated SPa % |
|---|---|---|---|
| Checked SPa | 70% | 11% | 18% |
| Didn’t check SPa | 33% | 21% | 46% |
Source: Planning and Preparing for Later Life 2024
Base: All adults below State Pension age (40 to 65) (n = 2,545)
Everyone below SPa, including those who had not checked their SPa, was asked at what age they thought they would be able to start receiving their State Pension based on current UK State Pension arrangements. Around half (53%) got their SPa correct in years while a further 16% overestimated their SPa. However, around 3 in ten (31%) of people gave an SPa that was too low and risk being caught out by expecting to be able to rely on their State Pension earlier than will be the case in practice. Understandably, people that had previously checked their SPa were much more likely to accurately identify their SPa (70%) than those who had not checked (33%). (Table 3.06, Figure 3.3).
The proportion of people who accurately identified their SPa also varied by actual SPa. Generally speaking, people with an earlier SPa (and who were, therefore, themselves closer to SPa) were more likely to get their SPa correct. Nearly everyone with an SPa of 66 (83%) accurately identified this compared with only 23% of those with an SPa of 68. (Figure 3.4).
The proportion of people accurately identifying their SPa was similar in 2024 (53%) and 2020 to 2021 (56%). However, the proportion underestimating their SPa increased (from 20% to 31%). This is most likely explained by a higher proportion of the sample in 2024 having an actual SPa of 68 (25% of respondents in 2024 compared with 6% in 2020 to 2021). This youngest cohort was the group that were most likely to underestimate their SPa. This was the case for 57% of 40 to 44 year olds in 2024 for example. (Table 3.06_Trend).
Figure 3.4 Whether correctly identified State Pension age, by actual State Pension age
| Age | Accurately identified SPa % | Overestimated SPa % | Underestimated SPa % |
|---|---|---|---|
| 66 | 83% | 13% | 4% |
| 66 to 67 | 66% | 15% | 19% |
| 67 | 63% | 15% | 23% |
| 67 to 68 | 28% | 14% | 58% |
| 68 | 23% | 20% | 57% |
Source: Planning and Preparing for Later Life 2024
Base: All adults below State Pension age (40 to 65) (n = 2,545)
Knowledge of likely State Pension amount
People were less likely to have checked what their State Pension amount might be than what their State Pension age would be. Despite most people saying that the amount of the State Pension would be an important factor in when they retired (see above), fewer than half (41%) of people below SPa had ever checked the amount of State Pension they might receive. As with checking SPa, people closer to SPa were more likely to have checked what their State Pension amount might be. Only 22% of 40 to 44 year olds had checked, compared with 64% of 60 to 64 year olds. The proportion who had checked what their State Pension amount might be had not significantly changed since 2020 to 2021 (41% in 2024, 40% in 2020 to 2021). (Table 3.07, 3.07_trend).
As with checking SPa, the most common information source used by people who had checked what their State Pension amount might be was the Gov.uk website (90%). The majority of people found the State Pension forecast service very easy (43%) or fairly easy (50%) to understand. (Table 3.08 and 3.09).
To evaluate people’s knowledge of the State Pension amount, people below SPa were asked how much they thought a single person claiming the full rate of the new State Pension per week (£221.20 in 2024 to 25) would receive. The median estimate people gave was slightly below the actual figure at £200 per week while the mean (£222.40) was very close to the true figure. The closer people got to SPa the more accurate their estimates. The median estimate among people aged 40 to 44 was £190 per week compared with an estimate of £220 per week among 60 to 64 year olds. (Table 3.10).
One in ten people below SPa were able to accurately identify the current full rate of the new State Pension to the nearest pound. However, a further 35% were within 10% of the actual figure. People were far more likely to underestimate (71%) than to overestimate (19%) the amount. (Table 3.11).
A far higher proportion of people got the full rate of the new State Pension correct (or within 10%) in 2024 (45%) compared with 2020 to 2021 (25%). This may, in part, be down to the wording of the question – and the specificity of the scenario being asked about – having been refined in 2024. It may also be that some people, answering online, looked up the figure. (Table 3.11_Trend).
Knowledge of new State Pension
Since 2016 the basis for calculating the amount of State Pension someone will receive has changed. For people with a National Insurance record from before 6 April 2016, a Starting Amount calculation is made. If an individual’s Starting Amount is below the full rate of the new State Pension, they can add to it through qualifying years built up after 6 April 2016. The Starting Amount an individual has depends on many factors including the number and type of National Insurance qualifying years they have before 6 April 2016. This may include whether they had built up any additional State Pension, or if they had been contracted-out into an occupational or private pension. Table 3.1 shows how people responded to a series of True/False questions about the new State Pension. This question set was only asked to those under State Pension age.
Table 3.1 Proportion answering questions about the new State Pension
| Question | Correct | Incorrect | Don’t know | N |
|---|---|---|---|---|
| The new State Pension amount someone will receive can vary and depends on their National Insurance record. | 73% | 2% | 25% | 2,575 |
| You can build up national insurance qualifying years while you are self-employed | 79% | 1% | 20% | 2,014 |
| You can only build up national insurance qualifying years while you are in paid employment[footnote 3] 55% | 28% | 16% | 2,014 | |
| There is no minimum number of qualifying years required before you receive something under the new state pension[footnote 4] | 46% | 17% | 37% | 2,014 |
| You need at least 35 qualifying years to receive the maximum amount under the new state pension[footnote 5] | 67% | 7% | 27% | 2,014 |
Base: Adults below Spa (40-65). Q1 was asked to all people below SPa. Q2-5 were asked only to those that responded ‘True’ Q1. See accompanying tables 3.12 to 3.16.
Around a quarter (27%) of people below SPa did not know that the new State Pension amounts people receive can vary and depend on their National Insurance records.
A significant majority of people (73%) believed that the new State Pension amount received by an individual can vary depending on National Insurance record (25% responded that they did not know and 2% thought that the statement was incorrect) and 79% believe that National Insurance qualifying years can be built up when self-employed (20% don’t know, 1% false). Both of these statements are true for the new State Pension and Pre-2016 State Pension system[footnote 6].
Around two-thirds (67%) thought that at least 35 qualifying years were needed to receive the maximum amount (the full rate) of the new State Pension. This statement is only true for the new State Pension for people who started their National Insurance record from 6 April 2016 onwards. For people with a National Insurance record from before 6 April 2016, transitional arrangements apply[footnote 7].
There was a high level of uncertainty across the items asked with between 16% and 37% responding don’t know to each item. Respondents were most likely to be unsure about whether there was a minimum number of qualifying years to receive something under the new State Pension[footnote 8] and least likely to say that did not know that national insurance records can only be built up whist in paid employment.
There were some differences across age bands. 34% of 40 to 44 year olds responded that they did not know if the new State Pension amount someone will receive can vary and depends on their National Insurance record compared with 20% of 60 to 64 year olds.
Expected retirement age
A key decision in people’s thinking about, and planning for, retirement is the age at which they retire from paid work. Some people may be forced to retire earlier than they would ideally like, for example as a result of ill health, while others may have to work longer than they would ideally like through financial necessity. One risk around retirement planning is if people leave the labour market too early and then find themselves with insufficient resources to fund the whole of their retirement. The remainder of this chapter looks in more detail at people’s expectations around the age of retirement.
When do people expect to retire?
The median age at which people aged 40 to 75 who had not yet fully retired expected to retire was 66. Around 2 in 5 (41%) of people expected to retire aged 65 or younger. However, only 3% of people expected to retire before the age of 60 and 1% aged 55 or younger. Just under 1 in 5 (18%) expected to never retire. As the analysis only includes people who had not yet fully retired – and people from older cohorts who retired earlier are therefore excluded - the average expected age of retirement naturally increases with age. The median expected retirement age of those aged 55 and under (very few of whom had already retired) was 65. This compares with an actual average age at which people left the labour market of 65.3 years for men and 64.5 years for women. (ONS, 2024).The median age at which people expected to retire has not changed since 2020/2021. (Table 3.17, 3.18, and 3.18_trend, Figure 3.5).
Figure 3.5 Expected and ideal age of retirement
| Age | Expected age % | Ideal age % |
|---|---|---|
| Under 50 | 0% | 1% |
| 50-55 | 1% | 16% |
| 56-59 | 2% | 4% |
| 60-65 | 38% | 58% |
| 66-69 | 25% | 5% |
| 70-74 | 12% | 5% |
| 75-79 | 3% | 2% |
| 80 or above | 1% | 1% |
| Never | 18% | 8% |
Source: Planning and Preparing for Later Life 2024
Base: Adults 40 to 75 not yet fully retired (Minimum n = 2,302)
However, 3 in ten people who had not yet fully retired (30%) said they now expected to retire later than they had 5 years ago. 17% expected to retire between one and 5 years later and 13% expected to retire more than 5 years later. The main reasons for this were finance related. Nearly two-thirds (64%) mentioned changes in the cost of living. Just over a third mentioned change in pension arrangements (34%) or change in other financial circumstances (38%). (Table 3.19 and 3.20).
How does this compare to when they would ideally like to retire?
On average, the age at which people who had not yet fully retired ideally wanted to retire was lower than the age at which they expected to retire. The median ideal age of retirement was 60 compared with the median expected retirement age of 66. To get a fuller sense of how many, and what types of people, expected to retire later (or in some cases earlier) than their ideal age we can compare responses to these 2 questions given by the same individual. (Table 3.21 and 3.22).
Figure 3.6 Ideal retirement age compared to planned/actual retirement age
| Retirement plan | Not yet fully retired % | Fully retired % |
|---|---|---|
| Retired/plans to retire at ideal age | 23% | 26% |
| Retired/plans to retire earlier than ideal age | 5% | 24% |
| Retired/plans to retire later than ideal age | 72% | 50% |
Source: Planning and Preparing for Later Life 2024
Base: Adults aged 40 to 75 (Minimum n = 1,544)
Most people (72%) who had not yet retired gave an expected retirement age higher than their ideal retirement age. Only 5% expected to retire earlier than their ideal age. (Figure 3.6).
Younger people were more likely than older people to expect to retire later than their ideal retirement age. This was the case for 78% of 40 to 44 year olds compared with 52% of 65 to 69 year olds for example. This suggests that many of the older people left in the workforce may be there through choice rather than necessity. Current employees (77%) were more likely to expect to retire after their ideal age compared with self-employed people (62%), who generally had a later ideal retirement age, and people not currently in paid work (54%). (Table 3.23).
Overall, more people were expecting to retire later than their ideal age in 2024 (72%) than was the case in 2020/2021 (64%). This may be related to the fact that there was an increase (from 7% in 2020 to 2021 to 17% in 2024) in the proportion of people who said they never expected to retire. This change may, however, be a result of a change in the way the data was collected. In 2020 to 2021 the survey was conducted via telephone and people were asked the age at which they expected to retire, meaning that any “never” response would have been spontaneous. In 2024 the survey was conducted online and the “never” option would have been immediately visible to respondents. (Table 3.23_trend and 3.17_trend).
A higher proportion of people who had not yet retired expected to retire later than their ideal age compared with the experience of people already retired. Half of all fully retired people (50%) retired later than their ideal age compared with 72% who now expected to do so. However, nearly a quarter (24%) said they retired earlier than their ideal age, considerably higher than the 5% of people not yet retired who expected to retire earlier than their ideal age. (Table 3.24).
Who expects to be working for longer?
This section looks in more detail at the age at which people aged 40 to 75 who had not yet fully retired expected to retire. It considers the proportion of people who said they expected to retire before/after 2 key milestones: the age of 55, that is when people are eligible to access their private pension, and their own SPa (between 66 and 68 depending on date of birth). It also looks at how a range of different demographic and employment related factors are associated with people expecting to retire before or after their SPa.
Hardly anyone expected to retire at or below the age of 55 (1%). However, just over 2 in 5 (43%) expected to retire after the age of 55 but before they reached SPa. Around 1 in 5 (18%) expected to retire at their SPa while the remainder (38%) expected to retire after their SPa. (Table 3.25).
Type of job
People’s expectations for their retirement age varied depending on the type of job they were doing.
- Employees (48%) were more likely than the self-employed (31%) or those not working (35%) to expect to retire after 55 but below SPa. This may be related to the fact that employees were more likely than the other groups to have access to a private pension (see Chapter 2, Table 2.14). (Figure 3.7).
- People who said their current job was very physically active were more likely to say that they would retire after SPa (46%) than people whose job was less physically active (33% of people who said they job was not active at all said they expected to retire after SPa). Conversely, only 34% of those whose job was very physically active expected to retire between 55 and their SPA compared with 50% of those whose job was not active at all. This pattern is likely the result of people on low incomes being more likely to do physically active jobs (see Chapter 2, Table 2.06).
Figure 3.7 Expected age of retirement relative to State Pension age, by employment status
| Employment status | Below State Pension age % | State Pension age % | Over State Pension age % |
|---|---|---|---|
| Employee | 48% | 19% | 33% |
| Self-employed | 31% | 12% | 57% |
| Not working | 35% | 19% | 45% |
Source: Planning and Preparing for Later Life 2024
Base: Adults 40 to 75 not yet fully retired (n = 2,283)
Financial situation
People’s expectations around retirement age were closely associated with their financial situation. Overall, those with less financial security, whether this be through their current income, savings (including private pension), or housing situation, expected to retire later than those who were more financially secure.
- Half of all people (50%) not yet fully retired who did not have a private pension expected to retire after their SPa, compared with 33% of those with a private pension. (Figure 3.8).
- People with a lower current income were more likely to expect to retire later than those on higher incomes. Three in 5 people (60%) with a current income of £53,000 or more expected to retire between 55 and their SPa compared with around 2 in 5 (38%) of people with a current income of less than £12,500. Conversely, 40% of people with an income less than £12,500 expected to retire after their SPa compared with 25% of people with an income of £53,000 or more.
- Similarly, people without substantial savings were more likely to expect to retire after SPa. 43% of people with no savings expected to retire after their SPa compared with 31% of people with savings of £100,000 or more. Conversely, 53% of people with savings of £100,000 or more expected to retire between 55 and their SPa compared with 37% of people with no savings.
- People who were renting rather than owned their own home were more likely to expect to retire after their SPa. This was the case for 50% of private renters and 39% of social renters compared with 33% of people buying with a mortgage and 37% of people who owned their home outright. (Figure 3.9).
Figure 3.8 Expected age of retirement relative to State Pension age, by whether have private pension
| Private pension status | Below State Pension age % | State Pension age % | Over State Pension age % |
|---|---|---|---|
| Does not have private pension | 38% | 12% | 50% |
| Has private pension | 47% | 20% | 33% |
Source: Planning and Preparing for Later Life 2024
Base: Adults 40 to 75 not yet fully retired (n = 2,283)
Figure 3.9 Expected age of retirement relative to State Pension age, by tenure
| Tenure | Below State Pension age % | State Pension age % | Over State Pension age % |
|---|---|---|---|
| Own outright | 44% | 20% | 37% |
| Buying with mortgage | 51% | 16% | 33% |
| Private rent | 38% | 12% | 50% |
| Social rent | 34% | 27% | 39% |
Source: Planning and Preparing for Later Life 2024 Base: Adults 40 to 75 not yet fully retired (n = 2,283)
Personal circumstances
People’s personal circumstances, for example their health or whether they have caring responsibilities could potentially affect their expectations of retirement age. This might be the case if those circumstances make it harder to continue working or, conversely, if they result in lower income or savings and therefore necessitate having to continue working longer. In fact, at least among people who had not yet fully retired, there were few differences observed in the proportions of people expecting to retire either before or after SPa by personal circumstances. People whose personal circumstances led to them retiring early are by their nature not included in these comparisons which look at the expected retirement age of people not yet retired.
- A similar proportion of not yet retired carers (40%) and non-carers (36%) expected to retire after SPa.
- Likewise, a similar proportion of people not yet retired with and without a long term limiting health condition expected to retire after SPa (40% and 37% respectively).
- Self-reported health, however, was associated with expected retirement age. The better people’s health the more likely they were to expect to retire after 55 but below SPa. This was the case for 53% of people rating their health as very good but only 38% of people who rated their health as only fair, bad or very bad. This may be explained by the association between health and income (see Chapter 2 Table 2.32 and Table 2.43).
Figure 3.10 Reasons for returning to paid work after fully retiring
| Reason | Percentage |
|---|---|
| For financial reasons | 60% |
| For something to do | 50% |
| To keep active | 49% |
| Other family circumstances changed | 5% |
| Because your health improved | 4% |
| Because your partner died or your relationship broke down | 3% |
| Other reason | 9% |
Source: Planning and Preparing for Later Life Survey 2024
Base: Adults 40 to 75 who have returned to paid work after retirement (n = 196)
Note: Respondents could select more than one category so figures may sum to more than 100%
A small minority of adults aged 50 and over (5%) said they had returned to work after being fully retired. The most common reasons given for returning to work was financial reasons (60%). People also mentioned wanting something to do (50%) or returning to work to keep themselves active (49%). The overall proportion of people saying they had returned to work after retirement was the same in 2020 to 2021 (5%) and 2024. However, it was much more common for people in 2024 to say they had returned to work for financial reasons than in 2020 to 2021 (40%). This may be the result of rising inflation and increased cost of living pressures in the period since 2020 to 2021. (Table 3.26, 3.27, 3.26_trend and 3.27_trend, Figure 3.10).
4. Planning for retirement
- People were most likely to say they started saving for their retirement in their 20s or 30s with 59% having done so. People started actively planning for their retirement at a later age. 45% of people who were semi-retired and 40% of people who were fully retired started planning in their 50s, with only 22% of semi-retired people (21% fully retired) starting earlier.
- 52% of 40 to 75 year olds had used at least one source of information to help them plan for retirement in the last 12 months. 33% had used less formal information sources such as family and friends or their employer whereas only 16% had used a regulated source of advice or guidance (either an independent financial advisor or Pension Wise).
- How confident people felt making decisions about pensions varied. The mean confidence score on a 0 to 10 scale was 5.1. Nearly half (48%) of 40 to 75 year olds rated their confidence between 6 and 10 on the scale but 13% rated their confidence as 0. People with high financial literacy, who had used regulated advice or guidance in the last 12 months and with a private pension felt more confident making decisions about pensions.
- Engagement with private pensions was limited. Most DC pension holders aged 40 to 75 (79%) recalled having received a simple annual benefit statement. However, only 46% of all private pension holders aged 40 to 75 said they had reviewed the value of their private pension in the last 12 months while 25% had reviewed the investment strategy of their pension.
- 24% of private pension holders aged 40 to 75 said they found it fairly or very difficult to keep track of their pension. The government is developing a pensions dashboard to help people keep track of their pension(s). Most people aged 40 to 75 said they would be very (50%) or fairly likely (31%) to use a pensions dashboard.
This chapter looks at how proactive people are in planning for their retirement, including how actively engaged they are in managing their private pension. It presents findings on the age at which people start saving and planning for retirement, the circumstances people consider when planning for retirement and what topics they would like more information on. It looks in detail at the types of information sources people use to help them plan for retirement, focusing in particular on the use of regulated sources of information and guidance including professional financial advisors and Pension Wise. It also presents findings on whether people have reviewed their pension provision and the life events that might have prompted them to do so. It explores how easy or difficult people find it to keep track of their pensions and their attitudes towards a possible pensions dashboard and consolidating small pension pots. Finally, the chapter looks at whether people recall receiving information from their pension provider and how helpful they found this information. In doing so the chapter highlights areas where DWP could focus its policy development to help to promote engagement in pensions and retirement planning.
How and when people start planning
When do people start planning?
Most people said they started saving for their retirement in their 20s (36%) or 30s (23%). However, nearly a quarter (23%) of people aged 40 to 44 said they had not yet started saving, as did nearly 3 in ten (29%) of people aged 45 to 49. (Table 4.01 and Figure 4.1)
People with lower incomes were less likely to have started saving in their 20s than people with higher incomes; 66% of people earning £53,000 a year or more had started saving in their 20s compared with 22% of people earning less than £12,500 a year. Differences in income may also be a factor in explaining why women (32%) were less likely than men (42%) to have started saving in their 20s, with men typically earning more than women (ONS 2024, see also Chapter 2, Table 2.26).
People who owned their own home (either outright or with a mortgage) were more likely to have started saving than renters. A high proportion of private renters (34%) and social renters (43%) had not yet started saving for retirement. This probably reflects, at least in part, the fact that renting is more common among younger age groups. However, it may also be because renters are less likely to have disposable income to put into a pension or other retirement savings. It may also be the case that for some people they view the purchase of their property as a way of saving for retirement leading to a higher proportion of homeowners classing themselves as having started saving for retirement.
A smaller proportion of employees (11%) had not yet started saving for retirement compared with the self-employed (24%), most likely because of access to (and auto-enrolment in) a workplace pension.
Figure 4.1 What age started saving and planning for retirement
| Age | Started saving for retirement % | Started actively planning for retirement % |
|---|---|---|
| 20s | 36% | 5% |
| 30s | 23% | 6% |
| 40s | 14% | 17% |
| 50s | 5% | 23% |
| 60s | 2% | 10% |
| 70s | 0% | 0% |
| Not yet | 18% | 37% |
Source: Planning and Preparing for Later Life 2024
Base: Adults 40 to 75 (n=4,012 & 4,020)
Between 2020 to 2021 and 2024 there was a reduction of people saying they have started saving in their 20s from 43% in 2020 to 2021 to 36% in 2024. (Table 4.01_Trend)
People generally started actively planning for their retirement much later than they started saving. Fewer than half of people under the age of 50 (42% of 40 to 44 year olds and 34% of 45 to 49 year olds) had actively started planning for their retirement. People who were semi- retired (45%) or fully retired (40%) were most likely to have started planning for retirement in their 50s. People whose current income was under £12,500 were almost twice as likely as those with incomes of £53,000 or more to have not yet started planning for retirement (45% compared with 25%). (Table 4.02 and Figure 4.1).
What do people consider when planning?
When asked what circumstances they had considered when planning for retirement, financial considerations were the most common factor that people mentioned. Nearly 4 in 5 (79%) of people 40 to 75 who had not yet fully retired mentioned their financial situation as something they had considered, along with almost half (48%) who had considered their own or their partner’s pension arrangements.
Figure 4.2 Circumstances considered when planning for retirement, by retirement status
| Retirement status | Not yet retired % | Semi or fully retired % |
|---|---|---|
| Financial situation | 79% | 75% |
| Own or family’s health | 59% | 40% |
| Employment situation | 50% | 29% |
| Own or partner’s pension arrangements | 48% | 52% |
| Plans in retirement | 43% | 43% |
Source: Planning and Preparing for Later Life 2024
Base: All adults 40-75 not yet fully retired and semi or fully retired (not retired=2,007 semi or fully retired: 2,028)
Note: Respondents could select more than one category so figures may sum to more than 100%
People had also considered other factors in planning for their retirement. Among people aged 40 to 75 who had not yet retired, 59% mentioned that they had considered their or their family’s health and 50% had considered their employment situation. Around a quarter (27%) had considered caring responsibilities (Table 4.03 and Figure 4.2).
People with higher incomes were generally more likely than those on lower incomes to have considered a range of different factors when planning for retirement. Perhaps not surprisingly, given they have more finances/resources to think about, people with higher incomes were more likely to mention financial situation or pension arrangements. However, they were also more likely to mention other factors such as their own or family members’ health. This was mentioned by 68% of people with an income of £53,000 or more who had not yet retired compared with 52% of people with an income of less than £12,500. This serves to underline that people with higher incomes were more likely to have started planning and preparing for retirement than people with lower incomes.
People who had already semi- or fully retired had considered similar things when planning for retirement. Again, financial considerations were at the forefront with 75% of this group mentioning financial situation and 52% pension arrangements as things they had considered when planning for retirement. People who were semi-retired, and for whom their employment situation will be more pertinent currently, were more likely than people who had fully retired to say they had considered their employment situation in planning for retirement (39% compared with 24%). (Table 4.04).
When asked what topics they would like more information on to help them plan for retirement, people most frequently mentioned the State Pension (56%), what benefits they might be entitled to (43%) and wanting to understand how much they will need in retirement (42%). Younger age groups were more likely to want information on a range of topics than older age groups. For example, 65% of people aged 40 to 44 said they would like more information on the State Pension compared with 53% of 60 to 64 year olds. Similarly, 55% of 40 to 44 year olds wanted more information on how much they would need in retirement compared with 38% of 60 to 64 year olds. People on higher incomes were more likely than those on lower incomes to want information on how much they would need in retirement (57% of people with an income of £53,000 or more compared with 30% of people with an income of less than £12,500). (Table 4.05).
Advice, guidance, and information sources used to plan for retirement
Individuals can use a variety of different information sources to help them when planning for retirement. This includes, but is not limited to, several free services introduced by the government since the introduction of Pension Freedoms in 2015. Awareness of these was mixed. The majority of people (62%) aged 40 to 75 had heard of the Check your State Pension Forecast service. Overall awareness of Pension Wise was relatively low (30%) but more people in the 55 to 64 age bracket (41%) had heard of it. Very few people had heard of Money Helper (9%), Retirement
Living Standards published by the Pensions and Lifetime Savings Association (PLSA)[footnote 9] (2%) or a Midlife MOT (1%). (Table 4.06 and Figure 4.3).
Figure 4.3: Which sources of information heard of
| Source | Percentage |
|---|---|
| Check your State Pension Forecast/Check Your State Pension… | 62% |
| Pension Wise | 30% |
| Money Helper | 9% |
| The Retirement Living Standards | 2% |
| Midlife MOT | 1% |
Source: Planning and Preparing for Later Life 2024
Base: All adults 40 to 75 (n=4,034)
Note: Respondents could select more than one category so figures may sum to more than 100%
The most commonly used sources of information were their pension provider (used by 28% of 40 to 75 year olds in the last 12 months) and a Government website such as Gov.UK or Check your State Pension (27%). Just over one in ten (13%) of people had used a professional financial advisor in the last 12 months. Consistent with people’s lack of awareness of them, use of other services was low with 4% having used Pension Wise, 1% accessing Money Helper and 1% having used a Midlife MOT in the last 12 months. (Table 4.07 and Figure 4.4). It should be borne in mind that not all services are offered to all age groups with, for example, Pension Wise is only available to people aged 50 and over. Findings on the use of Pension Wise specifically among the target age group are discussed in more detail below.
Figure 4.4: Sources of information used
| Source | Yes, within the last 12 months % | Yes, but not within the last 12 months % |
|---|---|---|
| Government website | 27% | 24% |
| Pension provider | 28% | 20% |
| Employer | 13% | 17% |
| Professional financial advisor | 14% | 13% |
| Internet guidance sources | 17% | 8% |
| Friends and family | 12% | 12% |
| Pension Wise | 4% | 9% |
| Money Helper | 1% | 4% |
| Community organisations | 3% | 1% |
| PLSA Retirement living… | 1% | 1% |
| A Midlife MOT | 1% | 1% |
Source: Planning and Preparing for Later Life 2024
Base: All adults 40-75 (n=3,995)
Note: Respondents could select more than one category so figures may sum to more than 100%
In total, just over half (52%) of 40 to 75 year olds had used at least one source of information to help them plan for retirement in the last 12 months. Fewer than half of people (44%) had used a formal information source such as Pension Wise, their pension provider or a government website in the last 12 months. A third of people (33%) had used other, less formal information sources such as family/friends or their employer. (Tables 4.08 to 4.10 and Figure 4.5)[footnote 10].
Figure 4.5: Whether has used information source
| Source | Percentage |
|---|---|
| Used any information source in past 12 months | 52% |
| Used formal information source in past 12 months | 44% |
| Used informal information source in past 12 months | 40% |
| Used regulated advice and guidance in past 12 months | 16% |
Source: Planning and Preparing for Later Life 2024
Base: All adults 40 to 75 (n=3,980)
Use of most sources of information remained stable between 2020/2021 and 2024. However, there was a significant increase in the proportion of people saying they had ever used a government website (from 38% to 52%) and a similar increase in the proportion of people saying they had used information from their pension provider (from 37% to 48%). (Table 4.07_Trend).
People who had not yet fully retired were also asked about which information sources, if any, they planned to use in the future. The pattern was similar to that described regarding information sources already used. Just over three-fifths of people (63%) said they planned to use a government website and 50% said they planned to consult their pension provider. Fewer than 1 in 5 (18%) said they planned to use Pension Wise. Planned use of other services, including Money Helper (11%), Retirement Living Standards (8%), a Midlife MOT (7%) also remained low. (Table 4.11).
Use of regulated advice and guidance, including Pension Wise
There is particular interest in how prevalent the use of regulated advice and guidance – that is use of a professional financial advisor or Pension Wise – is. Use of such information sources can be particularly useful in helping people to navigate the complex decisions around planning for retirement. Only 16% of 40 to 75 year olds had used either of these sources in the last 12 months. (Table 4.12). 14% had used a financial advisor while 4% had used Pension Wise (see Table 4.07).
- Use was more prevalent, though still relatively low, among people of an age to access their private pension and the target age group for Pension Wise (which is aimed at those 50+). 23% of 55 to 59 year olds and 25% of 60 to 64 year olds had used regulated advice or guidance in the last 12 months.
- People who were semi-retired (26%) were the most likely to have used regulated advice or guidance in the last 12 months, followed by people who were fully retired (18%) and people not yet retired (14%).
- 21% of people with high financial literacy had used regulated advice or guidance in the last 12 months compared with 9% of people with low financial literacy.
- 30% of people with an income of £53,000 or more had used regulated advice or guidance compared with 10% of people with an income of less than £12,500.
- 19% of people with a private pension had used regulated advice or guidance in the last 12 months compared with 7% of people without a private pension. Use was higher among people who had accessed a Defined Contribution (DC) pension (26%).
Pension Wise is primarily targeted at those aged 55 to 65 and with a DC pension they need to decide how to access. Around a quarter (26%) of people in this category had ever used Pension Wise. Use had increased from 20% in 2020 to 2021 among the same demographic. (Table 4.13, 4.13_trend and Figure 4.6).
Figure 4.6: Use of Pension Wise by age
| Age | Yes, but not within the last 12 months % | Yes, within the last 12 months % |
|---|---|---|
| 55 to 59 | 15% | 9% |
| 60 to 64 | 19% | 8% |
| 65 to 69 | 22% | 13% |
Source: Planning and Preparing for Later Life 2024
Base: All adults 50 to 75 (n=725)
The primary reasons people gave for using Pension Wise were that it is a free service (65%), convenient (46%), and a trustworthy source (44%). Satisfaction with Pension Wise was high, with 73% of users satisfied and only 3% dissatisfied. (Table 4.14 and 4.15 and Figure 4.7).
People aged 50 and over who had not used Pension Wise and did not plan to use it in the future were asked the reasons for this. Over half of this group (56%) cited lack of awareness of the service as the reason. People aged 50 to 54 were the most likely to give this as a reason (74%). (Table 4.16).
Figure 4.7: Why chose to use Pension Wise
| Reason | Percentage |
|---|---|
| Free to use | 65% |
| Convenient | 46% |
| Trustworthy source | 44% |
| Recommended by pension provider | 35% |
| Saw an advert for it | 23% |
| Recommended by employer | 12% |
| Recommended by friends/family | 10% |
Source: Planning and Preparing for Later Life 2024
Base: Adults 55 to 65 with a DC Pension (n=199)
Note: Respondents could select more than one category so figures may sum to more than 100%
Confidence in managing private pensions
A key area of retirement planning for people is around private pensions: how to keep track of and manage them and, following the Pension Freedoms introduced since 2015, when and how to access them. How people decide to access their private pension is discussed in Chapter 6. The remainder of this chapter focuses on whether and how people engage with the topic of private pensions when planning for retirement, starting with how knowledgeable about – and trusting of – private pensions people are.
Knowledge of pensions
Many people aged 40 to 75 thought they had at least a reasonable knowledge of pensions with 38% saying they had a reasonable knowledge and 18% saying they had a good knowledge. However, the same proportion (18%) said they knew little or nothing about pensions and 25% said their knowledge of pensions was very patchy. The proportion of people saying they knew little or nothing about pensions was higher in 2024 compared with 2020 to 2021 (18% compared with 14%). (Table 4.17 and 4.17_Trend).
Older people were more likely to rate their knowledge as good, with 26% of 65 to 69 year olds doing so compared with just 12% of 40 to 44 year olds. Self-rated knowledge was also positively associated with financial literacy. Just 7% of those with low financial literacy rated their pension knowledge as good, compared with 27% with high financial literacy. More men than women felt they had good knowledge of pensions (25% vs.12%). This is consistent with women, on average, having lower financial literacy than men (see Chapter 2, Table 2.33 and Figure 4.8).
Figure 4.8: How knowledgeable feel about pensions by financial literacy score
| Knowledge level | Low financial literacy % | Medium financial literacy % | High financial literacy % |
|---|---|---|---|
| Good knowledge of pensions | 7% | 14% | 27% |
| Reasonable, basic knowledge of pensions | 32% | 36% | 43% |
| Knowledge of pensions is very patchy | 29% | 31% | 21% |
| Knows little or nothing about pensions | 33% | 19% | 9% |
Source: Planning and Preparing for Later Life 2024
Base: All adults 40 to 75 (n=4,029)
People with a private pension rated their knowledge more highly than people without a pension. Two-thirds (66%) of people with a private pension rated their knowledge of pensions as at least reasonable but 9% said they knew little or nothing about pensions.
Pensions as a tool to save for retirement
Nearly half of adults 40 to 75 who had not yet fully retired (47%) agreed that a private pension was the most secure way to save for retirement. Only a small proportion disagreed but there was a large group (42%) who were ambivalent and neither agreed nor disagreed. Employees (53%) were more likely than the self-employed (34%) to agree that private pensions were the most secure way to save for retirement. Employees were more likely than self-employed people to be enrolled in a pension, with auto-enrolment in a workplace pension making this an easily accessible option (see Chapter 2, Table 2.16).
People with a private pension were more likely to agree they were the most secure way to save for retirement than people without a private pension. However, only just over half (55%) of private pension holders agreed with the statement while 39% said they neither agreed nor disagreed. (Table 4.18 and Figure 4.9).
Figure 4.9: Whether agree that private pensions are the most secure way of saving for your retirement, by whether has a private pension
| Private pension or not | Strongly Agree % | Agree % | Neither agree nor disagree % | Disagree % | Strongly Disagree % |
|---|---|---|---|---|---|
| Has private pension | 18% | 37% | 39% | 5% | 1% |
| Does not have private pension | 6% | 21% | 51% | 13% | 10% |
Source: Planning and Preparing for Later Life 2024
Base: Adults 40 to 75 not yet fully retired (n=2,479)
Confidence in making decisions about pensions
People differed in how confident they felt making decisions about pensions. Rating their confidence on a 0 to 10 scale where 0 = “not at all confident” and 10 = “extremely confident”, the mean score among 40 to 75 year olds was 5.1. Nearly half (48%) of people rated their confidence between 6 and 10 on the scale but 13% rated their confidence as 0. The following groups felt more confident making decisions about pensions (Table 4.19):
- people who were semi-retired (mean score= 6.1) or retired (6.4), and had presumably more actively engaged with the topic, felt more confident than people who had not yet retired (4.5)
- men (Mean score=5.6) felt more confident than women (4.6), consistent with their tendency to rate their knowledge of pensions higher
- people with high financial literacy (mean score=5.8) felt more confident than those with low financial literacy (4.0)
- people who had used regulated advice or guidance (Pension Wise or a professional financial advisor) in the last 12 months (mean score= 6.5) felt more confident than those who had not (4.8). Similarly, people who had used any formal source of information (including regulated advice or guidance but also other sources including pension providers and government websites) in the last 12 months (mean 6) felt more confident than those who had not (4.4)
- unsurprisingly, people with a private pension (mean 5.6) felt more confident making decisions about pensions than people without a private pension (3.5)
Keeping track of pensions
Some people said they found it difficult to keep track of their private pension(s). While most people 40 to 75 with a private pension said it was very (29%) or fairly easy (47%), 24% said it was fairly or very difficult. Younger people were more likely than older people to say they found it difficult to keep track and people who had not yet retired (32%) found it more difficult than people who had semi-retired (10%) or fully retired (9%). Employees (31%) were more likely than the self-employed (21%) to say they found it difficult to keep track, perhaps because many employees build up multiple workplace pensions as they go through their working life (DWP, 2024). (Table 4.20)
When asked why they found it difficult keeping track of pensions, 65% mentioned that they found information about pensions confusing and nearly half (45%) said it was because information was kept in different places (Table 4.21 and Figure 4.10).
Figure 4.10: Why find it difficult to keep track of pension savings
| Reason | Percentage |
|---|---|
| I find information about pensions confusing | 65% |
| The information is kept in different places | 45% |
| The information is presented in different formats | 29% |
| It takes a lot of time to keep track of my pension savings | 26% |
| Find it difficult to access information electronically | 2% |
Source: Planning and Preparing for Later Life 2024
Base: Adults who find it difficult to keep track of pensions (n=636)
Note: Respondents could select more than one category so figures may sum to more than 100%
Pensions dashboards
A pensions dashboard is one potential solution the government are developing to the problem some people face with keeping track of their pension(s). When launched, pensions dashboards will allow people to access all of their pensions’ information in one place, securely and online. Most people aged 40 to 75 said they would be very (50%) or fairly likely (31%) to use a pensions dashboard. People with a private pension were more likely (86%) than those without a pension (69%) to say they were very or fairly likely to use a pensions dashboard. (Table 4.22).
People who said they knew little or nothing about pensions (69%) were the least likely to say they would use a dashboard while people with high financial literacy (59%) were more likely than those with low financial literacy (41%) to say they would be very likely to use the dashboard. This is perhaps because people with low knowledge or financial literacy were less likely to have a private pension (see Chapter 2, Table 2.16 and Figure 4.11).
Figure 4.11: How likely to use pension dashboard by financial literacy score
| Literacy | Very likely % | Fairly likely % | Not very likely % | Not at all likely % |
|---|---|---|---|---|
| Low financial literacy | 41% | 32% | 14% | 13% |
| Medium financial literacy | 50% | 33% | 8% | 9% |
| High financial literacy | 59% | 28% | 8% | 6% |
Source: Planning and Preparing for Later Life 2024
Base: All adults 40-75 (n=4,035)
Pension Tracing Service
The Pension Tracing Service is a free UK telephone service operated by DWP which can help individuals to find the contact details of pension schemes so that these individuals can search for their lost pension pots. Only 3% of people aged 40 to 75 with a private pension had used this service in the last 12 months. A Find pension contact details self-service, available via the GOV.UK website, provides an equivalent online function for individuals to use. While PPLL only asked about the Pension Tracing Service, it is possible that more people may have used this online self-service. (Table 4.23).
Consolidating small pension pots
Another option which might help people keep track of their pension savings more easily would be to consolidate multiple pensions into a single pot. Only a quarter (25%) of private pension holders aged 40 to 75 said they had merged their pension pots, with 9% having moved all their pensions into a new scheme and 16% having merged one or more pensions into an existing pot. The main reason people gave for consolidating their pension, mentioned by 76% of those who had consolidated, was because it was easier to manage and keep track of a single pot of savings. (Table 4.24 and 4.25 and Figure 4.12). For more on people’s attitudes towards consolidating their pension savings see Willingness to pay for pension products and services.
Figure 4.12: Why chose to combine pension pots
| Reason | Percentage |
|---|---|
| It is easier to manage and keep track of asingle pot of savings | 76% |
| Better investment performance | 30% |
| Lower scheme charges | 23% |
| A recommendation from an independent financial advisor | 21% |
| The quality of the service offered | 14% |
| To access to a better range of retirement products | 10% |
| Was offered a payment/incentive to movea pension | 2% |
Source: Planning and Preparing for Later Life 2024
Base: Adults who have consolidated pension (n=833)
Note: Respondents could select more than one category so figures may sum to more than 100%
Engagement with private pensions
This section looks in more detail at how actively people engage with any private pensions they may hold, for example through reviewing the value of their pension. Although pension participation has increased in recent years thanks to automatic enrolment, people’s level of engagement with their private pension remains low (DWP, 2024). This lack of engagement may mean that people are left with insufficient provision to fund their retirement or make poor decisions.
Significant life events can be a prompt to people reviewing or changing their pension provision (DWP, 2024). Reaching or approaching the age at which they could access their private pension (13%) and reaching or approaching State Pension age (12%) were the most commonly mentioned events that prompted people to review their pension provision. However, consistent with generally low levels of engagement with pensions, 53% of people said that none of the events listed had prompted them to review their pension. (Table 4.26).
46% of pension holders aged 40 to 75 said they had reviewed the value of their private pension in the last 12 months while a smaller proportion (25%) had reviewed the investment strategy of their pension. The older people got, and the closer to retirement and the age at which they could access their pension, the more likely they were to have engaged with their pension. People aged 55 to 59 and 60 to 64 were the most engaged with 58% and 54% of these age groups respectively having reviewed the value of their pension Fin the last 12 months. (Table 4.27 and 4.28).
Men were more likely than women to have reviewed the value of their pension in the last 12 months. This may be due to men typically having higher value pensions and higher incomes. People with higher incomes, who may also have larger pension portfolios to manage as well as being more financially literate (see Chapter 2, Table 2.33) were also more likely to have reviewed their pension in the last 12 months. Three-quarters (75%) of people with an income of £53,000 or more had reviewed the value of their pension compared with around a third (34%) of people with an income of less than £12,500. The equivalent figures for the highest and lowest income groups reviewing their pension investment strategy were 47% and 17%.
As well as simply reviewing the value of their pension, pension holders who are currently saving into their pension also have the option of changing the level of their pension contributions. Overall, 28% of people aged 40 to 75 who were currently saving into a DC pension had increased the level of their contributions in the last 12 months This figure may include people who saw the level of their pension contributions increase because their pay increased as well as people who actively increased the percentage of their income being contributed to their pension. Only 3% had decreased the level of their contributions. People aged 50 to 54 (43%), that is those coming up to the age at which they can access their pension, were the most likely to have increased their contributions. (Table 4.29 and Figure 4.13).
Figure 4.13: Reviewed the value and investment strategy of their private pension in the last 12 months by income
| Income | Has reviewed the value of their private pension(s) % | Has reviewed the investment strategy of their private pension(s) % |
|---|---|---|
| Under £12,500 | 34% | 17% |
| £12,500 to under £32,500 | 36% | 19% |
| £32,500 to under £53,000 | 56% | 27% |
| £53,000+ | 75% | 47% |
Source: Planning and Preparing for Later Life 2024
Base: Adults 40-75 with a private pension (reviewed value=3,275, reviewed investment=3,263)
Simple annual benefit statements and retirement packs
Most DC pension holders aged 40 to 75 (79%) recalled having received a simple annual benefit statement - a short two-page summary setting out how much is currently in their pension pot and how they could increase their pot size. This figure was as high as 86% among people aged 50 to 59. This figure is higher than the percentage of people who said that they had ‘reviewed’ their pension in the last 12 months’. It may be that some people recalled receiving their simple annual benefit statement but did not engage with it or read the information in detail. (Table 4.30). As people approach 55, the age at which they can access a DC pension, they also receive other information from their pension provider to help them make informed choices. Overall, 62% of DC pension holders aged 50 and over said their pension provider had provided them with information regarding their options for taking their pension. This figure was higher among older age groups with only 40% of 50 to 54 year olds recalling being provided with this information compared with 81% of 65 to 69 year olds. (Table 4.31).
Retirement packs are another potentially useful source of information supplied by pension providers and giving people information on their retirement options. This is usually sent in the run up to a person’s expected retirement date. Pension schemes regulated by The Pensions Regulator are required to provide retirement packs 4 to 6 months before a person’s expected retirement age. Some pension providers have introduced summary retirement packs, provided every 5 years after the age of 50, a requirement for FCA regulated providers. In total, 16% of DC pension holders aged 55 and over recalled receiving a retirement pack 4 months before their expected retirement date while a further 16% recalled receiving a statement every 5 years from the age of 50. (Table 4.32).
Around 3 quarters (77%) of those who recalled receiving a retirement pack had been prompted to do something in response. The most common response (41%) was for people to review their overall pension savings while 35% researched their options independently. Nearly a quarter (24%) had contacted a regulated financial advisor and 13% had contacted Pension Wise. This is consistent with previous research which suggests that receiving retirement information prompted people to review their pensions (DWP 2024) (Table 4.33 and Figure 4.14).
Figure 4.14: Action taken after receiving retirement pack
| Action | Percentage |
|---|---|
| Reviewed my overall pension savings | 41% |
| Researched my options independently | 35% |
| Contacted a regulated financial adviser | 24% |
| Contacted Pension Wise | 13% |
| Contacted other government/consumer website(s) or service | 9% |
| Contacted own pension provider | 1% |
Source: Planning and Preparing for Later Life 2024
Base: Adults 40 to 75 who have received a retirement pack (n=438)
Note: Respondents could select more than one category so figures may sum to more than 100%
For more on people’s reactions to simple annual benefit statements and retirement packs, including whether or not people found them helpful, see Willingness to pay for pension products and services.
5. Income adequacy in retirement
- People aged 40 to 75 were less confident that they would be able to achieve the lifestyle they wanted in retirement in 2024 compared with 2020 to 2021. When asked to rate their confidence on a scale from 0 to 10 the mean confidence score in 2024 was 4.7, compared with 5.8 in 2020 to 2021.
- 41% of people aged 40 to 75 said they ’had no idea’ how much income they would need in retirement. This figure was higher among younger age groups and the less financially secure, that is those on lower incomes and renters compared with owner occupiers.
- Among people who had some idea of the income they would need in retirement, the median estimated income needed was £24,000 - below the PLSA threshold of £31,300 for a single person to live a moderate lifestyle. However, £24,000 is broadly in line with what a median earner would need to achieve their Target Replacement Rate.
- 33% of people aged 40 to 75 who had not yet fully retired from paid work and who had some idea of their income needs said they would need a higher proportion of their current income in retirement than they expected to have.
- 82% of people aged 40 who had not yet retired expected to fund their retirement at least in part via a private pension. People with a private pension were more likely than people without a private pension to also have access to other sources of income in retirement including savings and investments. Nearly half (49%) of people without a private pension expected 90 to 100% of their income in retirement to come from the State Pension.
- People varied in how reliant they expected to be on their partner’s income in retirement. On average, women rated their level of reliance on a partner (5.3 on a 0 to 10 scale) higher than men did (3.0 on a 0 to 10 scale).
- 68% of 40 to 75 year olds who had not yet retired expected to own their own home outright by the time they fully retired from paid work. Among those who did not expect to own their own home, the main reason given (by 80%) was not being able to afford it.
This chapter addresses questions around how people plan to fund their retirement and their expectations for whether they will have an adequate income in retirement. It starts by looking at people’s confidence in their ability to achieve their desired standard of living in retirement. It then proceeds to look at whether people have thought about their income in retirement and how people’s expectations compare to the Pension and Lifetime Saving Association’s (PLSA) Retirement Living Standards thresholds and their Target Replacement Rate (TRR) relative to their current income. The chapter also explores people’s expectations for their expenditure over the course of retirement and the extent to which people who have already retired are better or worse off than expected. The second part of the chapter considers how people expect to fund their retirement, focusing particularly on how reliant they expect to be on the State Pension, any private pensions, and a partner’s income. Finally, the chapter ends by looking at the impact of tenure on planning for retirement including how tenure affects both income and expenditure in retirement.
The focus of the chapter is on people’s subjective expectations around their income adequacy in retirement. For information on what proportion of people are likely to achieve an adequate income in retirement see DWP, 2023.
How confident are people about their expected standard of living in retirement?
People varied in how confident they were that they would be able to achieve the standard of living they wanted in retirement. Rating their confidence on a scale from 0 to 10, where 0 signified “not at all confident” and 10 “extremely confident”, 42% of people aged 40 to 75 rated their confidence between 0 and 4. A similar proportion (41%) were more confident than not and gave a score of between 6 and 10. A further 17% were ambivalent, giving a score of 5 (Table 5.01, Figure 5.1).
Figure 5.1 Confidence will have money to achieve lifestyle want in retirement, 2020/2021 and 2024
| Confidence | 2020 to 2021 % | 2024 % |
|---|---|---|
| 0 Not at all confident | 10% | 17% |
| 1 Highly unconfident | 2% | 3% |
| 2 Very unconfident | 4% | 6% |
| 3 Moderately unconfident | 5% | 7% |
| 4 Mildly unconfident | 6% | 8% |
| 5 Neither unconfident or confident | 15% | 17% |
| 6 Mildly confident | 10% | 8% |
| 7 Moderately confident | 15% | 13% |
| 8 very confident | 15% | 11% |
| 9 Highly confident | 6% | 4% |
| 10 Extremely confident | 12% | 6% |
Source: Planning and Preparing for Later Life 2020/2021 and 2024
Base: All adults aged 40 to 75 (2024: n = 4,031; 2020/2021: n = 2,627)
In 2024, people were less confident overall that they would be able to achieve the standard of living they wanted in retirement, compared with 2020/2021. The mean score on the 0 to 10 scale was 4.7 in 2024 compared with 5.8 in 2020 to 2021. This decline in confidence may be related to the significant increase in cost of living and rate of inflation during the past 4 years. In the report Rising Cost of Living in the UK published by the House of Commons Library, it was found that consumer prices had increased by 21% between May 2021 and May 2024. Rising interest rates and increasing private rents over the same period have also contributed to ongoing pressures on the cost of living. (Table 5.01_trend).
Looking more closely at who felt more or less confident about their living standards in retirement:
- People who were retired (mean 6.4) and semi-retired (mean 6.1) were more confident than those who had not yet retired (mean 3.9). Similarly older people were more confident than younger people. It makes sense that people who have already reached retirement and have more certainty over their current or near-term situation would be more confident than those for whom retirement is in the future. At the same time, greater confidence among older age groups may reflect intergenerational differences in wealth accumulation, with younger cohorts less well placed to accumulate wealth to provide an income for retirement because of reduced access to the housing market or Defined Benefit (DB) pensions (D’Arcy and Gardiner, 2017). In their report, it was found people who were born in the early 1980s had accumulated approximately only half of the total net wealth of people in the 1970s cohort by the same age.
- Men (mean 5.0) were more confident than women (mean 4.4). This is consistent with men, on average, having higher incomes and more consistent labour market participation than women, as well as being more likely to have a private pension.
- People with higher current incomes were more confident. The mean confidence score among people with an income of £53,000 or more per year was 5.9 compared with a score of 4 among people earning less than £12,500.
- Owner occupiers were more confident than both private and social renters. People who owned their property outright had mean confidence score of 5.9 compared with 3.2 among private renters and 2.8 among social renters. This may in part be because of the positive association between tenure and income or tenure and age. It may also be because owner occupiers are likely to have lower expenditure in retirement (see below) in the absence of housing costs.
- People with a private pension were more confident (mean 5.2) than those without (mean 3.5). Those with a DB pension were especially confident (mean 6.1). Given that older people are the most likely to hold DB pensions it is, however, not possible to be certain how much of this increased confidence can be ascribed to age and how much to having a DB pension.
- People with financial dependants who were fully dependent on them were less confident (mean 3.8) compared with people with partial or no financial dependants (mean 5.0). This may in part be because those with financial dependants tend to be younger (see Table 2.31). They may also be feeling pressure from their current commitments (e.g. childcare) which prevents them saving as much as they would like for retirement.
- People with a long-term limiting health condition (mean 3.6) were less confident than those without (mean 5.2), perhaps because of lower labour market participation and/or income among this group (see Table 2.34).
Self-assessed needs in retirement
Have people thought about the income they will need in retirement?
One concern regarding people’s financial preparedness for retirement is that people do not think about their likely needs in retirement until it is too late. Around 2 in 5 (41%) of people said they had no idea how much income they would need in retirement. Only 17% of people said they had a very good idea of the income they would need while the remaining 41% said they had some idea. (Table 5.02).
Younger people were more likely than older people to say that they had no idea how much income they would need in retirement. For instance, around 53% of those aged 40 to 44 had no idea how much income they would need, compared with 18% of those aged 65 to 69 and 12% of those aged 70 to 75. Even among those aged 55 to 59 and 60 to 64, however, around a third (33% and 31%, respectively) were unsure of their income needs in retirement (Figure 5.2).
People who were the least financially secure were the most likely to say that they did not know how much income they would need in retirement. For example, 64% of those without a private pension said they had no idea of their income needs compared to 33% of those with a private pension. Similarly, a higher proportion of people living in rented accommodation (64% in the social sector and 57% in the private sector) were uncertain about their income needs, compared to owner-occupiers (39% with a mortgage and 25% who own outright). This lack of awareness may be partly explained by the positive association between current income and financial literacy (see Chapter 2, Table 2.33). Additionally, individuals who are currently struggling financially may have less capacity to plan for the future, as their focus is on immediate concerns. Renters, in particular, may find planning more challenging as a result not only of their present situation but also because of uncertainty regarding their future living situation and expenditure.
Figure 5.2 Whether know how much income they will need in retirement, by age
| Age | I have a very good idea what level of income I will need % | I have some idea % | I do not have an idea % |
|---|---|---|---|
| 40 to 44 | 7% | 40% | 53% |
| 45 to 49 | 8% | 37% | 55% |
| 50 to 54 | 12% | 45% | 42% |
| 55 to 59 | 25% | 42% | 33% |
| 60 to 64 | 30% | 39% | 31% |
| 65 to 69 | 37% | 45% | 18% |
| 70 to 75 | 42% | 46% | 12% |
Source: Planning and Preparing for Later Life 2024
Base: All adults aged 40 to 75 not yet fully retired (n = 2,479)
How much income do people think they will need in retirement?
Even when people said they had some idea of the income they would need in retirement, they may be underestimating what that amount would be. The median income people 40 to 75, with some idea of the income they would need in retirement, said they would need was £24,000. This is less than the Pension and Lifetime Saving Association’s (PLSA) threshold for a single person (£31,700 ) to live a moderate lifestyle during their retirement (PLSA, 2025). However, £24,000 is broadly around the level a median earner would need to achieve their Target Replacement Rate (TRR) (DWP, 2023). Most people (60%) gave a figure that was between £14,501 and £31,500 per year, that is between the thresholds for a minimum (£13,400) and moderate standard of living according to the PLSA[footnote 11]. Just fewer than 1 in 5 (17%) estimated they’d need less than £14,500, a figure close to the PLSA’s minimum threshold for a single pensioner. A lower proportion (11%) said they’d need more than £43,000 per year during retirement, that is around the current PLSA threshold (£43,900) for someone to live a comfortable lifestyle in retirement. These figures relate to the income an individual would need/thinks they will need. For people living with a partner, being able to share income and expenditure may lead to a better standard of living in retirement than these figures for individual income alone might suggest. (Table 5.03).
Men were twice as likely as women (14% compared with 7%) to say they would need an income of more than £43,000 a year. Self-employed people were nearly twice as likely to say that they’d need more than £43,000 per year in retirement than those who were currently in paid employment and those who were not currently working (17%, 10% and 8%, respectively).
Generally, the lower people’s current income, the lower they expected their income needs in retirement to be. For example, 39% of people with an income currently below £12,500 said they expected to need an income in retirement of £14,500 or less. Conversely, 32% of people with a current income of £53,000 or more said they would need an income of £43,000 or more in retirement. People’s retirement income needs and expectations as a proportion of their current income are explored in more detail below.
What do people expect to happen to expenditure in retirement?
One reason why people may expect their income needs in retirement to be lower is if they also expect their expenditure to go down relative to what it was pre-retirement. In fact, people’s expectations for their expenditure over the course of retirement varied. 36% of people aged 40 to 75 who had not yet fully retired expected their expenditure to go down in retirement, 20% expected it to go up, and 23% expected it to stay about the same. Around a fifth of people (21%) said they hadn’t thought about it. As was the case when asking about income needs, the proportion of people who said they had not thought about it decreased with age. (Table 5.04).
People with an income of less than £12,500 per year (28%) were twice as likely as people with an income of £53,000 or more a year (14%) to expect their expenditure to go up in retirement.
People who currently had financial dependants (40%) were more likely to expect their expenditure to go down over the course of retirement, compared with those who had no financial dependants (31%).
People who currently own their home with a mortgage, and who may expect to pay it off before they retire, were, perhaps unsurprisingly, the most likely group to say they expected their expenditure to go down in retirement (46% compared with 34% of private renters and 19% of social renters). Renters were more likely than homeowners to have not thought about their expenditure in retirement. This may be due to the association between age and renting. It may also be due, in part, to the fact that renters face more inherent uncertainty around their financial situation.
Around two-fifths (41%) of people who had fully retired from paid work expected their expenditure to go up over of the course of retirement, compared with about a quarter (24%) of those who had semi-retired and a fifth (20%) of those who had not retired from paid work at all. The proportion of people who had already retired who expected their expenditure to go up, increased with age from 31% of people aged 60 to 64 and fully retired to 48% of retired 70 to 75 year olds. This suggests that while expenditure may initially go down in retirement (e.g. with no commuting or travel costs) there may be unforeseen expenditure as retirement continues and as people age of which people are not always aware in advance, such as health and care costs. (Table 5.05).
Expectations for income adequacy in retirement
The Target Replacement Rate (TRR) guidelines set out by the Pension Commission in 2004 suggest that people on median earnings need an income in retirement which is around 67% of their pre-retirement earnings. This proportion is higher (up to 80%) for those with lower earnings pre-retirement and lower (50%) for those with high earnings pre-retirement. This section looks at the expectations people who had not yet fully retired hold with regard to the proportion of current income they will need in retirement, the proportion they think they will actually achieve and how these vary. The estimated TRR for people in each income band is taken from Analysis of future pension incomes, a DWP report which uprates the income bands used in the original Pension Commission report to 2021 levels.
Income needs as a proportion of current income
People were asked whether they expected to need more, less or about the same as their current income in retirement. Those who anticipated needing less than their current income were then asked to select the proportion of their current income they expected to need. Most people (58%) said they would need three-quarters or more of their current income in retirement. This included 37% of people who expected their income needs to be the same as currently in retirement and 10% who expected to need more than their current income. Around 1 in 5 people (22%) expected to need half or less of their current income in retirement. (Table 5.06).
In 2024, people estimated their income needs to be slightly higher than in 2020 to 2021. The proportion saying they would need three-quarters or more of their income increased from 50% in 2020/2021 to 58% in 2024. Conversely, the proportion saying they would need half or less of their current income decreased from 28% to 22%. (Table 5.06_Trend).
As expected, people’s estimates of the proportion of their current income they would need in retirement varied based on the level of their current income. The 2004 Pension Commission recommended that those with lower earnings need to achieve a higher replacement rate to maintain their living standards. Most people gave a figure which was close to or above the TRR recommended for their income bracket. For example, 80% of 40 to 75 year olds who had not yet retired and who had an income of less than £12,500 (for whom the TRR is estimated at 80%) said they would need an income three-quarters or more of their current income in retirement. Similarly, 75% of people with an income of between £12,500 and £31,500 (for whom the TRR Is estimated at around 70%) said they would need an income three-quarters or more of their current income in retirement. Only around a quarter (27%) of people earning £53,000 or more (for whom the TRR is 50-60%) said they would need three-quarters or more of their current income. However, 79% said they would need an income which was half or more of their current income.
Nevertheless, there was a minority of people in each age group who appeared to be underestimating their likely income needs. One in 5 people (20%) with an income of £53,000 or more, for example, said they expected to need an income less than half their current income. Just over one in ten (13%) of people with an income of less than £12,500 said they expected to need less than three-quarters of their current income. It is possible that people may be planning to fund their retirement from assets and are not including the money these would generate as income. However, it is also possible that people may simply be underestimating what their needs in retirement will be. Furthermore, while most people estimated their income needs at around or above the TRR, a far smaller proportion expected their actual income in retirement to match this level.
Figure 5.3 Self-assessed income needs in retirement, by current income
| Current income | 75% or more | 67% | </= 50% | Not thought about it |
|---|---|---|---|---|
| < £12,500 | 80% | 6% | 7% | 7% |
| £12,500 - £32,500 | 75% | 8% | 10% | 7% |
| £32,500-£53,000 | 46% | 21% | 29% | 3% |
| £53,000+ | 27% | 23% | 48% | 1% |
Source: Planning and Preparing for Later Life 2024
Base: Adults aged 40 to 75 not yet fully retired who have some idea of income needed in retirement (n = 1,601)
Expected income as a proportion of current income
Estimates of expected retirement income were generally lower than estimates of the income people thought they would need. While 58% of people aged 40 to 75 who had not yet fully retired believed they would need three-quarters or more of their current income in retirement, only 30% expected to achieve this level of income. Conversely, while only 22% anticipated needing half or less of their current income, 39% expected their retirement income to be this low. Expectations for retirement income in 2024 were similar to 2020/2021. The biggest difference was that a smaller proportion in 2024 (18%) compared with 2020/2021 (26%) said they had not thought about it. (Table 5.07 and 5.07_trend).
To better understand the mismatch between people’s needs and expectations in retirement, it is useful to compare responses to questions about their income needs and expectations for the same individuals. Table 5.08 shows the proportion of people who rated their income needs higher than their expected income. As previously noted, a significant number of people had not considered their income needs in retirement (see Table 5.02). The figures reported are for 40 to 75 year olds who had not yet retired but have some idea of the income they will need in retirement.
A third (33%) of people who had not yet fully retired from paid work and had some idea of income needs said they’d need a higher proportion of their current income in retirement than they expected to have. The proportion who rated their needs higher than their expectations income varied across different groups. For example, people with current incomes under £12,500 (42%), women (38%) and older age groups, particularly those aged 65 to 75 (45%) were more likely to report income needs higher than their expected income. (Table 5.08).
Experiences of income adequacy in retirement
As well as looking at the expected TRR of people who had not yet retired, it is also possible to look at the proportion of pre-retirement income those who had already retired had achieved.
A majority of people (65%) who had fully retired from paid work reported that they had a current income which was less than their pre-retirement income. This included 22% who reported an income around half their pre-retirement income and the same proportion who had an income of less than half their pre-retirement income. This is similar to 2020/2021 when 46% reported a retirement income half or less that of their pre-retirement income compared with 44% in 2024. (Table 5.09 and 5.09_trend).
The 44% of fully retired people who reported a retirement income of less than half their pre-retirement income is similar to the 39% of people not yet retired who expected a retirement income half or less of their current income (see Table 5.07).
Are people better or worse off in retirement than they expected?
Most people aged 40 to 75 who had fully retired from paid work said that how they were doing financially in retirement was about the same as expected (58%). Around a quarter of people (26%) said they were worse off than expected. The remaining 16% said they were better off than expected. Younger people aged 50 to 54 were more likely to report being better off than expected than all other age groups (people aged 55 to 75). Perhaps not surprisingly those with lower incomes in retirement were more likely to say they were worse off than expected. Among people with a current income of £12,500 or less, 37% said they were worse off than expected whereas no one with a current income of £53,000 or more said this (see Table 5.10).
Amongst those people who said they were worse off in retirement, by far the most common reason given was that living costs were higher than expected (85%). This is perhaps not surprising given rising prices for essential items such as food, utilities, and rent in recent years (see, for example, Rising Cost of Living in the UK published by the House of Commons Library). It may also be that people tend to routinely underestimate what their expenditure will be in retirement. As discussed above, a far higher proportion of people who had not yet retired expected their expenditure in retirement to go down compared with the expectations of people who had already retired (see Table 5.05 and 5.06). Around a third of people (32%) said they were worse off because the amount of their State Pension was less than expected while around a quarter (23%) said their private pension was less than expected. (Table 5.11).
In contrast, for those people who said they were better off in retirement than expected, the main reasons given were their private pension (36%) or State Pension (39%) being higher than expected. These findings point to the importance of both the State Pension and private pensions as a source of income in retirement (see below) and the importance of ensuring that people have realistic expectations about how much each will provide. (Table 5.12).
How do people expect to fund their retirement?
Most people aged 40 to 75 who had not yet retired from paid work expected a pension to provide at least part of their retirement income. Nearly all (96%) expected the State Pension to be a source of income in retirement. Just over 6 in ten (63%) people expected at least some income to come from an occupational pension and 5 in ten (51%) expected income from a personal pension. Overall, in 2024 82% expected to receive income from a private pension, be it occupational or personal. (Table 5.13 and 5.13_trend).
The most commonly mentioned source of retirement income besides pensions was savings or investments, mentioned by 56% of people. Just under half of people (45%) expected to rely on financial support from a partner or family. Inheritance was mentioned as a source of income by 29% of people, while 24% mentioned releasing equity from their property or downsizing and 13% mentioned income from renting out property.
Some people expected to have access to multiple sources of income. For example, people with a private pension were more likely than people without a pension to expect to have income from savings or investments (62% compared with 42%), inheritance (34% compared with 15%) or money from releasing equity from their property or downsizing (27% versus 18%). Conversely, among those with savings of £100,000 or more, 75% expected to use income from an occupational pension and 67% income from a personal pension. The equivalent figures for people with no savings were 55% and 45%. (Figure 5.4).
Figure 5.4 Expected sources of income in retirement, by whether has private pension
| Source of income | Private pension % | No private pension % |
|---|---|---|
| State Pension | 97% | 93% |
| Occupational pension | 74% | 32% |
| Savings or investments | 62% | 42% |
| Personal pension | 60% | 24% |
| Financial support from partner/family | 47% | 42% |
| Inheritance | 34% | 15% |
| Equity release/downsizing | 27% | 18% |
| Pensioner benefits | 22% | 44% |
| Renting/sale of property | 13% | 12% |
| Other | 1% | 2% |
Source: Planning and Preparing for Later Life 2024
Base: Adults aged 40 to 75 not yet retired (n = 1,987)
Note. Respondents could select more than one category so figures may sum to more than 100%
Just over a quarter of people (28%) expected to receive income from pensioner benefits such as Pension Credit or Housing Benefit. The proportion expecting to receive benefit income was higher among people without a private pension (44% compared with 22% of private pension holders) and people who did not expect to own their own home in retirement (52% compared with 14% of those who did expect to own their own home). Additionally, people with a lower current income were more likely to expect to receive benefit income (44% of those earning under £12,500 compared with 6% of those with earning £53,000 or more).
Overall, the income sources people expected to rely on were broadly similar to the income sources people who had already retired said they were using to fund their retirement. The State Pension was the most mentioned source of income by people aged 40 to 75 who were already semi or fully retired (89%). This was followed by savings and investments (66%) and an occupational pension (61%). However, only 40% of retired people said they received income from a personal pension, compared with 51% of people who expected to receive this source of income in retirement. Only 11% mentioned pensioner benefits as an actual source of income compared with 28% who expected them to be a source of income. The 11% currently receiving them may be an underestimate. Figures from DWP (2025) suggest that 29% of people of SPa were claiming their State Pension alongside some other benefits. Finally, only 10% mentioned income from equity release from their property or downsizing whereas 26% of people not yet fully retired this mentioned this as an expected source of income. (Table 5.14).
The income sources people expected to rely on in 2024 were also similar to those mentioned in 2020 to 2021. In 2020 to 2021 the State Pension (89%), followed by an occupational or personal pension (79%) were also the most mentioned expected sources of income in retirement. People were slightly less likely to mention savings and investment in 2024 (56% compared with 64% in 2020 to 2021) and slightly more likely to mention inheritance (29% compared with 22%). (Table 5.13_trend).
The next sections look in more detail at the extent to which people expect to be reliant on some key sources of income in retirement: the State Pension, a private pension and partner’s income.
Reliance on State Pension
As discussed above, nearly everyone aged 40 to 75 (96% of those not yet retired and 89% of those retired) expected at least part of their income in retirement to come from the State Pension. For most people, the State Pension was or was expected to be only one of several sources of income in retirement. Only 4% of people who identified the State Pension as a source of income in retirement said the State Pension would be their only source of income. However, 44% said 50% or more of their income would/did come from the State Pension and 15% said 90 -100% would/did come from the State Pension. (Table 5.15). Some groups of people expected to be far more reliant on the State Pension than others. People on low incomes expected to be particularly reliant on the State Pension as did people who were not in paid work. Just over a third (34%) of people with an income of less than £12,500 said 90-100% of their income in retirement would/did come from the State Pension. This was the case for two-fifths (42%) of those not retired but not currently in paid work. This is consistent with the fact that these groups were less likely to have a private pension (see Chapter 2, Table 2.14). Overall, 49% of people without a private pension said 90 to 100% of their income would/did come from the State Pension compared with only 4% of people with a private pension[footnote 12].
Younger people expected to be less reliant on the State Pension compared with older people. For example, 30% of people aged 40 to 44 said half or more of their income would come from a State Pension, compared with 45% of those aged 55 to 59 and 55% of people aged 70 to 75. It is not possible to determine the reasons for this. It may be that younger people do not believe the State Pension will be available to them as a source of support in the future. Research by the Institute for Fiscal Studies quotes polling evidence that 30% of working-age people do not believe the State Pension will exist in 30 years’ time. (Cribb et al, 2023). It may also be the case that younger people have higher expectations (which may or may not be borne out) about the extent to which they will have built up a private pension or be able to rely on other sources of income in retirement.
Chapter 3 looks in more detail at how knowledgeable people are about the State Pension and how knowledge varies depending on how reliant people expect to be on the State Pension. There is evidence that younger people are less likely to know the current amount of the State Pension and, in particular, to underestimate the amount by more than 10% (see Table 3.11).
Reliance on private pension
Most people aged 40 to 75 who held at least one private pension said that they expected this pension to make up only a part of their overall retirement income. Specifically, only 53% of people said that 50% or more of their retirement income would/did come from their private pension. Some of their remaining income will, of course, come from the State Pension (35% of those with a private pension said 50% or more of their income would/did come from the State Pension). However, these findings are also consistent with those discussed above which suggest that private pension holders expect to rely on a range of income sources in retirement (See Tables 5.13, 5.14 and 5.16)[footnote 13].
People’s expectations about the proportion of income coming from their private pension varied depending on the type of the pension(s) in question. People with a Defined Benefit (DB) pension for example expected a higher proportion of their income to come from their private pension compared with people without a private pension. 63% of DB pension holders said that 50% or more of their income would/did come from their private pension compared with 49% of people with a Defined Contribution (DC) pension only. The proportion of people expecting at least half of their income to come from their private pension also increased with the size of their DC pension pot. Around 3 in ten (32%) people with a DC pot of £10,000 or less said that 50% or more of their income would/did come from their private pension compared with over 7 in ten (74%) people with a DC pot of £100,000 or more. This expectation among those with a DC pot of £10,000 or less may be unrealistic, given the limited amount in their pension savings.
Contrary to what was found when looking at income from the State Pension, the proportion of income people with a private pension expected to come from their private pension did not vary significantly by age or retirement status.
Reliance on partner’s income
People currently living with a partner were also asked about how reliant they were/expected to be on their partner’s income (including income from their partner’s pension) in retirement. There was considerable variation in how reliant people expected to be. Some people (29%) said they were not/did not expect to be at all reliant on their partner’s income (selecting “0” on a 0 to 10 scale) but others rated their reliance at between 6 and 8 on the scale (21%) or as high as 9 or 10 (11%). The mean score on the 0 to 10 scale was 4.1. (Table 5.17)[footnote 14].
Figure 5.5a How reliant expect to be on partner’s income in retirement
| Reliance | Percentage |
|---|---|
| 0 Not at all reliant | 29% |
| 1 Highly unreliant | 3% |
| 2 Very unreliant | 5% |
| 3 Moderately unreliant | 5% |
| 4 Mildly unreliant | 5% |
| 5 Neither unreliant or reliant | 21% |
| 6 Mildly reliant | 6% |
| 7 Moderately reliant | 7% |
| 8 very reliant | 7% |
| 9 Highly reliant | 3% |
| 10 Extremely reliant | 9% |
Source: Planning and Preparing for Later Life 2024
Base: Adults aged 40 to 75 living with a partner (n = 2,780)
Figure 5.5b How reliant expect to be on partner’s income in retirement, by gender
| Reliance | Men % | Women % |
|---|---|---|
| 0 Not at all reliant | 38% | 19% |
| 1 Highly unreliant | 5% | 2% |
| 2 Very unreliant | 7% | 3% |
| 3 Moderately unreliant | 7% | 3% |
| 4 Mildly unreliant | 6% | 3% |
| 5 Neither unreliant or reliant | 19% | 23% |
| 6 Mildly reliant | 5% | 7% |
| 7 Moderately reliant | 5% | 10% |
| 8 very reliant | 3% | 12% |
| 9 Highly reliant | 1% | 4% |
| 10 Extremely reliant | 3% | 15% |
Source: Planning and Preparing for Later Life 2024
Base: Adults aged 40 to 75 living with a partner (n = 2,780)
The extent to which people expected to be reliant on their partner’s income was higher among some groups than others. Women scored higher on the scale (mean 5.3) than men (mean 3.0), consistent with findings elsewhere in the report pointing to women being less likely to have a private pension (see Chapter 2, Table 2.14). The lower the respondent’s own income the more they expected to be reliant on their partner’s income in retirement. For example, 21% of those with an income less than £12,500 a year rated their reliance on their partner’s pension as 10 on the scale, compared with just 1% of those earning £53,000 or more.
The focus of this report is primarily on how individual’s own financial situation affects planning for retirement. However, this finding highlights the fact that, for many people, their standard of living in retirement, and how they plan for retirement, will also be influenced by the circumstances of their wider household.
Housing in retirement
Owning your own home can be an important source of financial security in retirement. As discussed above, expectations for expenditure in retirement are generally lower among owner occupiers compared with renters as they do not incur housing costs (see discussion of Tables 5.04 and 5.05). Expectations also differ between those who own their homes outright and those with a mortgage, as outright owners do not have mortgage payments. Property can provide a source of income in retirement if people downsize, release equity or rent their property out (see discussion of Tables 5.13 and 5.14). This section looks in more detail at people’s expectations regarding their housing tenure in retirement and who does or does not expect to be owning their own home.
Expected tenure in retirement
The majority of people aged 40 to 75 and not yet fully retired said they expected to own their home outright (68%) when they were fully retired. Of the remainder, 9% expected to be buying their home with the help of a mortgage or loan while 22% expected to be renting, including 15% who expected to be renting social housing and 7% who expected to be renting from a private landlord. Among those people aged 40 to 75 who had not yet fully retired and currently lived in the private rented sector, 48% expected to no longer be renting from a private landlord by the time they fully retired. 37% expected to own their own property while 10% expected to be in the social rented sector. (Table 5.18).
However, the proportion of people not yet retired who expect to own their home outright in retirement is considerably lower than the proportion of people who are currently fully retired and own their home outright (80%, see Chapter 2, Table 2.27). The lower expectations of home ownership among people who had not yet retired likely reflects the continued and growing gap in the growth rate of UK housing costs and the average household income. The most recent housing affordability figures released by the Office for National Statistics (ONS), revealed the average priced home in England was £298,000, while the average income was £35,000. This equates to a ratio of 8.6 years of household income needed to purchase an average-priced home. In comparison, the ratio was just 4.4 years in 1999 and 4.7 years in 2000, showing how entering the house purchase market has become increasingly unaffordable over time (ONS, 2024). The proportion of people expecting to own their home outright in retirement decreased with age with only 64% of people aged 40 to 44 and 62% of people aged 45 to 49 expected to do so. Perhaps unsurprisingly given that the youngest person interviewed was 40 and a typical mortgage term is 25 to 30 years, only a small proportion of people who were currently renting (17% of private renters and 6% of social renters) expected to own their home outright by the time they retired. The majority of current renters (62% of private renters and 86% of social renters) expected to still be renting in retirement.
Barriers to owning own home
Cost was the most frequently cited barrier to owning a home. Most people (80%) who neither currently owned their own home nor expected to do so before they fully retired said they would not be able to afford it. In addition, 21% said that repairs would be too costly and 19% said that they did not have a secure enough job (a likely barrier to getting a mortgage). (Table 5.19).
Figure 5.6 Reasons why people do not expect to own their own home in retirement
| Reason | Percentage |
|---|---|
| It is unlikely I will be able to afford it | 80% |
| Repairs and maintenance would be too costly | 21% |
| I do not have a secure enough job | 19% |
| I like it where I am | 15% |
| I have a secured tenancy | 15% |
| I would not want to be in debt | 14% |
| I wouldn’t want that sort of commitment | 9% |
| I prefer the flexibility of renting | 9% |
| Other reason | 5% |
Source: Planning and Preparing for Later Life 2024
Base: Adults aged 40 to 75 not yet fully retired who did not expect to own their own home (n = 364)
Note. Respondents could select more than one category so figures may sum to more than 100% Whether expect to move in retirement
One in 5 fully retired people (20%) said they had moved since fully retiring. A similar proportion of people aged 55 and over and not yet fully retired said they expected to move within ten years of retirement (21%). A further 34% of this group said they may move within ten years of retirement. People who were currently renting social housing were less likely to say that they expected to move (11%) than those renting privately (30%). These findings are consistent with evidence from the English Housing Survey (MHCLG, 2024) regarding how average length of residence varies by tenure, from 4 years for private renters to 12 years for social renters. They may be partially explained by the fact that social renters often have lifetime or long-term tenancy agreements such as secure or assured tenancies, while private renters tend to have assured shorthold tenancy agreements which normally last between 6 months and one year. Additionally, social renting is generally more affordable, providing less financial incentive for social renters to move compared with private renters. (Table 5.20 and 5.21).
The reasons fully retired people gave for having moved were somewhat different to those given by people expecting to move in retirement. People who had not yet retired but who thought they would/might move in retirement were most likely to mention moving to smaller accommodation (50%) followed by moving to cheaper accommodation (22%). However, these reasons were given by only 26% and 8% of fully retired people who had moved. The most common reason fully retired people who had moved mentioned was wanting to be closer to family and friends (33%). In contrast this was mentioned by only 19% of prospective movers who had not yet retired. (Table 5.22 and 5.23, Figure 5.7).
Figure 5.7 Reasons for expecting to move in retirement
| Reason | Fully retired % | Not yet fully retired % |
|---|---|---|
| To move to smaller accommodation | 50% | 26% |
| No longer need to commute | 21% | 26% |
| To be closer to family or friends | 19% | 33% |
| Because of health/mobility needs | 19% | 15% |
| To move to nicer accommodation/neighbourhood | 18% | 20% |
| To move to supported housing | 7% | 2% |
| To move to larger accommodation | 5% | 6% |
| To move into rented accommodation | 2% | 1% |
| Other reason | 12% | 5% |
Source: Planning and Preparing for Later Life 2024
Base: Adults aged 55+ not yet fully retired who expected to move (n = 606) /Adults 40 to 75 fully retired who had moved in retirement (n = 368)
Note 1. Respondents could select more than one category so figures may sum to more than 100%
Note2: Fully retired respondents were asked about the reasons they had moved. Not yet fully retired respondents were asked about reasons
6. Pension decision-making
- Among people who had already accessed their pension, the average age at which they did so was 60. Employees, people on higher incomes, and those buying a home with a mortgage were all more likely to have accessed a pension by age 60.
- 53% of people aged 40 to 75 wanted their pension to provide them with a guaranteed income for life. This compares with 31% who wanted a flexible income and 12% who wanted a flexible income up to a certain age and then a guaranteed income thereafter. Younger age groups and people with smaller pension savings were the most likely to want a guaranteed income for life.
- The majority (77%) of DC pension holders yet to access their pension did not have a clear plan for how to do this. This includes 56% who knew they had to make a choice but did not have a clear plan, and 21% who were not aware they had to make a choice. Only 22% had a clear plan.
- 41% of DC pension holders who knew they had to make a choice said they planned to take an annuity compared with 58% who planned to move their pension into flexi-income drawdown. 67% said they would take some of their pension as a cash lump sum while only 16% planned to fully cash in their pension.
- People aged 55 and over who had accessed their DC pension since 2015 were generally confident that they had made the right choice to meet their retirement goals. Asked to rate their confidence on a scale from 0 to 10, the mean score was 7.3.
- 83% of people who had accessed a DC pension since 2015 had taken at least some of their pension as a lump sum. 37% of people who took a partial lump sum used it for a one-off purchase while 30% paid off debts. Most people (87%) were either very or quite satisfied with their decision to take a lump sum.
This chapter looks at the decisions people take around when and how to access their private pensions. It presents findings on the age at which people first accessed their pension, and whether this was before they fully retired from paid work. The chapter explores what people want their pension to provide them with in retirement and how they chose to access their pension, specifically whether they took a lump sum and how they took an income from their pension. It also looks at how confident people feel about making decisions around how to access their pension and their attitudes towards pension providers offering default pathways for accessing their pension.
The focus is on decisions around Defined Contribution pensions, primarily those accessed since 2015 when Pension Freedoms was first introduced.
When people access their pension
Chapter 2 showed that two-thirds of private pension holders aged 55 and over (67%) had accessed their pension. This included 33% of people aged 55 to 59 and 62% of people aged 60 to 64. (see Table 2.24). Among those people who had already accessed their pension, the average age at which they did so was 60. Employees with a private pension (60%) were more likely than self-employed pension holders (47%) to have accessed a pension before the age of 60. Private pension holders on higher incomes were also more likely to have accessed a pension pot before the age of 60. 56% of pension holders with an income of £53,000 or more had accessed a pension pot before the age of 60 compared with 36% of those with an income less than £12,500. Pension holders currently buying their home with the help of a mortgage (73%) were the tenure type most likely to have accessed a pension pot before the age of 60. People with multiple pensions were more likely to have accessed a pension pot before the age of 60, perhaps accessing one pension but leaving others to fund their retirement. People who only had one Defined Contribution (DC) pension (36%) were less likely to have accessed a pension pot before the age of 60 than people who had multiple DC pensions (48%) or a mix of DC and Defined Benefit (DB) pensions (44%) for example. (Table 6.01 and Figure 6.1).
Figure 6.1 Age at which first accessed pension, by mix of pensions held
| Pension mix | Under 60 % | 60 to 65 % | 66+ % |
|---|---|---|---|
| 1x DC pension only | 36% | 52% | 12% |
| 1x DB pension only | 45% | 49% | 7% |
| Multiple DC pensions (noDB) | 48% | 39% | 13% |
| Multiple DB pensions (noDC) | 43% | 55% | 2% |
| Mix of DB and DC pensions | 44% | 51% | 5% |
Source: Planning and Preparing for Later Life 2024
Base: Adults 55+ who had accessed private pension (n=1,629)
Three in 5 people (61%) who had accessed a pension said they had done so before they fully retired from paid work. The main reasons people gave for accessing their pension before retiring was because it allowed them to reduce or change their working hours (28%) and because they had an occupational pension, such as from the NHS or armed forces, that matured before they reached retirement age and that that they could therefore access early (24%). (Table 6.02 and 6.03 and Figure 6.2).
Figure 6.2 Reasons accessed pension before fully retired from paid work
| Reason | Percentage |
|---|---|
| Allowed change in working hours | 28% |
| Able to claim occupational pension early | 24% |
| To pay off debts | 15% |
| For a one-off purchase | 12% |
| Allowed change in type of work | 10% |
| Has other pensions/assets to fund… | 6% |
| To care for family/friends | 6% |
| Health/medical reasons | 4% |
| Redundancy | 4% |
| Extra income | 2% |
| Tax reasons | 2% |
| Other reason | 12% |
Source: Planning and Preparing for Later Life 2024
Base: Adults 55+ who had accessed private pension before fully retiring from paid work (n=898)
Note: Respondents could select more than one category so figures may sum to more than 100%
Depending on what other arrangements people have in place to fund their retirement, accessing a pension early may put people at risk of not having sufficient income for their retirement. Some people who had accessed their pension before the age of 60 had other private pensions that they had not yet accessed. However, many did not have any other pensions. Among 55 to 59 year olds who had accessed a pension, 45% did not have another pension they had not yet accessed. This figure rose to 60% among 60 to 64 year olds. 36% of DC pension holders and 28% of DB pension holders who had accessed a pension (which may have been a DC or DB pension) have another pension they have not yet accessed. (Table 6.04).
People were even less likely to still be saving into any pension once they had accessed a pension pot. Only 30% of 55 to 59 year olds and 21% of 60 to 64 year olds who had accessed a pension were still saving into another pension. (Table 6.05).
What people want from their pension
Before exploring how people plan to (or did) access their pensions, this section looks at what people said they ideally wanted their DC pension to provide them with in retirement. Just over half of people aged 40 to 75 with a DC pension (53%) said they wanted their pension to provide them with a guaranteed income for life. Almost half said this was the only or most important thing for their pension to provide (46%). A clear majority of people thought about their pension as a source of income with 72% choosing either a guaranteed income (46%), a flexible income (20%) or a flexible income followed by a guaranteed income (7%) as the only or most important thing for their pension to provide. (Table 6.06 and 6.07).
Despite the popularity of taking a cash lump sum when accessing a pension (see discussion below), around a third of people (34%) said they wanted their pension to provide money for a one-off purchase such as a holiday. Only 8% said a one-off payment was the only or most important thing for their pension to provide.
Only a small proportion of people mentioned wanting their pension to provide something to leave as an inheritance (16%), a way of paying social care costs (12%) or to provide financial support to relatives (9%). (Figure 6.3).
Figure 6.3 What want pension to provide in retirement
| Reason for pension | Percentage |
|---|---|
| A guaranteed income for life | 53% |
| An income to meet one off costs | 34% |
| A flexible income for life | 31% |
| To bridge the gap to State Pension age | 26% |
| Something to leave as inheritance | 16% |
| A flexible income then a guaranteed income | 12% |
| Income towards social care | 11% |
| Means to provide financial support for relatives | 9% |
| Income just in early years of retirement | 8% |
| Other answer | 1% |
Source: Planning and Preparing for Later Life 2024
Base: All adults 40 to 75 (n=2,047)
Note: Respondents could select more than one category so figures may sum to more than 100%
Younger people were generally more likely than older people to say that they wanted their pension to provide a guaranteed income for life. 64% of 40 to 44 year olds said they wanted this compared with 43% of 65 to 69 year olds.
A guaranteed income for life was the most common thing people with DC pension savings of up to £100,000 in value wanted their DC pension to provide them. This included 59% of people with total pension savings of £10,000 or less who wanted their pension to provide a guaranteed income for life. It is of course possible that people’s pension savings will increase further before they reach retirement. Chapter 2 showed that pension savings increase with age. (Table 2.24).
People with the largest DC pension savings (£100,000 or more) were the only ones more likely to say they wanted their pension to provide a flexible income rather than a guaranteed income for life (54% compared with 43%). People with the largest savings were also the most likely to say they wanted their pension to fund a one-off purchase. 43% of people with a total pot of £100,000 or more said this compared with 25% of people with a total pot size of under £10,000. People with larger pots may feel they have the luxury of using their pension for a one-off purchase while still retaining enough to provide an income in retirement. It may also be that people with a large pension pot overall, have multiple pensions and plan to use the smaller of these for one-off purchase(s). Chapter 5 also indicated that people with the largest pensions were also the most likely to have other sources of income, for example non-pension savings, available to help fund their retirement. (Table 5.13 and 5.14).
There were few differences in what people aged 55 and over wanted their pension to provide between those who had already accessed their DC pension and those who had not. The main difference was that people who had already accessed their pension (29%) were less likely to say they wanted their pension to provide them with a flexible income than people who had not yet accessed their pension (43%).
How people plan to access their pension
The majority of adults aged 50 and over with a DC pension they had not yet accessed (57%) said their pension provider had provided them with information about their options for accessing their pension. Only 2 in 5 (41%) of these people said they had a clear idea of how to access their pension. However, the figure was even lower (12%) among DC pension holders 50 plus who did not recall their pension provider providing this information. (Table 6.08 and 6.09).
Overall, a minority of DC pension holders aged 40 to 75 and yet to access their pension said they had a clear idea how to do this (22%). A similar proportion (21%) said they were not aware they had to make a choice of how to access their pension. The majority (56%) said they knew they had to make a choice but did not have a clear plan for this. (Table 6.09 and Figure 6.5).
Figure 6.4 Whether thought about how will take DC pension, by age
| Age | Did not know had to make a choice % | Do not have a clear plan but know need to make a choice % | Have a clear plan % |
|---|---|---|---|
| 40 to 44 | 27% | 58% | 16% |
| 45 to 49 | 33% | 59% | 8% |
| 50 to 54 | 25% | 58% | 18% |
| 55 to 59 | 13% | 58% | 29% |
| 60 to 64 | 16% | 51% | 33% |
| 65 to 69 | 2% | 44% | 54% |
| 70 to 75 | 3% | 55% | 42% |
Source: Planning and Preparing for Later Life 2024
Base: Adults 40 to 75 with a DC pension not yet accessed (n=1,391)
The proportion of people who said they had a clear plan did increase with age with around half (54%) of 65 to 69 year olds saying they had a clear plan. However, only 18% of 50 to 54 year olds and 33% of 60 to 64 year olds said they had a clear plan. People with high financial literacy (25%) were only slightly more likely than those with low financial literacy (18%) to say they had a clear plan. However, people with high financial literacy were more likely to know that they at least needed to make a choice of how to access their DC pension (61%) compared with people with low financial literacy (44%).
Among people who knew they had to make a choice of how to take their DC pension, the majority (69%) said they planned to take some of their pension as a cash lump sum. A far smaller proportion (16%) said they planned to take all of their pension as a lump sum. People were more likely to say that they would purchase a flexi-income product (58%) than an annuity (41%). (Table 6.10). It is worth noting that, although most people said they wanted their pension to provide them with a guaranteed income for life (more than said they wanted it to provide them with a flexible income, see Table 6.07), people were more likely to be planning to purchase a flexi-income drawdown product than an annuity. It is not, however, unusual to find discrepancies in what people say they plan to do and what they actually do in practice once they have more information and need to make a choice (see, for example, this research by nmg Consulting). For insights into why people may be reluctant to choose an annuity see Overton and Smith, 2022.
People who had a DC pension to access and did not have a clear idea how to do so were asked what would help them have a clearer plan. Three in 5 said more information from their pension provider (61%) or more information from the government (60%) would help. Nearly half (47%) said cheaper access to financial advice would help. (Table 6.11).
Figure 6.5 What would help have clearer plan for how to access DC pension
| Type of help | Percentage |
|---|---|
| More information from pension provider | 6!% |
| More information from the Government | 60% |
| Cheaper access to independent financial advice | 47% |
| Information on all pensions in one place | 40% |
| Information presented more simply | 38% |
| Easier access to independent financial advice | 38% |
| Information tailored to specific circumstances | 36% |
| More information from employer | 35% |
| Other | 3% |
Source: Planning and Preparing for Later Life 2024
Base: Adults 40 to 75 who do not have a clear idea how to access their DC pension (n=988)
Note: Respondents could select more than one category so figures may sum to more than 100%
How people access their pensions
The next section looks in detail at how those who had already accessed their DC pension had done so. The analysis focuses on people who accessed a DC pension since 2015, that is since pension freedoms were introduced. Nearly three-quarters (72%) of the DC pension holders surveyed who had accessed a pension had accessed at least one pension since 2015. Nevertheless, the number of cases available for analysis is relatively small and the scope for making comparisons across demographic subgroups is limited. (Table 6.12).
Confidence around accessing pension
Although many people yet to access their DC pension did not (yet) have a clear plan for how to do this, most people who had accessed their pension since 2015 were confident, having accessed, that they had made the right decision to achieve their retirement goals. On a score from 0 to 10 where 0 was “not at all confident” and 10 “extremely confident” they had made the right decision, the mean score among people 55 and over who had accessed a DC pension since 2015 was 7.3. Only 21% gave a score of 5 or less. For some people who have only recently accessed their pension it is of course probably too early for them to know for certain if they made the correct decision for the long term. (Table 6.13).
People who objectively were likely to be better informed were also more confident. For example, people who had used regulated advice or guidance in the last 12 months (mean 7.7) were more confident than people who had not (mean 7.1). Similarly, people who had used any formal information source (including regulated advice or guidance) in the last 12 months were more confident (mean 7.6) than those who had not (mean 6.9)[footnote 15]. People with high financial literacy were also more confident (mean 7.6) than people with low financial literacy (mean 6.6). (Figure 6.4).
Figure 6.6 Mean confidence (0 to 10) that made right decision when accessing pension, by financial literacy, use of formal information sources, and use of regulated advice/guidance
| Confidence in accessing information | Mean score from 0 to 10 |
|---|---|
| Low financial literacy | 6.6 |
| Medium financial literacy | 7.0 |
| High financial literacy | 7.7 |
| Not used formal info source in last 12 months | 6.9 |
| Used formal info source in last 12 months | 7.6 |
| Not used regulated advice/guidance in last 12 months | 7.1 |
| Used regulated advice/guidance in last 12 months | 7.7 |
Source: Planning and Preparing for Later Life 2024
Base: Adults 55+ who accessed DC pension since 2015 (n=605)
Taking a lump sum
Nearly everyone who had accessed a DC pension since 2015 (83%) had taken a cash lump sum from at least one pension. Only a small proportion (11%) had taken at least one pension as a full lump sum. Taking cash from a pension in chunks was also relatively uncommon (16%). It was far more common for people to have taken a one-off partial lump sum (60%). (Table 6.14 to 6.17)[footnote 16].
Many people said they had saved (37%) or invested (21%) their full lump sum. It was also relatively common for people to have saved (26%) or invested (22%) a partial lump sum. It is not clear what investment options people thought were better than leaving the money in their pension. (Table 6.18 and 6.19 and Figure 6.7).
Other ways in which people chose to use their partial lump sum include to make a one-off purchase such as a car, holiday or renovations (37%), to pay off debts (30%) or to cover living costs (21%).
Nearly everyone who had taken a lump sum was satisfied with that decision. Overall, 87% said they were very or quite satisfied, including 59% who were very satisfied. Whether people will become less satisfied over time as they realise the possible implications for future income of having cashed in their pension remains to be seen. There was no clear trend in satisfaction by age, partly due to small sample sizes. Those aged 70 to 74 (46%) were the least likely to say they were very satisfied but still nearly everyone in every age group said they were very or quite satisfied. (Table 6.20).
Figure 6.7 How used pension cash lump sum
| Reason | Partial lump sum % | Full lump sum % |
|---|---|---|
| Made a one-off purchase | 37% | 25% |
| Paid off debts | 30% | 17% |
| Saved it | 26% | 37% |
| Invested it | 22% | 21% |
| Covered living costs | 21% | 30% |
| Supported family members | 14% | 2% |
| Bought land or property | 5% | 8% |
Source: Planning and Preparing for Later Life 2024
Base: Adults 55+ who have taken cash lump sum from DC pension since 2015 (partial lump sum=332, full lump sum=54)
Note: Respondents could select more than one category so figures may sum to more than 100%
Taking an income
A relatively small proportion of people who had accessed a DC pension since 2015 had taken an income from one or more of their pensions to date. Therefore, the findings below, some of which are based on small sample sizes of around 100 people, are indicative only. Overall, 19% of people aged 55 and over who had accessed a pension since 2015 had taken an annuity while 16% had moved a pension into income drawdown. (Table 6.21 and 6.22).
Most people had only taken an income from one pension since 2015. For the small number of people who had taken an income from more than one pension they were asked to think about whichever pension provided them with the biggest income when answering follow up questions about how and why they had taken an income from their pension. Over half of people (57%) who had taken an income from their pension said their biggest pension was providing an income of less than £5,000 a year. (Table 6.23).
The most common reason for purchasing an annuity, mentioned by 74% of people with an annuity, was to have a guaranteed income. Almost half (47%) said they had purchased an annuity to access their cash free lump sum. The proportion of people who said they had moved their pension into income drawdown to access a cash lump sum was even higher (67%). Other commonly mentioned reasons for moving a pension into income drawdown were to be able to make flexible withdrawals (61%) and so they could continue to earn a return on their investment (54%). (Table 6.24 and 6.25).
People were generally satisfied with their decision to purchase an annuity or move their pension into income drawdown. 75% of people were satisfied with their decision to take an annuity, including 47% who were very satisfied. Satisfaction with income drawdown was even higher with 91% of people satisfied with their decision, including 55% who were very satisfied. Again, however, it is important to note that these results are based on only a relatively small number of responses. (Table 6.26 and 6.27).
Attitudes towards default pathways for accessing pension
The government is legislating in the Pensions Schemes Bill introduced in 2025 to require pension providers to offer pension holders a default option for how to access their DC pension. This is intended to assist pension holders facing a wide range of different choices on how to access their pension. The pension holder, would, however, need to make the final choice as to whether or not to accept the default option proposed by their pension scheme. When asked what they would prefer when it comes to accessing their DC pension, over half (55%) of people under 55 with a DC pension not yet accessed said their preferred option was to receive information on their options from their pension provider but to make the final decision themselves. 32% said they wanted to decide for themselves but only 3% of people said they would prefer not to have to make a decision themselves at all and have their pension provider decide for them. (Table 6.28 and Figure 6.8).
Figure 6.8 How would prefer to make decisions about accessing pension
| Preference | Low financial literacy % | Medium financial literacy % | High financial literacy % |
|---|---|---|---|
| To decide myself how to access my pension in a way that best suits my needs | 37% | 38% | 26% |
| To receive information from my pension provider on the options to access my pension but I make the final decision | 48% | 50% | 62% |
| To pay for financial advice on the best way to access my pension | 8% | 8% | 12% |
| To not have to make a decision my self and let my pension provider decide for me | 7% | 3% | 1% |
Source: Planning and Preparing for Later Life 2024
Base: Adults under 55 with a DC pension (n=713)
Having their pension provider decide for them outright was slightly more popular among people with low financial literacy. 7% of people with low financial literacy favoured this option compared with 1% of people with high financial literacy. However, support for this option – where the pension holder did not make the final choice - remained low across all groups.
PPLL also asked people specifically whether they thought default options for accessing a DC pension should be offered by pension providers. The survey described default pathways as the pension provider selecting an option without any input from the individual. When framed in this way, fewer than half (43%) of DC pension holders aged 40 to 75 (including 40% of those who had already accessed their DC pension) said they thought that pension providers should offer default pathways. (Table 6.29 – Willingness to pay for pension products and services).
As noted above, the measures in the Pension Schemes Bill will require pension schemes to provide a default solution, but individuals will need to agree to receive their benefits this way and will retain the freedom to choose another option. Unlike the measures proposed in the Pension Schemes Bill, the survey did not specify that the pension holder would be able to choose an alternative option. Had the policy been presented to people in this way, support for the policy may have been higher.
Technical Annex: Segmentation
Background
Segmentation analysis provides a means of uncovering patterns and trends in a large and potentially complex population by breaking that population down into a number of smaller, more manageable groups. Individuals are sorted into distinct groups based on their similarity to others in that group - and their dissimilarity from people in other groups – according to a set of pre-defined characteristics.
This report used a technique known as Partitioning Around Medoids (PAM) Clustering, or k-Medoids clustering, to divide the population of 40 to 75 year olds interviewed for the Planning and Preparing for Later Life survey (PPLL) into distinct groups. k-Medoids clustering[footnote 17] is a partitioning algorithm that aims to minimise the dissimilarity between points within a group or cluster while choosing actual data points as centres, known as medoids. A significant advantage of k-Medoids is that it selects representative points from the dataset, making it less sensitive to outliers and noise.
In this technical annex, ‘cluster’ is used to represent a data-driven group of similar points which may evolve throughout the analysis process, whereas ‘segment’ is the outcome, but conceptually they are equivalent and may be read as synonyms. Modelling was carried out using Python. Throughout this annex, references are given to relevant Python software packages.
Application of a single k-Medoids cluster process
The process begins with selecting k initial medoids randomly from the dataset, where k is a predefined number of target clusters. Each data point is then assigned to the nearest medoid based on a chosen distance metric. After the initial assignment, the algorithm iteratively updates the medoids by examining potential replacements among the data points to reduce the overall dissimilarity within the clusters. This involves calculating how much the total difference within the cluster would change by swapping a medoid with another point and then choosing the swap that results in the greatest improvement.
The iterative process continues until there is no change in the medoids, indicating that the optimal clusters have been found. The final clusters are then evaluated for their cohesion within clusters and separation between clusters to ensure meaningful segmentation.
Iterative approach to finding the optimal clusters
In identifying clusters for the study, the above clustering process was run hundreds of times with variations in settings. These variations were of several types:
- Number of clusters. As the number of clusters was not pre-supposed through existing knowledge, a typical approach is to experiment with varying the number of starting medoids, and hence the number of resulting clusters. After discussion with DWP, it was decided to test between 3 and 6 clusters, as a balance between meaningful distinction between groups and a manageable number of potential cluster profiles to interpret. For most model runs, regardless of other variations, 5 was found to be the optimal number of clusters.
- Variables included in the model. Observations in clusters represent those that have multiple similarities across many variables, and so clusters are heavily affected by the choice of variables in the model. Too many variables representing very similar concepts will weight the analysis towards an interpretation of those variables and reduce the impact of others. Variable selection was carried out with input from DWP to ensure a balance of variables across different dimensions of interest. Nevertheless, even well-considered variables can sometimes cause difficulty for clustering, such as if they add noise to the model and make clusters less well-defined. For this reason, we experimented with Leave One Feature Out approaches: excluding one variable from the model and observing the impact on the clusters. Correlation was also calculated between each pair of variables to identify those which were potentially redundant. Additionally, for some variables that were known to be similar, comparison runs were made to observe the impact of including one versus the other. The final list of variables included in the model can be found in Chapter 2 of the report.
- Algorithm parameters. Experiments were run comparing cluster performance using 2 different distance metrics which underlie the calculation of similarity within groups: Manhattan and Gower[footnote 18] distances. Manhattan distance is an efficient, simple distance metric, while Gower has some advantages for categorical variables. Other techniques to account for the variety of variables, including standardisation, were also employed where appropriate. Gower ultimately outperformed and was selected for later runs.
With hundreds of model outputs, cluster cohesion was evaluated by calculating the Silhouette Score[footnote 19], which is an average of each point’s similarity within its own cluster against the dissimilarity towards the next nearest cluster. A higher score means more well-defined clusters, allowing easy comparison between large numbers of models without having to examine clusters manually. The scoring metric enabled highly performing models to be identify and approaches refined. A longlist of strong models was then reviewed manually to ensure that the clusters were interpretable in the context of the chosen variables.
Finally, k-Medoids and other clustering techniques can be sensitive to the initial starting medoids. In some cases this can result in optimal clusters not being found, or worse, models which appear to score well but are not well optimised. Strongly performing models were subjected to repeat runs using different initialisation parameters, and the variation in scores compared. This was to ensure model robustness; that similar scores were found despite different starting points and hence that clusters are representative of the data and not the result of chance.
Analysis
The value of segmentation analysis is that it provides a way to organise complex data which varies across multiple dimensions. However, visualizing a model in multiple dimensions is not straightforward. Visualisation techniques utilising Uniform Manifold Approximation and Projection (UMAP)[footnote 20] were used to represent a multi-dimensional model in 2 dimensions. This visualization was often useful in identifying the greatest separation between clusters and the approximate size and spread of each cluster. As it is highly simplified view, it was used for quick checks rather than final performance analysis. For a well performing model we are looking for a high silhouette score that remains stable under most variations, and clear distinctions between each identified cluster across the included variables. The visualization aids primarily in identifying which clusters are most easily separated, and gaining a sense of noise / dispersion, while acknowledging the limitations of 2 dimensions.
An example for the chosen model is below.
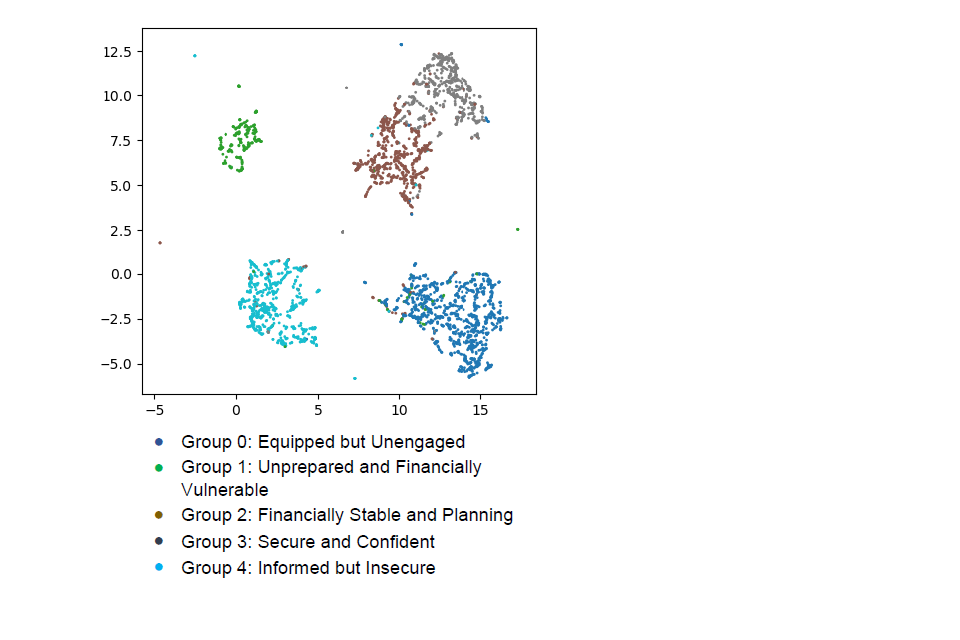
Post-clustering interpretation and checks
Models which showed promising results were shared with DWP. This included the best performing 3- and 4-cluster models as well as a variety of 5-cluster models with different variables included. To help DWP decide between models, and which would be most useful to them, the characteristics of each cluster were summarised in terms of characteristics of each cluster were presented in terms of their answers to specific survey questions: for example, the proportions of respondents in each segment who were ‘not at all confident’ that they had enough money to achieve the lifestyle they want in retirement. After some feedback, a small number of variable changes were made and the models re-run, with the same quality control checks and analysis. Names and pen portraits of the final segments were agreed with DWP. The results from the final model – involving 5 clusters – are discussed in Chapter 2 of the report.
-
Semi-retirement was self-defined by the respondent. ↩
-
These figures exclude any private pensions people might have. ↩
-
The correct answer is National Insurance Qualifying years can be built up even when not in paid employment including through National Insurance Credits: Eligibility - GOV.UK and Voluntary Contributions. ↩
-
The correct answer is that you need at least 10 qualifying years to receive any new State Pension. ↩
-
This statement is only true for the new State Pension for people who started their National Insurance record from 6 April 2016 onwards. For people with a National Insurance record from before 6 April 2016, transitional arrangements apply. Read further information on The new State Pension transition and contracting-out: fact sheet - GOV.UK. Individuals can find a forecast of the new State Pension amounts they may receive at Check your State Pension forecast - GOV.UK ↩
-
National Insurance Qualifying years can be built up when not in paid employment or self-employment including through National Insurance Credits: Eligibility - GOV.UK) and Voluntary National Insurance Contributions. ↩
-
For individuals with National Insurance contributions before 2016, further information on transitional arrangements can be found here: The new State Pension transition and contracting-out: fact sheet - GOV.UK. Individuals can find a forecast of the new State Pension amounts they may receive at Check your State Pension forecast - GOV.UK ↩
-
Individuals usually need at least 10 qualifying years to receive any new State Pension. ↩
-
It may be that people have been exposed to the information about income thresholds provided by PLSA, for example by a pension provider or employer, but that the PLSA Retirement Living Standards were not referenced by name. ↩
-
Formal information sources includes government websites, pension providers, Money Helper, MidLife MOT and Retirement Living Standards, published by the Pensions and Lifetime Savings Association, Pension Wise and professional financial advisors. Less formal information sources include employers, family and friends, community groups and internet guidance sources. ↩
-
The income thresholds asked about in the questionnaire were set to correspond approximately to the PLSA’s thresholds as of mid-2024. In 2025, the PLSA amended the thresholds and, for example, reduced the amount of income it estimated was required to achieve a basic standard of living. ↩
-
Responses were very similar for people who had not yet retired and people who had retired. For a breakdown by retirement status see Tables 5.33 and 5.34. ↩
-
Responses were very similar for people who had not yet retired and people who had retired. For a breakdown by retirement status see Tables 5.35 and 5.36. ↩
-
Responses were very similar for people who had not yet retired and people who had retired. For a breakdown by retirement status see Tables 5.37 and 5.38. ↩
-
Regulated advice or guidance includes a professional financial advisor or Pension Wise. Formal information sources includes, in addition, government websites, pension providers, Money Helper, a MidLife MOT and Retirement Living Standards, published by the Pensions and Lifetime Savings Association. ↩
-
The Financial Conduct Authority publish more detailed statistics on ways in which people are accessing their pensions based on pensions data. These statistics – which are at the pension rather than the individual level - suggest that the proportion of people taking all of their pension in cash may be higher than shown here. PPLL relies on individuals’ self-reports which, due to issues with recall and/or understanding of pension options, may not always be accurate. PPLL can, nevertheless, provide insights into why people take the decisions they do and their attitudes towards those decisions. ↩
-
Read sklearn_extra.cluster.KMedoids — scikit-learn-extra 0.3.0 documentation ↩
-
Read gower – PyPI ↩
-
Read UMAP: Uniform Manifold Approximation and Projection for Dimension Reduction — umap 0.5.8 documentation ↩