Analysis of future pension incomes
Published 3 March 2023
Applies to England, Scotland and Wales

© Crown copyright 2023
This publication is licensed under the terms of the Open Government Licence v3.0 except where otherwise stated. To view this licence, visit nationalarchives.gov.uk/doc/open-government-licence/version/3 or write to the Information Policy Team, The National Archives, Kew, London TW9 4DU, or email: psi@nationalarchives.gov.uk.
Where we have identified any third party copyright information you will need to obtain permission from the copyright holders concerned.
This publication is available at https://www.gov.uk/government/statistics/analysis-of-future-pension-incomes/analysis-of-future-pension-incomes
This analysis provides a new estimate of the number and proportion of working age individuals, aged 22 to State Pension age, who are undersaving for their retirement.
The publication updates the analysis Department for Work and Pensions (DWP) published in the Analytical Report of the 2017 Automatic Enrolment Review. Although the analyses are not directly comparable, they follow a similar methodology. Differences between the two are discussed in this report.
The report seeks to answer:
- What is the current level of undersaving for retirement of working age individuals?
- Which groups are undersaving?
- What is the depth of undersaving?
It is important to state that any assessment of the adequacy of future pension income is complex and involves subjective judgement. What an individual may need, or want, in retirement is dependent on their own individual preferences and expectations. Adequacy measures are also affected by uncertain future economic trends. Therefore, when measuring the level of undersaving in the current working age population it is important to be aware that estimates can change based on the methodology, the measure used, and the assumptions made. This report therefore considers a number of different approaches to assessing undersaving, explains the key assumptions used, and provides sensitivity analysis.
1. Main headlines
This analysis explores the levels of undersaving. This can be measured in many ways; two key approaches are explored in this publication:
- Target Replacement Rate (TRR) – a percentage of pre-retirement earnings an individual would need to replace to meet an adequate income in retirement
- Expenditure-based Level – a level of income that might be deemed adequate – for example, the Pension and Lifetime Saving Association (PLSA) Retirement Living Standards (RLS)
Pension saving in Great Britain has been transformed by the introduction of Automatic Enrolment (AE) with over 10.8 million people being automatically enrolled and pension participation in the private sector for eligible employees increasing from 41% in 2012 to 86% in 2021. Findings in 2017 showed the introduction of AE had reduced the level of undersaving in the working age population measured against TRRs from 14 million to 12 million individuals.
The current analysis shows there is still a large proportion of the population undersaving for retirement if individuals want to maintain a certain standard of living.
- 38% of working age people (equivalent to 12.5 million) are undersaving for retirement when measured against TRRs Before Housing Costs (BHC). This is calculated on the basis of converting the full value of an individual’s Defined Contribution (DC) pension into an annuity
- the level of undersaving increases to 43% of working age people (equivalent to 14.1 million) when 75% of an individual’s DC pension is converted into an annuity
- higher earners are more likely to be undersaving relative to TRRs. Around 14% of those in the lowest earnings band (less than £14,500 gross pre-retirement earnings per year) are undersaving compared with 55% in the top earnings band (more than £61,500 per year). State Pension will make up a larger proportion of a lower earners target income.
- of the 12.5 million people undersaving, 5.3 million (42%) reach more than 80% of their target income
- 12% of working age people are undersaving for retirement when measured against the PLSA Minimum RLS (one of many alternative ways of measuring adequacy of pension income). This increases to 51% and 88% when comparing against the PLSA Moderate and Comfortable RLS
- lower earners are more likely to be undersaving when measuring against the PLSA RLS. Around 34% of people in the lowest earnings band are projected to not meet the PLSA Minimum RLS, compared with only 3% in the top earnings band
2. What you need to know
Background
Pension saving in Great Britain has been transformed by the introduction of AE with over 10.8 million people being automatically enrolled and pension participation of eligible employees in the private sector increasing from 41% in 2012 to 86% in 2021. Employer pension contributions in the private sector have also increased since AE was introduced, rising from £29.5bn (2012) to £37.5bn (2021) in real terms. Policies such as Simpler Annual Benefit Statements and Pensions Dashboards will give savers the information and tools to allow them to more easily take responsibility and plan for the retirement that they want, and AE gives eligible employees the flexibility to contribute more to their pension if they choose to. DWP remains committed to implementing the 2017 AE review measures, focused on supporting low/median income earners for whom it pays to save. This will improve workplace pension coverage and savings levels.
To support the monitoring of AE, DWP have published analysis of future pension incomes several times over the last decade, most recently to support the 2017 AE Review. The estimates are sensitive to the assumptions and methodology, which have changed over the years leading to slightly different estimates of undersaving in the working age population. In 2017, DWP undertook analysis to assess who in Great Britain is undersaving for retirement and the extent to which the introduction of AE improved the level of undersaving across the working age population (22 to State Pension age: the AE eligible group) and across different demographics.
Findings in 2017 showed the introduction of AE had reduced the level of undersaving in the working age population, when measured against TRRs from 14 million (45%) to 12 million (38%) individuals. Undersavers were more likely to be those with higher pre-retirement earnings. Of the 1.6 million undersavers in the two lowest earnings bands, just over half were within 20% of their target pension income.
In previous analysis DWP have used TRRs (defined below) as a measure of the adequacy of future pension incomes. However, we recognise there are multiple measures which have developed over the last decade. This analysis presents estimates of undersaving using two widely used measures to assess who is, and is not, able to maintain certain living standards in retirement.
The 2 measures are:
1. Target Replacement Rates (TRRs)
The first report of the Pensions Commission published in 2004[footnote 1] discussed the concept of an ‘adequate’ pension income and what role the state should take to ensure pensioners reach an adequate income. On the assumption that a pensioner would want to maintain the same standard of living in retirement that they had during their working life, he or she would need to maintain a level of pension income related to their pre-retirement earnings. Changing patterns in consumption as people get older suggests their pension income can be somewhat lower than their pre-retirement earnings to maintain a similar standard of living in retirement. Replacement rates measure income in retirement as a percentage of earnings income pre-retirement. TRRs refers to the percentage of income an individual would need to replace to meet an ‘adequate’ income. For a median earner, this is 67% of their pre-retirement earnings. The Pension Commission suggested those with lower earnings need to achieve a higher replacement rate to maintain their living standards (80% for those in the lowest earnings band) than higher earners (50% for those in the highest earnings band). See section 8 for the earnings bands and corresponding TRRs.
In the current analysis, pre-retirement earnings are calculated as the average gross (pre-tax) earnings from age 50 until State Pension age (SPa) over the period individuals are employed or self-employed. Pension income is gross (pre-tax) and is calculated as the income from SPa onwards averaged over the whole of each individual’s retirement. Full details of the methodology can be found in section 8. Pension income includes state and private pension income and excludes means tested benefits such as Pension Credit. While financial wealth is not modelled directly, an amount is imputed and then annuitised based on Wealth and Assets Survey data 2018 to 2020.
2. PLSA Retirement Living Standards (RLS)
The PLSA developed Retirement Living Standards to help savers plan for their desired retirement by setting out levels of expenditure for three standards of living in retirement described as Minimum; Moderate; and Comfortable. These are calculated for individuals and couples with variants to reflect higher living costs in London.
The RLS build on the Joseph Rowntree Foundation’s approach to design the Minimum Income Standards, which estimate the retirement income that different households require to reach a minimally acceptable standard of living in the UK. The research, carried out by Loughborough University, uses focus groups with members of the public aged 50 or over to establish a public consensus on the goods and services, and associated expenditure, needed by a range of household types to achieve a set of living standards.
Although the PLSA RLS have separate standards for London and outside of London, the modelling analyses at a national level therefore all individuals are assessed against the outside of London standards. See section 8 to see further information about the methodology.
Modelling future pension incomes
DWP has a long-term model of pensioner incomes (Pensim3). Pensim3 is a dynamic microsimulation model forecasting state and private pension contributions and incomes for the British population until the year 2100. As with any extensive model, a large number of assumptions are made which are subject to change in the future. The modelling is also cautious as it is confined to known and predictable changes from the policies rather than any possible behavioural impacts.
The current analysis includes the current AE eligible group (those aged 22 to SPa) and legislated SPa changes are accounted for across individuals. Pensions Freedoms opened up opportunities for people to access their pensions in more ways. This includes drawing down a pension income or taking partial or full cash withdrawals.
For the purposes of this analysis, individuals with DC pensions are modelled as converting their entire pension pot into an annual income for life. This is referred to as the ‘all income’ scenario. Whilst there has been a steep decline in the sale of annuities since 2014, the long-term decumulation landscape is uncertain and using the annuity approach creates a consistent, predictable income measure across all retirees for the analysis. A scenario is also presented where individuals with DC pensions withdraw a 25% cash lump sum before purchasing an annuity. This ‘income after lump sum’ scenario is consistent with DWP’s 2017 undersaving estimate. Unless otherwise stated, this report focuses on the ‘all income’ scenario. DWP’s research since 2017 has highlighted people are using their pension pot in a variety of ways and therefore feel it is appropriate to include, rather than exclude, the 25% lump sum in the calculations. See the published data spreadsheet for the full results from the ‘income after lump sum’ scenario.
All estimates are presented at the individual level. During the analysis pension incomes are combined at the benefit unit level (a benefit unit is defined to be a single adult or a married or cohabiting couple and any dependent children) and equivalised to adjust a couple’s income (see section 8). This enables us to compare all individuals to the same benchmark.
When measuring undersaving using TRRs, Before Housing Cost (BHC) income is used. DWP previously made an adjustment to the original methodology to reflect the different costs faced by owner occupiers and renters. The Pensions Commission benchmarks are adjusted to reflect the impact of different housing costs between working life and retirement (see section 7). Unless otherwise stated, this report focuses on the BHC measure. For the full After Housing Costs (AHC) results see the published data spreadsheet.
When measuring undersaving using PLSA’s RLS we have compared pension income AHC as the standards assume people are mortgage and rent free.
Changes from DWP’s previous published undersaving estimate
DWP’s previous undersaving analysis was modelled using Pensim2. The model has been extensively developed with updates to the data and assumptions, improvements to methodologies, and captures more recent policy developments. The updated model is now referred to as Pensim3.
Modelling changes include:
- updates to demographics of the 22-SPa population has changed which impacts the new estimates. For example, the previous analysis included 31.3 million individuals whereas this analysis includes 33.1 million individuals, reflecting updated population projections.
- updates to Office for Budget Responsibility (OBR) long-term economic assumptions as Office for National Statistics and OBR have revised their population projections and long-term economic assumptions respectively, particularly in light of Covid-19.
- outturn data with the model now using more recent data, including the actuals behaviours observed under AE rather than estimating the potential coverage and scale.
Due to these changes, the following analysis cannot be directly compared to DWP’s previous undersaving estimates. It is also important to recognise that any estimate of undersaving is sensitive to the current modelling assumptions and approach.
3. Undersaving analysis
Figure 1 shows the proportion of the working age population (currently aged between 22 and SPa) projected to not meet their TRR BHC and AHC. Figure 1 also shows the proportion of the population projected to not meet each of the PLSA RLS.
Figure 1: The proportion of working age people projected to not meet their TRR or PLSA RLS
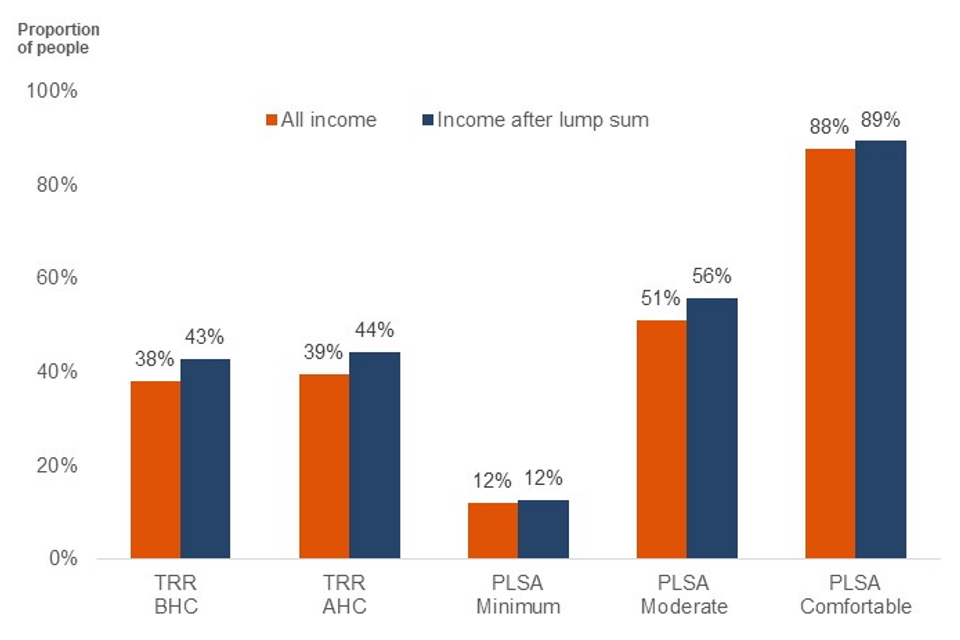
In the ‘all income’ scenario, BHC, it is estimated 38% of the working age population are undersaving for retirement (12.5 million people). This is slightly higher, 39% (13.0 million), when assessing AHC, reflecting housing costs being similar in retirement to the period just before retirement. In the ‘income after lump sum’ scenario the proportion undersaving is around 5 percentage points higher (43%, 14.1 million) BHC.
When measuring against the PLSA RLS, 12% (4.1 million) of the working age population are projected to have a pension income that falls below the PLSA Minimum RLS. Just over half of the population (51%, 17.7 million) are projected to have a pension income below the PLSA Moderate RLS, whilst a large majority of the population are projected to have a pension income below the PLSA Comfortable RLS (88%, 30.4 million). These estimates are based on State Pension being uprated by the triple lock.
By pre-retirement earnings
Figure 2 shows the proportion of people in each pre-retirement earnings band that are projected to not meet their TRR, in the ‘all income’ scenario. Around 14% of people in the lowest earnings band (less than £14,500 gross pre-retirement earnings per year) are undersaving compared with 55% in the top earnings band (more than £61,500 per year). Higher earners are more likely to be undersaving due to higher reliance on their private pension to contribute to their target pension income.
Figure 2: The proportion of working age people projected to not meet their TRR in each pre-retirement earnings band, before housing costs and after housing costs, in the ‘all income’ scenario
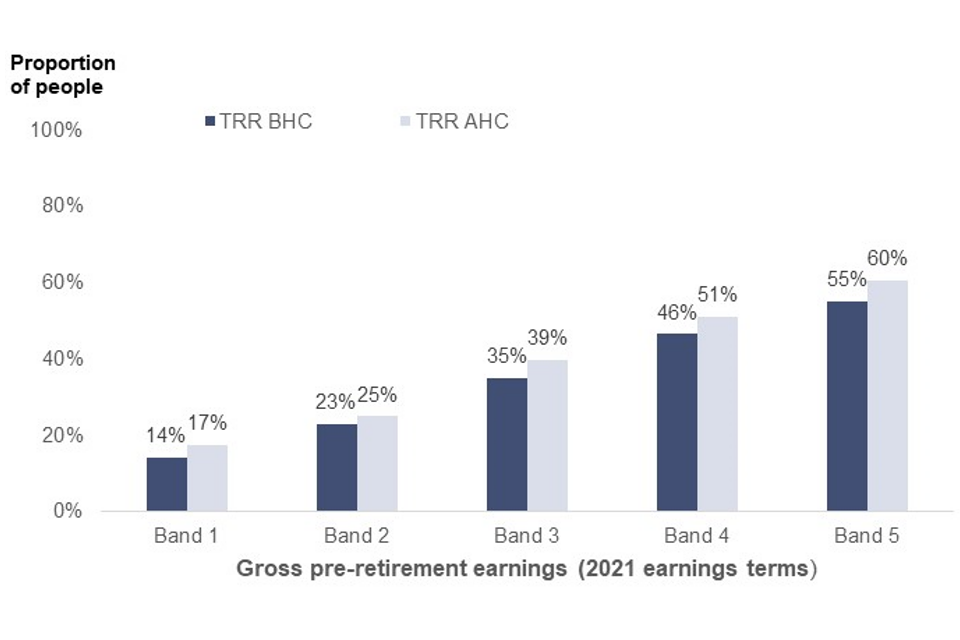
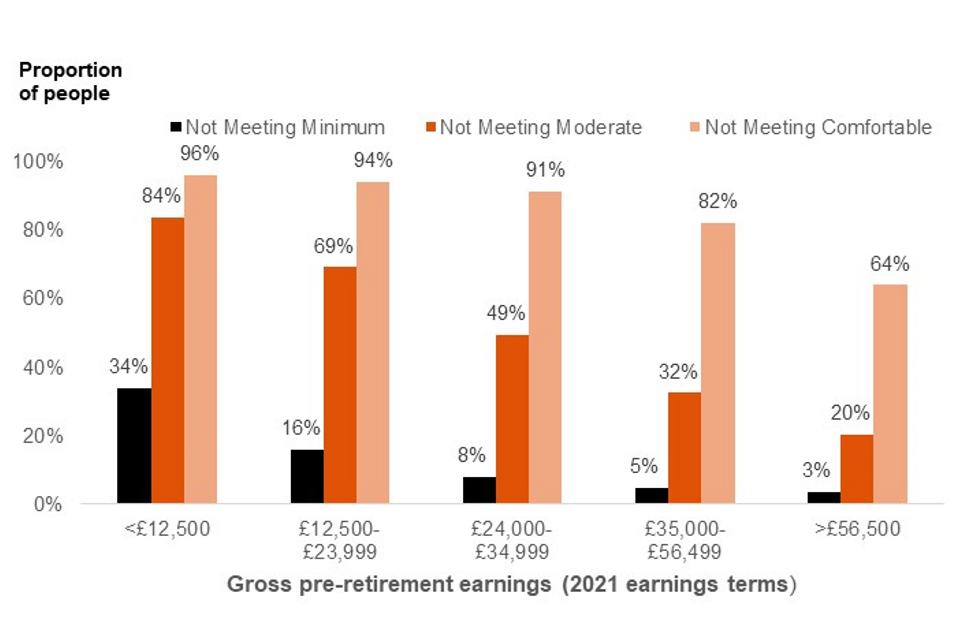
Figure 3 shows the proportion of people projected to not meet the PLSA Minimum, Moderate and Comfortable RLS in each pre-retirement earnings band. This shows the opposite pattern to replacement rates; those in the lower earning bands are more likely not to meet each RLS. Around 34% of people in the lowest earnings band are estimated to fall below the PLSA Minimum RLS, compared with only 3% in the top earnings band. A similar pattern is seen when looking at the other PLSA RLSs. This highlights the benefits of considering multiple measures when trying to understand the adequacy of future pension incomes.
Figure 3: The proportion of working age people projected to not meet the PLSA RLS in each pre-retirement earnings band
4. Undersaving by individual characteristics
Cohort
Table 1 shows the proportion of people projected to not meet their TRR or PLSA RLS by cohort; the decade of reaching SPa. In this table, and others in this section, the TRR total N and PLSA total N[footnote 2] refer to the total number of individuals with this characteristic and the total number of individuals in the population. The population differs for the TRR analysis and PLSA analysis, due to methodological differences, see Section 8.
Those reaching SPa in the 2030s and 2040s are more likely to be undersaving with 43% and 42% of people projected to not meet their TRR respectively, compared with 31% of those retiring in the 2060’s. These older cohorts will not have benefitted from a full career of AE and are less likely to have been enrolled in a Defined Benefit (DB) scheme compared to those approaching retirement this decade.
Over time, more people are projected to meet the PLSA Minimum RLS. This is partially driven by the State Pension being uprated by triple lock and more individuals having an increasing number of years in workplace pension saving. Although more people are also likely to meet the PLSA Moderate RLS, there is still a relatively large proportion (45%) of people retiring in 2060s who are not projected to meet it.
Table 1: The proportion of working age people projected to not meet their TRR or PLSA RLS by decade of reaching SPa
| Cohort | TRR BHC | TRR AHC | TRR total N | PLSA Minimum | PLSA Moderate | PLSA Comfortable | PLSA total N |
|---|---|---|---|---|---|---|---|
| 2020s | 39% | 40% | 5.0m | 14% | 53% | 87% | 5.6m |
| 2030s | 43% | 44% | 8.0m | 13% | 53% | 88% | 8.3m |
| 2040s | 42% | 44% | 6.3m | 12% | 55% | 89% | 6.6m |
| 2050s | 34% | 36% | 7.8m | 10% | 48% | 88% | 8.1m |
| 2060s | 31% | 33% | 6.0m | 10% | 45% | 86% | 6.2m |
| All individuals | 38% | 39% | 33.1m | 12% | 51% | 88% | 34.7m |
Note about table headings
TRR total N refers to the total number of individuals with this characteristic.
PLSA total N refers to the total number of individuals in the population.
Partnership Status
Table 2 shows the proportion of people projected to not meet their TRR or PLSA RLS by partnership status. There is a 2 percentage point difference between singles and couples meeting their TRR BHC, with this being 39% of singles not meeting their target compared with 37% of couples. The difference is larger when looking AHC, as couples are able to take advantage of sharing housing costs.
When measuring undersaving against the PLSA RLS, 19% of single pensioners are projected to not meet the PLSA Minimum RLS compared with only 8% of pensioners in a couple. This pattern can also be seen when comparing against the PLSA Moderate RLS. However, the gap is closed somewhat when comparing against the PLSA Comfortable RLS standard with only a 5 percentage point difference.
Table 2: The proportion of working-age people projected to not meet their TRR or PLSA RLS by partnership status.
| Partnership status | TRR BHC | TRR AHC | TRR total N | PLSA Minimum | PLSA Moderate | PLSA Comfortable | PLSA total N |
|---|---|---|---|---|---|---|---|
| Single | 39% | 42% | 10.4m | 19% | 66% | 91% | 11.6m |
| Couple | 37% | 38% | 22.7m | 8% | 43% | 86% | 23.2m |
| All individuals | 38% | 39% | 33.1m | 12% | 51% | 88% | 34.7m |
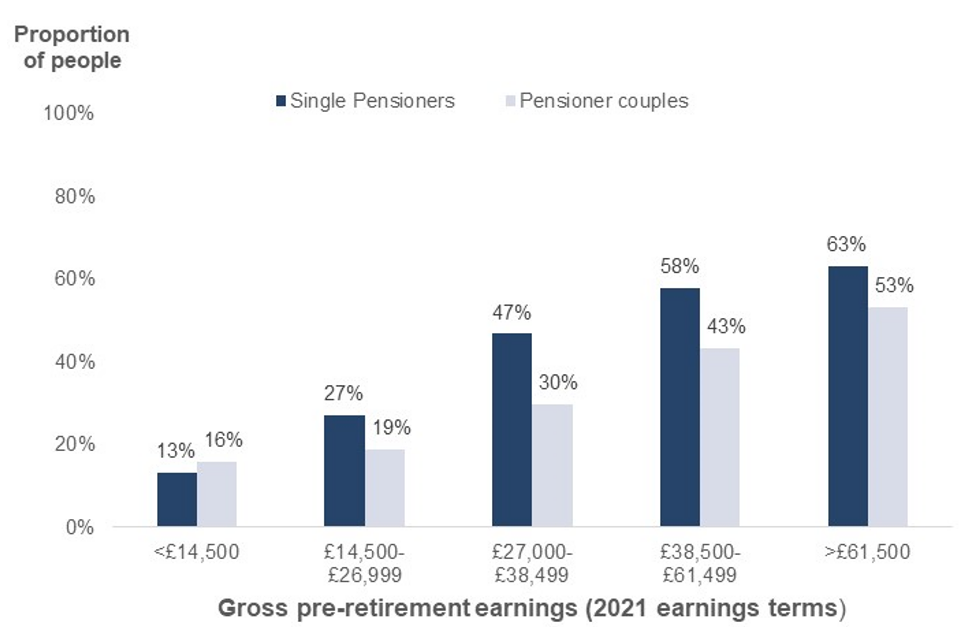
Single pensioners are more likely to be in the lower earnings bands than couple pensioners. Figure 4 shows the proportion of single and couple pensioners projected to not meet their TRR by pre-retirement earnings band. In the lowest earnings band a greater proportion of those in pensioner couples are projected to not meet their TRR (16% compared with 13%) whereas the opposite is seen in the other earnings bands. For example, in the middle-earnings band, 47% of single pensioners are undersaving for retirement compared with 30% of couple pensioners.
Figure 4: The proportion of working-age people projected to not meet their TRR by partnership status and pre-retirement earnings band
Housing Tenure
When housing costs are taken into account, renters are 10 percentage points more likely to be projected to not meet their TRR than owner occupiers. Twenty-five per cent of renters are projected to not meet the PLSA Minimum RLS compared with only 8% of owner occupiers. This highlights the role of housing costs in the adequacy of pension incomes and the significantly lower costs faced by homeowners.
The model currently assumes home ownership continues at similar levels in retirement to existing levels (just under 80%). However, if this was to be lower in the future, we may expect undersaving (AHC) to increase.
Table 3: The proportion of working-age people not meeting their TRR or PLSA RLS by housing tenure.
| Housing Tenure | TRR BHC | TRR AHC | TRR total N | PLSA Minimum | PLSA Moderate | PLSA Comfortable | PLSA total N |
|---|---|---|---|---|---|---|---|
| Owner occupied | 37% | 37% | 25.9m | 8% | 45% | 86% | 26.9m |
| Renter | 42% | 47% | 7.2m | 25% | 71% | 93% | 7.8m |
| All individuals | 38% | 39% | 33.1m | 12% | 51% | 88% | 34.7m |
Pension Type
The estimates of undersaving includes people aged 22 to SPa. However, not all of this population will be saving into a private pension. This could be due to reasons such as a choice not to save, reliance on a partner, or affordability to save for later life.
In this analysis, pension income for couples is combined and then equivalised (See methodology). To assess the impact of pension type on undersaving, we analysed pension type within the benefit unit. For single pensioners, this is the equivalent of whether they as an individual had DB, DC, both or neither pension types over their working career. For pensioner couples, we analyse whether either individual had these pension types.
This shows that:
- 75% (equivalent to 2.1 million) of people without a private pension are projected to not meet their TRR and 74% (2.7 million) are projected to not meet the PLSA Minimum RLS
- 31% with DB and DC are projected to not meet their TRR with 3% projected to not meet the PLSA Minimum RLS
Those with either DB income or a combination of DC and DB income at the benefit unit level are less likely to be undersaving.
Table 4: The proportion of people not meeting their TRR or PLSA RLS by private pension type.
| Private pension type | TRR BHC | TRR AHC | TRR total N | PLSA Minimum | PLSA Moderate | PLSA Comfortable | PLSA total N |
|---|---|---|---|---|---|---|---|
| No private pension | 75% | 76% | 2.8m | 74% | 98% | 99% | 3.6m |
| DB only | 33% | 34% | 2.1m | 10% | 53% | 86% | 2.3m |
| DC only | 44% | 46% | 8.1m | 8% | 60% | 92% | 8.4m |
| DB and DC | 31% | 32% | 20.1m | 3% | 39% | 84% | 20.4m |
| All individuals | 38% | 39% | 33.1m | 12% | 51% | 88% | 34.7m |
Since the introduction of AE in 2012, there has been an increase in the number of people with DC pensions. This is anticipated to continue to grow over time. Figure 5 shows the shift in private pension type over time. Amongst those due to retire in the 2020s, 11% of individuals are from households who have DC pension income only. This rises to 37% of those due to retire in the 2060s. Across all cohorts, the majority of individuals are from households with DC and DB pension types, either because the individual has saved through multiple schemes or they are in a pensioner couple where at least one individual would need to have participated in a DB pension to be included in this category. This proportion declines slightly from 62% for the oldest cohort to 54% in the youngest cohort[footnote 3].
Figure 5: The proportion of working age people with each private pension type within the household by cohort
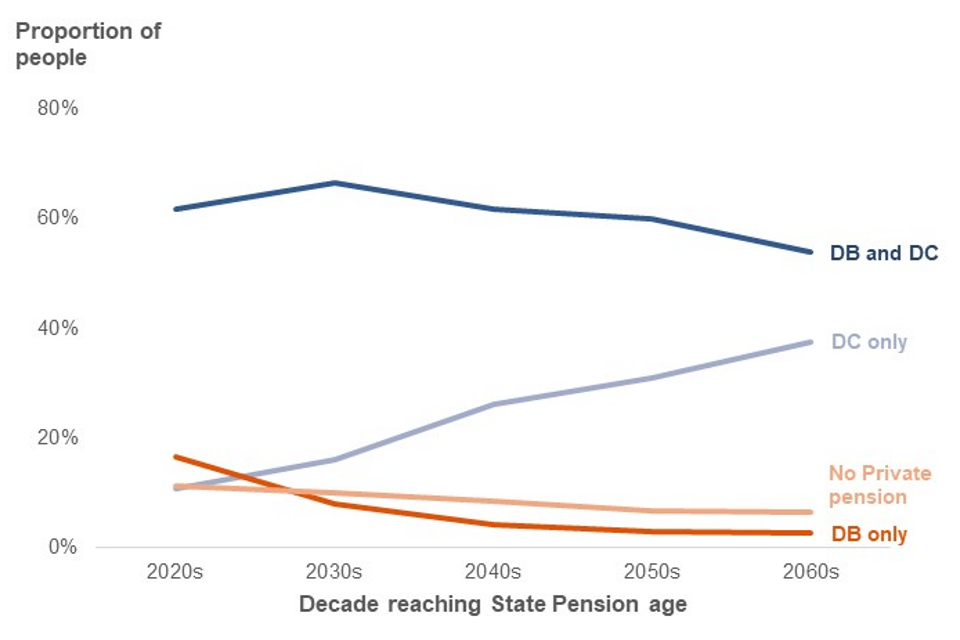
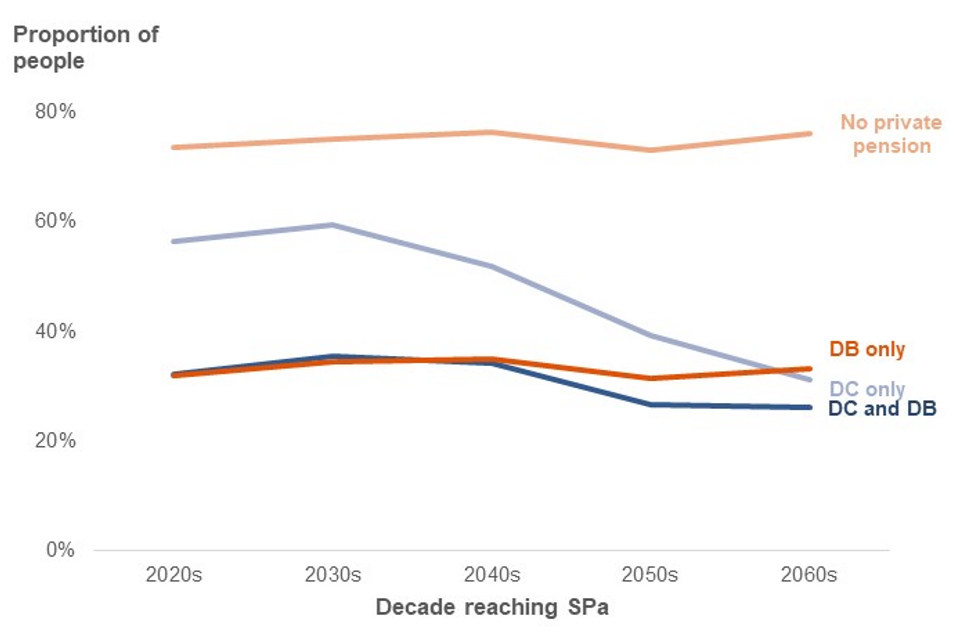
Figure 6 shows the proportion of people projected to not meet their TRR by private pension type and cohort. This proportion stays relatively stable over time for those with no private pension (around 75% not meeting their TRR) or DB pensions only (around 30% not meeting their TRR). In contrast, those from households with DC pensions only show a marked decline in undersaving from just under 60% of those due to retire in the next two decades to 31% of those reaching SPa in the 2060s. These individuals will have a full work history with AE in place, thereby helping reduce the level of undersaving. This also impacts the level of undersaving for those reaching SPa in the 2060s who have a combination of DB and DC pension income where undersaving is 26%.
Figure 6: The proportion of working age people projected to not meet their TRR by private pension type and cohort
5. Depth of undersaving
The question of whether or not someone is undersaving based on a TRR is binary. Therefore, it is useful to understand how far people are from reaching an adequate pension income using this measure. Analysis looking at depth of undersaving focuses on the TRR for the ‘all income’ scenario, BHC. The pattern of results is broadly consistent if looking AHC or using the ‘income after lump sum’ scenario.
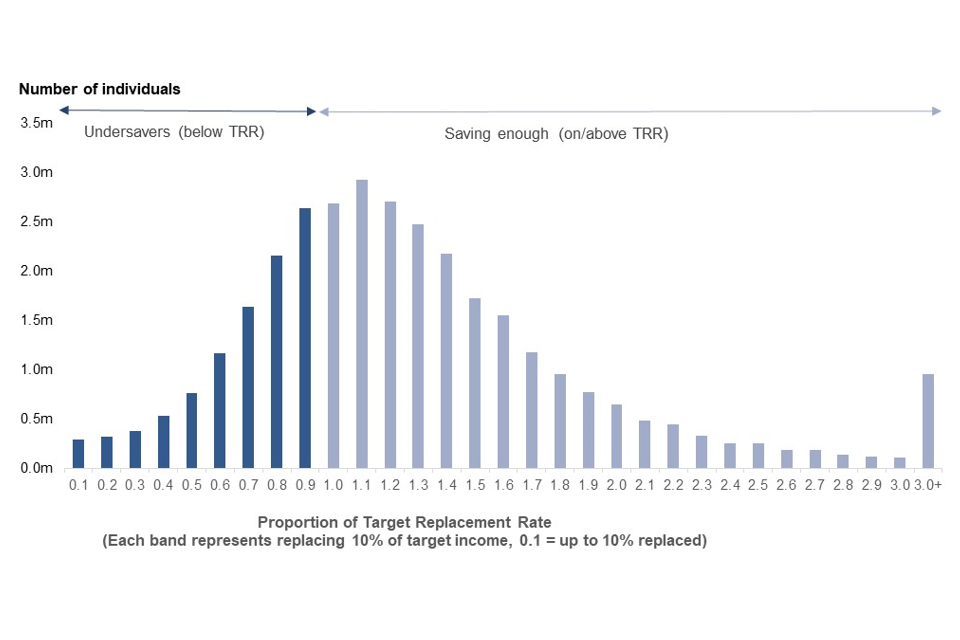
Figure 7 shows the proportion of target income reached for the working age population. The lighter bars to the right represent the 20.5 million people projected to be saving enough (on or above their TRR). The darker bars to the left are the 12.5 million people estimated to be undersaving for retirement.
There is a wide range of outcomes, though the majority are relatively close to their target income. Of the 12.5 million people undersaving, 5.3 million (42%) reach more than 80% of their target income.
Figure 7: Distribution of the proportion of target income reached for working age people
Focusing in on the undersavers, each individual has been categorised into one of three ‘depth’ of undersaving categories:
- Substantial undersavers – below 50% of their target income
- Modest undersavers – 50% to below 80% of their target income
- Mild undersavers – 80% to below 100% of their target income
This categorisation matches the 2017 AE review. Figure 8 shows that the largest group of undersavers are in the fourth earnings band (pre-retirement earnings £38,500 to £61,499), of which 2.3 million people are ‘Mild’ undersavers, 2.1 million are ‘Modest’ undersavers and 0.7 million are ‘Substantial’ undersavers.
Of undersavers in the two lowest pre-retirement earnings bands, 0.7 million people are ‘Mild’ undersavers, 0.6 million people are ‘Modest’ undersavers and another 0.6 million people are ‘Substantial’ undersavers.
Figure 8: Number of Mild, Moderate and Substantial undersavers by pre-retirement earnings band
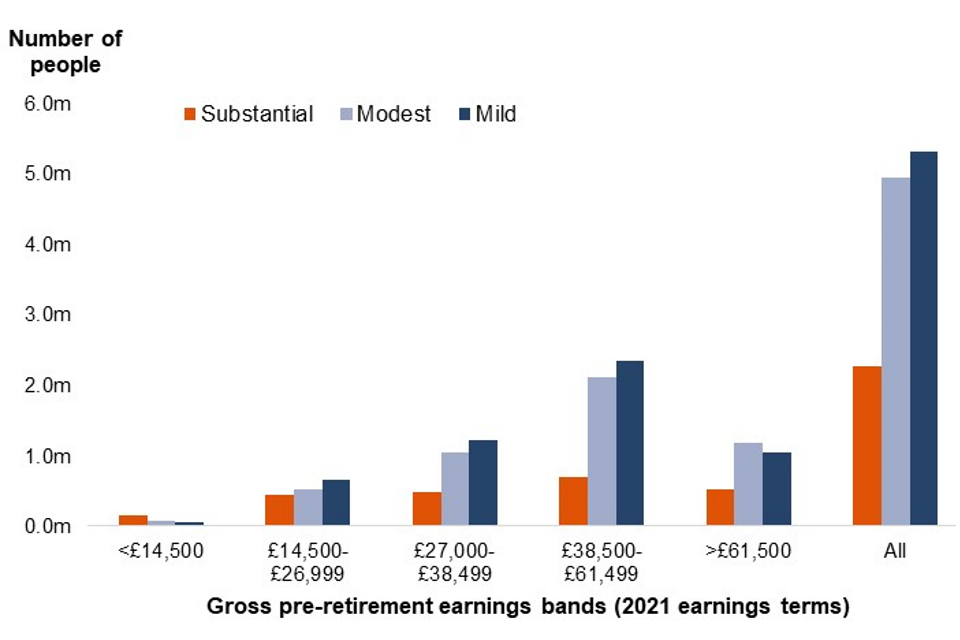
Figure 8 above shows that undersaving is concentrated in higher earners. Many people, particularly lower earners, are projected to meet their TRR with their current level of saving. Figure 9 shows the median replacement rate by pre-retirement earnings bands and how this compares to that group’s respective TRR. This shows for the four lowest earning bands, the median person is projected to replace more than their target income. However, for those in the highest earning band, the median person is projected to replace slightly less than their target income.
Figure 9: Median Actual Replacement Rate and TRR in each pre-retirement earnings band
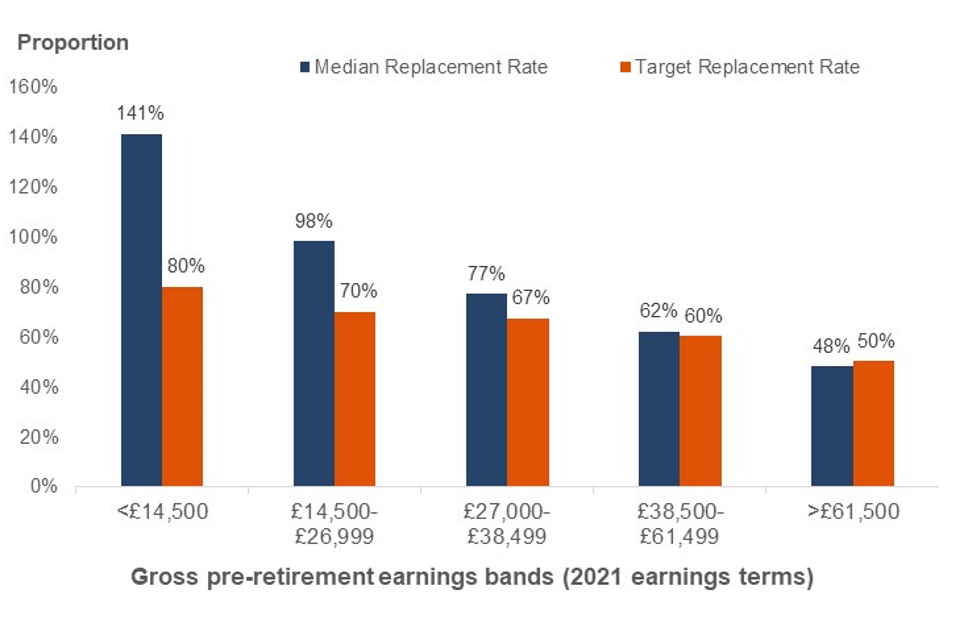
Although the median can be helpful, it does not show the distribution within earnings bands. Focussing in on the bottom two pre-retirement earnings bands (those less than £14,500 and those between £14,500 and £26,999), Figure 10 shows the distribution of actual pre-retirement earnings people are on track to replace.
Figure 10: Distribution of actual earnings replacement for the lowest earnings band (left, less than £14,500) and second lowest earnings band (right, £14,500 to £26,999)
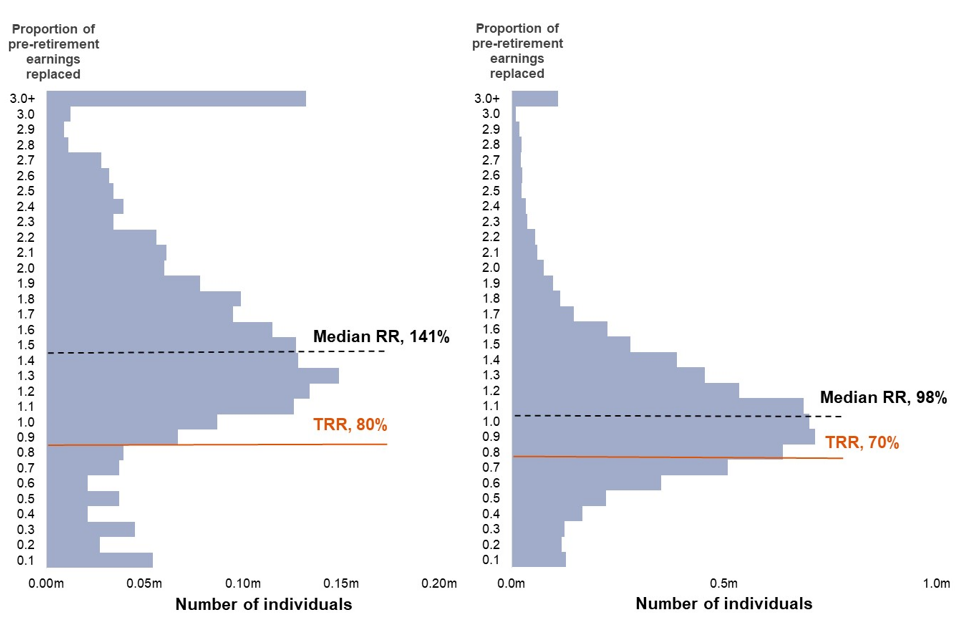
This highlights the wide disparity in saving levels across the population.
6. Interactions between adequacy measures
The results presented so far assess whether people are projected to meet their TRR or the PLSA RLS separately. This section looks at the interaction between the TRRs and PLSA RLSs to see who may meet one measure but not the other. We have used AHC TRRs to make it comparable with the PLSA measure.
Table 5 shows the number of people projected to meet their TRR but fail to meet the PLSA RLS levels. The vast majority of individuals are projected to meet at least the PLSA Minimum RLS. However, 0.3 million individuals, mainly in the lowest earnings band, are projected to have a pension income that is below the PLSA minimum RLS.
Many individuals who are projected to meet their TRR have incomes that fall below the PLSA Moderate RLS. 1.0 million (18%) people in the middle earnings band who meet their TRR do not meet the PLSA Moderate RLS increasing to 3.7 million (59%) of people in the second lowest earnings band.
Table 5: The number of working age people projected to meet their TRR but not meeting each of the PLSA RLS
| Pre-retirement earnings band | Not meeting Minimum | Not meeting Moderate | Not meeting Comfortable | Total meeting TRR |
|---|---|---|---|---|
| Less than £12,500 | .3m | 1.7m | 2.1m | 2.2m |
| £12,500 to £23,999 | <0.1m | 3.7m | 5.9m | 6.4m |
| £24,000 to £34,999 | 0.0m | 1.0m | 4.6m | 5.3m |
| £35,000 to £56,499 | 0.0m | 0.0m | 3.2m | 5.0m |
| Over £56,500 | 0.0m | 0.0m | 0.3m | 1.2m |
| All individuals | 0.3m | 6.5m | 16.0m | 20.1m |
Table 6 shows the number of people projected to not meet their TRR and who do not meet the PLSA RLS levels. All individuals in the lowest pre-retirement earnings band are projected to have pension incomes below the PLSA Minimum RLS. Across all pre-retirement earnings bands, the majority of people (9.8 million out of 13.0 million) have projected incomes below the PLSA moderate RLS. However, this means approximately 3.2 million people are projected to have incomes that meet the PLSA Moderate or Comfortable RLS, despite not meeting their TRR. This highlights the importance of using multiple measures when considering adequacy of future pension income.
Table 6: The number of people projected to not meet their TRR and not meeting each of the PLSA RLS
| Pre-retirement earnings band | Not meeting Minimum | Not meeting Moderate | Not meeting Comfortable | Total not meeting TRR |
|---|---|---|---|---|
| Less than £12,500 | 0.5m | 0.5m | 0.5m | 0.5m |
| £12,500 to £23,999 | 1.3m | 2.1m | 2.1m | 2.1m |
| £24,000 to £34,999 | 0.7m | 3.4m | 3.5m | 3.5m |
| £35,000 to £56,499 | 0.5m | 3.3m | 5.2m | 5.2m |
| Over £56,500 | 0.1m | 0.6m | 1.7m | 1.8m |
| All individuals | 3.1m | 9.8m | 12.9m | 13.0m |
7. Measuring adequacy of future pensioner incomes
Any assessment of the adequacy of future pensioner income is subjective. What an individual may need, or want, in retirement is highly dependent on their own individual preference and expectations. Therefore, when measuring the level of undersaving in the current working age population it is important to be aware that estimates can change based on the methodology, the measure used, and the assumptions made.
This analysis primarily focuses on what state and private pension income will achieve in retirement. However, DWP’s recent study (Planning and Preparing for Later Life (PPLL) 2022) found many individuals plan on using other sources of income to support in retirement.
Factors that influence saving by individuals during the course of their working lives will impact on the adequacy of their pension income, for example:
- taking time out of the labour market, including leaving work before SPa – this is often an issue for those with lower incomes
- not saving into a pension whilst in work – though pension participation has been high and opt-outs low under AE
- not contributing enough into a pension when saving
As described above, replacement rates are based on the assumption that a pensioner would want to maintain the same standard of living in retirement that they had during their working life, and they would need to maintain a level of pension income related to their pre-retirement earnings. DWP’s Analytical Report of the 2017 AE review stated the following reasoning behind using this method which still stands today:
Given that the fundamental purpose of pension systems is to replace income in retirement, a starting point for analysis is to look at income to assess the adequacy of saving. The majority of individuals would not be satisfied with simply receiving a basic minimum level of income, so it is important to estimate what level of income allows people to maintain the same standard of living in retirement.
DWP’s Analytical Report of the 2017 AE review also provided an overview of alternative approaches of measuring adequacy and the pensions industry has continued to develop approaches. For example:
The Joseph Rowntree Foundation Minimum Income Standard (JRF MIS) is an expenditure-based measure which determines the amount of expenditure required for a socially acceptable minimum standard of living sometimes referred to as a ‘basket of goods’ measure. However, it may not be considered as adequate for individuals who have enjoyed higher pre-retirement and could result in higher earners and having to reduce their living standards in retirement.
The Pensions and Lifetime Savings Association (PLSA) Retirement Living Standards published in 2019 go above the JRF MIS and include a ‘Moderate’ and ‘Comfortable’ standard of living for retirees in the UK. The standards help individuals picture what kind of lifestyle they could have or may want in retirement.
DWP welcome the number of developments in industry to help people save for their retirement. The analysis highlights that there is no perfect measure of adequacy of future pension incomes and provides support for there being multiple measures which help to identify key groups who are most at risk of undersaving.
8. About these statistics
The analysis used in this report assesses the adequacy of pension incomes by modelling TRRs for simulated individuals and comparing pension income to the PLSA RLSs. All estimates can be found in the published data spreadsheet.
There are 33.1 million individuals included in the analysis when measuring adequacy using TRRs and 34.7 million when using PLSA RLS. This will be less than the current 22-SPa population as some individuals are excluded from the analysis. This includes individuals that are modelled as not reaching SPa (either through emigration or death) or have no earnings between ages 50 and SPa. Individuals whose average income between 50 and SPa is below the Guaranteed Credit level were excluded when measuring against the TRR’s as we assume their in-work earnings would be 100% replaced by Pension Credit. These individuals are included when measuring against the PLSA RLS. We may be underestimating these individuals’ total income as we exclude means-tested benefits. However, we do not expect this to make a material difference to who is meeting each living standard.
Replacement rates measure income in retirement as a percentage of income in work. In the analysis, pre-retirement earnings are calculated as the average earnings from age 50 until SPa over the period they are employed or self-employed. Pension income is calculated as the income from State Pension age onwards averaged over the whole of retirement. The same definition of pension income is used when comparing to the PLSA RLS.
Pre-retirement earnings
Pre-retirement earnings:
- income is put in constant earnings terms before averaging over 50-SPa
- income is gross of tax, and of pension contributions
- only income from earnings (including self-employment) is included – income from benefits, tax credits, and pensions received before SPa are excluded
- when comparing against TRRs, the methodology is effectively looking at whether pension income will replace earnings
- when comparing against the PLSA RLS, the methodology is looking at whether pension income will meet each standard
- only years with positive earnings are included in the calculation of pre-retirement earnings. So, someone who stops work at 55 will have the same average pre-retirement earnings as someone earning the same amount who continues to work up to SPa
- for couples, average pre-retirement earnings is calculated separately for both members, summed, then equivalised (see income equivalisation)
Pension income
Pension income:
- income is in constant price terms before averaging over whole of retirement
- income is gross of tax
- income includes State Pension and private pension income
- income from means tested benefits such as Pension Credit and disability benefits is excluded
- State Pension is uprated using the triple lock
- while financial wealth is not modelled directly, an amount is imputed and then annuitised based on Wealth and Assets Survey data. Other forms of individual or household wealth (for example, property wealth) are not included
- only income received after SPa is considered for the analysis
- for couples, their pension income is equivalised on a year-by-year basis, and then averaged across retirement for the members of the couple separately. This means that the members of a couple can have different replacement rates as they have different lengths of retirement. They could also achieve different standards of living as measured by PLSA RLS
For replacement rates, each individual’s replacement rate is compared to a benchmark to determine whether it is adequate. The benchmark from the 2004 Pensions Commission report is used, with the earnings thresholds which they apply adjusted for earnings growth (See Table 7).
Replacement rates can also be calculated before or after housing costs have been deducted from both pre-retirement earnings and pension income.
For the AHC measure, the Pensions Commission TRRs have been adjusted to reflect the impact of different housing costs between working life and retirement. Using the Family Resources Survey, for each earnings band average housing costs (net of housing benefits) are deducted during working life and retirement and the replacement rate is adjusted accordingly in order to obtain an AHC set of target replacement rates. Effectively, this means that those who rent during retirement will be required to reach a higher replacement rate than someone with equivalent income who is an owner occupier, as the renter will need to meet higher housing costs.
Table 7: Target Replacement Rate and Pre-retirement earnings bands
| Gross Pre-retirement (50-SPa) Earnings | Pension Commission (2004) | BHC Thresholds 2021 earnings | BHC Target RR | AHC Thresholds 2021 earnings | AHC Target RR |
|---|---|---|---|---|---|
| Band 1 | Less than £9,500 | Less than £14,500 | 80% | Less than £12,500 | 84% |
| Band 2 | £9,500 to £17,500 | £14,500-£26,999 | 70% | £12,500 to £23,999 | 75% |
| Band 3 | £17,500 to £25,000 | £27,000-£38,499 | 67% | £24,000 to £34,999 | 71% |
| Band 4 | £25,000 to £40,000 | £38,500-£61,499 | 60% | £35,000 to £56,499 | 63% |
| Band 5 | Over £40,000 | Over £61,500 | 50% | Over £56,500 | 53% |
The PLSA RLS have recently been updated in January 2023. However, this analysis compares pension income against the 2021 Standards. This is to be consistent with assumptions in the latest version of Pensim3. Although the PLSA RLS have separate standards for London and outside of London, our modelling assesses at a national level. We therefore assess individuals against the outside of London standards. As the present analysis uses gross pension income, the PLSA standards have been adjusted to allow for comparison. We used the single pensioner total income pre-tax as the benchmark Retirement Living Standards (PDF).
When measuring undersaving using PLSA’s RLS we have compared pension income AHC as the standards assume people are mortgage and rent free.
Table 8: PLSA Retirement Living Standards 2021 (outside of London)
| Minimum | Moderate | Comfortable | |
|---|---|---|---|
| Single (Expenditure) | £10,900 | £20,800 | £33,600 |
| Single (Total income pre-tax) | £10,900 | £22,860 | £38,860 |
| Couples (Expenditure) | £16,700 | £30,600 | £49,700 |
| Couples (Total income pre-tax) | £16,700 | £31,966 | £55,840 |
Income equivalisation
When two adults live together in a couple, they usually benefit from economies of scale in their normal living costs. For example, it is expected that two adults will pay a rent or mortgage that is less than twice as much what each of them would pay if living separately. The same applies to other normal living costs (transport, utilities, etc).
Income equivalisation is a technique that recognises these economies of scale and adjusts a couple’s income accordingly. For example, in the analysis without housing costs, each individual in a couple is assigned an income equal to 67% of the whole couple’s income. When housing costs are subtracted, each individual in a couple is assigned an income equal to 58% of the whole couple’s income.
In both cases, the total income assigned to the couple exceeds 100% of the actual nominal income, reflecting the fact that when in a couple, each pound ‘goes further’ due to economies of scale.
Key assumptions
The analysis is shaped by methodological choices and the capacity of the modelling tools. Assumptions about inflation, earnings growth and the labour market are consistent with assumptions from the Office for Budget Responsibility 2022 Fiscal Sustainability Report.
In DC schemes, it is assumed that 15% of those automatically enrolled who remain in their job until the end of the financial year will no longer be contributing to a pension at the end of the financial year. This assumption aims to capture those choosing to opt out and those choosing to cease saving for reasons other than leaving their job or dying. Analysis presented in DWP’s 2014 report: ‘Scenario analysis of future pension incomes’ suggests that the proportion of people undersaving is relatively insensitive to changes in this assumption. They reported that an increase from 15% to 40% would increase undersaving by one percentage point.
For DC pension schemes the contribution rates are decided on a probability distribution. The employer contribution rate ranges between 3% and 15%. The employer contribution rate then feeds into deciding the employee contribution rate, which range between 5% and 10%. Higher employee contributions tend to be correlated with higher employer contributions.
Annual management charges are derived from a probability distribution. For workplace schemes these are capped at 0.75%.
It is assumed that 94% of annuities purchased are flat rate, the remaining 6% are linked to the Retail Price Index (RPI). The annuity rate an individual receives depends on the type of annuity they purchase, their age and the year the annuity is taken. It is assumed that as life expectancy increases, annuity rates decrease.
For the bulk of the analysis undertaken in the review DC schemes have an assumed range of investment fund growth from RPI + 2.2% to RPI + 3.5%. RPI is modelled as 2.9% based on previous OBR long-term forecasts.
In Pensim3, housing tenure type is assigned when an individual turns 60. This is done using an alignment to ensure that the proportion getting assigned to each housing tenure type matches the proportion in the population.
There is always a degree of uncertainty in long term modelling, both for DWP and external analysis. We have therefore carried out tests to assess how sensitive the conclusions are to changes in assumptions for example:
-
Annuity rates – we tested the sensitivity of the undersaving estimates to annuity rates given that we see movement in annuity rates over time. Increasing annuity rates by 2 percentage points led to a 5 percentage point decrease in the level of undersaving using TRRs (BHC). Reducing the rates by 2 percentage points led to the same change in the opposite direction.
-
Fund growth – we tested the sensitivity of the undersaving estimates to fund growth assumptions by reducing them by 0.7 percentage points. That led to an increase of 1.4 percentage points in the level of undersaving using TRRs (BHC) and no change in the proportion of people estimated to not meet the PLSA Minimum RLS.
9. Statement of compliance with the Code of Practice for Statistics
The Code of Practice for Statistics (the Code) is built around 3 main concepts, or pillars:
- trustworthiness – is about having confidence in the people and organisations that publish statistics
- quality – is about using data and methods that produce statistics
- value – is about publishing statistics that support society’s needs
The following explains how we have applied the pillars of the code in a proportionate way.
Trustworthiness
These figures have been published to provide an updated estimate of the number and proportion of people undersaving for retirement. They are being released now to ensure equal access to the analysis.
Quality
Future pension incomes are modelled using DWP’s long-term dynamic microsimulation model, now referred to as Pensim3. The model has been through extensive development to ensure it is using the latest available data to underpin its assumptions. The methodology and calculations in this analysis have been quality assured by DWP analysts to ensure they are robust.
Value
Releasing these estimates provides the public and user organisations with up-to-date estimates on the adequacy of future pension incomes, which were last published in 2017. The estimates also add value to DWP’s response to the Work and Pension Select Committee enquiry ‘Saving for Later Life’ published in January 2023. Making this information accessible helps reduce the administrative burden of answering Parliamentary Questions, Freedom of Information requests and ad hoc queries about pension adequacy.
Authors
Rebecca Haynes, Pensions & Later Life Analysis, DWP
Sarah-Kate O’Grady, Pensions & Later Life Analysis, DWP
-
The Pensions Commission (2004) Pensions Challenges and Choices HMSO. ↩
-
TRR total N and PLSA total N refer to the total number of individuals with this characteristic and the total number of individuals in the population. ↩
-
The high proportion of households projected to have some form of DB pension income is likely driven by the number of public sector workers in the model who are much more likely to be participating in a DB scheme. Public sector workers made up 17.6% of the workforce in 2022 Q3. Public sector employment as % of total employment; UK; HC; NSA; percentage - Office for National Statistics (ons.gov.uk). ↩