Planning and Preparing for Later Life
Updated 8 November 2022

© Crown copyright 2022
This publication is licensed under the terms of the Open Government Licence v3.0 except where otherwise stated. To view this licence, visit nationalarchives.gov.uk/doc/open-government-licence/version/3 or write to the Information Policy Team, The National Archives, Kew, London TW9 4DU, or email: psi@nationalarchives.gov.uk.
Where we have identified any third party copyright information you will need to obtain permission from the copyright holders concerned.
This publication is available at https://www.gov.uk/government/publications/planning-and-preparing-for-later-life/planning-and-preparing-for-later-life
Planning and Preparing for Later Life
Findings from the 2020/21 survey
Publication date June 2022
DWP research report no. 1008.
A report of research carried out by National Centre for Social Research (NatCen) on behalf of the Department for Work and Pensions.
Crown copyright 2022.
You may re-use this information (not including logos) free of charge in any format or medium, under the terms of the Open Government Licence
Or write to:
Information Policy Team
The National Archives
Kew
London
TW9 4DU
Email: psi@nationalarchives.gov.uk
This document/publication is also available on GOV.UK
If you would like to know more about DWP research, email: socialresearch@dwp.gov.uk
First published June 2022.
ISBN 978-1-78659-393-1
Views expressed in this report are not necessarily those of the Department for Work and Pensions or any other government department.
Executive Summary
The question of whether and how people are planning for retirement is becoming ever more important as people live longer and have greater freedom over when and how they retire and take their pensions. Planning and Preparing for Later Life (PPLL) is a new, nationally representative survey of 2,655 40-75 year olds commissioned by the Department for Work and Pensions to provide evidence on how far individuals are able to make well informed choices about retirement and whether they will be in a position to enjoy financial security when they retire.
The survey includes findings on:
- income adequacy in retirement. Whilst most people had started saving for retirement, nearly one in four (24%) of 40-75 year olds did not have a private pension and 16% had not yet started saving for retirement. Those that had started saving did not always know if what they had saved would give them the income they would need income in retirement. Only 23% of people not yet retired said they had a very good idea of the income they would need in retirement
- how people had taken advantage of Pensions Freedoms to access their Defined Contribution (DC) pensions. Over half (56%) of 60-65 year olds with a DC pension had accessed at least one pension. Nearly three in ten people (29%) who had accessed a DC pension had not received information, advice or guidance from their pension provider, Pension Wise or a financial advisor. Most people (67%) chose to take a cash lump sum with some doing so to meet short-term income needs including covering living costs or paying off debts. Many people (59%) who accessed their DC pension before State Pension age (SPa) had no other private pension provision, making their decisions about how to access their pension particularly important
- people’s knowledge of recent changes to the State Pension. Although not everyone correctly identified their SPa, only 20% of people below SPa thought they would be able to draw their State Pension earlier than is the case. People who had used the Check your State Pension website were more likely to correctly identify their SPa. However, people for whom the State Pension was their only source of income in retirement were least likely to have used the site and were among the least knowledgeable
- what would make it easier for people to continue working later in life. Most people (62%) who had not yet retired expected to continue in paid work beyond their ideal retirement age. Key factors for helping them to work longer – and fund their retirement - were the ability to work flexibly and the potential to work fewer hours as they approach retirement
- experiences of planning for retirement among the self-employed. The self-employed were less likely to have started saving for retirement, less likely to have a pension (65%), and to be more reliant on sources of non-pension income to fund retirement. They expected to retire later than employees for financial reasons but also because they wanted to retire later, enjoying the flexibility their self-employment afforded and with a preference for remaining self-employed
Acknowledgements
This research was commissioned by Department for Work and Pensions (DWP) and was carried out by the National Centre for Social Research (NatCen) in collaboration with the Institute for Employment Studies and Pensions Policy Institute. The authors would like to thank Hannah McLennan, Sarah Kate O’Grady and Rhian Eveleigh at DWP for their suggestions and encouragement throughout the project.
The successful delivery of the project at NatCen relied on input from a wide range of people, in particular project manager Emma Fenn, survey programmer Nafiis Boodhumeah, data managers Migle Aleksejunaite and Jessica Messling, statisticians James Yarde and Rebecca Steinbach, Telephone Unit manager Sonia Shirvington and all the interviewers working on the project. Researchers Alun Humphrey and Shane Howe also worked on the project and Emma Berteen, Jo D’ardenne, Natasha Phillips and Ruxandra Comanaru contributed to questionnaire development and cognitive testing.
Rosie Gloster from the Institute for Employment Studies and Daniela Silcock and Lauren Wilkinson from the Pensions Policy Institute provide invaluable advice at various stages of the project, especially around questionnaire design and reporting. Elizabeth Clery worked closely with NatCen on the design of the questionnaire.
Last but not least, we want to thank our respondents who gave up their time to take part in the survey.
Author details
Sarah Butt is a Research Director at NatCen and was the lead researcher on this study.
Victoria Ratti is a Senior Researcher at NatCen and contributed to analysis and reporting.
Benjamin Swannell is a Senior Researcher at NatCen and was involved in both the design of the survey and analysis and reporting.
Eleanor Woolfe is a Research Assistant at NatCen and contributed to analysis and reporting.
Glossary
| Term | Definition |
|---|---|
| 50 Plus | Choices This strategy builds on work done as part of the Fuller Working Lives initiative. It was developed in partnership with employers and provides recommendations around the retention and recruitment of older workers aged 50 and over. The strategy includes recommendations around encouraging flexible working and ensuring that older workers are given access to training, as well as encouraging active knowledge transfer between generations. Employers are also encouraged to provide retirement transition preparation for employees. |
| Accumulation | The phase during which a consumer saves into a pension pot during their working career to build up funds for retirement. |
| Annuity | A form of insurance policy that consumers can buy with their pension pot. This will typically provide the consumer with a guaranteed income for life, or for a fixed number of years. |
| Automatic enrolment | A legal requirement that every employer must automatically enrol its workers into a quantifying pension scheme subject to certain criteria. Employers have gradually enrolled all eligible workers into qualifying pension schemes between 2012 and 2018. |
| Decumulation | Commonly understood, decumulation means the process of converting pension savings into a retirement income. This refers to the process of using savings to provide income in a specific form (for example, converting pension savings into an annuity) or where the individual has reached a specific milestone e.g. a set retirement age for drawing down their pension. However, since the introduction of Pension Freedoms in 2015, decumulation can be defined more broadly as the process of converting or using pension savings to fund choice in later life. |
| Defined Benefit (DB) | A scheme in which the benefits are defined in the scheme rules and build up regardless of the contributions paid and investment returns. The benefits are most commonly related to members’ earnings at the point they leave the scheme or retire, and the length of their pensionable service. These are also known as ‘final salary’ or ‘salary-related’ schemes. DB benefits are guaranteed or underwritten by the sponsoring employer. |
| Defined Contribution (DC) | A scheme in which a member’s benefits are determined by the value of the pension fund. The value of the fund at any time depends on contributions and performance of investments. |
| Income Drawdown | Flexi-access income drawdown products involve investing a pension pot into a fund or funds which allow the consumer flexible access. The consumer can withdraw funds when they want and use this as an income. Income drawdown providers offer a range of different funds, with different investment objectives, risks, and levels of charges. |
| Pension Freedoms | In April 2015, the tax rules were changed to give people with DC pensions greater flexibility to access their pension savings. Individuals aged 55 and over were able to choose how and when they accessed their pension savings. These withdrawals count as income being taxed at marginal income tax rates rather than the previous rate of 55% (though tax-free lump sum continues to be available). To support their decisions, individuals have access to free and impartial guidance via the phone or face-to-face, through Pension Wise, to help them make the choices that reflect their needs in retirement. These include six options - leaving the pension pot untouched, purchasing an annuity, getting an adjustable income (Flexi Access Drawdown), taking cash in chunks (Uncrystallised Funds Pension Lump Sum), cashing in the whole pot in one go and mixing any of the above options. |
| Pension wake-up packs | This is a term used within the pensions industry to refer to the retirement options packs pension providers are required to send to people 4-6 months before their agreed pension age. Packs are aimed at ensuring people receive timely, relevant and adequate information about their retirement options to enable them to make an informed decision about accessing their pension savings. They have been in place since 1987. The Financial Conduct Authority introduced new one-page summary wake-up packs in November 2019. However, these only apply to contract-based i.e. personal pension schemes. |
| Pension Wise | A free and impartial service set up by the Government in 2015 offering guidance for people regarding Pension Freedoms introduced in the 2014 UK budget. Pension Wise guidance is now run by the Money and Pension Service. The service is available to people aged 50 years and over with a DC pension to help them understand what they can do with their pension pot(s). Guidance is delivered via telephone, face to face appointments or online. |
| State Pension Age (SPa) | The age at which an individual can claim their State Pension. |
| State Pension Amount | The amount received from the State Pension. The new State Pension (nSP) replaces the basic State Pension (bSP) and additional State Pension for men born after 6 April 1951 and women born after 6 April 1953. The full rate of the new State Pension was £175.20 per week in 2020/21. However, the amount an individual receives is based on their own National Insurance record. Transitional rules are in place for those who reach their State Pension age in the early years of the new State Pension. This means that they may receive an amount that is more than, less than or equal to the full rate of the new State Pension based on their National Insurance record. |
| The midlife MOT | A free online support tool to encourage more active planning by people in their 40s, 50s and 60s in the key areas of work and skills, health and wellbeing and finances. Employers are encouraged to promote the midlife MOT tool to their employees and to have follow-up conversations. |
Summary
The question of whether and how people are planning for retirement is one which is becoming ever more important. Increasing numbers of people are both reaching and living longer beyond State Pension age. Policy changes around retirement and pensions such as the abolition of the statutory retirement age in 2011 and the introduction of Pension Freedoms in 2015 give people greater freedom over when and how they retire and take their pension. This in turn puts more onus on individuals to take decisions about their retirement.
The Department for Work and Pensions commissioned Planning and Preparing for Later Life (PPLL) to provide evidence on how far individuals are able to make well informed choices about how and when to retire and whether they will be in a position to enjoy financial security when they do. PPLL is a new, nationally representative survey of 40-75 year olds in Great Britain. The survey had four main objectives:
- to provide evidence to support policy development around income adequacy in retirement
- to gather evidence to inform the 50 Plus: Choices strategy (previously Fuller Working Lives) specifically its focus on measures that allow and encourage people to stay in work for longer
- to understand the impact of the new pensions’ flexibilities on attitudes and behaviours around pension saving and planning for later life
- to develop the evidence base around the self-employed and planning for later life.
Data was collected from 2,655 individuals aged 40-75 interviewed via telephone between November 2020 and February 2021.
Fieldwork took place against the backdrop of the COVID-19 pandemic. The survey was not designed to explore whether and how COVID-19 may have affected people’s plans for retirement. However, it is possible that the pandemic may have had an impact on people’s current circumstances and expectations for the future and that some findings may have been different had the survey been conducted 12 months earlier.
People’s financial preparedness for retirement
Most people had made at least some provision for ensuring they have an income in retirement. Sixty-three percent had started saving for retirement by their 30s whilst 55% of those not yet retired were currently saving into a pension. Around three in four (76%) of 40-75 year olds had a private pension.
Those currently on low incomes and/or not in employment are likely to be particularly financially vulnerable in retirement and may require further support. Only 48% of those not yet retired and on incomes less than £10,500 (many of whom would not meet the threshold for automatic enrolment) and 51% of those not in paid work had a private pension. Not being able to afford to make contributions was the most common reason given for not having a pension (cited by 53% of people without a pension). Those without a private pension were also less likely to have access to other sources of income to fund their retirement, such as savings or property and were particularly likely to be dependent on the State Pension.
People who had started saving for retirement had not necessarily thought in detail about how much income they will need in retirement or whether their current level of saving is sufficient to achieve that. Only 23% of people who had not yet retired said they had a very good idea of the income they would need in retirement whilst 16% could not say how much income they expected to receive in retirement. One in four people saving into a workplace pension did not know the rate of their contributions whilst one in five people with a Defined Contribution (DC) pension in accumulation did not know the size of any of their pension pots.
Nearly half (45%) of all private pension holders expected less than half of their income in retirement to come from their private pension(s), also relying on the State Pension and other sources of non-pension income such as savings or property. However, non-retirees may be placing too much expectation on sources of non-pension income. As many as 64% of non-retirees expected to use savings and investment in retirement compared with 53% of people who had fully retired who had used these sources. Similarly, 26% of non-retirees expected to use equity release and 22% expected to have income from an inheritance. The corresponding figures among fully retired respondents who had used these sources were 6% and 15%.
People’s response to Pension Freedoms
Following the introduction of Pensions Freedom legislation in 2015, people can now access their DC pensions at the age of 55 and have a range of options available to them regarding how to access their pension.
The majority of pension holders will be affected by Pension Freedoms in the future. Seventy-two percent of pension holders had a DC pension and 54% had only DC pensions with no Defined Benefit provision. These DC pension holders will include people auto-enrolled in workplace pensions who may not have previous experience of saving or investment and so who may particularly benefit from support in navigating the choices available to them.
Many people had taken advantage of Pension Freedoms to access their pension before they reach State Pension age (SPa). Fifty-seven percent of 60-65 year olds with a DC pension had accessed at least one pension. The median age at which DC pension pots were accessed was 60. Twenty-three percent of those 55+ who had accessed a DC pension were still doing some paid work.
Many people (59%) who chose to access their DC pension before their SPa did not have other private pension provision available. Most of these people (71%) were no longer in employment and so no longer had access to income from earnings. Depending on the choices these people make regarding their DC pension this potentially puts these people at risk of depleting their pension pot before the end of their retirement.
Most people who accessed a DC pension received information, advice or guidance from a financial advisor, their pension provider or Pension Wise before doing so (71%). Around one in eight (13%) had received no information, advice or guidance at all. A further one in six (16%) had received it but not from their pension provider or Pension Wise or a financial advisor. Where people had used these sources, they were generally positive about them; 76% of Pension Wise users said they were very or quite satisfied with the service.
When accessing their DC pension many people (67%) chose to take a cash lump sum. For some, this money was used to cover living costs (38% of pensions) or pay off debt (31%). People on low incomes, who were also less likely to have access to other sources of non-pension wealth in retirement, were particularly likely to have accessed their DC pension. However, using private pensions to meet short-term income needs may mean that people have reduced income later in life and are dependent on income from other sources, particularly the State Pension.
Nearly everyone (92%) who had taken a lump sum since 2015 said they were happy with this decision, including 66% who were very satisfied. However, whether this will change over time, as people experience the consequences of having cashed in some or all of their pension, will need to be reviewed.
The importance of the State Pension
Most people who have not yet retired (89%) expected to make use of the State Pension as a source of income in retirement. Only six percent of all 40-75 year olds expected the State Pension to be their only source of income in retirement. However, this figure rises to 24% of those without a private pension.
Two in five of those who had not yet retired (40%) expected to retire by the age of 65, which is below the current SPa. Expectations of “early” retirement were more common among higher earners who in turn are less likely to be depending on the State Pension to fund their retirement. However, 36% of people earning less than £10,500 expected to retire by the age of 65, potentially leaving this group – who were among the least likely to have a pension or other sources of income in retirement- without valuable income upon retirement.
Although not everyone was aware of recent changes in the SPa and how this might affect them, a majority (56%) correctly identified their SPa. Only 20% of people below SPa thought they would be able to draw their State Pension earlier than they will. Those who did underestimate their SPa did so by an average of 3 years.
People who had used the Check Your State Pension website to check their SPa or State Pension amount were more likely to give a correct answer. However, only around half of those below SPa (51%) reported that they had checked their retirement age whilst two in five (40%) had checked the amount of State Pension they would receive. People for whom the State Pension was the only source of income in retirement, and therefore for whom an awareness of what they would receive and when could be considered most important, were least likely to have checked details of their state pension and were among the least knowledgeable.
Supporting paid work in later life
Most people (62%) who had not yet retired expected to continue in paid work beyond their ideal retirement age with only one in four (26%) saying they expected to retire at their ideal age. More positively, only four percent of those not yet retired expected to retire before their ideal age. This compares with 31% of those already retired who had stopped work before their ideal age.
When asked what would help them keep working longer, key factors were the ability to work flexibly (mentioned by 44%) and the potential to work fewer hours as they approach retirement (52%). However, delivering on flexible working and reduced hours presents challenges for employers and policy makers. The evidence showed that access to flexible working hours varied significantly by income and occupation. Whilst many people wanted to reduce their hours as they approached retirement (54%), people who had already fully retired were less likely to say they had actually done this (34%).
Certain groups, including those with caring responsibilities or health concerns, may require additional support to continue working longer. These two groups were among the most likely to have requested a change in their working arrangements from their employer in the past five years (with 26% of carers and 35% of those rating their health less than good having done so). “Workplace adjustments for a health condition or disability”, rather than flexible working or reduced hours, was the most commonly cited factor among people in bad health when asked what would help them keep working longer.
Ensuring that workers continue to have access to training as they get older is also important. Although less likely to want training than their younger counterparts, there is still an active demand for workplace training among older workers; 36% of 55-59 year olds and 26% of 60-65 year olds in paid work would like more training.
There is still more work to do to ensure that older workers feel treated equally; although only three percent said they had actively experienced discrimination at work as a result of their age, 22% of those not yet retired mentioned a change in workplace attitudes towards older workers as something which would help them to keep working longer.
There is scope to improve the guidance offered to people planning their transition from work to retirement, including through further promotion of the midlife MOT to all eligible groups. The Midlife MOT is a free online support tool to encourage more active planning by people in their 40s, 50s and 60s in the key areas of work and skills, health and wellbeing and finances. Only six percent of people who had not yet retired had heard of the midlife MOT (which came into being in February 2019) but, once the tool was explained to them, 47% of those who had not previously heard of it said they would make use of the tool.
Planning for later life among the self-employed
Increasing numbers of people are becoming self-employed with many opting to move into self-employment later in life. Around one in ten (11%) of 40-75 year olds were currently self-employed in some capacity and as many as 29% had experienced a period of self-employment at some point in their career. The proportion of workers currently in self-employment increased with age, with 23% of those 60-65 in paid work and 34% of those 66 and over in self-employment.
Working conditions and job flexibility were important considerations in being self-employed. The main reasons given for being in self-employment were because it was the nature of the job (45%) or as a way of earning more income (42%). However, 39% mentioned better working conditions or job satisfaction and 23% mentioned being able to fit work round caring responsibilities. Most self-employed (85%) said they would prefer to remain in self-employment rather than becoming an employee.
The self-employed were more likely than employees to expect to keep working longer with 72% of those not yet retired expecting to work after the age of 65 (compared with 57% of employees). This is likely to be driven at least in part by the need to fund retirement in the absence of pension provision. However, it is also likely to reflect greater enjoyment of/commitment to work among the self-employed. The self-employed also had a higher ideal retirement age than employees.
Saving for retirement presents a challenge for self-employed people who have access to fewer options for retirement saving and, because of greater potential fluctuations in income, are less likely to save regularly. A higher proportion of self-employed said they had not yet started saving for retirement compared with employees (22% vs 7%). Those that had started saving tended to have done so later. The self-employed were less likely than employees to have a private pension (65% vs 89%). Self-employed pension holders were most likely to hold a personal pension (61%) though 58% had a workplace pension, presumably from previous employment.
The most common reason self-employed people gave for not having a pension (mentioned by 44%) was that they would fund their retirement from other sources. The self-employed were more likely than other groups to say that they would fund their retirement from non-pension wealth, including 80% who mentioned savings or investments and 51% who mentioned support from family or friends. Only three percent of the self-employed expected to be reliant solely on the State Pension.
1. Introduction
This report presents new evidence on whether and how people aged 40 to 75 are planning and preparing for retirement. The findings are based on analysis of a representative survey of 2,655 40 to 75 year olds in Great Britain conducted between November 2020 and February 2021.
1.1. Aims of the research
The Planning and Preparing for Later Life Survey (PPLL) was commissioned by DWP to provide information on people’s attitudes and behaviours around planning for retirement. It shares some content with the previous Attitudes to Pensions series (Clery et al., 2010; McLeod et al, 2012) but is more wide ranging. It covers behaviour as well as attitudes and, crucially, looks at the experience of work in later life and the transition into retirement as well as financial planning and pensions. Saving for retirement and employment decisions are inextricably linked and it is important to be able to consider the two together.
The survey had the following objectives:
- to provide evidence to support policy development around income adequacy in retirement
- to gather evidence to inform the 50 Plus: Choices agenda (previously Fuller Working Lives), specifically its focus on measures that allow and encourage people to stay in work for longer
- to understand the impact of pension flexibilities on attitudes and behaviours around pension saving and planning for later life
- to develop the evidence base around the self-employed and planning for later life.
1.2. Policy context
The question of whether and how people are planning for retirement is one which is becoming increasingly important. First, increasing numbers of people are reaching and living beyond State Pension age (SPa). The population is ageing; the proportion of people estimated to be 65 and over is forecasted to rise from 18% in 2018 to 24% by 2037 (ONS, 2018). Average life expectancy beyond the age of 65 is expected to reach 23 years for women and 21 years for men by 2030 (ONS, 2019a). Second, policy changes around retirement and pensions such as the abolition of the statutory retirement age in 2011 and the introduction of Pension Freedoms in 2015 give people greater freedom over when and how they take their pension. This in turn puts more onus on individuals to take decisions about their retirement. The findings presented in this report contribute to the evidence base around how far individuals are able to make well informed choices about how and when to retire and will be in a position to enjoy financial security when they do.
1.2.1. The changing nature of work
People’s planning for and experiences of retirement will be closely tied up with their experience of employment and the opportunities afforded them to either continue in or transition out of paid work. Paid work represents the main way in which most people will accrue resources for retirement and helps to ensure financial security for pensioners. Increasingly, the intrinsic benefits of paid work and the health and wellbeing advantages associated with remaining in fulfilling paid work in older age, both for individuals and their employers, are also recognised (OECD, 2020).
The number of employees aged 65 and over in the UK has been increasing. There were 1.26 million people aged 65 and over in work in the period April-June 2020 (DWP, 2020a). However, labour market participation drops off sharply after the age of 50: the employment rate falls from 83% for 50-54 year olds to 56% for 60-64 year olds and just nine percent for 70-74 year olds.
The nature of work is also changing. Over the last 20 years, increasing numbers of people have become self-employed, reaching a high of 5,025 million self-employed in the last quarter of 2019 (ONS, 2021a). The COVID-19 pandemic, which began in 2020, has led to a drop in the number of self-employed, with 4.36 million self-employed in the period Jan-March 2021 compared with 4.97 million in the same period in 2020. However, the growth in self-employment in the past ten years or so has been greatest amongst older workers, such that in 2020 10% of the self-employed were over 65 (DWP, 2020a). The experience of the self-employed with regard to work and, in the absence of workplace pensions, saving for retirement is likely to be very different from that of employees.
Labour market transitions are also becoming more complex, especially following the end of the statutory retirement age in 2011. People may transition into or out of retirement or have a period of semi-retirement prior to fully retiring from work (Platts et al, 2019). Increased flexibility can bring significant benefits to both individuals and the businesses that employ them by enabling people to continue working for longer. However, flexibility also represents a risk if it leads people to cut back on work too early without considering the financial implications for their retirement. It is important that both policymakers and employers understand the needs and preferences of older workers so that they can ensure they are supported in making a successful transition from work to retirement. This is likely to be especially true in light of the COVID-19 pandemic. Older workers have found their employment situation affected by COVID-19 with 17% percent of eligible workers aged 65 and over furloughed on 31 March 2021 (HMRC, 2021). Only employees under 25 had a higher take-up rate for the Coronavirus Job Retention Scheme. Older workers, especially those with health concerns may find it particularly difficult to re-enter the labour market and may find themselves retiring earlier than they would have liked. Other people may find themselves having to postpone retirement in order to make up for lost income as a result of the pandemic (Crawford, R, and Harjalainen, H., 2020).
A number of policy initiatives have been introduced to encourage employers to better support workers as they transition to retirement. The government’s 50 Plus: Choices scheme builds on work done as part of the Fuller Working Lives initiative which was developed in partnership with employers and provided recommendations around the retention and recruitment of older workers aged 50 and over (DWP, 2017). These included recommendations around encouraging flexible working and ensuring that older workers were given access to training, as well as encouraging active knowledge transfer between generations. Employers were also encouraged to provide retirement transition preparation for employees.
Launched in February 2019, the midlife MOT is a free online support tool to encourage more active planning by people in their 40s, 50s and 60s in the key areas of work and skills, health and wellbeing and finances. Employers are encouraged to promote the midlife MOT tool to their employees and to have follow-up conversations. This study (hereafter referred to as PPLL) will contribute to the evidence on how best to support workers in the run up to retirement. It will explore experiences of work among 40-75 year olds and how these vary by age, what it is people want out of work as they approach retirement and what, if anything, may encourage or enable people to keep working for longer or return to the workforce later in life. It will also pay particular attention to the experiences of the self-employed and how they may best be supported to plan for retirement.
1.2.2. Pension reform
Both the State Pension and the private pension sector have undergone significant reform in recent years. There has been an incremental increase in the SPa, with the retirement age for women in line with that of men from 2018, and the SPa for both men and women set to increase to 67 by 2028. In 2016 the new State Pension was launched. This pension is flat rate and single tier, based on an individual’s National Insurance record. The two tier system comprising a basic State Pension and then a second State Pension related to earnings has been phased out. PPLL will help to provide evidence on the extent to which people are aware of these changes in the State Pension and how they will affect them in retirement.
Employers are now required to automatically enrol eligible employees in a suitable workplace pension and make a minimum level of contributions. The introduction of automatic enrolment has increased the proportion of people saving into a workplace pension; since 2012, over 10 million people have been enrolled into pension saving (DWP, 2020b). However, despite an increase in minimum contribution levels introduced in 2019, there remain concerns over whether this level of contributions (8%) will be sufficient to enable people to maintain their standard of living in retirement (PPI, 2020). Younger cohorts are likely to be especially reliant on their Defined Contribution (DC) pension contributions to fund retirement as they are less likely to have accumulated other sources of wealth, for example through housing, than older cohorts. Research by IFS (IFS, 2016) found that individuals who were born in the early 1980s had accumulated approximately only half of the average wealth holdings of the 1970s cohort at the same age. PPLL examines people’s expectations around the level and sources of income they will have available in retirement.
Perhaps the biggest change to the private pensions market is the introduction of Pension Freedoms in 2015. These give people with DC pensions the freedom to make withdrawals from their DC pensions from age 55 without the need to take out an annuity or incur a heavy tax penalty. Automatic enrolment has led to increased numbers of people being newly enrolled in DC pensions. More generally the private pensions market has shifted in favour of DC over Defined Benefit (DB) pensions, the latter now considered unaffordable and less suited to labour market conditions which make it less likely that individuals will remain in the same job throughout their career. In 2020 there were around 14.6 million active members in DC schemes compared to around 6.7 million active members in DB schemes across the private and public sectors (PPI, 2020). In 2020 active members of private sector DB schemes had declined to 1.0 million (Pension Protection Fund, 2020). This shift towards DC pensions means that many more people, including people auto-enrolled in pensions who may not have previous experience of saving or investment, are faced with decisions on how to optimise their pension choices under the new freedoms.
There are concerns that the new freedoms may have led people to view their pension in terms of short term consumption opportunities rather than a source of long term income in retirement (The People’s Pension, 2021). Large numbers of people are choosing to take either partial or full cash lump sums from their pensions; in 2019/20 56% of DC pensions accessed for the first time involved full cash withdrawal (FCA, 2020). Depending on how those lump sums are used, and how people choose to utilise the remainder of their pension pot, there is a risk that they will leave themselves unprovided for later in their retirement. PPLL provides an opportunity to explore who is accessing their DC pension, and how and when they do this, alongside what other provision for retirement, if any, they may have in place.
Alongside the introduction of Pension Freedoms, the government launched several new sources of information, advice and guidance to help people navigate these freedoms including Pension Wise. However, evidence from the Financial Conduct Authority’s Financial Lives 2020 survey casts doubt on the extent to which people are seeking out information to inform their choices or actively engaging with their DC pension. The survey found that 58% of those aged 45+ who were yet to retire have put little or no thought into how they will manage financially in retirement whilst 37% of those aged 45+ with a DC pension in accumulation did not understand the different options they can choose from when taking money from their pension. Over half (55%) of people with an active DC pension had low or very low levels of engagement with their pension whilst many were taking the decision to access their pension without advice (FCA, 2021). PPLL will look at the take-up and response to different information resources aimed at DC pension holders as well as potential barriers to pensions engagement, such as people finding it difficult to keep track of pensions or lack of trust in pensions.
1.2.3. The impact of COVID-19
PPLL was commissioned before the start of the COVID-19 pandemic in early 2020. The survey was not designed to explore whether and how COVID-19 may have affected people’s plans for retirement. However, fieldwork took place between November 2020 and February 2021 against the backdrop of the pandemic. Respondents were asked two very general questions about whether COVID-19 had impacted on their employment situation and their plans for retirement. Only a small proportion of people replied that this had been the case (See Chapter 2 for more details). However, it is possible that the pandemic may have had other unreported impacts on people’s current circumstances and expectations for the future and that some findings may have been different had the survey been conducted outside of the pandemic.
1.3. Methodology
More details of the survey methodology are given in Appendix 2 of this report and the separate technical report (REF). The main features of the survey are summarised here.
PPLL was originally commissioned and designed as a face to face survey. However, limitations on fieldwork as a result of the COVID-19 pandemic meant that fieldwork had to be conducted by telephone.
1.3.1. Sample
The sample for PPLL was drawn from respondents to the Family Resources Survey (FRS) 2017/18 who had agreed to be re-contacted for further research. The sample of named respondents, one per household, was designed to be representative of the population of 40 to 75 year olds in Great Britain. In households where there were multiple eligible individuals, a respondent was selected at random. As the self-employed were identified as being of particular analytic interest, those who identified as self-employed at FRS 2017/18 were assigned a boosted probability of selection to help ensure that there were sufficient numbers interviewed for the analysis.
A starting sample of 4,744 individuals was drawn, 159 of which were allocated to the pilot stage of the project. Once it became necessary to switch fieldwork to telephone mode, a top up sample comprising an additional 4,568 individuals was drawn to compensate for the lower expected response rate from telephone compared with face to face interviewing. This effectively meant that one individual from all FRS 2017/18 responding households in Great Britain with a 40-75 year old happy to be re-contacted was selected for PPLL. The only exception was a small sub-set of households that had already been invited to participate in a different research project. The final sample issued for the main survey was 9,153 individuals.
1.3.2. Questionnaire development
The questionnaire was developed in close collaboration with DWP to ensure that it met their requirements. Questions underwent both cognitive testing and piloting to ensure that they were fit for purpose. Two rounds of cognitive testing took place in early 2020; interviews were conducted with a small number of respondents to gain feedback on whether the key concepts and terminology used in the survey were being understood as intended. The full questionnaire was then piloted in September 2020 to test the survey procedures, routing and timings and check how the survey would work when carried out over the telephone. Invitations to take part in a telephone interview were sent to 159 sample members and productive interviews were achieved with 20 people. Following the pilot, which had an average interview length of nearly 1.5 hours and struggled to recruit respondents, the content of the questionnaire was reduced in consultation with DWP.
1.3.3. Fieldwork
All sample members were sent an advance letter ahead of fieldwork inviting them to take part in the survey and advising that an interviewer would call them in the next few weeks. Sample members for whom a telephone number was not available (11% of the total sample) were invited to contact a Freephone number and provide a number on which an interviewer could call them.
Interviews were conducted using Computer Assisted Telephone Interviewing (CATI) between 14th November 2020 and 7th February 2021. The average interview length was 48 minutes. A £5 Love2Shop voucher was sent to the respondent on completion of the interview as a thank you.
2,655 responses were achieved, a response rate of 29%.
1.3.4. Weighting
The survey has been weighted to ensure that findings can be generalised to the population of 40-75 year olds in Great Britain. The weights take account of differences in the probability of being selected to take part in the original survey, FRS 2017/18, as well as the probability of subsequently being selected to take part in PPLL. The sample of individuals invited to take part in PPLL was calibrated to be representative of the target population in terms of sex and age using ONS mid-year population estimates. A further stage of weighting then corrected for the fact that certain groups within the PPLL sample were more likely to respond to the survey request than others. The non-response weights accounted for differences in a range of characteristics including age, sex, region, employment status, ethnicity, housing tenure, household composition, highest educational qualification, council tax band, the National Statistics Socio-Economic Classification (NS-SEC) and population density quintile (see REF TO TECH REPORT for more details). The final weighted data were then checked against ONS mid-year population estimates and Labour Force Survey estimates to ensure that they closely resembled the target population in terms of sex and age and, for under 65s, employment and education. It is not possible to calibrate the PPLL final sample of respondents to the underlying population on all characteristics; there may be some groups, for example recent immigrants to the country or people less likely to engage with surveys, who are underrepresented. Nevertheless, the weighting strategy employed allows findings to be generalised to the population with reasonable confidence.
1.3.5. Sub-groups used in analysis
Throughout the report, findings are broken down by certain characteristics including age, gender and employment status. More details on how some of these sub-groups are defined are given below. Table A1.1 in Appendix 1 of this report shows the composition of the final weighted sample in terms of key demographics including age, gender, employment status, retirement status, income and financial literacy.
Retirement status
Findings are broken down by whether the respondent is fully retired, semi-retired or not yet retired. People under 50 were assumed to not yet be retired unless they reported their only activity in the last month as “retired”. People aged 50 and over were given the option to self-classify as either not yet retired, semi-retired or fully retired. Full retirement was defined as “not intending to do any further paid work”. Semi-retirement could involve currently doing some paid work or “not currently working but may do some paid work in the future”.
Financial literacy
Financial Literacy was measured using a shortened version of the financial literacy index originally employed in the Healthy Ageing in Scotland (HAGIS) study. The original 13-item scale was reduced to six items which have been used to measure financial literacy on other surveys including the British Election Study.
Each respondent was given a score from 0-6 depending on how many items they answered correctly. Depending on their score they were then categorised into three roughly equal-sized groups defined as high (score 5-6), medium (3-4) or low (0-2) financial literacy.
Household composition
Household composition was determined on the basis of partnership status ( that is whether the respondent was currently living with anyone as a couple) and the presence of financial dependents. Finacial dependents were any family members (not just children) who were either fully or partially financially dependent on them. The following four groups have been compared:
- single – no dependents
- single – dependents
- couple – no dependents
- couple – dependents
Occupation
Comparisons on the basis of occupation have been made using the Standard Occupational Classification 2010 (SOC 2010). Respondents have been classified according to which one of nine major groups their occupation falls into.
Semi-retired respondents in paid work were asked both about their current job and, if different, the job they were doing immediately prior to becoming semi-retired. For the purposes of analysing people’s expected retirement age (Chapter 3) or satisfaction with work and the transition to retirement (Chapter 4) occupation based on their current job is used. For the purposes of analysing people’s pension provision (Chapter 5) occupation based on job pre-retirement is used on the basis that this is likely to be the bigger influence on pension provision.
Income
The survey collected information on both the respondent’s personal income and the total income of their household. In both cases, gross income from any sources (not just earnings from employment) was measured. Both personal and household income may be important determinants of individual’s retirement planning with, for example someone who has a low personal income but shares a household with a higher earner (something which has traditionally applied to many women) potentially being in a different financial position to someone on a low income who is the sole earner in a household. Given that the survey focuses on individual decision making, the analysis is conducted using the measure of respondent’s personal income unless otherwise stated. Wider household wealth is taken into account in some analyses which explore the association with savings and tenure.
Employment status
There are two aspects to the employment status variable used for analysis; whether the respondent is in paid work and – if so – whether this is as an employee or self-employed. Anyone who reported having done any paid work in the past month was counted as being in paid work. Anyone not in paid work and under 50 was automatically considered to be not working whilst those 50+ were given the opportunity to report if they considered themselves fully retired or not. The respondent’s status as an employee or self-employed was determined by their status in what they consider to be their main job. A small number of employees may be employees in their main job whilst doing some other work as self-employed (or vice versa).
1.4. This report
1.4.1. Report outline
The report is divided into four chapters covering four aspects of retirement planning:
- knowledge and engagement around retirement planning: What sources of information do people use to help them plan for retirement? How well-informed are people about state pension arrangements? How engaged are people with their private pension arrangements?
- people’s expectations for retirement: When do they expect/want to retire? How much income do they want/expect to have? How do they expect to fund their retirement?
- transitioning from work to retirement: How satisfied are older workers with their employment circumstances? Would people like to change their working arrangements as they approach retirement? What would encourage people to keep working longer?
- pension provision: Who has a private pension? What type of pension arrangements do people have in place? How do people 55 and over make decisions around accessing their pensions?
1.4.2. Caveats to the analysis
This report is intended to document some key findings from the PPLL survey; it is not an exhaustive sourcebook of all of the survey’s findings. It covers most findings from the survey at a descriptive level, highlighting differences between key sub-groups where appropriate. In particular, the report considers how people’s experiences of and requirements around preparing for retirement may vary by characteristics including age, gender, retirement status, employment status and household composition. The role played by resources – both financial and information/ knowledge – is also considered. Many of these factors will of course be interrelated. The analysis presented in this report is cross-sectional and bivariate only, that is it looks at the relationship between two variables, for example financial literacy and whether someone has a pension, without being able to determine whether one variable necessarily causes another (rather than, for example, both variables being the result of a third variable such as income). Tables A1.2 – A1.6 in Appendix 1 demonstrate how closely age, retirement status, employment status, income and financial literacy are related. For example, the proportion of people currently on low incomes (<£10,500 per year) is higher among those not in paid work, that is either not working or fully retired. This relationship between employment and income helps to explain the higher concentration of people on high incomes among those under 55. Financial literacy is higher among people with higher incomes as well as among men compared with women.
Where questions were routed based on responses to previous questions, and so were asked of only a relatively small number of respondents, even bivariate sub-group analysis may not always have been possible.
Retirement planning is closely related to age. PPLL findings, which apply only to those aged 40-75, may therefore look somewhat different to those from other sources which cover the whole adult population.
The information on pensions reported in this survey is based on individuals’ self-reports of the pensions they hold. It should be borne in mind that people may not know or recall every detail of their pensions and PPLL is not intended to provide complete or precise estimates of people’s pension holdings. Figures presented here, for example regarding the number of pensions people hold or their pension pot size, may differ from data available from other sources such as pension providers. Nevertheless, despite some possible inaccuracies in recall, the PPLL pensions data provide a valuable opportunity to evaluate how much people know/can report regarding their pensions and to explore how people’s pension saving may be related to a wide range of other factors including their personal, family and employment situation.
1.4.3. Reporting conventions
Where the report discusses differences between groups defined by a particular characteristic (such as age or sex) on a particular measure, the differences can be assumed to be statistically significant at the 5% level unless otherwise stated. Some findings which are significant only at the 10% level due to small base sizes, have been reported. Where this is the case, it has been noted in a footnote.
The statistical tests used only allow us to identify whether the relationship between two variables is significant overall. Multiple tests of significance between different categories of a variable were not performed. For example, a passage which reports that saving increased with age may illustrate this by saying x% of 40-49 year olds had savings compared with y% of those 65+. The overall relationship between age and savings will have been tested for statistical significance but the specific difference between x% and y% will not have been tested separately.
Numbers quoted in the text or displayed in figures which combine two or more answer categories are calculated based on unrounded numbers and so may differ slightly from the rounded numbers shown in the accompanying tables. Don’t know and refusal responses are excluded from table bases unless otherwise stated. This may mean that the bases shown in tables for sub-groups will not always sum to the base shown in the total column. For the same reason, tables with the same base description, for example “All respondents” may include different numbers of respondents.
Percentages less than 0.5% are shown in tables with a *. ‘0‘ indicates that no one selected that response option. Numbers shown in [ ] were calculated on a base size of less than 50.
2. Planning for retirement
2.1. Introduction
This chapter looks at the extent to which people actively engage in planning and preparing for their retirement. It explores the sources of information, advice or guidance, if any, they have used to plan for their retirement, the age at which people start planning for their retirement and the factors they consider when doing so.
Recognising the importance of retirement planning, the government has introduced a number of initiatives to help people become better informed. This chapter explores the take up and response to several of these including Pension Wise and midlife MOTs. It also considers possible barriers to engagement where further action may be needed. These barriers include a lack of knowledge and awareness of recent changes in the State Pension, lack of trust in pensions and pension providers and people finding it difficult to keep track of their private pensions.
Finally, this chapter looks briefly at what impact the COVID-19 pandemic which began in 2020 has had on people’s retirement planning and which groups have been most affected by the pandemic.
2.2. Information sources used for retirement planning
All respondents, regardless of whether they had already retired or not, were asked which, if any, sources of information, advice or guidance they had ever used to plan for retirement. This might have been sources that a respondent actively sought out or information that was provided to them, for example by a pension provider.
However, the fact that the question was framed in terms of “use” implies some degree of active engagement with, rather than just receipt of, these information sources. “Planning for retirement” is likely to cover, but may not necessarily be limited to, financial considerations (see also Section 2.5). Some tools such as the midlife MOT (see Section 2.2.2) or employer-provided information (see Section 2.2.3) explicitly aim to take a holistic approach to retirement planning and look beyond just the financial aspects of retirement.
Just under three-quarters of all respondents (74%) had used at least one of the sources listed (see Table A2.1 in the appendix). However, this means around a quarter (26%) had never consulted any of these sources. People who had retired were more likely than those who had not yet retired to have used at least one source of information, advice or guidance to plan for retirement. The self-employed and those not in work were less likely to report having used any sources compared with employees. This may reflect differences in income, and therefore preparedness to start planning for retirement, among the self-employed (see Table A1.5) as well as the fact that employers were a commonly used source (see Figure 2.1). Consistent with the fact that pension providers were another common source of information, people without a private pension (which includes a higher proportion of the self-employed and those not in work) were also less likely than those with a private pension to report having used any sources of information, advice or guidance. Among those without a pension, those that had made use of a source were most likely to have used a government website (24%) or friends/relatives (16%).
People with low financial literacy, who may be less engaged with the financial aspects of planning for retirement, were also less likely to have used any of the sources listed compared with people with high financial literacy; 57% compared with 83% (See Section 1.3.5 for details of how financial literacy was measured).
Figure 2.1 shows that the most common source of information, advice or guidance used was Government websites such the DWP website, Check Your State Pension or another Gov.UK website (38%). The proportion of people using government websites for information on retirement may be even higher than this; 51% of all people below State Pension age (SPa) reported using a government website to check their SPa when asked directly about this for example (see Section 2.6.1). Over a third of people (37%) had used their pension provider as a source of information, including 45% of people with a private pension. There was no difference in the proportion of Defined Contribution (DC) versus Defined Benefit (DB) pension holders using information from their pension provider (Chapter 5 looks in more detail in the sources of information,advice or guidance people used prior to accessing their DC pension). Around a third of people had used their employer as a source of information, including 44% of current employees.
Nearly a quarter of people (24%) had received information from family and friends. However, it was rare for this to be the only source of information people used, with only three percent of people receiving information from family and friends but not using any other information source. People generally used multiple sources of information, advice or guidance, with 27% of those who had made use of any information source using two sources and 44% using at least three sources. People who used only one source were most likely to have used a government website (24%) or their employer (22%).
Around three-quarters of 40-75 year olds had used at least one source of information, advice or guidance to plan for retirement. The most common source used when planning for retirement was Government websites such the DWP website, Check Your State Pension or another Gov.UK website.
Figure 2.1 Proportion of people using different sources of information, advice or guidance when planning for retirement
| Government website | Pension provider | Employer | Professional financial advisor | Friends and family | Pensions Wise or the Pensions Advisory Service | Other source | None |
|---|---|---|---|---|---|---|---|
| 38% | 37% | 34% | 29% | 24% | 10% | 7% | 26% |
Source: Planning and Preparing for Later Life 2020/21
Base: All respondents (n=2,655)
Notes: Respondents could select more than one answer so percentages may sum to more than 100%
As seen in Figure 2.2, people on low incomes were less likely to report having used any sources of information, advice or guidance to plan for retirement (40% of those with a personal income below £10,500 had not used any source). Those on low incomes were less likely to be in employment, less likely to have a pension and less likely to be in a position to start actively planning for retirement. This is reflected in the fact that they were less likely than those on higher incomes to have used information from a pension provider or employer or to have actively sought information from a financial advisor.
Use of information sources varied by income. Those with the lowest incomes were more likely not to have used any source, including financial advisors.
Figure 2.2 Proportion of people using different sources of information, advice or guidance when planning for retirement, split by income groups
| Income groups | Government website | Pension provider | Employer | Professional financial advisor | Friends and family | Pensions Wise or the Pensions Advisory Service | Other source | None |
|---|---|---|---|---|---|---|---|---|
| Under £10,000 | 31% | 20% | 19% | 19% | 18% | 9% | 5% | 40% |
| £10,500 to under £27,000 | 42% | 37% | 32% | 27% | 23% | 11% | 5% | 25% |
| £27,000 to under £44,000 | 43% | 45% | 43% | 36% | 26% | 11% | 8% | 18% |
| £44,000+ | 42% | 57% | 56% | 46% | 35% | 8% | 12% | 5% |
Source: Planning and Preparing for Later Life 2020/21
Base: All respondents (n=2,655)
Notes: Respondents could select more than one answer so percentages may sum to more than 100%
Whilst many of the sources available to people are only able to provide information and guidance to help people reach their own decisions about pensions and/or financial planning, financial advisors are able to offer specific advice and recommendations. However, there is usually a cost associated with obtaining such professional advice which may limit take up. Twenty-nine percent of PPLL respondents reported using a financial advisor. Older people, men and those on higher incomes were more likely to have used a financial advisor. Self-employed people were more likely to have used a financial advisor than employees (36% vs 28%), perhaps reflecting the fact that – in the absence of an employer/workplace pension – the self-employed have more need to seek independent advice on planning for retirement. Thirty-six percent of people with a private pension, including 40% of people with a DC pension, had consulted a financial advisor. People who had consulted a financial advisor were mostly satisfied with the advice they received (86%), with around half (51%) saying they were very satisfied (see Table A2.2 in Appendix 1).
One alternative to paid financial advice is Pension Wise, a free and impartial service, operated by the Money and Pensions Service (MaPS) and set up by government in 2015, which offers guidance for people aged 50+ regarding Pension Freedoms. MaPS directly promotes Pension Wise for people who have a DC pension and want to decide how to take their money. Use of Pension Wise among DC pension holders aged 50+ is still relatively low with only one in seven DC pension holders (17%) having used Pension Wise. However, the service will not necessarily be relevant to everyone, including those who took their pension before 2015 or those who are still a long way from retirement. Chapter 5 looks in more detail at the use of sources of information, advice or guidance among DC pension holders 55 to 65; 29% of people in this age group who had accessed their DC pension had used Pension Wise. Satisfaction with Pension Wise was more mixed than satisfaction with professional financial advisors. People 50+ who had used Pension Wise were mostly satisfied with the guidance received (76% very or quite satisfied), although only 34% said they were very satisfied (see Table A2.2 in the annex).
The findings on financial advisors and Pension Wise are positive in that they show that, when people do engage with and consult these sources, they are generally happy with the guidance they receive. However, given the relatively low use of Pension Wise and the differences in take up of financial advisors by income, there is potentially some work to do in terms of making financial advisors more accessible to different groups and in promoting Pension Wise as a source of information.
2.2.1. Future use of information sources
People who had not yet retired were asked not only about sources of information, advice or guidance they had already used, but also about whether they might consult any of these sources in the future if they wanted more information on planning for retirement (regardless of whether they had already used them). Figure 2.3 shows the combined figures for people who have either already used a source or said they would do so in the future. Government websites, perhaps the easiest source of information to access, remain the most likely source to be used. Nearly one in five (18%) people had not done this at the time of being asked but said they would use a financial advisor in the future. Nine percent had already used Pension Wise and a further nine percent said they would use the service in the future. A small minority, seven percent, of people not yet retired had not previously used any sources or information, advice or guidance and said they did not plan to use any of the listed sources in the future. Finding a way to engage this group in planning for retirement will be important.
Nearly half of people not yet retired had either used or intended to use a financial advisor to help them plan for retirement.
Figure 2.3 Proportion of people who had used or would use different sources of information, advice or guidance in the future when planning for retirement
| Used or use different sources | Government website | Pension provider | Employer | Professional financial advisor | Friends and family | Other | Pensions Wise |
|---|---|---|---|---|---|---|---|
| Used | 37% | 36% | 35% | 28% | 26% | 10% | 9% |
| May use in future | 27% | 8% | 7% | 18% | 6% | 12% | 9% |
Source: Planning and Preparing for Later Life 2020/21
Base: All respondents not yet retired (n=1,591)
Notes: Respondents could select more than one answer so percentages may sum to more than 100%
2.2.2. Midlife MOT
People who had not yet fully retired were asked separately about whether or not they had heard of the midlife MOT and, if so, whether they had received help or support through one. The midlife MOT is a free online support tool to encourage more active planning by people in their 40s, 50s and 60s in the key areas of work and skills, health and wellbeing and finances. Only six percent of people who had not yet retired had heard of the midlife MOT and only 13% of that group (or one percent of all respondents who had not yet retired) had made use of the service. This low take-up is perhaps not that surprising given that the scheme was only put in place in February 2019. People who had not previously had a midlife MOT received a brief explanation of the scheme and were then asked if this is something they would consider taking up in the future. Nearly half of this group (47%) said they probably or definitely would. There may be further work to be done in promoting the scheme and encouraging take-up across eligible groups.
2.2.3. Employer-provided guidance
Current or previous (now retired) employees aged 50 and over were asked for more details about any guidance on retirement planning received from their employer. This could cover, but was not limited to, financial considerations. The majority (60%) had received none of the forms of guidance listed in Figure 2.4 from their employer. It is not possible, however, to determine whether this is because the employer did not offer this form of guidance or whether it was offered but not taken up or recalled. Information was most commonly received in a passive way, through written material or posters. However, nearly one in five (18%) had received workshops or courses organised at their workplace. Consistent with the findings presented on the midlife MOT in section 2.2.2 above, only a small proportion (3%) had received a midlife MOT through their employer. However, given that the scheme only came into place in February 2019, it would not have been available to all respondents, many of whom will have retired prior to 2019.
The majority of employees 50+ had not received guidance from their employer.
Figure 2.4 Proportion of employees 50+ who had taken up different sources of employer-provided guidance on retirement
| Written material such as posters/leaflets | Links to online resources | Courses or workshops organised at workplace | Recommendations or referrals to external organisations | Mid-life MOT or mid-life career review | Other source | None |
|---|---|---|---|---|---|---|
| 22% | 19% | 18% | 12% | 3% | 4% | 60% |
Source: Planning and Preparing for Later Life 2020/21
Base: All past/current employees 50+ (n=1,629)
Notes: Respondents could select more than one answer so percentages may sum to more than 100%
Interestingly, around a third of people who had received information from their employer (35%) said they had not received information on any of the specific topics shown in Figure 2.5. This might suggest that some of the guidance employees received was either very general (for example with links to other information sources) or informal support on retirement planning not related to a specific topic.
The most common topic on which employer-guidance was received was financial planning, followed by how to maintain an active lifestyle in retirement.
Figure 2.5 Proportion of employees 50+ who had received employer-provided guidance on different topics
| Financial planning | Maintaining an active or busy lifestyle | Managing health | Working flexible or reduced hours in the run-up to retirement | Future opportunities for paid work | Future opportunities for unpaid work | Other answer | None |
|---|---|---|---|---|---|---|---|
| 38% | 32% | 29% | 21% | 13% | 13% | 3% | 35% |
Source: Planning and Preparing for Later Life 2020/21
Base: All past/current employees 50+ who made use of employer-provided support (n=691)
Notes: Respondents could select more than one answer so percentages may sum to more than 100%
Employees who had received some guidance from their employer (in any form) were fairly neutral in their response to this guidance (Table A2.3 in the annex). Fifty-seven percent said they were very or quite satisfied with the information received, with only 19% saying they were very satisfied. Over a third (37%) said they were neither satisfied nor dissatisfied. This, together with the relatively high proportion of people who could not specify which topics the guidance covered, may suggest that, whilst commonly used, there may be scope to improve the quality of employer-provided guidance.
2.3. Engagement with information about private pensions
Around three-quarters (76%) of people reported having a private pension. Chapter 5 provides more information on who has a private pension and the types of pension people hold. This section of the report looks at the extent to which people are actively engaging with their private pension, keeping track of their pension holdings and making use of information provided by their pension provider. It also looks at the extent to which people trust their pension provider.
Previous research has found generally quite low levels of engagement among private pension holders. The 2020 Financial Lives survey (FCA, 2021) found that many people with a private pension are not well prepared for retirement: the study showed that 58% of those aged 45+ who are not retired have put little or no thought into how they will manage financially in retirement whilst 37% of those aged 45+ with a DC pension in accumulation do not understand the different options they can choose from to take money from their pension.
Most PPLL respondents with a private pension (77%) said they found it very or fairly easy to keep track of their pension savings, with 35% saying they found it very easy. However, one in five (20%) said they found it very or fairly difficult to keep track of their pension savings. Younger age groups were more likely to say that they found it difficult to keep track of their pension savings, with 29% of those aged 40-49 saying they found it very or fairly difficult to keep track. It may be that people find it easier to keep track of their pensions once they have retired and have accessed or started receiving their pension, that is when decisions about their pension have been made and are less likely to be subject to change. It may also reflect the fact that DC pensions, which are subject to more uncertainty, were more common among younger cohorts (see Chapter 5, Section 5.3). There is no evidence that people who had multiple pensions found it harder to keep track than people with just one pension.
When asked why they found it difficult to keep track of their pension, a majority of those who found it difficult to keep track said that they found information about pensions confusing (58%). This was true even of people with high financial literacy who found it difficult to keep track, 63% of whom said they found information about pensions confusing. Many also said that it takes a lot of time to keep track of pension savings (45%) and that the information is kept in different places (43%) (Figure 2.6).
When asked why they found it difficult to keep track of their pension, a majority said that they found information about pensions confusing.
Figure 2.6 Proportion of pension holders providing these reasons why they found it difficult to keep track of pension savings
| Pension information confusing | Lot of time keeping track of pension | Information kept in different places | Information in different formats | Other answer |
|---|---|---|---|---|
| 58% | 45% | 43% | 37% | 20% |
Source: Planning and Preparing for Later Life 2020/21
Base: All respondents who find it difficult to keep track of pension savings (n=336)
Notes: Respondents could select more than one answer so percentages may sum to more than 100%
As people approach 55, the age at which it is possible for them to access their DC pension pot, being aware of the options and engaging with the decisions to be made becomes increasingly important. Different sources of information, advice or guidance aimed specifically at DC pension holders facing a decision on how to access their pension are available. Pension providers are required to provide pension holders with information about their options. Retirement options packs (known as pension wake-up packs informally) are provided by pension providers 4-6 months before their agreed pension age. They are aimed at ensuring people receive timely, relevant and adequate information about their retirement options to enable them to make an informed decision about accessing their pension savings.
DC[footnote 1] pension holders aged 50 and over were asked if they had receive a pension wake-up pack and, separately, whether they had received information on the choices available to them from their pension provider. Because of concerns that respondents may not have been aware of the term ‘pension wake-up pack’, responses on the two questions have been combined in analysis to give an overall figure for the proportion of people who recalled receiving information on pension choices from their pension provider. Two-thirds (67%) of people 50 and over could recall receiving this information. It is of course likely that this information was not relevant to everyone in this age group if they are not yet ready to retire. Chapter 5 looks in more detail at use of provider information among people who have already accessed their pension.
Nearly everyone (91%) who could recall receiving information from their pension provider said they found the information at least fairly clear, with 44% saying they found it very clear. The answers on perceived clarity are encouraging. They suggest that those who recall receiving information from their pension provider found it helpful. However, there may still be further work needed to increase engagement with this information among some pension holders.
2.4. Age at which people start planning for retirement
Most 40-75 year olds (84%) had already started saving for their retirement, either through a pension scheme or through other means. When asked to select which decade of their lives they started saving for retirement, 43% said their 20s and a further 20% said they started saving in their 30s (Figure 2.7). However, 16% of people said they had not yet started saving for retirement. There is some evidence to suggest that people in younger age groups were more likely to start saving from an earlier age. For example, 69% of 40-49 year olds reported starting to save for their retirement in their 20s and 30s compared with 55% of 66-70 year olds. This may reflect success of automatic enrolment into workplace pensions. However, without data at multiple time points, enabling us to isolate the effects of individual age vs. time period, it is not possible to be sure what lies behind this finding.
People were less likely to have started planning for when they would stop paid work and move into retirement, with 38% of 40-75 having not yet done so. The most common decade for people to start planning for the transition from work was in their 50s (21%) although a sizeable group (16%) reported planning for this in their 40s.
People start saving for retirement earlier than they start planning to leave work. Although most people started saving for retirement in their 20s or 30s, 16% of 40-75 year olds had not yet started saving.
Figure 2.7 Age at which people started planning for retirement
| Started | 20s | 30s | 40s | 50s | 60s | Other age | Not yet started |
|---|---|---|---|---|---|---|---|
| Started saving | 43% | 20% | 11% | 5% | 1% | 4% | 16% |
| Started planning | 7% | 9% | 16% | 21% | 7% | 1% | 38% |
Source: Planning and Preparing for Later Life 2020/21
Base: All respondents (minimum n=2,620)
People on lower incomes were less likely to have started saving for retirement. Thirty-three percent of those with incomes of less than £10,500 had not yet started saving compared to just one percent of those with incomes of £44,000 or more. This is likely, at least in part to be because those on lower incomes will either not be in work or not meet the earnings threshold for automatic enrolment into a workplace pension (£10,000 per year in 2020/21). Income may also be a factor in explaining why men were more likely than women to start saving earlier and why people not living with a partner but with dependents were less likely than other groups to start saving in their 20s and 30s.
Differences in income, as well as a lack of access to, and automatic enrolment in, workplace pensions, may also explain why saving for retirement varies by employment status (see Chapter 5 for more on the importance of workplace pensions). Self-employed people were more likely than employees to have not yet started saving for retirement (22% vs 7%). Those not in paid work at all were most likely to report not having started saving for retirement (36%). Just over half (54%) of people without a pension had not yet started saving for retirement.
Knowledge of and engagement with retirement planning may also influence the age at which people start saving for retirement. People with higher financial literacy, who were also more likely to have consulted information sources to help them plan for retirement (see Section 2.2), were more likely to have started saving earlier than people with low financial literacy; 55% of those with high financial literacy said they started saving in their 20s compared with 24% with low financial literacy. This may in part be due to people with greater financial literacy recognising the importance of starting to save earlier. However, it is also likely to be due to the fact that there is a positive association between financial literacy and income.
2.5. Factors considered when planning for retirement
Retirement decisions may be influenced by a range of factors including, but not limited to, financial considerations. Respondents were asked to identify which, if any, of a list of factors they had considered when planning for retirement; people who were already semi- or fully retired were asked to consider which factors they had considered and people who had yet to retire were asked about any factors they had considered so far. The analysis was run excluding anyone who said that they had not yet started actively planning for how they would stop paid work and move into retirement (see Section 2.4). Figure 2.8 shows that the most frequently mentioned factors were related to financial considerations including pension arrangements (theirs or their partners). However, other factors relating to health and caring, employment and plans in retirement were also frequently mentioned.
There was a lot of similarity between those who were and were not yet retired in terms of which factors were mentioned most frequently. However, it is notable that those not yet retired, and especially the semi-retired, were more likely to mention a wider range of factors in planning for retirement. The findings serve to emphasise both the importance and complexity of retirement planning and highlight that any support offered with planning cannot simply focus on the financial aspects of retirement.
People considered a range of factors, not just financial considerations, when planning for retirement.
Figure 2.8 Proportion who had considered different factors in planning for retirement, by retirement status
| Retirement status | Financial situation | Own or partners pension arrangements | Plans in retirement | Own or family’s health | Employment situation | Caring responsibilities | None of these |
|---|---|---|---|---|---|---|---|
| Not retired | 84% | 77% | 69% | 67% | 60% | 50% | 6% |
| Semi-retired | 87% | 78% | 63% | 69% | 69% | 39% | 2% |
| Fully retired | 72% | 65% | 54% | 40% | 57% | 30% | 10% |
Source: Planning and Preparing for Later Life 2020/21
Base: All respondents who had started planning transition from work to retirement (n=1,800)
Note: Respondents could select more than one answer so percentages may sum to more than 100%
2.6. Knowledge and awareness of the State Pension
This section looks at the extent to which people are aware of the recent changes to the State Pension which will affect both the age they are able to start claiming their State Pension and the amount they will receive.
2.6.1. Whether checked State Pension details
People differed in how engaged they were regarding their State Pension entitlement. Around half of those below SPa (51%) reported that they had checked their SPa whilst around two in five (40%) had checked the amount of State Pension they would receive.
Around half of respondents below State Pension age had checked their State Pension age whilst around two in five had checked their State Pension amount.
Figure 2.9 Whether checked details of State Pension, by age
| Checked State Pension | 40-49 | 50-54 | 55-59 | 60-65 |
|---|---|---|---|---|
| Checked State Pension age | 37% | 42% | 57% | 73% |
| Checked State Pension amount | 26% | 33% | 43% | 60% |
Source: Planning and Preparing for Later Life 2020/21
Base: All respondents below SPA (minimum n=1,640)
The closer people got to the SPa, the more likely they were to have checked these details (Figure 2.9). People for whom the State Pension was their only expected source of income in retirement were among the least likely to have checked either their SPa or amount (36% had checked their SPa and 19% the amount).
2.6.2. Self-rated knowledge of State Pension
PPLL evaluated people’s subjective, self-assessed, pensions knowledge as well as their objective knowledge (see Section 2.6.3). Previous studies have found that people’s own confidence in their financial knowledge is a strong predictor of both their financial behaviour (for example in terms of savings) and how positively they feel about their financial circumstances (Ahmed et al, 2020). Respondents were asked to self-assess their knowledge about pensions in general and the State Pension more specifically.
Figure 2.10 shows that whilst a majority of people reported having at least a basic level of knowledge of pensions overall (59%) and the State Pension in particular (60%), only a small proportion believed they had a good knowledge (17% in both cases).
A majority of people reported having at most a basic knowledge of pensions.
Figure 2.10 Proportion of 40-75 year olds rating their pensions knowledge
| Pension | Good | Basic | Very patchy | Little or nothing |
|---|---|---|---|---|
| Pensions overall | 17% | 42% | 27% | 14% |
| State Pension | 17% | 44% | 25% | 14% |
Source: Planning and Preparing for Later Life 2020/21
Base: All respondents (minimum n=2,649)
Men were more likely than women (22% compared with 11%) to report they had a good knowledge of pension issues, though the same proportion of men and women (42%) reported they had a basic knowledge. Self-assessed knowledge was higher among older age groups; whilst 26% of people above SPa rated their knowledge of the State Pension as good, only 14% of those below SPa did so. As shown in Section 2.2, older age groups were more likely to have used a range of sources of information, advice or guidance to plan for retirement with the mean number of sources used increasing with age. This may have increased their knowledge or confidence in their knowledge. The next section looks at how far self-assessed knowledge compares with actual knowledge.
2.6.3. Actual knowledge of State Pension age and amount
Respondents under the SPa were asked what their own SPa was in years and to say how much they thought the current weekly State Pension amount for a single person was. Just over half of people under SPa (56%) were able to accurately identify their own SPa[footnote 2] whilst just under a quarter (24%) overestimated, meaning they thought they would receive their State Pension later than is actually the case. Only one in five (20%) underestimated, meaning they thought they would reach the SPa earlier than they will.
The proportion of people correctly identifying their SPa varied depending on their actual SPa (Figure 2.11).Three-quarters of those with an actual SPa of 66 were able to correctly identify this. However, only 54% of people with an actual SPa of 67 and 19% of people with an actual SPa of 68 were able to correctly identify their SPa. Sixty-nine percent of people who had checked their SPa using the Check your State Pension website got the figure correct compared with 39% of people who had not. Men were slightly more likely than women to get their SPa correct (58% vs 54%). There was almost no difference between the proportion of men and women that overestimate the SPa, but women were slightly more likely to underestimate their SPa (22% of women vs 18% of men)[footnote 3].
There was little difference in SPa knowledge between employees and the self-employed. However, those not currently in work were less likely to accurately identify their SPa (47% vs 54% of employees and 58% of self-employed) and more likely underestimate their SPa than other groups (30% vs 20% of employees and 18% of self-employed). This is consistent with evidence elsewhere in the report which shows that the most economically disadvantaged are among the least well informed when it comes to planning for retirement (see, for example, Section 2.2). People who incorrectly estimated the SPa generally did so by a few years only on average. The average over estimation was 2.48 years whilst the average underestimation was 3.17 years.
As people’s actual SPa increases, they are less likely to correctly identify their SPa.
Figure 2.11 Proportion of people over/underestimating their SPa, by actual Spa
| SPa estimation | 66 | 66-67 | 67 | 67-68 | 68 |
|---|---|---|---|---|---|
| Identified | 75% | 48% | 54% | 19% | 19% |
| Overestimated | 19% | 46% | 23% | 46% | 26% |
| Underestimated | 5% | 6% | 23% | 35% | 55% |
Source: Planning and Preparing for Later Life 2020/21
Base: All respondents below SPa (n=1,498)
To measure their knowledge of the State Pension amount respondents were asked what a single person that has recently retired would receive as part of their pension. The data from this question was then compared against the full weekly amount under the new State Pension (nSP) in 2020/21 (£175)[footnote 4]. Three percent of people were able to identify this weekly amount exactly and only 22% were able to give the amount within 10%. It was most common for people to underestimate the nSP amount, with 65% underestimating the value by more than 10% compared with just nine percent who overestimated by the same proportion. When people below the SPa were asked what they thought the standard weekly State Pension amount was, the median estimate was £150 and the mean was £143. These values are closer to the basic State Pension amount (£138) and suggest that people may not yet be fully aware of the changes introduced by the nSP.
Overall, there was a positive association between self-assessed knowledge of State Pensions and actual knowledge. Nearly three quarters (73%) of people who rated their State Pension knowledge as good correctly identified their SPa compared with around a third (35%) of those who said they knew little or nothing. Forty-four percent of people who said they had a good knowledge of State Pensions identified the maximum State Pension amount within ten percent (including eight percent who identified the exact amount), compared to ten percent of those who said they knew little or nothing about the State Pension. Analysis shows that people with high financial literacy performed better than people with low financial literacy on these subjective and objective knowledge measures. For example, 31% of people with low financial literacy underestimated their SPa compared with 13% of those with high financial literacy. As low financial literacy is associated with lower income and savings (see Table A1.4 for the relationship between financial literacy and income), this means people who are more dependent on the State Pension for their retirement income are generally less well informed about the State Pension than those who are less reliant.
2.7. Trust in pensions
Trust in pensions is expected to be closely related both to whether or not people have a pension and how engaged they are with their pension planning and decision making. Trusting in pensions may make people more likely to take out a pension or to engage in active pension management. Kotecha et al, 2020, for example, found that low trust was a reason that some individuals cashed out their pension in a lump sum. At the same time, positive interaction with a pension provider may increase trust. Overall, levels of trust in both occupational and personal pensions were generally found to be high, especially among those who had a pension.
2.7.1. Trust in pensions as a secure form of saving for retirement
To gauge people’s level of trust in pensions at the top level, respondents who had not yet retired were first asked how much they agreed or disagreed with the statement “putting money into a pension is the most secure way of saving for your retirement”. A majority (66%) agreed with this statement, regardless of whether they had a private pension themselves (Figure 2.12).
A majority of 40-75 year olds agreed with the statement “putting money into a pension is the most secure way of saving for your retirement”, regardless of whether they had a private pension.
Figure 2.12 Proportion of people agreeing with the statement “putting money into a pension is the most secure way of saving for your retirement”, by whether have a private pension
| How much they agree | Has a private pension | Doesn’t have a private pension |
|---|---|---|
| Strongly agree | 23% | 17% |
| Agree | 47% | 34% |
| Neither agree or disagree | 21% | 30% |
| Disagree | 7% | 16% |
| Strongly disagree | 2% | 4% |
Source: Planning and Preparing for Later Life 2020/21
Base: All respondents not fully retired (n=1,626)
However, people with a private pension were more likely to agree or strongly agree than those without a pension. Both people with DB pensions and people with DC pensions agreed with the statement, though more DB pension holders (27%) strongly agreed compared with DC pension holders (22%).
There were no significant differences in levels of agreement that pensions were the most secure way to save by age. However, employees were more likely than the self-employed to strongly agree or agree with the statement (71% compared with 51%). This may reflect the fact that the self-employed are less likely to have current access to a workplace pension and automatic enrolment (although most would have spent some time as an employee and so had such access at some point in their careers). It may also reflect more caution about pensions as the best form of savings among the self-employed whose income stream, and access to other assets/savings, may differ from that of employees. Self-employed people were more likely to expect to use sources of non-pension income in retirement (see Chapter 3, Section 3.4).
There was a positive association between levels of trust and self-assessed pensions knowledge, with people who felt more knowledgeable about pensions (and who, as has been shown above, had higher financial literacy generally) also having more trust in pensions. Over three quarters (78%) of those who said they had a good knowledge of pensions agreed or strongly agreed pensions were the best way to save. This compared with 53% of those who said they knew little about pensions.
Distrust of pensions is correlated with pension saving behaviour. People who disagreed with the statement “putting money into a pension is the most secure way of saving for your retirement”, were less likely to report having a private pension (60% compared with 76% of all 40-75 year olds, see Chapter 5 Section 5.2). This group most commonly cited distrust in pensions (33%), along with not knowing enough or not being interested (46%) as reasons for not having a pension.
There is little evidence that financial scams were behind people’s distrust in pensions. Approximately one in 10 people (13%) said they had been offered free financial advice (likely to have been a scam). However, 29% of those who had been offered free advice strongly agreed that pensions are the most secure way of saving for your retirement, compared with 20% of those who had not been offered such advice.
2.7.2. Trust in pension providers
People were also asked about their trust in different types of pension provider and the extent to which they trusted them to a) act in their best interests and b) provide clear and accurate information. Current employees were asked about their trust in the pension provided by their employer whilst people who held a personal pension they had arranged themselves were asked about trust in their pension provider.
Overall trust in workplace pension providers was high (Figure 2.13). Nearly three-quarters of current employees (74%) had at least some trust that the provider would act in their best interests, with a quarter (25%) having a great deal of trust. Similarly, 78% of current employees trusted providers to ensure that they have clear and accurate information with 28% reporting a great deal of trust.
Nearly three-quarters of current employees had some trust that the provider would act in their best interests.
Figure 2.13 Level of trust in workplace pension providers among current employees
| Level of trust | Act in best interests | Provide clear and accurate information |
|---|---|---|
| A great deal | 25% | 28% |
| Quite a lot | 49% | 50% |
| Not very much | 19% | 17% |
| Not at all | 6% | 5% |
| It varies | 1% | 0% |
Source: Planning and Preparing for Later Life 2020/21
Base: All current employee (minimum n=949)
Employees who had a workplace pension were more likely than those without a workplace pension to say that they had at least quite a lot of trust that the provider would act in their best interests - 76% compared to 68% of those with a workplace pension[footnote 5]. However, levels of trust were high generally, suggesting that trust is not the major barrier to people without a pension taking one out (see also Chapter 5, Section 5.2.1). Employees who had received information from their pension provider were more likely to trust their workplace pension provider to provide them with clear information. Eighty-five percent of people who had received information from their pension provider trusted their workplace pension provider to provide them with clear information compared with 73% of those who had not received information.
Trust in providers of personal pensions was also high (Figure 2.14). Around eight in ten individuals with a personal pension trusted that their pension provider would act in their best interests (81%), with just over a quarter (28%) trusting them a great deal. Even more (86%) trusted their provider to give them clear and accurate information, with 32% having a great deal of trust in this.
Around eight in ten individuals with a personal pension trusted that their pension provider would act in their best interests.
Figure 2.14 Level of trust in workplace pension providers among current employees
| Level of trust | Act in best interests | Provide clear and accurate information |
|---|---|---|
| Great deal | 28% | 32% |
| Quite a lot | 53% | 54% |
| Not very much | 15% | 12% |
| Not at all | 3% | 1% |
| It varies | 1% | 1% |
Source: Planning and Preparing for Later Life 2020/21
Base: All individuals with a personal pension (minimum n=676)
Whilst overall levels of trust in pensions as a form of saving was low among the self-employed relative to other groups, self-employed people with a pension generally trusted their pension provider. In fact, self-employed personal pension holders were more likely to trust their provider to act in their best interests than employees with personal pensions (31% of self-employed said they had a great deal of trust compared with 19% of employees).
2.8. Impact of COVID-19 on retirement planning
The COVID-19 pandemic has had a major impact on many aspects of people’s lives. This may include changes in people’s employment or financial situation as well having an impact on how people think about their financial situation or plans for retirement more generally (Crawford, R, and Harjalainen, H., 2020; Centre for Ageing Better, 2020a). The short-term impact of the pandemic (up to winter 2020/21) was captured by the PPLL survey through questions asking respondents what impact, if any, COVID-19 had had on their employment situation and plans for retirement. It is, however, important to bear in mind that there may be other impacts not captured by the survey.
Thirty-five percent of people who had not yet fully retired reported that COVID-19 had had an impact on their employment situation. The most commonly reported impact, mentioned by 23% of people who were not yet fully retired, was that their income had been reduced (this included being put on furlough). A further six percent reported that they had lost their job as a result of the pandemic, As many as 14% of those not currently in paid work said they had lost their job as a result of the pandemic. Whilst much attention has, with good reason, been paid to the impact of COVID-19 on the job prospects of young people, it is important to note that older workers have also suffered as a consequence of the pandemic. It should also be borne in mind that older workers may face particular challenges in returning to the labour market, for example because of health considerations (Centre for Ageing Better, 2020a, see also Chapter 4).
COVID-19 had an impact on some people’s plans for retirement.
Figure 2.15 Impact of COVID-19 on plans for retirement, by retirement status
| Retirement status | Retire later | Withdrawn savings or investments | Retire earlier | Withdrawn or increased money from pension fund | Reduced amount withdrawing form pension fund | Other | None |
|---|---|---|---|---|---|---|---|
| Not fully retired | 9% | 7% | 3% | 2% | 1% | 2% | 80% |
| Fully retired | 0% | 6% | 2% | 2% | 1% | 3% | 89% |
Source: Planning and Preparing for Later Life 2020/21
Base: All respondents (n=2,643)
Note: Respondents could select more than one answer so percentages may sum to more than 100%
Fewer people had changed their plans for retirement as a result of the pandemic. Eight in ten (80%) of people who had not yet fully retired reported that none of the possible response options applied to them (Figure 2.15). This figure was even higher (89%) among those who had already fully retired. The most common impact mentioned was people saying they would now retire later than planned (nine percent of those not yet fully retired). Only three percent of those who had not yet fully retired said they would now retire earlier than planned.
The impact of COVID-19 was felt more strongly among some groups than others, notably those over 55 and the self-employed. Those over the SPa, were more likely to report that their income had been reduced as a result of COVID-19 (29% of 66-70 year olds) and to report that they had lost their job (13% of 66-70 year olds)[footnote 6]. This may be related to the higher incidence of semi-retirement among older age groups (see Table A1.6); 10% of the semi-retired group reported losing their job as a result of the pandemic. Among those not yet retired, those aged 55-59 were most likely to report that they would now retire later than planned (13%), whilst 60-65 year olds were most likely to report that they had had to make use of funds set aside for retirement (13%).
The self-employed were more likely to have experienced a loss of income as a result of COVID-19
Figure 2.16 Impact of COVID-19 on employment status, by employment status
| Employment status | Income reduced being on furlough, working less, or salary cut | Lost job | Became self-employed | Other | None |
|---|---|---|---|---|---|
| Employees | 21% | 3% | 1% | 9% | 69% |
| Self-employed | 60% | 6% | 9% | 5% | 30% |
| Not in paid work | 6% | 14% | 2% | 7% | 73% |
Source: Planning and Preparing for Later Life 2020/21
Base: All respondents not fully retired (n=1,629)
Note: Respondents could select more than one answer so percentages may sum to more than 100%
The self-employed were also particularly likely to report that they had been affected by COVID-19 (see Figure 2.16). Only 30% of the self-employed (compared with 69% of employees) reported that their work situation had not been affected. Three in five (60%) of the self-employed reported that their income had been reduced compared with only one in five (21%) of employees. This might reflect the nature of self-employment, with some of the demand for services provided by the self-employed having been reduced during the pandemic. It may also be the result of some self-employed people, including those who have recently become self-employed, not meeting the eligibility requirements for or not being aware of the COVID-19 Self-employment Income Support Scheme or other forms of support available (Blundell et al, 2020). The retirement plans of the self-employed were also more likely to have been affected by the pandemic which may be associated with the loss in income. Nineteen percent of the currently self-employed reported they would have to retire later than originally planned and 14% said they’d withdrawn funds previously set aside for their retirement.
2.9. Conclusions
Many people are actively planning for their retirement. The majority of 40-75 year olds had started saving for retirement in their 20s or 30s whilst people most commonly started to plan for the point at which they would stop work and move into retirement in their 40s and 50s. There is evidence that younger age groups started saving earlier than those in older age groups, perhaps as a result of the successful introduction of automatic enrolment.
There is, however, considerable variation in the extent to which people are planning for retirement. People not in paid work, on lower incomes and those with lower financial literacy were less likely to have engaged with sources of information, advice or guidance or started saving for retirement. Take-up of Pension Wise and the midlife MOT, intended to help people plan for retirement, has been low to date. However, these resources – especially the midlife MOT introduced in early 2019 are relatively new and the evidence also suggests there is scope to increase take up. Feedback from those who have used Pension Wise is generally positive and many people, once made aware of midlife MOT, expressed an interest in having one.
The extent to which people were aware of recent changes to the State Pension (including their SPa and the amount of the nSP) also varied though was higher among people who had used the Check your State Pension website. People who were most likely to be reliant on the State Pension as their only source of income in retirement were among the least knowledgeable.
3. Expectations for retirement
3.1. Introduction
With the introduction of Pension Freedoms and the abolition of the statutory retirement age, people now have an increased number of options to choose from when it comes to their retirement. This increased flexibility means that retirement trajectories may be quite disparate across individuals. For most people, exiting the labour market will mean losing a major source of income and it is therefore crucial that people consider what other sources of income they will have to draw on. Previous research has raised concerns that people may be “sleep-walking” into retirement, having failed to take account of the likely duration of their retirement or the income they would need to cover this (The People’s Pension, 2021). The purpose of this chapter is to explore the extent to which people have thought about not only when they will retire but also their financial situation when they do.
The chapter starts by looking at the age people expect to retire and the extent to which this is in line with when they would ideally like to retire. It goes on to look at whether people have thought about both the income they will need and the income they expect to receive in retirement and how this compares to their current income levels. The chapter also considers what individuals expect their main sources of income to be in retirement and, in particular, what proportion of this income they expect to come from the State Pension and, if applicable, private pensions. Finally, the chapter looks at how confident people are that they will be able to maintain a good standard of living in retirement.
Where possible the chapter compares the expectations and attitudes of those yet to retire with the experiences of those who have already retired in an attempt to gauge how realistic these expectations are. It should be noted that these two groups are unlikely to be exactly comparable in terms of demographics and, given real world changes in employment and pensions, the context in which the two groups were making decisions around retirement will be different. It is therefore necessary to be careful in using these findings to draw conclusions about the extent to which the expectations of those who have not yet retired are realistic or borne out by reality (as their reality may be different from that of those already retired).
3.2. Expectations about retirement age
One of the key questions when thinking about planning for retirement is what age people expect to leave the labour market. This section explores at what age respondents who have not yet fully retired from paid work expect to fully retire from all paid work. The next section goes on to look at what age they would ideally like to retire.
People mostly expected to retire in their 60s. The mean expected retirement age was 66. However, forty percent of respondents expected to retire by age 65, which is below the current State Pension age (SPa) of 66 years for both men and women. Nearly a quarter of respondents (23%) expected to retire in their 70s or later and seven percent expected that they would never retire (First column shown in Figure 3.1).
Two in five people expected to retire below the current State Pension age. Four in five would ideally like to retire before then.
Figure 3.1 Expected and ideal age of retirement for people not yet retired
| Age | under 50 | 50-55 | 56-59 | 60-65 | 66-69 | 70-74 | 75-79 | 80 or above | Never |
|---|---|---|---|---|---|---|---|---|---|
| Expected age | 0% | 3% | 2% | 35% | 29% | 17% | 4% | 2% | 7% |
| Ideal age | 2% | 18% | 4% | 53% | 7% | 6% | 3% | 1% | 5% |
Source: Planning and Preparing for Later Life 2020/21
Base: All respondents not yet retired (minimum n=1,430)
Older age groups were more likely to expect to retire later. This may reflect a recognition of the necessity to keep working longer as you age. However, it may also be a consequence of those people in the older age groups who were especially keen (or able) to retire early having done so already. These people are not included in the analysis of expected retirement age (as only those yet to retire were asked their expected retirement age) which may be skewing the expected retirement age among older age groups upwards.
Employment status was related to people’s expectations for the age of retirement. The self-employed were more likely than employees to expect to continue working beyond 65 (72% compared with 57%) and more likely to say they would never retire (15% compared with 5%). People who were already semi-retired were also more likely to expect to continue working past 65 and to say they never expected to retire (11%). These differences may reflect a desire to work longer among these groups. However, it may also – at least in part – be due to the fact that the self-employed and semi-retired tend to be older than average and to have lower incomes (see Table A1.2 and A1.3).
There is evidence that expected retirement age is influenced by financial circumstances rather than (or as well as) a preference for working longer. People with higher incomes, and who therefore are likely to be better placed to save for retirement, were more likely to expect to retire before the current SPa. For example, 54% of those with gross earnings of £44,000 a year or more expected to retire before the SPa compared with only 36% of those earning below £10,500. Similarly, people with savings over £100,000 were more likely to expect to retire before the SPa (51%) than those with no savings or those with savings under £15,000 (34% and 38% respectively).
As chapter 2 showed, non-financial considerations such as an individual’s health or their caring responsibilities may also factor into people’s retirement planning. However, there was no evidence that people with current caring responsibilities expected to retire either sooner or later than people without caring responsibilities and no statistically significant relationship between health and expected retirement age.
3.2.1. Expected age of retirement compared with ideal age of retirement
Whilst only 40% of respondents who had not yet fully retired expected to retire before the age of 66, the majority (80%) reported that their ideal retirement age would be before this age, indicating that in general people expect to retire later than they would actually like to (Figure 3.1, second column). The mean ideal retirement age among those who had not yet retired was 60. Ideal retirement age did, however, vary across different groups. Self-employed people were less likely than employees to say they would ideally retire below 66 (63% compared with 84%). The semi-retired were especially likely to put their ideal retirement age at SPa or above with 11% saying they would ideally never retire. These findings lend support to the idea that, at least in part, the higher expected retirement age among the self-employed and the semi-retired is due to preference rather than necessity. This is also consistent with findings in Chapter 4 which show that the self-employed and semi-retired have higher levels of satisfaction with work, perhaps as a result of having greater work flexibility.
The ideal retirement age appears to be lower for younger respondents compared to older ones. Whereas 83% of non-retired respondents between the ages of 40-59 reported that they would ideally like to retire before age 66, only 74% of respondents aged 60 and above reported that their ideal retirement age was before the age of 66. This may reflect a desire (or a recognition of the necessity) to keep working longer as you age. However, it may also be a consequence of those people in the older age groups who were especially keen to retire early having done so already and so not being included in the analysis. The proportion of women (81%) who indicated that their ideal retirement age was before the age of 66 was higher than that of men (75%), perhaps reflecting that women may have been expecting to be able to retire earlier than men prior to the recent equalisation of the SPa.
3.2.2. Expected age of retirement compared with actual age of retirement
Figure 3.2 compares the age at which those who have not yet retired expect to retire against the age at which those who have already retired did so. Whilst only 40% of the first group expected to permanently leave the labour market before the age of 66, 86% of those who had already done so had fully retired before the age of 66. The reason for the mismatch between expectations and experience may be in part that people’s expectations are not realistic and unnecessarily pessimistic. However, it is most likely to reflect real-world changes, such as ongoing increases in the SPa, which mean that in the future people will indeed need to retire later than previous cohorts.
People who had not yet retired expected to retire later than those who had already retired.
Figure 3.2 Expected vs. actual age of retirement
| Retirement status | Under 50 | 50-55 | 56-59 | 60-65 | 66-69 | 70-74 | 75-79 | 80 + | Never |
|---|---|---|---|---|---|---|---|---|---|
| Expected age (not yet retired) | 0% | 3% | 2% | 35% | 29% | 17% | 4% | 2% | 7% |
| Age (fully retired) | 6% | 14% | 15% | 51% | 9% | 4% | 0% | 0% | 0% |
Source: Planning and Preparing for Later Life 2020/21
Base: All respondents (n=2,445)
Note: Respondents not yet retired were asked their expected age of retirement. Fully retired respondents were asked their actual age of retirement.
Figure 3.3 provides evidence that the gap between people’s expected age of retirement and their ideal age of retirement appears to be growing. It shows the proportion of not yet retired individuals who expect to retire at, above or below their ideal retirement age as well as the proportion of people already fully retired who actually did retire at their ideal age. Only 26% of respondents who had not yet fully or semi-retired expected to retire at their ideal age. This compares with around a third (32%) of the fully retired who had retired at their ideal age. The semi-retired group were the most likely to say they expected to retire at their ideal age, further suggesting that many semi-retired people are happy to be working longer.
Only just over a quarter of respondents who had not yet retired expected to retire at their ideal age compared with over a third of the already retired who had done so.
Figure 3.3 Extent to which expected age of retirement differs from ideal age of retirement, by retirement status
| Retirement status | 10 years higher | Between 5-10 years higher | 1-5 years higher | Equal | 1-5 years lower | 5-10 years lower | > 10 years lower | Never expect/wants to retire |
|---|---|---|---|---|---|---|---|---|
| Not retired | 11% | 24% | 27% | 26% | 4% | 0% | 0% | 9% |
| Semi-retired | 7% | 13% | 22% | 38% | 2% | 1% | 1% | 15% |
| Fully retired | 5% | 6% | 22% | 33% | 16% | 8% | 6% | 3% |
Source: Planning and Preparing for Later Life 2020/21
Base: All respondents (n=2,375)
Note: Respondents not yet retired were asked their expected age of retirement. Fully retired respondents were asked their actual age of retirement.
The other big difference between non-retirees and the fully retired was in whether people not retiring at their ideal age were having to retire earlier or later than they would like. The majority of non-retired respondents (62%) expected to retire later than what they considered their ideal retirement age, and only four percent of respondents expected to retire sooner. However, the experience of the fully retired was fairly evenly split between people who had retired later than their ideal age (34%) and those who had retired earlier than their ideal age (31%).
Whilst it is not ideal that many people are now expecting to have to work longer than they would like, it is perhaps reassuring that it is now less likely for people to be forced out of the labour market before they are ready. It is likely that the removal of the statutory retirement age and initiatives to encourage and enable older workers to remain in the labour market for longer, such as the right to flexible working and work to encourage fairer recruitment practices, has had a positive impact in this respect.
3.3. Expectations for income in retirement
There are two main approaches taken to assessing the adequacy of income in retirement. The first is to define income requirements in terms of specific income amounts. The Pension and Lifetime Savings Association, for example, sets a minimum income threshold of £10,200 per year for a single person outside London, rising to £20,200 for a single person to enjoy a moderate lifestyle and £33,000 to enjoy a comfortable lifestyle in retirement (PLSA, 2019).
The second approach is to identify the proportion of pre-retirement income someone would need in retirement in order to replicate working-life living standards in retirement. This so-called replacement rate varies depending on the level of a person’s pre-retirement income. Based on the replacement rates established by The Pension Commission in 2004, someone earning less than £14,500 in 2021 would need a replacement rate of 80% of pre-retirement earnings to replicate working-life living standards whereas someone earning £59,600 or more would need a replacement rate of just 50% (2020 figures taken from PPI, 2021).
PPLL gathered information on people’s expectations for their income in retirement using both the income amount and replacement rate approaches. People who had not yet retired were asked the amount of income they thought they would need in retirement. They were also asked for the amount of income they would need in retirement and the amount of income they expected to receive in retirement as a proportion of their current income i.e. their replacement rate. The responses people gave are presented below and can broadly be compared against the thresholds set out above[footnote 7].
3.3.1. Do people know how much income they will need in retirement?
Research commissioned by the People’s Pension suggests that, even where people have started planning for retirement, they avoid thinking about important details including how much income they are likely to need in retirement (The People’s Pension, 2021). The evidence from PPLL bears this out. Although most respondents had some or a very good idea about their required income amount (68%), only 23% had a very good idea of the amount and around a third (32%) said that they had no idea how much income they would need to retire.
The proportion of respondents who had at least some idea of their income needs in retirement increases with age but nearly one in four 60-65 year olds had no idea what income they would need in retirement.
Figure 3.4 Proportion of people not yet retired who know how much income they will need in retirement, by age
| Income amount idea | 40-49 | 50-54 | 55-59 | 60-65 | 66-70 | 71+ |
|---|---|---|---|---|---|---|
| Very good idea | 14% | 19% | 31% | 29% | 42% | 68% |
| Some idea | 48% | 45% | 41% | 48% | 42% | 20% |
| No idea | 37% | 36% | 28% | 23% | 16% | 12% |
Source: Planning and Preparing for Later Life 2020/21
Base: All respondents not yet fully retired (n=1,629)
The proportion of women reporting that they had no idea about what income they would require when retiring was higher (36%) than that of men (28%). This may be reflective of more unstable and inconsistent labour market participation for women across their lifetime; women are more likely than men to fluctuate in and out of the labour market to adopt caring responsibilities, switch between full-time and part-time working and have more prolonged periods of inactivity when they are not looking for work (Devine, Foley, & Ward, 2020; ONS, 2019b). Women are also more likely than men to be economically dependent on their partner and/or the state, leaving them more vulnerable to economic uncertainty, and as a consequence less conscious of their future income needs (Women’s Budget Group, 2018).
Even people who said they had at least some idea of the income they would need in retirement sometimes struggled to evaluate their income needs and/or expectations for retirement as a proportion of their current income. Whilst eight percent of this group did not know how much income they would need in retirement as a proportion of their current income, 16% did not know how much income they expected to receive.
3.3.2. Perception of income needs in retirement
People who had some idea of the income they would need in retirement were asked what income they thought they would need in retirement, after taxes and other deductions. The median household income requirement reported was £20,000 per year, slightly less than the PLSA threshold for a moderate lifestyle in retirement. Half of people (50%) estimated their required retirement income to between £10,500 and £22,000 a year, that is between the minimum and moderate thresholds set by the PLSA (PLSA, 2019). This is consistent with findings from previous qualitative research which found that most people estimated their income needs in retirement to be between these thresholds (Kotecha et al, 2020). It is notable however, that 10% estimated their income to be below the minimum threshold and only 19% said they would need £31,000 a year or more when the threshold for a comfortable lifestyle is £33,000 (Table A3.1 in Appendix 1).
Half (50%) of people who had not yet retired and had some idea of the income they would need in retirement reported that they would need less income in retirement than currently (Figure 3.5, first column). Just under a third (31%) thought they would need the same income as currently, whilst 11% thought they would need more. The remainder had not thought about it. Kotecha et al (2020) found that in determining whether their income needs would be higher or lower than currently, people took a range of factors into account. On the one hand expenditure is likely to be lower because of reduced mortgage payments, childcare costs and travel to work. At the same time, other people anticipated more spending on leisure activities and holidays as well as growing healthcare and residential care costs.
Just as The Pension Commission established different replacement rates based on income, there were differences in the proportion of their current income people thought they would need in retirement (Table A3.2 in Appendix 2). Higher income groups were more likely to report that they would need less than their current income in retirement, whereas lower earners – who are more likely to be struggling on their current income – were more likely to report that they would need more than their current income in retirement. Eighty-six percent of people with a current income of £44,000 or more a year thought they would need less than their current income compared with just over one in ten (12%) of those whose current income was less than £10,500. Thirty-eight per cent of people with a current income of less than £10,500 thought they would need more than their current income.
Older age groups were more likely to report that the income they would need in retirement would be the same as their current income (51% of 66-70 year olds compared with 26% of 40-49 year olds). Conversely, younger age groups were more likely to put the income they would need in retirement at two thirds or less of their current income (49% of 40-49 year olds compared with 22% of 66-70-year-olds).
It may be that younger people who have not yet retired have yet to fully consider the expenses they will incur during retirement and how much income they will need to maintain a good standard of living. It may also reflect that income levels tend to be lower among older age groups, especially those who have already semi-retired (see Table A1.5). The semi-retired may already have experienced a pre-retirement drop in income therefore meaning that they expect to need a higher proportion of an already reduced income in retirement.
Half of people who had not yet retired and had some idea of the income they would need in retirement reported that they would need less income in retirement than currently.
Figure 3.5 Income needed/expected in retirement as a proportion of current income
| Income needed or expected | Less than a quarter | About a quarter | About a third | About half | About two-thirds | About three-quarters | About the same | More than current income | Not thought about it |
|---|---|---|---|---|---|---|---|---|---|
| Needed | 1% | 3% | 7% | 17% | 14% | 9% | 31% | 11% | 8% |
| Expected | 2% | 5% | 8% | 21% | 15% | 10% | 18% | 6% | 16% |
Source: Planning and Preparing for Later Life 2020/21
Base: All respondents not yet fully retired who have some idea of income needed in retirement (Minimum n=1,159)
Homeowners were more likely than renters to say they would need less than their current income in retirement. Whereas 46% of those who owned their home outright and 70% of those who owned with a mortgage believed they would need less income, 38% of those renting from private landlords and just 11% of those renting from housing associations held the same belief. This may reflect the fact that renters, will be more likely than owner occupiers to still be incurring housing costs in retirement, will have higher income needs. It may also reflect the fact that home ownership is more common among higher earners (MHCLG, 2021).
3.3.3. Expected retirement income compared with income needs
Even though many people thought that they would need less income in retirement compared with their current income, people’s expectations for the income they would actually receive in retirement were even lower (Figure 3.5 second column). Around three in five (61%) of people expected to have an income less than their current income in retirement, and nearly two in five (37%) expected to have an income that was half or less of their current income.
Respondents with a private pension (67%) were much more likely than those without a private pension (30%) to expect their retirement income to be lower than their current income. This may be because pensions holders are more likely to be higher earners currently (see Chapter 5). It also suggests they may be aware that, despite saving into a pension, they are unlikely to be saving enough to allow them to match pre-retirement income levels in retirement.
Those with lower incomes currently were more likely than those with higher incomes to expect their income to increase during retirement (Table A3.3 in Appendix 1). Many in the lowest income group were not currently working and the State Pension is typically more generous than benefits for the working-age population. Eighteen percent of those currently earning less than £10,500 expected their income to increase in retirement compared to only two percent of those earning £44,000 or over. It was also the case that people on the lowest incomes (29%) were more likely to not have thought about their expected income compared to those with higher incomes (seven percent). Echoing findings from Chapter 2, (Section 2.4) this further suggests that those with less disposable income are less likely to have started planning for the future, perhaps because they are more concerned with current economic necessities.
Table A3.4 in Appendix 1 shows the proportion of people whose expected income needs in retirement, as measured using the replacement rate, matched their expected income. Of most concern, 26% believed that they would need more than they expected to receive and 20% had not thought about one or other of these aspects. A higher proportion of people with a private pension (28%) than those without (19%) believed that they would receive less than what they needed, further evidence perhaps that pension saving rates are insufficient.
3.3.4. Expected retirement income compared with actual income in retirement
People who had already fully retired were asked how their income in retirement compared with their pre-retirement income. As can be seen in Figure 3.6, only 12% reported that their income in retirement was the same as pre-retirement, with around two-thirds (66%) reporting that it was lower.
Around two-thirds of people already fully retired reported their income in retirement was lower than their pre-retirement income.
Figure 3.6 Expected income replacement rate in retirement for people not yet retired vs. actual income replacement rate for fully retired
| Retirement status | Less than a quarter | About a quarter | About a third | About a half | About two-thirds | About three-quarters | About the same | More than current income | Not thought about it |
|---|---|---|---|---|---|---|---|---|---|
| Not retired: Expected income vs current income | 2% | 5% | 8% | 21% | 15% | 10% | 18% | 6% | 16% |
| Retired: actual income vs pre-retirement income | 6% | 7% | 12% | 21% | 11% | 9% | 12% | 8% | 13% |
Source: Planning and Preparing for Later Life 2020/21
Base: All not yet retired respondents (1,159) and fully retired respondents (977)
Note: Respondents not yet fully retired were asked about the income they expected as a proportion of their actual income. Fully retired respondents were asked about the income they received in retirement as a proportion of their pre-retirement income.
The proportion of people already retired who reported that their income in retirement was half or less than their pre-retirement income (46%) was higher than the proportion of people who had not yet retired who expected their retirement income to be this much lower than their current income (37%). The two sets of figures are not directly comparable as they are comparing the expectations of one group of people (not yet retired) against the experiences of another (already retired). It is therefore difficult to determine whether these figures reflect people who have not yet retired being too optimistic about their prospects post-retirement or whether they reflect, at least in part, different circumstances across the two groups. It should be noted that, when asked directly how their current situation compared with their expectations, over half (55%) of people who had already fully retired reported that their financial situation was about the same as what they had expected pre-retirement. However, around one in five (21%) said their income was lower than expected. This suggests that there may be more to be done in educating people about their income needs and expectations in retirement to ensure that everyone is suitably prepared.
3.4. Sources of income in retirement
Having considered people’s income needs and expectations in retirement, this section goes on to consider where this income is expected to come from. Again, the expectations of people who have not yet retired are compared against the experiences of people who have already semi-or fully retired.
3.4.1. Expected sources of income in retirement
Most respondents who had not yet retired expected that a pension would contribute towards their retirement income. Eighty-nine percent of not yet retired respondents expected they would receive a State Pension and 79% expected to fund their retirement via an occupational or personal pension. However, only one in ten people expected their only source of income in retirement, other than the State Pension, to be a private pension. Savings and investments were expected to be an important source of income to fund retirement; 64% of not yet retired respondents believed that they would fund their retirement via this source (the same proportion, 64%, of non-retired respondents stated they currently had savings, though for many this would be savings less than £15,00). Around two in five (41%) expected to fund their retirement via family/partner support whilst around a quarter (26%) expected to generate income from equity release and around two in five (22%) expected to be able to draw on an inheritance.
Expected use of an occupational or personal pension was higher in certain groups than others, largely mirroring findings from Chapter 5 on who is more likely to have a private pension. Higher earners and those with higher levels of savings were both more likely to expect income from a private pension and other sources of non-pension income in retirement. Similarly, homeowners were more likely to have access to a private pension and also be able to draw on other sources of property-related income. Thirty-nine percent of people buying with a mortgage and 28% of outright owners who had not yet retired said they expected to make use of equity release as a source of income in retirement. Twenty-one percent of outright owners and 24% of mortgage holders expected to have income from rent. People without a private pension may be especially likely to find themselves in financial difficulties in retirement as they are also less likely to have expectations of sources of income, other than the State Pension (Figure 3.7). Current income and wealth inequalities will therefore continue and potentially be exacerbated in retirement. This suggests that finding further ways to encourage those without a pension to save for retirement will be important.
People without a private pension were also less likely to expect to have access to other sources of income in retirement.
Figure 3.7 Proportion of people not yet retired who expect to use each source of income in retirement, by whether have a private pension
| Private pension | State Pension | Private pension | Other pensioner benefits | Savings/investments | Equity release | Other income from property | Inheritance | Partner/family | Other |
|---|---|---|---|---|---|---|---|---|---|
| Has a private pension | 90% | 94% | 21% | 69% | 27% | 18% | 24% | 42% | 3% |
| Doesn’t have a private pension | 87% | 29% | 26% | 47% | 22% | 13% | 16% | 40% | 5% |
Source: Planning and Preparing for Later Life 2020/21
Base: All not yet retired respondents (1,357)
Note: Respondents could select more than one answer so percentages may sum to more than 100%
Self-employed respondents expected to use different strategies for funding their retirement compared with employees, most likely reflecting their lower access to workplace pensions. Only 68% of people who were currently self-employed expected to have income from an occupational or personal pension in retirement compared to 91% of employees[footnote 8]. Conversely, the self-employed were more likely than employees and those not currently in paid work to expect to use savings and investment to fund their retirement (80% vs 68% and 40% respectively). In practice, the income sources actually used in retirement by people who were self-employed immediately prior to retirement look much more similar to those who used by those who were employed prior to retirement, with 78% of self-employed receiving income from a private pension compared with 79% of employees (see Table A3.5 in Appendix 1). The group of people who were self-employed immediately before retirement is likely to include some people who were employees for much of their working life but moved into self-employment later in life (see Chapter 4, Section 4.1). It would be interesting to compare the experiences of those who had always been self-employed against employees but PPLL did not include full employment histories to enable such a group to be identified.
3.4.2. Expected vs. actual sources of income in retirement
Figure 3.8 compares the sources of income that not yet retired individuals expected to use to fund their retirement with those sources that individuals who had already either semi or fully retired actually used. Income from pensions (both state and private) followed by income from savings and investments were the most common source of income among retirees, just as they were expected to be among those not yet retired. However, there is some evidence that people who have not yet retired may be placing too much expectation on other sources of non-pension income. For example, only 53% of people who had fully retired said they relied on savings and investments compared with 64% of non-retirees who expected to do so. Similarly, 26% of non-retirees expected to have income from equity release and 22% expected to have income from an inheritance. The corresponding figures among fully retired respondents were six percent and 15%.
Respondents who had already retired were also asked whether their sources of income in retirement were the same or different compared with what they had previously expected. The majority (85%) reported that the sources of incomes used in retirement matched their previous expectations. Among the 15% who reported that their expectations were different, they were most likely to report using savings and investments (21%) or an inheritance (16%) that they had not expected.
A higher proportion of people who had not yet retired expected to have non-pension income in retirement compared with the experiences of people who had already retired
Figure 3.8 Expected vs actual sources of retirement income, by retirement status
| Retirement status | State Pension | Private pension | Other pensioner benefits | Savings/investments | Equity release | Other income from property | Inheritance | Partner/family | Other |
|---|---|---|---|---|---|---|---|---|---|
| Not yet retired | 89% | 79% | 64% | 41% | 22% | 22% | 26% | 17% | 4% |
| Semi-retired | 76% | 80% | 62% | 40% | 13% | 17% | 13% | 15% | 3% |
| Fully Retired | 83% | 78% | 53% | 43% | 18% | 15% | 6% | 9% | 2% |
Source: Planning and Preparing for Later Life 2020/21
Base: Not yet retired respondents (n=1,357), semi-retired respondents (n=264), fully retired respondents (n=1,007)
Notes: Respondents could select more than one answer so percentages may sum to more than 100%. Not yet retired respondents were asked about the sources of income they expected to use. Semi- and fully retired respondents were asked about the sources of income they had used.
3.4.3. Proportion of income expected to come from State Pension vs. private pension
People who expected to use or were using income from the State Pension to fund their retirement were asked what proportion of their retirement income they expected to come from this source. Only around six percent thought this would constitute their only source of income during retirement. As shown in Figure 3.8 most people also expected to or were drawing on a private pension. However, nearly one in four (24%) of people without a private pension expected the State Pension to be their only source of income in retirement as did 16% of respondents who were not yet retired but were not currently working and 15% with a current income of less than £10,500.
The proportion of retirement income expected to come from the State Pension increased with age (see Table A3.6 in Appendix 1). Whereas only 19% of 40-49 year olds expected that more than half of their retirement income would come from the State Pension, over a third (38%) of 71 year olds believed the same. This is likely to be because younger age groups are overly optimistic about how much they will be able to save privately for retirement. However, as was shown in Chapter 2 (Section 2.6), it may also reflect, at least in part, the fact that younger age groups were also more likely to underestimate the amount available via the new State Pension.
Most private pension holders only expected their private pension to provide some of their income in retirement. Forty-five percent of private pension holders expected less than 50% of their income in retirement to come from their private pension whilst only 27% expected 70% or more of their income to come from this source (Table A3.7 in Appendix 1). There were no significant differences by age or retirement status in the proportion of pension holders who expected to receive at least half of their income in retirement from a private pension but self-employed people were less likely to expect at least half of their income to come from private pensions compared with employees (45% compared with 60%).
3.5. Confidence in retirement provision
The final section of this chapter examines respondents’ confidence in their ability to support themselves during their retirement. People’s confidence about the ability to sustain a good quality of life during their retirement is likely to influence various decisions that people will make about their retirement such as when they will decide to retire and whether they will decide to gradually retire from the labour market or retire fully.
Respondents were asked to rate how confident they were on a scale from 0 to 10 that they a) had enough put by to live on in retirement b) would be able to achieve the lifestyle they wanted in retirement (see Table A3.8 in Appendix 1). Overall, respondents were fairly ambivalent about whether they would have enough to live on in retirement (mean score = 6.1). The mean score hides a lot of variation across individuals, however. Nearly a quarter of the sample (23%) rated their confidence that they would have enough to live on at only between 0-4 on the scale whilst at the other end of the distribution, 20% rated their confidence between 9 and 10.
People were slightly less confident that they would be able to achieve their desired standard of living (mean score = 5.8). However, it is perhaps surprising that there is not more difference in scores between these two measures, one of which seems to offer a more basic benchmark for income in retirement than the other.
Generally, people’s confidence that they would be able to provide for themselves in retirement increased with age, with older people, in particular, more confident that they would at least have enough to live on in retirement (Figure 3.9). It makes sense that younger people, who are further away from retirement, will currently be less confident about their living standards in the future. The greater confidence among older age groups may also reflect intergenerational differences in wealth accumulation, with younger cohorts less well placed to accumulate wealth to provide an income for retirement because of reduced access to the housing market or Defined Benefit (DB) pensions (D’Arcy and Gardiner, 2017). Research by the Institute for Fiscal Studies (IFS, 2016) found that individuals who were born in the early 1980s had accumulated approximately only half of the average wealth holdings of the 1970s cohort at the same age.
People’s confidence that they would be able to provide for themselves in retirement increased with age.
Figure 3.9 Confidence in the level of income available in retirement on a scale from 0-10, by age
| Income to retire | 40-49 | 50-54 | 55-59 | 60-65 | 66-70 | 71+ |
|---|---|---|---|---|---|---|
| Covering basic costs – scale 0-10 | 5.5 | 5.7 | 5.8 | 6.4 | 6.9 | 7.2 |
| Achieve desired lifestyle – scale 0-10 | 5.2 | 5.4 | 5.5 | 6.0 | 6.6 | 6.9 |
Source: Planning and Preparing for Later Life 2020/21
Base: all respondents (Minimum n=2,619)
Men were more confident than women about their income in retirement, something which is likely to reflect men’s more stable participation in the labour market and higher lifetime earnings. Confidence levels did not differ between employees and self-employed respondents. However, people who were not currently working were less confident than people in employment whose lack of earnings is also likely to mean they have less opportunity to save for retirement. People with a private pension were understandably more confident about their income in retirement than those without a private pension (see Table A3.9).
3.6. Conclusions
The majority of people not yet retired expected to retire at or above the SPA though many of them would ideally like to be able to retire before this. Financial considerations play a part with those on lower incomes also expecting to have to work longer. Fewer people now expect to be able to retire at their ideal age than was the case for those already fully retired.
There was a substantial degree of uncertainty around income in retirement, particularly among younger age groups. Around a third of those not yet retired said they had no idea what income they would need in retirement. Generally, respondents were aware that they would likely receive less income in retirement than they currently had, though for many people this was less than they expected to need and, comparing people’s expectations against the experiences of people already retired, it is possible that people are still overestimating their income replacement rate. Most people expected to fund their retirement through the State Pension and/or a private pension. Savings and investments were also mentioned as an important source of expected income during retirement whilst a sizeable group of people expected to use equity release or an inheritance. Comparing these experiences with the actual income sources used by people already in retirement suggests that people not yet retired may be over-estimating the extent to which they will be able to draw on non-pension wealth in retirement. People without private pensions had less recourse to other sources of non-pension wealth, indicating that pre-retirement wealth inequalities are likely to be perpetuated into retirement.
4. Transitioning between work and retirement
4.1. Introduction
The decision of when and how to end paid work and transition into retirement is a crucial part of planning for retirement (see Chapter 2, Section 2.4). It is also a decision that is becoming more complex and individual following the abolition of the statutory retirement age, along with the changes to the pensions freedoms which have blurred the boundaries between work and retirement. Many workers are taking a fluid approach to retirement, potentially moving in and out of (semi-) retirement multiple times (Platts et al, 2019). More and more workers are remaining in the labour market past the current State Pension age (SPa). At the same time however, many people still expect to retire before the SPa and many people say they would ideally like to retire even earlier (see Chapter 3, Section 3.2). There is, therefore, further work to do in encouraging people to remain in the workforce for longer.
Older people remaining in paid work has many potential benefits both for individuals and society more generally. Work can play a crucial role not only in ensuring that people have financial security later in life but also that they can enjoy the wider benefits to wellbeing that satisfying employment can bring. Employers can also benefit from the experience and skills that older workers bring to the labour market (OECD, 2020). However, these benefits are contingent on the availability of “good work” ensuring that the experience of work is fulfilling rather than just a necessity. To do so, employers and the labour market need to be able to meet the particular needs of older workers, for example accommodating additional health or caring needs and fostering a positive work environment. The government’s 50 Plus: Choices scheme (previously Fuller Working Lives) sets out a number of initiatives, developed in partnership with employers to retain and recruit older workers aged 50 and over (DWP, 2017).
This chapter seeks to contribute to the evidence base around how best to support people to work for longer by looking in detail at the experiences of workers as they approach the transition into retirement. It starts by providing some contextual information on the proportion of people in different age groups who are in paid work, employees versus self-employed, and semi-retired versus not yet retired. It goes on to look at the experiences of those currently in paid work and the importance of things like flexible working and training for promoting job satisfaction. The chapter then explores people’s preferences around work as they approach retirement. It also looks at what can be learnt from the experiences and preferences of people who retired but then returned to the labour market and people not currently working but who may return to work in the future.
As key areas of interest for policy, this chapter also spotlights a number of ways in which the experiences regarding planning for retirement among the growing number of older self-employed workers and carers differ from those of the rest of the population.
4.2. The prevalence of paid work among older age groups
To provide some context to the rest of the chapter and help inform the findings that follow, this section examines the prevalence of paid work, and different type of employment, among PPLL respondents and how this varies by age. The patterns observed, in terms of the decline in workforce participation with age, the rise in self-employment and part-time working, are broadly consistent with official statistics from the Labour Force Survey (ONS, 2020).
Overall, 55% of 40-75 year olds interviewed for PPLL were in paid work. The proportion of people in paid work decreased sharply with age, dropping off after the age of 60 (Figure 4.1). Only 44% of 60-65 year olds were in paid work.
The proportion of people in paid work decreased sharply with age.
Figure 4.1 Proportion of 40-75 year olds in paid work, by age
| 40-49 | 50-54 | 55-59 | 60-65 | 66-70 | 71+ |
|---|---|---|---|---|---|
| 82% | 82% | 71% | 44% | 14% | 5% |
Source: Planning and Preparing for Later Life 2020/21
Base: All respondents (n=2,655)
Of those currently in paid work six percent classed themselves as semi-retired. This percentage rose from two percent among those aged 50-54 to 14% of 60-65 year olds and more than one in two people still working beyond the age of 66. There was a corresponding decline with age in the proportion of workers working full-time, that is 35 hours a week or more.
Eleven percent of all 40-75 year olds and 17% of those in paid work were currently self-employed in their main job. The age gradient was less marked here, though there is some evidence that the proportion of workers opting for self-employment rises with age and semi-retirement. Thirty-seven percent of people in paid work who considered themselves semi-retired were self-employed compared to 16% of other people in paid work. It is possible that becoming self-employed may offer people in semi-retirement more flexibility to choose their own working arrangements (see Section 4.3.3.)
Among those people not in paid work, most people above State Pension age consider themselves fully retired.
Figure 4.2 Proportion of respondents in paid work with different working arrangements, by age
| Working arrangement | 40-49 | 50-54 | 55-59 | 60-65 | 66+ |
|---|---|---|---|---|---|
| Semi-retired | 0% | 2% | 5% | 14% | 55% |
| Self-employed | 13% | 20% | 16% | 23% | 34% |
| Full-time | 70% | 71% | 66% | 57% | 38% |
Source: Planning and Preparing for Later Life 2020/21
Base: All respondents in paid work (n=1,244)
Among those people not in paid work, most people above SPa already considered themselves fully retired and were not going to do any more paid work. However, there is a small group of people in the 55-59 and 60-65 age brackets who considered themselves as semi-retired and, although not currently working, may consider further paid work in the future (Figure 4.3). Section 4.5 of this chapter looks in more detail at what may facilitate the return to work of this group.
A small group of people in the 55-59 and 60-65 age groups consider themselves semi-retired and may consider further paid work in the future.
Figure 4.3 Retirement status of those not in paid work, by age
| Retirement status | 40-54 | 55-59 | 60-65 | 66+ |
|---|---|---|---|---|
| Not retired | 90% | 62% | 29% | 2% |
| Semi-retired | 8% | 20% | 13% | 4% |
| Fully-retired | 2% | 18% | 55% | 92% |
Source: Planning and Preparing for Later Life 2020/21
Base: All respondents not in paid work (n=1,411)
Spotlight: the experience of self-employment
There is ongoing public and policy interest in the long-term saving and retirement provision of self-employed people. Some of the key findings from PPLL regarding the self-employed are:
1. Around one in ten (11%) of 40-75 year olds was currently self-employed in some capacity and as many as 29% had had a period of self-employment at some point in their career. The proportion of workers currently in self-employment increased with age.
2. The main reasons given for being in self-employment were because it was the nature of the job (45%) or as a way of earning more income (42%). However, working conditions and job flexibility were also important considerations; 39% mentioned better working conditions or job satisfaction and 23% mentioned being able to fit work round caring responsibilities.
3. Most self-employed (85%) said they would prefer to remain in self-employment rather than becoming an employee. Eighty-two percent said they were very or fairly satisfied with their current work. Contrary to many other studies, PPLL did not find that overall satisfaction with work was higher among the self-employed compared with employees, satisfaction being similarly high across both groups.
4. Nevertheless, the self-employed were more likely than employees to expect to work beyond SPa, as well as having a later ideal retirement age. However, a similar proportion of employees and self-employed (55%) said they would like to work less as they approached retirement.
5. A higher proportion of self-employed 40-75 said they had not yet started saving for retirement compared with employees (22% vs 7%). Those that had started saving tended to have done so later.
6. The self-employed were less likely to have a private pension, 65% did so compared with 89% of employees. Self-employed pension holders were most likely to hold a personal pension (61%) though 58% had a workplace pension (presumably from previous employment).
7. The most common reason self-employed people gave for not having a pension was that they would fund their retirement from other sources (44%). The self-employed were more likely than other groups to say that they would fund their retirement from non-pension wealth, including 80% who mentioned savings or investments and 51% who mentioned support from family or friends. Only three percent of the self-employed expected to be reliant solely on the State Pension.
8. The self-employed were among the groups hardest hit by the COVID-19 pandemic. Three in five (60%, compared 21% of employees) said they had experienced a lost in income and nearly one in five (19%, compared to 7% of employees) said they now expected to retire later than planned.
Spotlight: Providing informal care and planning for retirement
People with caring responsibilities may face particular challenges as they approach retirement and there is policy interest in how to support this growing group. A selection of the key findings from PPLL are as follows:
9. Among 40-75 year olds, 37% reported providing some unpaid, informal care for family members, friends, neighbours or others. This could be for people either inside or outside of their household[footnote 9].
10. Caring responsibilities were more prevalent among women (41% compared to 33% of men). Around half of single people living with financial dependents (52%) provided some unpaid care.
11. The level of people’s caring responsibilities varied. Around half of carers (46%) spent less than five hours a week caring. However, around one in six (17%) spent 20 hours or more. People aged 55-64 were especially likely to have larger commitments.
12. Nearly half of those providing informal care were employees (47%), 25% were fully retired, 18% not working and 11% self-employed.
13. Providing informal care does not seem to have a big impact on planning for retirement. There was no significant difference in the age at which carers started saving for retirement, 46% of carers started saving in their 20s compared to 41% of those that are not carers, and carers were actually more likely to have a private pension (80% vs. 74%). There were few differences by carer status in the age that people started planning to transition away from work or people’s expected age of retirement.
14. People providing informal care do seem to have different employment needs and may require additional support from their employer. In common with other people in paid work, carers reported high levels of satisfaction with work: 85% reported they were very or fairly satisfied with their current working arrangements. However, carers were more likely to have requested a change to their working conditions in the last 5 years (26% vs 17% of non-carers). Among people not yet retired, carers were also more likely to report that employer actively supporting caring needs (41% vs 30% of non-carers), workplace adjustments for health condition (32% vs 22%) and being able to take on a less demanding role (30% vs 24%) would help them to continue working longer.
4.3. Current work arrangements
Crucial to informing the roll-out of the government’s 50 PLUS: Choices scheme is understanding how satisfied people in paid work are with their current working arrangements and what drives this satisfaction. The higher people’s levels of satisfaction with work the more likely they are to remain in the workforce (Paullin and Whetzel, 2012).
4.3.1. Satisfaction with current working arrangements
Across all people aged 40-75 in paid work, satisfaction with current working arrangements was very high. Eighty-eight percent of people currently in work were either satisfied (44%) or very satisfied (44%).
Satisfaction levels with current working arrangements were high across all age groups.
Figure 4.4 Proportion of 40-75 year olds currently in paid work satisfied with their working arrangements, by age
| How satisfied | 40-49 | 50-54 | 55-59 | 60-65 | 66+ |
|---|---|---|---|---|---|
| Very satisfied | 46% | 45% | 41% | 37% | 54% |
| Satisfied | 44% | 44% | 42% | 48% | 40% |
| Neither satisfied or dissatisfied | 6% | 7% | 8% | 6% | 4% |
| Very dissatisfied/Dissatisfied | 5% | 4% | 9% | 8% | 2% |
Source: Planning and Preparing for Later Life 2020/21
Base: All respondents currently in paid work (n=1,241)
Figure 4.4 shows that satisfaction levels were high across all age groups. The proportion of people saying they were very satisfied was lower among the 60-65 age group, that is those approaching the SPa but then increased again for those 66 or older (significant at the 10% level). Ninety-three percent of semi-retired individuals were at least fairly satisfied compared with 87% of those who were not retired[footnote 10]. These findings perhaps suggest that those who continue to work beyond SPa (many of whom are semi-retired) do so, at least in part, because of the satisfaction it affords (see also Section 4.5.1).
Although levels of satisfaction were high across all groups, certain groups were more likely to experience higher work satisfaction than others. Higher income was associated with greater satisfaction with work – 93% of those earning £44,000 or more were either fairly satisfied or very satisfied, compared to 78% of those with a personal income that was less than £10,500 - as was working in professional or associated professional and technical occupations (91% and 94% at least fairly satisfied). People working in sales/customer service and skilled trade occupations had the lowest satisfaction (73% and 80% at least fairly satisfied). These differences by occupation may in part be due to differences in income but are also likely to reflect differences in working practices, such as the availability of flexible working (see Section 4.3.2) and/or the greater impact of COVID-19 on certain sectors.
Whereas most research points to the self-employed being more satisfied with work than employees (Hundley, 2001; Benz and Frey, 2008), among PPLL respondents employees were slightly more likely to be satisfied than the currently self-employed (89% compared with 82%)[footnote 11]. This may be due to the greater impact of COVID-19 on the self-employed (see Chapter 2, Section 2.6). Workers who reported that the COVID-19 pandemic had had one or more impacts on their employment, including a reduction in income, were less satisfied comparted with people who reported no impact (82% compared with 90% very or fairly satisfied).
4.3.2. Flexible working
One of the levers that policymakers may use to encourage people to work for longer is to encourage employers to offer flexible working. Being able to work flexibly has repeatedly been found to increase satisfaction with work (Centre for Ageing Better, 2020b; Working Families, 2020). Fifty-two percent of PPLL respondents with flexible working hours reported being very satisfied with their work conditions, compared to 37% of those without it. Table A4.1 in Appendix 1 shows that just under half (47%) of those currently in paid work did not have any type of flexible working arrangement. The most common type of arrangement (also reported by 47%) was flexitime or flexible working hours. People who were semi-retired were more likely than those who were not retired to be working flexibly (57% compared with 46%)[footnote 12].
Despite having lower levels of satisfaction with work overall, the self-employed were much more likely to have access to flexible working compared with employees; 68% of the self-employed had some form of flexible working available compared with 50% of employees. It is notable that, when asked their reasons for becoming self-employed, 39% of people currently self-employed or with previous experience of self-employment mentioned “better working conditions or job satisfaction”, whilst 23% became self-employed to fit around their caring responsibilities. Although the main reasons given for becoming self-employed related to the nature of the job (mentioned by 45%) and income requirements (42%), it appears that the opportunities self-employment can afford for more flexible working are also important.
As with overall job satisfaction, access to flexible working also varied by income and occupation, with those earning £44,000 or more a year (60%) and managerial and professional occupations (64%) being most likely to have some form of flexible working. Flexible working was least prevalent in caring, leisure and other service occupations (46%) as well as sales/customer service (42%) and elementary occupations (31%). There remains some work to do in ensuring that all workers, including those who most need to work longer for financial reasons, can access flexible working arrangements if required. This is not straightforward, especially given the potential limitations of flexible working in some occupations and the different forms that flexible working can take regarding, for example, when and where work is completed (Gloster and Cockett, 2020).
4.3.3. Requests to change working arrangements
As well as looking at the proportions of people who currently have flexible working hours, further insights into the demand for flexible working is provided by data on whether people have proactively requested flexible working and why. However, data on whether these requests were accepted by employers was not collected.
All employees now have the right to request flexible working from their employer if they have worked for them for more than 26 weeks. Table A4.2 in Appendix 1 shows the proportion of employees who had requested a change to their regular working arrangements in the last five years.
Although most people had not requested a change in working arrangements, one in five (20%) had done so. There were no significant differences by age in the proportion of people requesting to change their working arrangements though people who were semi-retired were more likely to have done so than other employees (30% compared with 20%). This provides further evidence that semi-retirement seems to be associated with greater flexibility and people being in a better position to tailor their working arrangements to suit them. It is perhaps surprising that more older workers have not requested a change in their working arrangements though it is not possible to determine from the data available whether this is because there is no demand or whether people do not think their request would be accepted.
Women were more likely than men to have made a request (25% compared with 16%). Similarly, those who act as a carer (in any capacity) were more likely to request a change in their working arrangements; 26% of carers had requested a change compared to 17% of those who are not carers. There is some evidence that bad health was also associated with requests to change working arrangements. Those with only fair or bad health were much more likely than those with good or very good health to have requested a change (34% and 41% compared with 17%).
As shown in Table A4.3, the most common requests made were to change the days or hours worked (34%) or to reduce the number of hours worked (31%).
The most common reason given for requesting a change in working arrangements was to achieve a better work-life balance, mentioned by 32% of people who had made a request. Unsurprisingly, given the differences just described, caring responsibilities and health were also important. Twenty-seven percent mentioned caring for children or grandchildren as a reason, with a further eight percent mentioning the need to care for parents or other elderly relatives. Eighteen percent of people mentioned their own physical or mental health needs as a reason for requesting a change in working arrangements.
4.3.4. Access to training
Work-related training is another aspect of employment that can have positive benefits for individuals, including leading to wage progression. At the same time there is evidence that older workers may be less likely to be offered work-related training (ONS, 2019c). A lack of skills, and little or no opportunity to help to improve them if necessary, could disincentivise continued, long-term work (Paullin and Whetzel, 2012).This section therefore looks at the extent to which workers, especially as they approach retirement, are being given access to the training they need.
Just over half of those currently in paid work had had some sort of training in the past 12 months, meanwhile two in five said they wanted more training.
Figure 4.5 Proportion of people in paid work who had training the last 12 months and the proportion that would like more training, by age
| Amount of training | 40-49 | 50-54 | 55-59 | 60-65 |
|---|---|---|---|---|
| Training in last 12 months | 60% | 60% | 49% | 46% |
| Would like more training | 52% | 40% | 36% | 26% |
Source: Planning and Preparing for Later Life 2020/21
Base: All respondents in paid work (n=1,241)
Just over half of those currently in paid work (55%) had some sort of training in the past 12 months whilst two in five (41%) said they wanted more training. The proportion of workers receiving training decreased with age; 49% of those aged 55-65 had received training compared with 60% of 40-54 year olds. As Figure 4.5 shows, this partially reflects the fact that older, semi-retired workers were less likely than younger age groups to want training – perhaps because they are thinking about working less or taking on less responsibility as they approach retirement (Section 4.4). However, there is still demand for training; around a quarter of people 60-65 in paid work said they wanted more work-related training. Among those who felt there was age discrimination in the workplace, 34% felt this because older workers were overlooked for training opportunities (see Section 4.3.5 for more details).
Among those who wanted more training, the most common type of training requested was training focusing on technical or practical skills or computer/IT skills.
Figure 4.6 Proportion saying they would like each type of training
| Technical/practical skills | Using computers or IT | Management training | Dealing with people/ communication skills | Retraining for different role | Language skills | Other |
|---|---|---|---|---|---|---|
| 53% | 50% | 34% | 32% | 21% | 21% | 5% |
Source: Planning and Preparing for Later Life 2020/21
Base: All respondents that would like more work-related training (n=460)
Employees were more likely to have received training than the self-employed (58% compared with 37%), probably reflecting the fact that a lot of training is employer-provided/mandated. There were also differences by occupation with training most common in caring, leisure and other service occupations (74% in the past 12 months) and professional occupations (69%) and least common in skilled trade occupations (33%). However, it is difficult to be sure how much this reflects the greater need for training related to COVID-19 in some occupations compared with others vs. more persistent differences in access to training, for example because there is higher self-employment in skilled trade occupations.
Figure 4.6 shows that among those who did want more training, the most common type of training requested was training focusing on technical or practical skills (mentioned by 53%) or computer/IT skills (50%). This may in part reflect the greater importance of these skills during the COVID-19 pandemic as, for example, more people have had to work remotely. However, these are also skills that are always likely to need refreshing on a frequent basis as technology and best practice develops.
4.3.5. Age discrimination
The presence, or perceived presence, of age discrimination in the workforce may be a key barrier discouraging people from working longer or coming back into the workforce.
Most people did not report any experience of age-based discrimination in the workplace. However, a sizeable minority believed that there either was (eight percent) or could be (a further six percent) age-based discrimination in their own workplace. Three percent had themselves been treated unfairly on the grounds of age.
There was little variation in perceived age discrimination across groups. However, there is some evidence that people with worse health were more likely to report age discrimination in the workplace, perhaps because they feel that the employers have not been making sufficient allowances for their needs. Twelve percent of those with a disability or illness lasting 12 months or more felt there was work-place age discrimination compared to seven percent of those without a disability.
When asked why they thought there was age discrimination in their workplace, the most commonly given reasons were that older workers were less likely to be promoted and less likely to be hired than younger workers (Figure 4.7). However, perhaps most concerningly, almost half of those who believed there was discrimination in the workplace (46%) reported that older workers were criticised or viewed negatively by colleagues.
The most common reasons given for believing there was age discrimination in the workplace were that older workers were less likely to be promoted and less likely to be hired than younger workers.
Figure 4.7 Proportion giving each reason for believing there is age discrimination in the workplace
| Less likely to be promoted | Less likely to be hired than younger workers | Criticised or viewed negatively by colleagues | Not listened to | More likely to be made redundant | Passed over for training | Other | None of these reasons |
|---|---|---|---|---|---|---|---|
| 64% | 63% | 46% | 42% | 41% | 34% | 10% | 1% |
Source: Planning and Preparing for Later Life 2020/21
Base: All respondents in paid employment who believe there is/maybe is age discrimination (n=135)
4.4. Attitudes to work approaching retirement
As well an understanding people’s satisfaction with their current working arrangements, another important factor to consider when thinking about how to encourage people to remain in work is whether and how people would like to change their working arrangements as they approach retirement. Knowing how people would prefer to work is potentially important in helping policymakers and employers to think about how best to accommodate these preferences in the workplace. Knowing for how long people plan to continue working, and whether they plan to work less as they approach retirement, is also important for understanding how long and how much people will be able to continue saving for their retirement.
Throughout this section, what people who were not yet retired and in paid work said they would like to do as they approach retirement is compared against what people who have already semi- or fully retired actually did as they approached retirement. This comparison will help to shed light both on how realistic people’s expectations are as well as any areas where potentially more could be done to meet people’s preferences as they approach retirement.
4.4.1. Changes to amount of work approaching retirement
People were asked both about whether they wanted to change the number of hours they worked as they approached retirement and also whether they wanted to change who they worked for.
Just over half (54%) of those not yet retired but in paid work said they wanted to work less as they approached retirement. Only four percent said they wanted to work more with the remainder hoping to work the same amount as currently. This is consistent with the earlier findings (Section 4.3.3) which showed that the most common request from people who wanted to change their working arrangements was to reduce the amount of work they do.
The proportion of people who were not yet retired who said they wanted to work less decreased with age (see Table A4.4 in Appendix 1) although many people still wanted to; 50% of 60-65 year olds said they wanted to work less compared with 61% of 40-49 year olds. It is not possible to determine from the data whether this reflects a genuine desire for people to keep working longer as they approach retirement age or perhaps a growing realisation that they cannot afford to work less pre-retirement.
The proportion of retired individuals who reported that they had actually worked less as they approached retirement was even lower than the proportion of older non-retirees who wished to do so (Figure 4.8). Only 34% of those already retired said they had worked less prior to retirement. This figure was higher though among those who were currently semi-retired (48%) who, as has been shown throughout this chapter, seem to be in a stronger position to choose how they work. This again suggests that people’s initial preference to work less as they approach retirement is unlikely to be realised. However, it is not possible to determine on the basis of this evidence whether this is because people’s preferences change as they approach retirement, whether they realise they cannot afford to work less, or whether their employer did not make it possible for them to work less.
Higher income groups were more likely to report that they would like to work less as they approach retirement, presumably because they are better placed to be able to do so. Seventy percent of those with a personal income of £44,000 or more a year would like to work less as they approach retirement, compared to 29% of those with an income below £10,500. Similarly, those in management or professional occupations (66% and 67% respectively) were more likely to say they would like to work less than those in occupations such as sales and customer services (39%) or elementary occupations (32%) which are typically less well paid. This suggests that people’s working needs later in life are likely to be driven at least in part by financial considerations as well as their preference for work.
The proportion of retired respondents who reported that they had worked less as they approached retirement was lower than the proportion of non-retirees who wished to do so.
Figure 4.8 Preferred working hours as approach retirement, by retirement status
| Working or type of retirement | Less | The same | More |
|---|---|---|---|
| In paid work | 54% | 41% | 4% |
| Semi or fully retired | 34% | 61% | 5% |
Source: Planning and Preparing for Later Life 2020/21
Base: All non-retired respondents in paid work (n=1,100); All respondents semi-retired or fully retired (n=1,263)
People would generally prefer to keep working for the same organisation they currently work for as they approach retirement. Two-thirds (66%) of respondents who had not yet retired but were in paid work wanted to continue working for the same employer, whilst a further 12% wanted to continue being self-employed. A small proportion (nine percent) wanted to become self-employed as they approached retirement (Figure 4.9).
The desire to maintain the status quo as they approach retirement was particularly marked among older age groups. They were more likely to want to remain with the same employer and to remain self-employed (the latter significant at the 10% level).
The experience of people who were already retired appears to be consistent with people’s desire to continue in the same line of employment as approach retirement.
Over three-quarters (78%) of people who had fully retired reported that they had stayed as an employee with the same company as they approached retirement.
Most workers wanted to continue working for the same company as they approach retirement .
Figure 4.9 Whether would like to/did change working arrangements as approach retirement, by retirement status
| Working or type of retirement | Work for same company | Stay self-employed | Work for different employer in different job | Work for different employer in same or similar job | Become self-employed in different job | Become self-employed in the same or similar occupation |
|---|---|---|---|---|---|---|
| All in paid work | 66% | 12% | 7% | 6% | 5% | 4% |
| Semi or fully retired | 72% | 9% | 8% | 6% | 3% | 2% |
Source: Planning and Preparing for Later Life 2020/21
Base: All respondents in paid work (n=1,096); All respondents semi-retired or fully retired (n=1,261)
Interestingly, although the majority of the semi-retired also maintained their current employment as they approached retirement, there is some evidence that this group were more likely to switch employer. Twenty-one percent of the semi-retired had changed employers as they approached retirement, including 14% who changed occupation, whilst nine percent became self-employed. Perhaps changing employment enabled them to become semi-retired and enjoy reduced hours and greater flexibility as observed in Section 4.3.2.
4.4.2. Changing the level of responsibility as retirement approaches
Current and retired workers were also asked about their preference for taking on more or less responsibility as they approached retirement. These preferences may have important implications for the type of work people are willing to do as they approach retirement.
A lot of people felt that the questions about level of responsibility were not relevant to them with up to 30% saying this did not apply in their job. This may be because their role does not involve them taking on responsibilities or, consistent with the fact that the self-employed were more likely than employees to select this option, because they saw no way to change their level of responsibility.
Most workers were happy maintaining their level of workplace responsibility as they approached retirement.
Figure 4.10 Whether would like/experienced a decrease in work responsibility as approach retirement, by retirement status
| Working or type of retirement | No decrease in responsibilty | Taking responsibility for less/fewer projects | Working less independently/taking fewer decisions | Managing fewer staff | Other | None of these reasons |
|---|---|---|---|---|---|---|
| All in paid work | 45% | 19% | 10% | 10% | 2% | 30% |
| Semi or fully retired | 53% | 13% | 10% | 11% | 3% | 27% |
Source: Planning and Preparing for Later Life 2020/21
Base: All respondents in paid work (n=1,107); All respondents semi-retired or fully retired (n=1,278)
It was most common for people to say that they did not want either to decrease (45%) or increase (54%) their level of responsibility as they approached retirement (Figures 4.10 and 4.11). However, some people did say they would like a change. One in four (25%) of people said they would like to decrease the level of responsibility in their job as they approached retirement whilst a similar proportion said they would like an increase in responsibility as they approached retirement. These findings emphasise the fact that not everyone will have the same needs or preferences as they approach retirement and that employers need to be flexible enough to accommodate these different requirements if they are to get the best out of their workforce.
Figure 4.11 Whether would like/experienced an increase in work responsibility as approach retirement, by retirement status
| Working or type of retirement | No increase in responsibility | Working more independently/taking more decisions | Taking responsibility for more/larger projects | Managing more staff | Other | None of these reasons |
|---|---|---|---|---|---|---|
| All in paid work | 54% | 14% | 13% | 7% | 3% | 24% |
| Semi or fully retired | 59% | 8% | 9% | 4% | 2% | 27% |
Source: Planning and Preparing for Later Life 2020/21
Base: All respondents in paid work (n=1,068); All respondents semi-retired or fully retired (n=1,213)
The experiences of those people who had already retired in large part largely mirror the preferences of those who have yet to retire although retirees were less likely to report both that they had actually decreased responsibility or increased responsibility. As with the findings on reducing hours as people approach retirement it is not possible to determine whether this reflects changing attitudes on the part of workers as they get nearer to retirement or whether there are barriers to their preferences being realised.
4.5. Returning to work
As well as encouraging people already in work to remain in work for longer, another way in which to promote longer working lives, and the financial and wider social and personal benefits associated with that, is to facilitate the return to work of people who have left the labour market. This section looks in more detail at how this might be achieved.
4.5.1. The experience of returning to the workforce after retirement
One way to gain an insight into what might encourage people to return to the workforce, and how much demand for this there is likely to be, is to look at the experience of those individuals who have returned to work following retirement.
Only a small proportion of people 50 and over, five percent, had returned to work after previously considering themselves fully retired. This proportion increased with age, with eight percent of 66-70 year olds having returned to work after retirement, but remained low across all age groups.
For most people returning to work after retirement was a positive choice, the most common reasons for doing so being for something to do and to keep active.
Figure 4.12 Proportion of those that have returned to work following retirement selecting each reason for returning to work
| Something to do | Keep active | Financial reasons | Health improved | Family circumstances changed | Partner died or relationship broke down | Other | None of these |
|---|---|---|---|---|---|---|---|
| 60% | 53% | 40% | 13% | 7% | 5% | 11% | 1% |
Source: Planning and Preparing for Later Life 2020/21
Base: All 50+ respondents who would consider returning to work after retirement (n=131)
People who were currently semi-retired were more likely to report returning to work after retirement, 16% having done so compared with two percent who no longer consider themselves retired. It appears that people do not necessarily want to return to full-time work after retirement but are looking to be able to do some amount of paid work. Seven percent of those not currently working had considered themselves fully retired and returned to work, compared to four percent of current employees and two percent of the self-employed.
Figure 4.12 sheds more light on people’s reasons for returning to paid work after retirement. For most people, the return to work appears to have been a positive choice with the most common reasons being for something to do (60%) and to keep active (53%). Financial considerations did also play a part, however, with 40% of people who had returned to work after retirement giving this as a reason.
4.5.2. Likelihood of returning to paid work
This next section looks at the likelihood of those people not in paid work returning to the labour market and what might encourage them to do so.
Around two-thirds of people who had not yet retired but were not currently working thought it was at least fairly likely they would return to work.
Figure 4.13 Likelihood of returning to work, by retirement status
| Return to work | Not retired | Semi-retired |
|---|---|---|
| Definately | 51% | 12% |
| Probably | 20% | 45% |
| Probably won’t | 8% | 29% |
| Definately Won’t | 12% | 1% |
| Depends | 9% | 13% |
Source: Planning and Preparing for Later Life 2020/21
Base: All respondents not in paid work and not fully retired (n=230)
Nearly one in four (24%) of PPLL respondents who did not yet consider themselves fully retired were not in paid work. Of these, 38% were not yet retired but were permanently unable to work due to bad health or disability whilst 26% were unemployed and actively looking for work. Seventeen percent considered themselves semi-retired from paid work. The remainder were not working for other reasons including education or looking after the home. For many people it was a long time since they had last been in the workforce, 11 years for those who were not yet retired and five years for the semi-retired. A return to work would therefore be a big change.
Figure 4.13 shows the proportion of people not currently working, but who did not yet consider themselves fully retired, who thought it was likely they would return to work in the future. Around two-thirds of people (66%) thought it was very or fairly likely they would return to work, with 36% saying it was very likely. People who already consider themselves semi-retired were less likely to say they were likely to return to work but, notably, still over half (58%) thought it was at least fairly likely they would return. Over one in ten (13%) of the semi-retired were not sure if they would return to work but said it would depend. This suggests that encouraging people back to work may be contingent on meeting the requirements of older workers, for example with respect to demand for flexible working (see Section 4.6).
People who did not rule out a return to work were asked about their preferences for doing so and, in particular, whether they preferred to work full or part time and as an employee or self-employed (Figure 4.14). Most people wanted to return to work as employees rather than self-employed, though a sizeable minority (including 27% of semi-retirees) would prefer to return as self-employed. Whereas those who had not yet retired were most likely to want to return to work full time, the semi-retired were much more likely to want to return part-time; 59% wanted to be a part-time employee and 24% part-time self-employed. This is consistent with the experiences of the semi-retired who are currently in work, many of whom enjoy part-time and/or flexible working.
Most people wanted to return to work as employees rather than self-employed.
Figure 4.14 Proportion selecting type of work they would like return to, by retirement status
| Type of work returning to | Not retired | Semi-retired |
|---|---|---|
| Full-time employee | 48% | 14% |
| Part-time employee | 31% | 59% |
| Full-time self-employed | 9% | 3% |
| Part-time self employed | 12% | 24% |
Source: Planning and Preparing for Later Life 2020/21
Base: All respondents who may return to work in the future (n=219)
There is some evidence that people with higher household incomes were more likely to say they would definitely return to work compared with those on lower incomes[footnote 13] and that people with a private pension were also more likely than those without a private pension to say they would definitely return (41% compared with 26%). This may reflect that returning to work is often driven by a desire for something to do rather than financial need (see Section 4.5.1 above). Alternatively, it may be that people on lower incomes, or who have been out of work for longer, are less optimistic about their chances of being able to return. Either way it presents a challenge for policymakers regarding how best to facilitate the return to work of those who are most likely to benefit financially from working longer.
4.6. People’s own views on what would encourage them to work longer
Finally, to further inform policymakers’ views on what might be needed to further the participation of older workers in the labour market, and ensure any initiatives introduced best meet people’s needs, this section looks specifically at what respondents themselves said would encourage them to keep working for longer. People who were not yet retired were asked what would encourage them to keep working for longer whilst respondents who were already fully retired were asked what would have helped them continue working for longer before they retired.
Figure 4.15 demonstrates that there are a number of different things that could help older people remain in work. Nearly three-quarters (73%) of people who had not yet fully retired mentioned at least one factor that would have helped them continue working longer. Further emphasising the importance of flexible working as discussed in Section 4.3.2, around half of people (52%) mentioned that being able to reduce their hours (or take more holiday) would be useful and over two in five (44%) mentioned greater access to flexible working. Over a third (34%) reported that it would be helpful if employers were actively supportive of caring needs whilst around a quarter (26%) mentioned better adjustments for a health condition or disability. Just over a fifth (22%) believed a change in employer attitudes towards older workers would help.
People most commonly mentioned being able to work fewer hours or take more holidays and flexible working as things that would encourage them to work longer.
Figure 4.15 Proportion of individuals reporting each factor would help them continue working longer, by retirement status
| Type of retirement | Work fewer hours or more holidays | More flexible working | Employer more suuportive of caring needs | Less demanding job | Make adjustments for health condition or disability | Better attitudes towards older workers | Other | None of these |
|---|---|---|---|---|---|---|---|---|
| Non-retired | 52% | 44% | 34% | 26% | 26% | 22% | 1% | 27% |
| Fully retired | 22% | 19% | 17% | 15% | 11% | 11% | 1% | 56% |
Source: Planning and Preparing for Later Life 2020/21
Base: All non-fully retired respondents (n=1,618); All fully retired respondents (n=964)
Women were more likely than men to feel active support for their caring needs would increase their working life (39% of women vs 30% of men). Workplace adjustments for a health condition was the most commonly mentioned factor by people in bad heath, with 39% of this group mentioning it.
People who had already fully retired were much more likely than those who had not yet retired to say that nothing would have encouraged them to work longer, with over half (56%) giving this response. This may partly reflect the fact that, whatever might have been the situation before they retired, most people who are now fully retired do not think they would want or be able to return to the workforce now.
Generally, though, when people in the fully retired group did mention factors that would help, these tended to be the same things mentioned by the not retired group with reduced hours and more flexible working being the factors most commonly mentioned.
4.7. Conclusion
The ability to work flexibly, as well as the potential to work fewer hours as they approach retirement, emerged as two of the most important factors likely to keep people in the workforce for longer (or enable those not currently working to return). These factors may also help to explain the increasing numbers of the self-employed among workers 60 and over. However, delivering on flexible working and the ability to work reduced hours presents challenges for employers and policymakers. The evidence showed that access to flexible working hours varied significantly by income and occupation. People who had already fully retired were less likely to say they had actually done this than people not yet retired were to want it. Whether this represents a change in preference as people neared retirement or barriers to being able to realise their preference is unclear and requires further investigation.
Those with additional needs, either as a result of their health or caring responsibilities, require tailored support to meet those needs. Ensuring that workers continue to have access to training is also important; although less likely to want training than their younger counterparts, there is still an active demand for workplace training among older age groups. There is also still more work to do to ensure that all workers feel treated equally regardless of age; although relatively few people said they had actively experienced discrimination at work as a result of their age, more than one in five of those not yet retired mentioned a change in workplace attitudes towards older workers as something which would help them to keep working longer.
As well as focusing on retaining the current workforce, workers not currently in the labour market also require support. Around two-thirds of people aged 40-75 who were not working but not yet fully retired thought that they would undertake to paid work in the future. People on lower incomes or without a private pension were less likely to say they would undertake paid work in future, and it is arguably this group that are most reliant on income from employment in their later years to fund their retirement.
5. Private pension provision
5.1. Introduction
Chapter 3 of this report demonstrated the importance of private pensions as a source of income in retirement, with over three-quarters (79%) of people either expecting to use or currently using a private pension to fund their retirement. However, not everyone has access to a private pension whilst those that do may not have sufficient provision (PPI, 2021). There are also questions over how engaged people are in pension planning and how well informed their choices are. In particular, the new freedom to take some or all of their pension as a lump sum may be leading people to see their pension as a windfall rather than a source of income in retirement, potentially leaving them unprovided for later in their retirement (The People’s Pension, 2021). The Financial Lives 2020 Survey (FCA, 2021) found that over half (55%) of people with an active Defined Contribution (DC) pension had low or very low levels of engagement with their pension.
This chapter contributes to the evidence base around people’s private pension arrangements, looking in more detail at who has a private pension, the types of pensions they hold and the current status of those pensions. The chapter looks in detail at the decision to access DC pensions, who chooses to access their pension, and when and how they do this.
The findings reported in this chapter are based on people’s self-reports of their pension provision. As has already been noted, many people have low levels of engagement with their pensions and this may lead to people not being aware of or misreporting some of their pension details. Respondents were given the opportunity to access their pension statements in advance of the interview. However, perhaps not surprisingly given that the Financial Lives Survey found that 29% of people could not recall receiving a pension statement in the last 12 months and a further 14% had received a statement but not read it (FCA, 2021), most people did not take up this option. Only 19% of respondents were able to access a pension statement for all of the pensions they answered about whilst a further six percent were able to access a statement for some of the pensions answered about. Whilst there is a need to be cautious about the precise estimates of pension numbers and pot size reported here, this self-reported information can still provide important insights into how pension holdings and decision-making vary across sub-groups. Furthermore, given that many people are likely to be planning for retirement based on imperfect knowledge of their pension holdings, it is important to understand more about what people perceive their pension situation to be.
Most of the analysis reported in this chapter is conducted at the individual level. However, given that some people hold more than one pension, a small number of findings (relating to the age at which people accessed their pension, pension pot size, and the uses of any cash lump sum taken) are based on analysis at the pension level, that is the base used to calculate percentages is the number of pensions held rather than the number of pension holders.
5.2. Who has a private pension
The majority of individuals 40-75 years old (76%) had a private pension, that is a workplace pension or a personal pension they arranged themselves. This includes pension that are currently active, and that they are paying into (see Section 5.3), pensions they have retained but are no longer contributing to or pensions which they have already accessed or started drawing an income from (see Section 5.5). However, nearly one in four (24%) of adults 40-75 currently have no private pension provision. As was shown in Chapter 3 (Section 3.4) this group are also less likely to have access to other wealth to fund their retirement and so are likely to be dependent on family members and/or the state to provide for their retirement. Among private pension holders, workplace pensions are much more common than personal pensions with 85% of respondents with a private pension saying they had a workplace pension and 31% saying they had a personal pension.
Private pension provision varies considerably across different population sub-groups (see Table A5.1 in Appendix 1). Among PPLL respondents, all of whom were 40 and over, there was no significant variation by age in the proportion of people who had a private pension. This fits with the fact that most people reported starting to save for their retirement in their 20s or 30s (see Chapter 2). Women were less likely than men to have a private pension (71% vs 82%). People with a partner or financial dependents were more likely to have a private pension than single people with no financial dependents.
Whether or not someone has a private pension is closely related to their employment status, and hence opportunities for saving into a pension. Employees (89%) were more likely than the self-employed (65%) or those not in work (51%) to have a private pension, reflecting their access to workplace pensions. The fact that such a high proportion of people in self-employment have a private pension is likely to be, in part, the result of them having taken out workplace pensions prior to becoming self-employed (as shown in Chapter 4, self-employment increases with age). Over half (58%) of the currently self-employed who had a private pension reported having a workplace pension. The self-employed were also the most likely to have a personal pension (61%, see Figure 5.1). It remains the case, however, that the self-employed are less likely to have a pension than employees. The former, as noted in Chapter 3 (Section 3.4), were less likely to be expecting to use a pension to fund their retirement and more likely to expect to use money from earnings/savings. This in turn is consistent with the fact that the self-employed generally expected to retire later than employees (Chapter 3, Section 3.1), and were more likely to say they would never retire.
Employees were more likely than the self-employed to have a private pension.
Figure 5.1 Proportion of pension holders with a workplace or personal pension, by employment status
| Type of pension | Employee | Self-employed | Not in paid work | Fully retired |
|---|---|---|---|---|
| Workplace | 92% | 58% | 82% | 81% |
| Personal | 24% | 61% | 33% | 36% |
Source: Planning and Preparing for Later Life 2020/21
Base: All respondents with a private pension (Minimum n=2,090)
Notes: Respondents could select more than one answer so percentages may sum to more than 100%
There were also differences in pension provision by occupation; 91% of people in professional occupations had a private pension compared with 61% of people in sales or customer service occupations and 51% in elementary occupations. This is likely to be related to income but may also reflect differences in the employment conditions across different sectors (levels of part-time working, zero hours contracts etc.) and the availability of pension provision.
There is a strong relationship between income and private pension provision. Income pre-retirement is a potential contributing factor to not being able to afford a private pension (see Section 5.2.1) and a possible consequence of not having one. Figure 5.2 shows that among people who had not yet retired, people with higher incomes were more likely to have a private pension, consistent with the fact that one of the main reasons given for not saving into a pension is not being able to afford to. Among the fully retired, for whom private pensions are a potentially important source of income, those on the lowest income were again less likely to have a private pension.
Knowledge and engagement may also play a role in whether or not people have a private pension with people who are better informed recognising the importance of a private pension (Table A5.1). People with higher financial literacy were more likely to have a private pension with 86% of people classed as having high financial literacy having a private pension compared with 53% in the low financial literacy group. People who had consulted a financial adviser were also more likely to have a private pension (93%). However, given that financial literacy and use of a financial advisor were also higher among higher income groups, it is not possible without further analysis, to determine whether knowledge has an independent effect in encouraging the take up of private pensions.
People with low incomes who had not yet retired were less likely to have a pension. People with low incomes post-retirement were also less likely to have a pension.
Figure 5.2 Proportion of people with a private pension, by income and retirement status
| Income | Not retired | Semi-retired | Fully retired |
|---|---|---|---|
| Upto £10,499 | 48% | 63% | 53% |
| £10,500 to £26,999 | 76% | 85% | 53% |
| £27,000 to £43,999 | 88% | 95% | 92% |
| £44,000+ | 98% | 98% | 94% |
Source: Planning and Preparing for Later Life 2020/21
Base: All respondents (n=2,650)
5.2.1. Reasons for not having a private pension
Over half (53%) of people without a private pension mentioned not being able to afford to make contributions as a reason for not having one (Figure 5.3). Lack of knowledge/interest was given as a reason by 35% of people, whilst 16% mentioned they didn’t trust pension providers (See Chapter 2, Section 2.7 for more on trust in pensions).
Unsurprisingly, the proportion of people without a pension saying it was too late to start a pension increased with age; nine percent of 40-49 year olds gave this as a reason rising to 27% among 50-54 year olds and 37% of 55-59 year olds. Although only 6% of people overall said it was too early to start a pension, 16% of people in the 40-49 age bracket gave this as a reason.
The most common reason for not having a pension was not being able to afford to pay into one.
Figure 5.3 Reasons given for not having a private pension
| Can’t afford it | Don’t know enough/not interested | Too late to start one | Rely on other income | Not working | Don’t trust them | Don’t think will live that long | Too early to start one | Other |
|---|---|---|---|---|---|---|---|---|
| 53% | 35% | 32% | 32% | 27% | 16% | 9% | 6% | 10% |
Source: Planning and Preparing for Later Life 2020/21
Base: All respondents without a private pension (n=527)
Notes: Respondents could select more than one answer so percentages may sum to more than 100%
Lower income groups were especially likely to mention affordability as a reason for not having a pension with 62% of those not yet retired and with an income of less than £10,500 giving this reason along with 68% of those not in paid work. Affordability was less of a barrier for the self-employed with only 34% giving this reason. The most common reason for not having a pension among the self-employed was that they would rely on other sources of income (see also Chapter 3, Section 3.4). Forty-four percent of self-employed people gave this as a reason for not having a pension compared with 36% of employees and 24% of those not working.
People without a private pension who had not yet retired were also asked how likely they were to take out a pension in the next five years. Around half (53%) said they were not at all likely but 31% said they were very or fairly likely. Younger age groups were more likely to say they were likely to take out a pension but still as many as 35% of 40-49 year olds without a pension said they were not at all likely to take out a pension in the next five years.
5.3. The nature and extent of private pension provision
5.3.1. Number of pensions held
It is fairly common for people to hold more than one pension, especially following the introduction of automatic enrolment into workplace pensions. Half (50%) of PPLL respondents with a private pension reported having two or more pensions. Nineteen percent reported having three or more pensions (Table A5.2 in Appendix 1). These could be pensions they had already accessed or were drawing an income from as well as any pensions still in accumulation. Having multiple pensions can present challenges as it potentially complicates the decisions people have to make regarding how to optimise their pension savings and means that people can lose track of the pensions they hold (DWP, 2020c). There was no evidence that the total number of pensions people held varied by age.
It is possible that respondents underreported the number of pensions they had, either because they failed to recall all of their pensions during the survey interview, or because they had genuinely forgotten about or were unaware of some of the pensions they held. Previous estimates suggest that up to two-thirds of UK adults have multiple pension pots (a proportion which is likely to increase as people now switch jobs more frequently than in the past) whilst pension providers estimate that up to six percent of unaccessed DC pots are lost as they no longer have contact with the scheme member (PPI, 2018).
People with multiple pensions may choose to consolidate some or all of their pensions into one pot. Nineteen percent of people had done this with ten percent saying they had consolidated their pensions into an existing scheme and ten percent saying they had consolidated into a new scheme. People who held a personal pension were more likely than people with a workplace DC pension to have consolidated (32% compared with 19%). People with personal pensions tend to be more engaged with their financial planning than workplace pension holders, who include those who have been automatically enrolled in their workplace pension. Among people with a workplace pension, those with high financial literacy (27%) and those who had received advice from a financial adviser (31%) were more likely to have consolidated their pension.
The most common reasons given for consolidation were because it was easier to keep track of a single pension pot (60%) and to access a better return or range of investment options (45%). Whilst a single pension pot may be easier to keep track of than multiple pensions, the proportion of people reporting they found it very or fairly difficult to keep track of their pension savings (see Chapter 2, Section 2.3) did not vary significantly depending on the number of pensions they reported. However, as noted above, it may be that people are not always able to keep track of the number of pensions they have.
5.3.2. Types of pensions held
DC pensions have become increasingly common compared with Defined Benefit (DB) pensions in recent years (PPI, 2020). The shift towards DC pensions reflects the fact that many employers now consider DB pensions too expensive as the retired population (and hence pension liabilities) has grown, whilst auto-enrolment has led to a rapid increase in DC pensions. This shift means that the retirement income of increasing numbers of people, including people who may not previously have held savings or investments, is dependent on the decisions they make about their pensions including how much to contribute, when to start accessing their pension and how. Overall, 72% of people with a private pension reported that they had at least one DC pension compared with 44% of people who had at least one DB pension.
DC pensions were more common than DB pensions, especially among younger age groups.
Figure 5.4 Proportion of pension holders with a Defined Contribution (DC) or Defined Benefit (DB) pension, by age
| Type of pension | 40-49 | 50-54 | 55-59 | 60-65 | 66-70 | 71+ |
|---|---|---|---|---|---|---|
| DC | 80% | 71% | 74% | 70% | 67% | 59% |
| DB | 34% | 44% | 41% | 49% | 48% | 54% |
Source: Planning and Preparing for Later Life 2020/21
Base: All respondents with a private pension (Minimum n=1,889)
Respondents could select more than one category so figures may sum to more than 100% Even after excluding personal pensions, and looking just at workplace pensions, DC pensions were still more common. Forty-nine percent of people with a private pension had a DC workplace pension. Reflecting the shift towards DC pensions over time, DC pensions they were more common among younger age groups, particularly 40-49 year olds (Figure 5.4). 80% of 40-49 year olds with a private pension had a DC pensions compared with 71% of 50-54 year olds and 59% of those aged 71 and over. It should be noted that around ten percent of respondents did not know what type of pension they had despite a definition of the two pension types being available; these people have been excluded from any analysis of DC or DB pensions reported here.
As Figure 5.5 shows, people can hold multiple DB or DC pensions or a mix of both DC and DB pensions.
One in five people with a private pension had a mix of DC and DB pensions. More than half had one or more DC pensions but no DB pension.
Figure 5.5 Mix of private pensions held
| 1 x DC pension | 1 x DB pension | 2+ DC pensions | 2+ DB pensions | DB and DC pension |
|---|---|---|---|---|
| 31% | 19% | 23% | 7% | 20% |
Source: Planning and Preparing for Later Life 2020/21
Base: All respondents with a private pension who know the type of pension they held (n=1,741)
A majority of people (60%) with a DC pension reported holding just one such pension, 26% had two and 14% had three or more (see Table A5.3). It was less common for people to hold multiple DB pensions. Seventy-nine percent of people with a DB pension had one such pension, 17% had two and just four percent had three or more DB pensions.
A small proportion of people with a DC pension (seven percent) reported that at least one of their DC pensions had previously been a DB pension which they had transferred into a DC scheme. It is possible that this includes some people whose scheme was transferred from DB to DC by their employer rather than the individual making a deliberate choice to transfer schemes.
5.3.3. Pension size
The analysis below focuses on the size of the pensions held by those individuals who have not yet accessed a DC pension or started receiving a DB pension. Section 5.4 below looks in more detail at the pension pots of individuals who have accessed at least one DC pension.
People did not always know how much was in their pension pot. One in five people (20%) with a DC pension in accumulation did not know the pot size of any of their DC pensions. Overall, it was possible to obtain precise estimates for only 60% of pensions and banded estimates for a further 18%. The relatively high level of missing data on pensions is consistent with previous research pointing to the fact that people do not always engage with their pension (FCA, 2021).
The analysis below provides estimates based on those pots for which an estimate (precise or banded) was provided. There was a very wide range of pot sizes, reflecting the disparity in pension provision across individuals, which means that estimates are subject to very large standard errors.
5.3.3.1. DC pension pot size
The median amount held in DC pensions by individuals who have not yet accessed any of their DC pensions was £40,000. The median size of an individual DC pension pot in accumulation was £21,000. The size of DC pension holdings varies considerably across individuals. Around a quarter of people (24%) had total DC pension holdings of less than £10,000 but then a third (33%) had total holdings of £100,000 or more[footnote 14].
Total DC holdings increased with age and with the number of DC pensions people had in accumulation. People who also held a DB pension had, on average, larger DC pension holdings (median = £45,000) compared with people with no DB pension (median = £35,000). As Figure 5.6 shows, the pension pots of DC pension holders who only held DC pensions tended to be smaller than those of DC pension holders who also had a DB pension. Therefore, in the absence of other income sources, these individuals are likely to be more reliant on their DC pot to fund retirement than other pension holders. Twenty six percent of the first group’s total DC wealth was under £10,000 compared with 20% of the second group. The fact that people who also hold a DB pension had larger DC pots perhaps reflects the fact that DB pension holders tend to be older (see Figure 5.4).
One in four DC pension holders with no DB pension only had pension holdings of less than £10,000.
Figure 5.6 Size of DC pension holdings, by whether also hold DB pension
| Type of pension | <£10,000 | £10,000-£19,999 | £20,000-£49,999 | £50,000-£99,999 | £100,000-£249,999 | £250,000 or more |
|---|---|---|---|---|---|---|
| DC pension only | 26% | 14% | 15% | 11% | 19% | 15% |
| DC and DB pension | 20% | 17% | 16% | 17% | 14% | 17% |
Source: Planning and Preparing for Later Life 2020/21
Base: All respondents with one or more DC pensions who have yet to access any of their DC pensions (n-602)
5.3.3.2. Expected income from DB pension
People who had not yet started receiving an income from their DB pension were asked how much income they expected to receive. The median amount given was £8,490 per year (this could be received from more than one DB pension).
5.4. Saving into a pension
Whilst the majority of 40-75 year olds have at least some private pension provision, a smaller proportion are currently saving into a private pension. Just over half (55%) of all 40-75 year olds who had not yet semi- or fully retired were currently saving into a private pension.
As Figure 5.7 shows, among those who had not yet retired, younger age groups were more likely to be saving into a pension. People with higher incomes and people with financial dependents were also more likely to be saving into a pension.
Younger age groups were more likely to be saving into a pension.
Figure 5.7 Proportion of people not yet retired saving into a private pension, by age
| 40-49 | 50-54 | 55-59 | 60-65 | 66-70 |
|---|---|---|---|---|
| 60% | 63% | 52% | 39% | 33% |
Source: Planning and Preparing for Later Life 2020/21
Base: All respondents not yet retired (n=1,352)
Further underlining the importance of workplace pensions in encouraging pension savings, 72% of current employees were saving into a pension compared with only 24% of the currently self-employed and 6% of those not in paid work[footnote 15].
5.4.1. Automatic enrolment
All employers are now legally required to enrol their eligible jobholders into a workplace pension scheme if they are not already in one. To preserve individual responsibility for the decision to save, workers have the right to opt out of the scheme. Sixty-one percent of current employees reported that they had been automatically enrolled in a workplace pension scheme since 2012. This represents 63% of all those with a workplace pension.
Of those who reported being automatically enrolled in a workplace pension, nine percent said they had opted out of a pension scheme in the last five years after being enrolled. Older workers and those who reported being semi-retired were more likely to opt-out. This may be because they already had other pension provision; the number of people opting out of auto-enrolment is too small to allow further analysis of whether this group had other pension provision or was missing out on a private pension by opting out. The most common reason for opting out (given by 42% of those who had opted out) was that they would rely on other sources of income in retirement.
5.4.2. Level of contributions to workplace pension
Since April 2019, the minimum contribution level for auto-enrolled pensions has been set at 8% of qualifying earnings, with a minimum of 3% in employer contributions. However, analysis by the Pensions Policy Institute suggests that an 8% contribution will be insufficient to provide anyone but people on the lowest incomes to replicate their in-work living standards in retirement (PPI, 2020).
A lot of people paying into a workplace pension were not able to give an answer regarding the proportion of their pay going towards their pension, suggesting that they have not, recently at least, engaged with their level of contributions. Twenty five percent did not know their own rate of contributions and 38% did not know the rate of employer contributions.
Among people who knew how much their and their employer’s contributions were, most (76%) reported a combined contribution greater than 8%. However, 17% reported contributions of less than 8% (Table A5.4)[footnote 16]. It should be noted that these figures are for all individuals paying into a workplace pension, not just those auto-enrolled pension members. They are likely to overestimate contribution levels as the people who are aware of their contribution levels may not be typical of all those paying into a workplace pension. They are likely to be more active, engaged members who have chosen to increase their contributions.
5.5. The decision to access Defined Contribution pensions
Following the introduction of Pensions Freedom legislation in 2015, people can now access their DC pensions at the age of 55 and have a range of options available to them regarding how to access their pension. This section looks in more detail at the decision to access a DC pension, and how much use is made of different sources or information, advice or guidance before taking this decision, whilst the next section looks in more detail at what people choose to do with their pension once they have accessed it. Unless otherwise stated, the analysis in this section relates to the decision to access any DC pension, even if this decision was taken prior to 2015.
5.5.1. Who chooses to access their DC pension and when
All individuals aged 55 and over were asked separately about private pensions they had accessed and private pensions that were still accumulating. Overall, 57% of those aged 55 and over with one or more DC pensions had accessed at least one of them.
It appears that most people are not opting to access their pension as soon as the opportunity arises; only 16% of 55-59 year olds with a DC pension had accessed at least one pension (Figure 5.8). However, a majority of DC pension holders chose to access at least one pot before they reach SPa with 56% of 60-65 year olds with a DC pension having accessed at least one pension. The median age at which DC pension pots were accessed was 60.
A majority of DC pension holders aged 60-65 had accessed at least one DC pension.
Figure 5.8 Proportion of DC pension holders 55+ who have accessed a DC pension
| 55-59 | 60-65 | 66-70 | 71+ |
|---|---|---|---|
| 16% | 56% | 88% | 92% |
Source: Planning and Preparing for Later Life 2020/21
Base: All respondents 55+ with a DC pension (n=895)
People do not necessarily wait until retirement to access their DC pensions; 27% of people who did not yet consider themselves retired and 68% of people who considered themselves semi-retired had accessed a DC pension. Just over a quarter of current employees (27%) and nearly two in five (38%) of the currently self-employed had accessed a DC pension. Overall, nearly a quarter (23%) of those aged 55+ who had accessed their DC pension were still in paid work.
The decision to start accessing a DC pension may depend on people’s individual circumstances and the extent to which they need or are able to prioritise current income over saving for retirement (Kotecha et al, 2020). People on lower incomes were more likely to have accessed their DC pension pot than people on higher incomes; 62% of those with an income less than £10,500 per year had done so compared with 31% of those with an income of £44,000 or more. This may be because people on low incomes stood to gain more from access to an immediate lump sum; as is shown in Section 5.6, many people used the lump sum to pay off debts or meet current expenditure. There was mixed evidence regarding whether access to alternative sources of retirement income, for example a DB pension or non-pension savings, made a difference to whether people had accessed their DC pot or not. The level of savings made no difference whilst people who also had a DB pension were less likely to have accessed their DC pot (46% versus 62%).
A lot of respondents who had accessed a DC pension were not able to recall the size of their pension pot at the time of access. This is true even if analysis is restricted only to pensions accessed since 2015, for which it may be easier to recall this information compared with pensions accessed longer ago. Information on pot size was obtained for 65% of DC pots accessed since 2015. The median pot size at the time of access was £47,000[footnote 17].
5.5.2. Do people access some or all of DC pensions?
People who choose to access a DC pension before they reach SPa may have other pensions which they have retained and which they may be relying on to provide their income in retirement. As noted above, some will still be working and may still be actively contributing to another pension. Eleven percent of people who had accessed at least one of their DC pensions were currently saving into another pension, rising to 21% of 55-65 year olds.
However, the majority of people who had accessed a DC pension did not have another private pension available; 59% of people who had already accessed their DC pension(s), including 46% of 55-65 year olds, had no other pension provision (Figure 5.9). Furthermore, less than one in three (29%) of this group with no other pensions were currently in paid work and so with the potential to use further earnings to supplement their retirement income. Depending on the choices these people make about how to access their DC pension, and how to manage it on an ongoing basis, this potentially puts these people at risk of depleting their pension pot before the end of their retirement (The People’s Pension, 2021).
Nearly half of 55-65 year olds who had accessed their DC pension had no other pension provision.
Figure 5.9 Proportion of DC pension holders who had accessed a DC pension with other pensions, by age
| Age | Other DC pension in accumulation | DB pension | No other pensions |
|---|---|---|---|
| 55-65 | 38% | 21% | 46% |
| 66-75 | 9% | 24% | 68% |
Source: Planning and Preparing for Later Life 2020/21
Base: All respondents 55+ who have accessed a DC pension (n=546)
Note: Respondents could have both another DC pension and a DB pension and may appear in both columns.
5.5.3. Sources of information about pension choices
Previous research has found an association between receipt of advice or guidance and a reduced likelihood of early pension access, suggesting that perhaps the decision to access a pension is not always well-informed (Kotecha et al, 2020). This section looks in more detail at the sources of information, advice or guidance used by DC pension holders aged 55 and over and whether or not the proportion of DC pension holders choosing to access rather than retain their pension varied depending on the source used.
The analysis in this section focuses on DC pension holders aged 55-65, that is pension holders who have the option to access their pension prior to SPa under Pension Freedoms. Of this group, two-thirds (67%) recalled receiving information from their pension provider on the pension choices available to them and/or a pension ‘wake-up’ pack. The figure among people who had accessed their DC pension was higher (77%) though still nearly one in four of those who had accessed their pension couldn’t recall receiving any information from their pension provider.
Seven in ten of 55-65 year olds who had accessed their DC pension had made use of at least one of a financial advisor, pension provider or Pension Wise.
Figure 5.10 Proportion of DC pension holders 55-65 who had used information sources of information, advice or guidance, by whether or not they accessed their pension
| Accessed or not | Government website | Pension provider | Employer | Financial adviser | Friends and family | Pensions wise or Pensions Advisory Service | Other |
|---|---|---|---|---|---|---|---|
| Not accessed | 9% | 46% | 30% | 43% | 25% | 14% | 8% |
| Accessed | 24% | 50% | 34% | 42% | 38% | 29% | 7% |
Source: Planning and Preparing for Later Life 2020/21
Base: All respondents 55 to 65 who have a DC pension (n=455)
Most (87%) of those who had accessed their DC pension had used at least one of the types of information, advice or guidance shown in Figure 5.10 in planning for retirement, though whether or not this was in relation to pension choices specifically is not known. Over one in ten (13%) had not used any source of information, advice or guidance and a further 16% had only used a source other than a pension provider or Pension Wise or financial advisor. There is therefore a potential question mark over how well informed this group was when making their choice to access their pension.
There is no evidence that consulting a financial advisor made a difference to whether or not people chose to access their DC pension; 39% of people aged 55 to 65 who had used a financial advisor had accessed their DC pension compared with 38% who had not. However, it is possible that an effect would be observed if the analysis controlled for differences in characteristics such as income which, as has been shown, is positively associated with use of financial advisors but negatively associated with the decision to access DC pensions.
DC pension holders aged 55 to 65 who could recall receiving information from their pension provider or via a pension ‘wake-up’ pack were more likely to have accessed at least one pension compared with those who did not remember receiving information (63% vs 53%). It may be that in the absence of these sources, some people were still not aware of the options available to them to access their pension. It may also be the case that people who have accessed a pension are more likely to remember receiving these resources. Unfortunately, sample sizes were not sufficient to compare whether the way in which people chose to take their pension, for example whether they took all of their pension as a cash lump sum, varied with the use of these resources.
5.6. How people access their Defined Contribution pensions
The final section includes analysis of how people who have accessed a DC pension since the introduction of Pension Freedoms in 2015 have chosen to do so. It should be borne in mind that the number of respondents who had accessed a DC pension since 2015 was relatively low. Furthermore, the data only covers decision making at the time of or shortly after access, it is too early to get a fuller sense of if and how people are managing their pension pots on an ongoing basis or whether they remain satisfied with their decisions over the longer term. The small base sizes and limited time period mean it is not possible to fully explore how and why the choices people make might differ using these data. However, it is possible to provide some top level findings, focusing in particular on the decision to take a lump sum. More insights into people’s response to Pension Freedoms can be found in the qualitative research with DC pension holders conducted by Kotecha et al (2020).
5.6.1. The decision to take a lump sum
One of the most common ways in which people choose to access their pension is by taking either a partial lump sum or fully cashing in their pension. Overall, two-thirds (67%) of people who had accessed a DC pension since 2015 chose to take a lump sum from at least one pension. This includes ten percent of people who, when asked what else they had done with their pension after taking the lump sum, said they had taken their full pot as a cash lump sum.
The median amount which people took from each DC pension as a cash lump sum was £17,00. Fuller data on pension pot size – and how this varies depending on the choices people make when accessing their pension – is published by the FCA (2020).
Everyone who had taken a lump sum was asked how satisfied they were with that decision. It appears that, at least shortly after access, nearly everyone is happy with this decision. Sixty-six percent of people said they were very satisfied with their decision and a further 26% said they were fairly satisfied. Whether this will change over time, as people experience the consequences of having cashed in their pension, remains to be seen.
The remainder of the analysis in this section, looking at how people chose to use their accessed pension, is conducted at the pension level. That means the base used to calculate percentages is the number of pensions held rather than the number of pension holders. This is to account for the fact that some people may have taken more than one pension and done different things with each one. Unfortunately, the number of instances of people accessing more than one pension since 2015 is too small to enable us to look in more detail at who or why people might to decide to do different things with each pension.
Figure 5.11 shows what was done with each of the cash lump sums withdrawn from DC pension pots. The most common use, mentioned for 43% of pensions, was for people to save or invest the cash, which raises questions about what investments they thought were better than leaving the money in their pension. It was also relatively common for people to use the cash lump sum to cover living costs (38% of pensions) and pay off debts (31%).
The most common use for cash lump sums taken from DC pensions was for people to save or invest the cash.
Figure 5.11 How cash lump sums taken from DC pensions used
| Saved or invested it | To cover living costs | Paid off debts | One-off purchase | Support family members | Bought land or property | Other |
|---|---|---|---|---|---|---|
| 43% | 38% | 31% | 21% | 19% | 8% | 6% |
Source: Planning and Preparing for Later Life 2020/21
Base: All DC pensions from which a cash lump sum taken since 2015 (n=152)
Note: Respondents could select more than one category so figures may sum to more than 100%
People were also asked what they had done with the remainder of their pension after taking a cash lump sum. Excluding pensions where the full pot was taken as a cash lump sum, purchasing an annuity was mentioned in relation to 26% of pensions and purchasing a flexible income drawdown product in relation to 18% of pensions. The most common response was for people to say they had left the rest of the cash in their pension (79% of pensions). It is probable that some of these are pensions which have gone into income drawdown after taking a lump sum but the pension holder is not necessarily aware of this fact. This again raises questions about how actively involved in the management of their DC pensions are after taking the initial cash lump sum.
5.6.2. Plans regarding DC pensions not yet accessed
People who had at least one DC pension which they had not yet accessed were asked if they had a clear plan about what they would do with their pension once they accessed it. Sixteen percent of people reported that they did not know they needed to make a choice about how to take their pension. The majority (60%) said they knew they had to make a choice but did not yet have a clear plan for doing so whilst 23% said they had a clear plan in place for how to take their DC pension.
The proportion of people reporting they had a clear plan for how to take their DC pension increased with age. However, still only 29% of 55-59 year olds said they had a clear plan and 17% reported that they did not know they had to make a choice. Encouragingly, people who could recall receiving information from their pension provider/a pension ‘wake-up’ pack were more likely to report that they had a clear plan for how to take their DC pension (45% compared with 12%).
Everyone who knew they had to make a choice was asked what they planned to do with their DC pension. They could say yes to more than one option. Two-thirds (66%) reported that they planned to take at least some of their pension as a lump sum whilst one in five (22%) reported that they planned to take all of their pension as a lump sum. Similar proportions planned to take an annuity (39%) or to purchase an income drawdown product (37%), much higher than the proportion of accessed pensions for which this outcome was reported.
People who had a clear plan on how they were going to take their DC pension, and who are likely to be better informed about the choices available, were less likely than those without a clear plan to say that they would take a lump sum or buy an annuity but more likely to say they would buy an income drawdown product (see Table A5.5). These findings serve to emphasise the importance of ensuring that people are well informed about the choices they need to make and that resources to help with this are available.
5.7. Conclusions
Although most 40-75 year olds had some private pension provision, nearly one in four 40-75 year olds did not. Women, single person households, people on low incomes and people not in paid work were less likely to have a pension. Affordability was the most commonly cited reason for most people not having a private pension. Self-employed people were less likely than employees to have a pension and were expecting to fund retirement through other sources.
The majority of pension holders will be affected by Pension Freedoms in the future. DC pensions are becoming increasingly common, especially among younger age groups and people are taking advantage of the opportunity afforded under Pension Freedoms to access their pension before they reach SPa. Nearly half of those people 55-65 who had accessed their DC pension had no other pension provision which, depending on the choices made on how to access their pension, potentially puts their income in retirement at risk. People on low incomes were more likely to have accessed their DC pension, perhaps as a way of raising cash. Two-thirds of those who had accessed a DC pension since 2015 had taken a cash lump sum with many saying this was to pay off debts or meet current living costs.
Most people who had accessed a DC pension had received some form of information, advice or guidance before doing so. However, nearly three in ten had not made use of a pension provider, Pension Wise or a financial advisor before accessing their DC pension. There is still work to do to ensure that the growing number of DC pension holders, many of whom will be accessing their pension prior to retirement and may not have other savings or investments, are able to make informed choices and optimise the chances of being able to provide for the full duration of their retirement.
References
Ahmed, A., T. Lind et al, ‘Competence, Confidence, and Gender: The Role of Objective and Subjective Financial Knowledge in Household Finance’, Journal of Family and Economic Issues, (41, 2020), Competence, Confidence, and Gender: The Role of Objective and Subjective Financial Knowledge in Household Finance SpringerLink
Benz, M., and B. S. Frey. 2008. “Being Independent Is a Great Thing: Subjective Evaluations of Self-Employment and Hierarchy.” Economica 75 (298): 362–383. doi:10.1111/j.1468-0335.2007.00594.x.
Blundell, J., Machin, S., Ventura, M. (2020) Covid-19 and the self-employed: Six months into the crisis Centre for Economic Performance
Centre for Ageing Better (2020a) A mid-life employment crisis: How COVID-19 will affect the job prospects of older workers
Centre for Ageing Better (2020b) Inclusivity through flexibility: How flexible working can support a thriving, age-inclusive workplace
Clery, E., Humphrey, A. and Bourne, T. (2010) Attitudes to Pensions: The 2009 survey DWP Research Report no. 701
Collins, D., Toomse-Smith, M., Comanaru, R., Fenton, C., Silcock, D, and Dodds, T. (2019) Planning and Preparing for Later Life: A Social Survey Feasibility Report Department for Work and Pensions ad hoc research report no. 71
Crawford, R. and H, Harjalainen (2020) The coronavirus pandemic and older workers IFS Briefing Note BN305 DOI: 10.1920/BN.IFS.2020.BN0305
Dabhi, K., White, Y., Shah, J., Finlay, S. and Tipping, S. (2018) The drivers of saving behaviour for retirement among the self-employed HM Revenue and Customs Research Report 513
D’Arccy, C. and Gardiner, L. (2017) The Generation of Wealth: Asset accumulation across and within cohorts Intergenerational Commission Report Wealth series
Department for Work and Pensions (2017) Fuller Working Lives evidence base 2017 DWP ad hoc research report no. 46
Department for Work and Pensions (2020a) Economic labour market status of individuals aged over 50, trends over time: September 2020
Department for Work and Pensions (2020b) Automatic Enrolment evaluation report 2019 DWP ad hoc research report no. 76
Department for Work and Pensions (2020c) Small Pots Workgng Group Report
Devine, B. F., Foley, N., & Ward, M. (2020). Women and the economy
Financial Conduct Authority (2020) Retirement income market data 2019/20
Financial Conduct Authority (2021) Financial Lives 2020 survey: the impact of coronavirus Key findings from the FCA’s Financial Lives 2020 survey and October 2020 Covid-19 panel survey
Gloster, R. and J. Cockett (2020).Blog post “Can the pandemic transform flexible working opportunities?”
HM Revenue and Customs (2021) Coronavirus Job Retention Scheme Statistics June 2021
Hundley, G. 2001. “Why and When are the Self-Employed More Satisfied with Their Work?” Industrial Relations 40 (2): 293–316.
Institute for Fiscal Studies IFS (2016), ‘The economic circumstances of different generations: the latest picture’, Briefing note 187
Kotecha, M., Rantanen, K., Barber, T., Lucey, G., Cheesebrough, S. and Khambhaita, P. (2020) Pension Freedoms – a qualitative research study of individuals’ decumulation journeys DWP Research Report no. 995
McLeod, P., FitzPatrick, A., Hamlyn, B., Jones, A., Kinver A. and Page, L. (2012) Attitudes to Pensions: The 2012 survey DWP Research Report no. 813
Ministry of Housing, Communities and Local Government (2021) English Housing Survey Home Ownership, 2019-20
OECD (2020) Promoting an Age-Inclusive Workforce: Living, Learning and Earning Longer, OECD Publishing, Paris.
Office for National Statistics (2018) [Living longer: how our population is changing and why it matters](https://www.ons.gov.uk/peoplepopulationandcommunity/birthsdeathsandmarriages/ageing/articles/livinglongerhowourpopulationischangingandwhyitmatters/2018-08-13]
Office for National Statistics (2019a) Dataset: Expectation of life, principal projection, UK
Office for National Statistics (2019b). Families and the Labour Market. The employment rates of men and women with dependent children in the UK, based on data from the Labour Force Survey and Annual Population Survey
Office for National Statistics (2019c) Characteristics and benefits of training at work, UK: 2017
Office for National Statistics (2020) Coronavirus and self-employment in the UK
Office for National Statistics (2021a) Dataset EMP14: Employees and self-employed by industry
Office for National Statistics (2021b) Employee workplace pensions in the UK: 2020 provisional and 2019 final results
Paullin, C. and Whetzel, D.L. (2012) “Retention strategies and older workers” The Oxford Handbook of Work and Aging eds. W.C Borman and J.W. Hedge
Pensions and Lifetime Savings Association (PLSA) (2019) Developing Retirement Living Standards
Pensions Policy Institute (2018) Lost Pensions: What’s the scale and impact? Briefing note 110
Pensions Policy Institute (2020) The DC Future Book 2020 edition: in association with Columbia Threadneedle Investments
Pensions Policy Institute (2021) What is an adequate retirement income?
Pension Protection Fund (2020) The Purple Book 2020 DB pensions universe risk profile
Platts, L.G., Corna,, L.M., Worts, D., McDonough, P., Price, D. and Glaser,K. (2019) “Returns to work after retirement: a prospective study of unretirement in the United Kingdom” Ageing & Society , Volume 39 , Issue 3 , pp. 439 - 464
The People’s Pension (2021) New Choices, Big Decisions 5 years on: Evolution of Consumer Decision Making and Behaviours Under Pension Freedom and Choice
Women’s Budget Group (2018). The female face of poverty. Examining the cause and consequences of economic deprivation for women
Working Families (2020) Modern Families Index 2020
Appendix 1 Additional tables
Table A1.1 Characteristics of achieved PPLL sample
| Subject | Percentage | Unweighted base |
|---|---|---|
| Age: 40-49 | 28 | 455 |
| Age: 50-54 | 13 | 309 |
| Age: 55-59 | 15 | 366 |
| Age: 60-65 | 20 | 517 |
| Age: 66-70 | 13 | 522 |
| Age: 71+ | 11 | 486 |
| Men | 49 | 1,194 |
| Women | 51 | 1,461 |
| Not retired | 65 | 1,363 |
| Semi-retired | 8 | 272 |
| Fully retired | 27 | 1,015 |
| Employee | 46 | 987 |
| Self-employed | 10 | 255 |
| Not in paid work | 18 | 397 |
| Fully retired | 27 | 1,015 |
| Single – no dependents | 26 | 838 |
| Singe – dependents | 7 | 155 |
| Couple – no dependents | 40 | 1,090 |
| Couple – dependents | 28 | 572 |
| North East | 4 | 118 |
| North West | 10 | 241 |
| Yorkshire and The Humber | 9 | 221 |
| East Midlands | 8 | 199 |
| West Midlands | 9 | 196 |
| East of England | 11 | 292 |
| London | 11 | 199 |
| South East | 15 | 362 |
| South West | 10 | 266 |
| Scotland | 9% | 413 |
| Wales | 5% | 148 |
| Annual income < £10,500 | 25 | 576 |
| Annual income £10,500 - £26,999 | 40 | 1,034 |
| Annual income £27,000 - £43,999 | 20 | 530 |
| Annual income £44,000 or more | 15 | 352 |
| Low financial literacy | 19 | 412 |
| Medium financial literacy | 47 | 1,191 |
| High financial literacy | 35 | 1,032 |
Base: All respondents
Table A1.2 Retirement status, by age, sex, employment status, income and financial literacy
| Subject | Not retired | Semi-retired | Fully retired | Unweighted base |
|---|---|---|---|---|
| Age: 40-49 | 100 | – | – | 455 |
| Age: 50-54 | 93 | 6 | 1 | 308 |
| Age: 55-59 | 85 | 9 | 5 | 366 |
| Age: 60-65 | 54 | 15 | 31 | 516 |
| Age: 66-70 | 9 | 14 | 77 | 520 |
| Age: 71 and over | 4 | 8 | 89 | 485 |
| Men | 66 | 9 | 25 | 1,193 |
| Women | 64 | 7 | 29 | 1,457 |
| Employee | 95 | 5 | – | 986 |
| Self-employed | 87 | 13 | – | 254 |
| Not in paid work | 74 | 26 | – | 394 |
| Fully retired | – | – | 100 | 1,015 |
| Annual income < £10,500 | 54 | 10 | 36 | 575 |
| Annual income £10,500 - £26,999 | 58 | 9 | 33 | 1,033 |
| Annual income £27,000 - £43,999 | 77 | 6 | 17 | 528 |
| Annual income £44,000 or more | 88 | 5 | 7 | 352 |
| Low financial literacy | 61 | 5 | 33 | 410 |
| Medium financial literacy | 69 | 8 | 24 | 1,188 |
| High financial literacy | 62 | 10 | 29 | 1,032 |
| Total | 65 | 8 | 27 | 2,650 |
Base: All respondents
Table A1.3 Employment status, by age, sex, retirement status, income and financial literacy
| Subject | Employee | Self-employed | Not working | Fully retired | Unweighted base |
|---|---|---|---|---|---|
| Age: 40-49 | 72 | 10 | 18 | – | 454 |
| Age: 50-54 | 65 | 16 | 17 | 1 | 309 |
| Age: 55-59 | 60 | 11 | 24 | 5 | 366 |
| Age: 60-65 | 34 | 10 | 25 | 31 | 517 |
| Age: 66-70 | 11 | 4 | 9 | 77 | 522 |
| Age: 71+ | 2 | 3 | 6 | 89 | 486 |
| Men | 47 | 11 | 17 | 25 | 1,194 |
| Women | 45 | 8 | 18 | 29 | 1,460 |
| Not retired | 67 | 13 | 20 | – | 1,362 |
| Semi-retired | 27 | 16 | 58 | – | 272 |
| Fully retired | – | – | – | 100 | 1,015 |
| Annual income < £10,500 | 17 | 8 | 40 | 36 | 576 |
| Annual income £10,500 - £26,999 | 43 | 9 | 15 | 33 | 1,034 |
| Annual income £27,000 - £43,999 | 68 | 11 | 3 | 17 | 530 |
| Annual income £44,000 or more | 81 | 9 | 3 | 7 | 351 |
| Low financial literacy | 34 | 7 | 25 | 33 | 412 |
| Medium financial literacy | 50 | 8 | 18 | 24 | 1,191 |
| High financial literacy | 45 | 12 | 14 | 29 | 1,031 |
| Total | 46 | 10 | 18 | 27 | 2,654 |
Base: All respondents
Table A1.4 Financial literacy, by age, sex, employment status, retirement status and income
| Subject | Low financial literacy | Medium financial literacy | High financial literacy | Unweighted base |
|---|---|---|---|---|
| Age: 40-49 | 16 | 48 | 35 | 450 |
| Age: 50-54 | 15 | 53 | 32 | 307 |
| Age: 55-59 | 17 | 47 | 36 | 362 |
| Age: 60-65 | 20 | 44 | 36 | 513 |
| Age: 66-70 | 21 | 43 | 36 | 517 |
| Age: 71+ | 25 | 44 | 31 | 486 |
| Men | 15 | 44 | 41 | 1,184 |
| Women | 22 | 49 | 29 | 1,451 |
| Employee | 14 | 52 | 35 | 977 |
| Self-employed | 15 | 40 | 46 | 252 |
| Not in paid work | 26 | 47 | 27 | 395 |
| Fully retired | 23 | 41 | 37 | 1,010 |
| Not retired | 18 | 49 | 33 | 1,350 |
| Semi-retired | 13 | 44 | 43 | 270 |
| Fully retired | 23 | 41 | 37 | 1,010 |
| Annual income < £10,500 | 29 | 49 | 22 | 576 |
| Annual income £10,500 - £26,999 | 18 | 50 | 33 | 1,034 |
| Annual income £27,000 - £43,999 | 10 | 46 | 44 | 530 |
| Annual income £44,000 or more | 3 | 40 | 57 | 352 |
| Total | 19 | 47 | 35 | 2,635 |
Base: All respondents
Table A1.5 Income, by age, sex, employment status, retirement status and financial literacy
| Subject | < £10,500 | £10,500 - £26,999 | £27,000 - £43,999 | £44,000+ | Unweighted base |
|---|---|---|---|---|---|
| Age: 40-49 | 19 | 30 | 27 | 25 | 437 |
| Age: 50-54 | 19 | 38 | 24 | 19 | 295 |
| Age: 55-59 | 23 | 38 | 22 | 17 | 348 |
| Age: 60-65 | 35 | 42 | 14 | 9 | 488 |
| Age: 66-70 | 25 | 53 | 16 | 5 | 473 |
| Age: 71+ | 32 | 49 | 14 | 5 | 451 |
| Men | 17 | 36 | 24 | 23 | 1,124 |
| Women | 33 | 43 | 17 | 7 | 1,368 |
| Employee | 9 | 36 | 29 | 26 | 952 |
| Self-employed | 21 | 40 | 25 | 14 | 233 |
| Not in paid work | 59 | 35 | 4 | 2 | 362 |
| Fully retired | 34 | 49 | 13 | 4 | 944 |
| Not retired | 21 | 35 | 24 | 20 | 1,289 |
| Semi-retired | 32 | 44 | 15 | 9 | 255 |
| Fully retired | 34 | 49 | 13 | 4 | 944 |
| Low financial literacy | 43 | 41 | 13 | 3 | 351 |
| Medium financial literacy | 26 | 42 | 20 | 13 | 1,139 |
| High financial literacy | 15 | 36 | 25 | 24 | 1,002 |
| Total | 25 | 40 | 20 | 15 | 2,492 |
Base: All respondents
Table A1.6 Age, by age, sex, employment status, retirement status, income and financial literacy
| Subject | 40-49 | 50-54 | 55-59 | 60-65 | 66-70 | 71+ | Unweighted base |
|---|---|---|---|---|---|---|---|
| Men | 28 | 13 | 16 | 20 | 13 | 11 | 1,194 |
| Women | 28 | 13 | 13 | 21 | 13 | 12 | 1,461 |
| Employee | 44 | 19 | 19 | 15 | 3 | 1 | 987 |
| Self-employed | 30 | 23 | 17 | 21 | 5 | 4 | 255 |
| Not in paid work | 28 | 13 | 20 | 29 | 7 | 4 | 397 |
| Fully retired | – | 1 | 3 | 23 | 36 | 37 | 1,015 |
| Not retired | 43 | 19 | 19 | 17 | 2 | 1 | 1,363 |
| Semi-retired | – | 10 | 18 | 38 | 23 | 11 | 272 |
| Fully retired | – | 1 | 3 | 23 | 36 | 37 | 1,015 |
| Low financial literacy | 24 | 11 | 14 | 22 | 14 | 16 | 412 |
| Medium financial literacy | 29 | 15 | 15 | 19 | 12 | 11 | 1,191 |
| High financial literacy | 28 | 12 | 15 | 21 | 13 | 10 | 1,032 |
| Annual income < £10,500 | 21 | 10 | 13 | 29 | 12 | 15 | 576 |
| Annual income £10,500 - £26,999 | 22 | 13 | 14 | 22 | 16 | 14 | 1,034 |
| Annual income £27,000 - £43,999 | 37 | 16 | 16 | 14 | 10 | 8 | 530 |
| Annual income £44,000+ | 46 | 17 | 17 | 12 | 4 | 4 | 352 |
| Total | 28 | 13 | 15 | 20 | 13 | 11 | 2,655 |
Base: All respondents
Table A2.1 Proportion of people 40-75 who had used at least one source of information, advice or guidance to plan for retirement
| Subject | Percentage | Unweighted base |
|---|---|---|
| Age: 40-49 | 72 | 455 |
| Age: 50-54 | 77 | 309 |
| Age: 55-59 | 72 | 366 |
| Age: 60-65 | 75 | 517 |
| Age: 66-70 | 80 | 522 |
| Age: 71+ | 72 | 486 |
| Not retired | 72 | 1,363 |
| Semi-retired | 80 | 272 |
| Fully retired | 78 | 1,015 |
| Men | 77 | 1,194 |
| Women | 71 | 1,461 |
| Employee | 79 | 987 |
| Self-employed | 69 | 255 |
| Not in paid work | 57 | 397 |
| Fully retired | 78 | 1,015 |
| Single – no dependents | 66 | 838 |
| Singe – dependents | 59 | 155 |
| Couple – no dependents | 77 | 1,090 |
| Couple – dependents | 81 | 572 |
| Annual income < £10,500 | 60 | 576 |
| Annual income £10,500 - £26,999 | 75 | 1,034 |
| Annual income £27,000 - £43,999 | 82 | 530 |
| Annual income £44,000 or more | 95 | 352 |
| Private pension | 83 | 2,110 |
| No private pension | 47 | 540 |
| DC pension | 85 | 1,326 |
Notes: Respondents could select more than one answer so percentages may sum to more than 100%
Table A2.2 Proportion of people satisfied with information provided by financial advisor/Pension Wise
| Level of satisfaction | Financial advisor – % | Pension Wise – % |
|---|---|---|
| Very satisfied | 51 | 34 |
| Quite satisfied | 35 | 43 |
| Neither satisfied nor dissatisfied | 10 | 17 |
| Quite dissatisfied | 3 | 5 |
| Very dissatisfied | 1 | 2 |
| Weighted base | 761 | 233 |
| Unweighted base | 878 | 274 |
Base: All respondents who had consulted a professional financial advisor/All respondents 50+ who had used Pension Wise
Table A2.3 Proportion of people satisfied with guidance on retirement offered by employer
| Level of satisfaction | Percentage |
|---|---|
| Very satisfied | 19 |
| Satisfied | 37 |
| Neither satisfied nor dissatisfied | 37 |
| Dissatisfied | 7 |
| Very dissatisfied | 3 |
| Weighted base | 550 |
| Unweighted base | 681 |
Base: All past/current employees 50+ who made use of employer-provided support
Table A2.4 Proportion of individuals under SPA able to identify weekly State Pension amount
| Estimation | Percentage identifying SP amount |
|---|---|
| Accurately identified current SP amount | 3 |
| Overestimated SP value, within 10% | 6 |
| Overestimated SP value, greater than 10% | 9 |
| Underestimated SP value, within 10% | 16 |
| Underestimated SP value, greater than 10% | 65 |
| Unweighted base | 1,199 |
| Weighted base | 1,430 |
Base: All respondents below SPA
Table A3.1 Income people not yet retired expect to need in retirement
| Income expected | Percentage giving amount |
|---|---|
| Less than £10,500 a year | 10 |
| £10,500 a year to under £22,000 a year | 50 |
| £22,000 a year to under £31,000 a year | 26 |
| £31,000 a year to under £44,000 a year | 9 |
| £44,000 a year to under £66,000 a year | 3 |
| £66,000 or more a year | 2 |
| Unweighted base | 1,155 |
| Weighted base | 1,257 |
Base: All respondents not yet retired who had some idea of their income needs in retirement
Table A3.2 Proportion of current income people expect to need in retirement, by current income – percentage
| Proportion of current income expect to need | Under £10,500 | £10,500 to under £27,000 | £27,000 to under £44,000 | £44,000+ | Total |
|---|---|---|---|---|---|
| Less than a quarter | 1% | 1% | 1% | 1% | 1% |
| About a quarter | 2% | 1% | 3% | 5% | 3% |
| About a third | 1% | 4% | 5% | 18% | 7% |
| About a half | 4% | 8% | 23% | 34% | 17% |
| About two-thirds | 1% | 9% | 21% | 21% | 14% |
| About three-quarters | 3% | 9% | 13% | 6% | 9% |
| About the same | 36% | 45% | 23% | 11% | 31% |
| More than current income | 38% | 11% | 5% | * | 11% |
| Not thought about it | 14% | 11% | 6% | 3% | 8% |
| Unweighted base | 164 | 403 | 298 | 264 | 1,187 |
| Weighted base | 187 | 433 | 317 | 301 | 1,295 |
Base: All respondents not yet retired who had some idea of their income needs in retirement
Table A3.3 Proportion of current income people expect to receive in retirement, by current income – percentage
| Proportion of current income expect to receive | Under £10,500 | £10,500 to under £27,000 | £27,000 to under £44,000 | £44,000+ | Total |
|---|---|---|---|---|---|
| Less than a quarter | 4% | 2% | 1% | 2% | 2% |
| About a quarter | 4% | 5% | 6% | 5% | 5% |
| About a third | 2% | 6% | 8% | 16% | 8% |
| About a half | 10% | 15% | 24% | 36% | 21% |
| About two-thirds | 6% | 12% | 21% | 17% | 15% |
| About three-quarters | 8% | 13% | 10% | 7% | 10% |
| About the same | 20% | 25% | 15% | 9% | 18% |
| More than current income | 18% | 4% | 3% | 2% | 6% |
| Not thought about it | 29% | 18% | 12% | 7% | 16% |
| Unweighted base | 161 | 393 | 289 | 265 | 1,159 |
| Weighted base | 186 | 419 | 309 | 301 | 1,265 |
Base: All respondents not yet retired who had some idea of their income needs in retirement
Table A3.4 Proportion of non-retired for whom the income they expect to need in retirement matches the income they expect to have in retirement (measured as a proportion of current income)
| Whether income needed matches expectations (as a proportion of current income) | Percentage |
|---|---|
| Need less than expectation | 10 |
| Need about the same as expectation | 44 |
| Need more than expectation | 26 |
| Not thought about it | 20 |
| Unweighted base | 1,149 |
| Weighted base | 1,251 |
Base: All respondents not yet fully retired who have some idea of income needed in retirement
Table A3.5 Sources of income used in retirement, by employment status pre-retirement – percentage
| Income source | Employee | Self-Employed | All fully retired |
|---|---|---|---|
| State Pension | 82% | 88% | 83% |
| Occupational or Personal Pension | 79% | 78% | 78% |
| Other Pensioner benefits | 17% | 24% | 18% |
| Savings or Investments | 54% | 58% | 53% |
| Release equity from home or downsizing | 7% | 4% | 6% |
| Renting out or sale of a property that is not main home | 9% | 13% | 9% |
| Inheritance | 16% | 12% | 15% |
| Financial support from partner or family | 44% | 41% | 43% |
| Other specific answer not in code frame | 2% | 1% | 2% |
| Unweighted base | 863 | 120 | 1,007 |
| Weighted base | 615 | 75 | 714 |
Base: All fully retired respondents
Table A3.6 Proportion of retirement income expected to come from State Pension, by age – percentage
| Proportion of retirement income expected to come from State Pension | 40-49 | 50-54 | 55-59 | 60-65 | 66-70 | 71+ | Total |
|---|---|---|---|---|---|---|---|
| 0-10 | 13% | 13% | 11% | 8% | 4% | 5% | 10% |
| 10-20 | 20% | 11% | 17% | 14% | 9% | 12% | 15% |
| 20-30 | 23% | 22% | 18% | 15% | 17% | 17% | 19% |
| 30-40 | 14% | 10% | 14% | 13% | 11% | 10% | 12% |
| 40-50 | 9% | 15% | 12% | 15% | 14% | 12% | 12% |
| 50-60 | 5% | 8% | 6% | 8% | 9% | 12% | 8% |
| 60-70 | 3% | 4% | 6% | 4% | 8% | 6% | 5% |
| 70-80 | 3% | 5% | 1% | 3% | 5% | 7% | 4% |
| 80-90 | 3% | 3% | 4% | 3% | 5% | 3% | |
| 90-100 | 5% | 7% | 6% | 7% | 10% | 9% | 7% |
| State Pension only source of income | 2% | 5% | 7% | 9% | 9% | 6% | 6% |
| Unweighted base | 349 | 242 | 287 | 334 | 478 | 427 | 2,117 |
| Weighted base | 532 | 263 | 300 | 346 | 310 | 269 | 2,020 |
Base: All respondents expecting to use/using State Pension as a source of income in retirement
Table A3.7 Proportion of retirement income private pensions holders expect to come from state and private pensions – percentage
| Proportion of retirement income expected to come from pension | State Pension | Private pension |
|---|---|---|
| 0-10 | 10% | 9% |
| 10-20 | 16% | 8% |
| 20-30 | 21% | 10% |
| 30-40 | 14% | 9% |
| 40-50 | 14% | 9% |
| 50-60 | 9% | 16% |
| 60-70 | 5% | 13% |
| 70-80 | 4% | 12% |
| 80-90 | 3% | 9% |
| 90-100 | 3% | 7% |
| Unweighted base | 1,725 | 1,934 |
| Weighted base | 1,591 | 1,812 |
Base: All respondents with a private pension who expect to use State Pension/All respondents with a private pension
Note: 1% of private pension holders (not shown in table) nevertheless expected all of their income in retirement to come from the State Pension
Table A3.8 Confidence in the level of income available in retirement on a scale from 0-10 – percentage
| Confidence in retirement provision | Income will cover the cost of living | Income will enable to achieve desired lifestyle |
|---|---|---|
| 0% | 9% | 10% |
| 1% | 1% | 2% |
| 2% | 3% | 4% |
| 3% | 4% | 5% |
| 4% | 5% | 6% |
| 5% | 16% | 15% |
| 6% | 8% | 10% |
| 7% | 16% | 15% |
| 8% | 17% | 15% |
| 9% | 6% | 6% |
| 10% | 14% | 12% |
| Mean | 6.1 | 5.8 |
| SD | 2.91 | 2.96 |
| Median | 7 | 6 |
| Unweighted base | 2,619 | 2,627 |
| Weighted base | 2,602 | 2,616 |
Base: All respondents
Table A3.9 Mean confidence that will be able to provide in retirement by respondent characteristics
| Subject | Income will cover cost of living (0-10) | Income will enable to achieve desired lifestyle (0-10) | Min. unweighted base |
|---|---|---|---|
| Not retired | 5.61 | 5.29 | 1,341 |
| Semi-retired | 6.37 | 6.15 | 269 |
| Fully retired | 7.33 | 6.95 | 1,005 |
| Men | 6.59 | 6.15 | 1,179 |
| Women | 5.71 | 5.48 | 1,440 |
| Employee | 6.07 | 5.64 | 976 |
| Self-employed | 6.09 | 5.77 | 252 |
| Not in paid work | 4.46 | 4.47 | 385 |
| Private pension | 6.61 | 6.21 | 2,088 |
| No private pension | 4.62 | 4.50 | 527 |
Base: All respondents
Table A4.1 Proportion of people in paid work with flexible working, by retirement status – percentage
| Type of flexible working | Not retired | Semi-retired | Total |
|---|---|---|---|
| Flexitime or flexible working hours | 46% | 57% | 47% |
| Term time working | 3% | 2% | 3% |
| Annualised hours contract | 3% | 2% | 3% |
| Condensed hours | 1% | * | 1% |
| Nine-day fortnight | 1% | * | 1% |
| Job share | 0% | * | 0% |
| Other | 3% | 4% | 3% |
| None of the above | 47% | 38% | 47 |
| Unweighted base | 1,063 | 115% | 1,178 |
| Weighted base | 1,309 | 81 | 1,390 |
Base: All currently in paid work
Table A4.2 Proportion of employees that have requested to change their working circumstances in last 5 years
| Sub-group | Percentage requesting change in working arrangements | Unweighted base |
| 40-49 | 20 | 334 |
| 50-54 | 17 | 202 |
| 55-59 | 22 | 213 |
| 60-65 | 25 | 164 |
| 66+ | 16 | 71 |
| Men | 16 | 428 |
| Women | 25 | 556 |
| Carer | 26 | 385 |
| Not a carer | 17 | 599 |
| Very good health | 17 | 393 |
| Good health | 17 | 428 |
| Fair health | 34 | 136 |
| Bad or very bad health | 41[footnote 18] | 26 |
Base: All current employees
Table A4.3 Proportion of employees requesting each type of change in working arrangements
| Type of change | Percentage |
|---|---|
| Change working hours/days | 34 |
| Reduce the number of hours worked | 31 |
| Work from home | 15 |
| Increase the number of hours worked | 14 |
| Work part time | 11 |
| Flexi time (flexible working hours) | 11 |
| Time off/temporary leave arrangements | 4 |
| Term-time working | 1 |
| Job sharing | * |
| Other | 5 |
| Unweighted base | 198 |
| Weighted base | 231 |
Base: All employees who requested a change in working arrangements
Table A4.4 Preferred working arrangement as approach retirement, by age – percentage
| Type of work | 40-49 | 50-54 | 55-59 | 60-65 | Total |
|---|---|---|---|---|---|
| Continue working for the same company | 62% | 69% | 65% | 72% | 66% |
| Continue being self-employed | 8% | 14% | 15% | 15% | 12% |
| Work for a different employer in a different occupation | 7% | 10% | 8% | 4% | 7% |
| Work for a different employer in the same or similar occupation | 11% | 3% | 4% | 3% | 6% |
| Become self-employed in a different occupation | 6% | 4% | 5% | 4% | 5% |
| Become self-employed in the same or similar occupation | 6% | 1% | 3% | 2% | 4% |
| Unweighted base | 268 | 250 | 246 | 180 | 1096 |
| Weighted base | 577 | 273 | 263 | 202 | 1343 |
Base: All non-retired respondents in paid work
Table A5.1 Proportion of 40-75 year olds with a private pension
| Characteristic | Percentage with a private pension | Unweighted base |
|---|---|---|
| 40-49 | 75 | 454 |
| 50-54 | 79 | 309 |
| 55-59 | 80 | 365 |
| 60-65 | 77 | 516 |
| 66-70 | 71 | 522 |
| 71 and over | 75 | 484 |
| Men | 82 | 1,191 |
| Women | 71 | 1,459 |
| Employee | 89 | 987 |
| Self-employed | 65 | 255 |
| Not in paid work | 51 | 394 |
| Fully retired | 75 | 1,013 |
| Annual income < £10,500 | 51 | 574 |
| Annual income £10,500 - £26,999 | 80 | 1,034 |
| Annual income £27,000 - £43,999 | 89 | 530 |
| Annual income £44,000 or more | 98 | 352 |
| Single – no dependents | 66 | 835 |
| Singe – dependents | 72 | 155 |
| Couple – no dependents | 81 | 1,088 |
| Couple – dependents | 80 | 572 |
| Low financial literacy | 53 | 410 |
| Medium financial literacy | 78 | 1,189 |
| High financial literacy | 86 | 1,031 |
Base: All respondents
Table A5.2 Number of pensions held by pension type
| Number | Percentage with pension |
|---|---|
| 1 | 50 |
| 2 | 31 |
| 3 | 12 |
| 4 | 4 |
| 5 or more | 2 |
| Unweighted base | 2,040 |
| Weighted base | 1,955 |
Base: All respondents with a private pension
Table A5.3 Number of pensions held by pension type – percentage
| Number | Defined Contribution pensions | Defined Benefit pensions |
|---|---|---|
| 1 | 60% | 79% |
| 2 | 26% | 17% |
| 3 | 10% | 3% |
| 4 | 2% | 1% |
| 5 or more | 2% | * |
| Unweighted base | 1,326 | 886 |
| Weighted base | 1,302 | 778 |
Base: All respondents with a relevant pension
Note: Excludes people who did not know the type of pension they held.
Table A5.4 Proportion of earnings paid into workplace pension, by employee and employer – percentage
| Proportion of earning paid into workplace pension | Employee | Employer | Combined employee and employer |
|---|---|---|---|
| <3% | 6% | 14% | 1% |
| 3% | 13% | 13% | 1% |
| 4% | 7% | 5% | 1% |
| 5% | 19% | 15% | 3 |
| 6-7% | 15% | 9% | 10% |
| 8% | 7% | 8% | 7% |
| 9-10% | 19% | 14% | 14% |
| 11% or more | 14% | 22% | 62% |
| Unweighted base | 508 | 423 | 410 |
| Weighted base | 615 | 516 | 501 |
Base: All respondents currently paying into a workplace pension
Table A5.5 What people plan to do with DC pensions not yet accessed, by whether have a clear plan for how to take pension or not – percentage
| Plan | Has a clear plan for how will take pension | Does not have a clear plan for how will take pension | Total |
|---|---|---|---|
| Take an annuity | 23% | 46% | 39% |
| Purchase an income drawdown product | 40% | 35% | 37% |
| Take partial lump sum | 20% | 23% | 22% |
| Take all pension as lump sum | 57% | 70% | 66% |
| None of the above | 6% | 3% | 4% |
| Unweighted base | 216 | 454 | 670 |
| Weighted base | 221 | 506 | 727 |
Base: All respondents who have yet to access a DC pension and know they have to make a choice on how to take their pension
Note: Respondents may have more than one alternative pension so percentages may sum to more than 100%.
Appendix 2 Technical
Key details on how the Planning and Preparing for Later Life (PPLL) survey was implemented are given below. Further details are available in the full technical report (ADD REF).
The impact of COVID-19: Switching from a face to face to a telephone survey
In line with the recommendations of the original Feasibility Report (Collins et al, 2019), PPLL was commissioned as a face to face survey. Face to face interviewing was considered the best way to maximise both response and data quality to a survey which would involve a fairly long interview (45 minutes) on topics that would not necessarily be particularly salient to the general public.
However, restrictions on face to face fieldwork in 2020 as a result of the COVID-19 pandemic meant that, in order to deliver survey data in a timely manner, an alternative to face to face interviewing had to be found. Computer-Assisted Telephone Interviewing (CATI) was decided on as being the most accessible mode for the target age group and the mode (other than face to face) likely to generate the highest response rate.
Some aspects of the survey design – especially with regards to sampling and questionnaire testing – reflect the fact that the initial stages of the survey lifecycle were completed before the switch to CATI. The approach taken may have been different had the survey been designed for CATI from the outset.
Sampling
PPLL was run as a follow-up survey to the Family Resources Survey (FRS) 2017/18. As part of the FRS interview, respondents were asked whether they were “willing to be contacted again” for follow-up studies[footnote 19]. Only those who consented to be recontacted – having responded to the FRS survey – could be approached to take part in PPLL.
The population of interest for PPLL are those living in Great Britain, aged between 40 and 75. Eligibility for PPLL was determined using data on each FRS respondent’s date of birth and country of residence. Individuals were deemed eligible for PPLL if they were aged between 40-75 (inclusive) on 1 January 2020. Furthermore, only respondents with an address located in Great Britain – at the time they were sampled for FRS17-18 – could be selected.
In each household in the FRS sample, all adults aged 16+ (except those aged 16-19 who were also classed as dependent children) are approached for the interview. As such, some households were anticipated to contain multiple individuals who met the eligibility criteria for PPLL. As survey outcomes tend to be correlated within households, a maximum of one person per household was sampled for PPLL to minimise the effect of clustering on the achieved sample. After boosting the probabilities of selection for self-employed people, a group identified as being of particular analytic interest, selection of one eligible individual per household was undertaken using simple random sampling.
Of the 11,691 people who responded to FRS 17/18 and met the eligibility criteria for PPLL, 9,312 were selected for the PPLL sample[footnote 20]. Originally PPLL was designed as a face to face survey with a smaller starting sample (N=4,744) predicated on an expected response rate of 55%. However, as a result of the COVID-19 pandemic, interviews had to be conducted by telephone. The sample had to be increased (to 9,312) to account for a lower expected response rate (target 30%) from telephone surveys.
The questionnaire
The PPLL questionnaire was developed in consultation with the Department for Work and Pensions (DWP) as well as experts at the Institute of Employment and Pensions Policy Institute.
The final PPLL questionnaire is broken up into 6 modules with questions covering the following:
1. Demographics 2. Planning for retirement 3. Work and employment 4. Income in retirement 5. Pension level information 6. Financial literacy and household classification
Selected questions underwent two rounds of cognitive testing. Cognitive testing is a qualitative technique involving a small purposively-selected sample of respondents and in-depth probing and/or “think aloud” techniques to establish: what respondents understood by particular questions, how they arrived at their responses, how confident they were in their answers and any problems caused by the questions. The two rounds of testing allowed any changes implemented following the first round of comments to be re-tested.
The PPLL pilot served as a dress rehearsal for the mainstage survey and aimed to test all aspects of the survey including participant reactions to the survey and the advance materials, questionnaire length and questionnaire content. The sample for the pilot was a subset of the mainstage sample, that is 159 named individuals in Great Britain aged 40 to 75 who had previously completed the Family Resources Survey (FRS) in 2017- 2018 and had agreed to participate in further research.
Telephone fieldwork took place between Monday 21 September and Sunday 4th October 2020 and 20 interviews were achieved. Post-fieldwork the interviewers attended a virtual debrief session with researchers from NatCen and DWP to give their feedback on the pilot.
The main finding from the pilot was that the questionnaire was too long and appeared repetitive to respondents. NatCen worked with DWP to cut questions prior to the main stage and reduce the expected length of the questionnaire to 45-60 minutes.
Figure 3.1 Flow chart summarising the flow of the interview
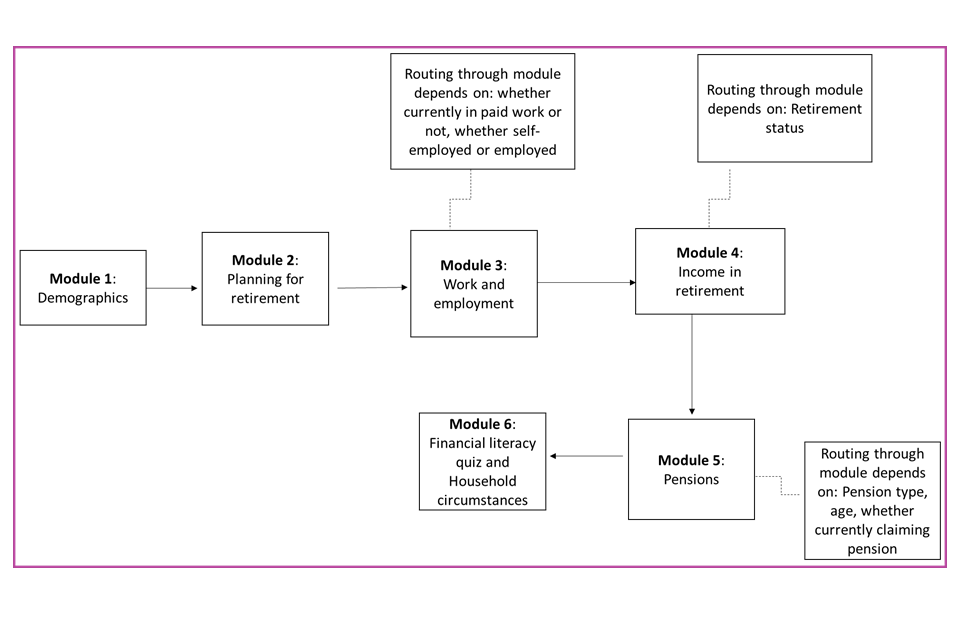
Fieldwork
Mainstage fieldwork took place between 14th November 2020 and 7th February 2021. Interviews were therefore conducted at the height of the second wave of the COVID-19 pandemic. It is possible that the pandemic may have had an impact on people’s current circumstances and expectations for the future and that some findings may have been different had the survey been conducted at a different time.
All interviewers working on the project were trained members of NatCen’s Telephone Unit or field force. Interviewers received a project briefing conducted by the research team and attended by a representative from the Department for Work and Pensions who provided an overview of the aims of the study, why it was important and how the data would be used.
Before the start of fieldwork, each sample member received through the post an advance letter, informing them about the study and that a NatCen interviewer would contact them by telephone, and a survey leaflet giving some more information about the background of the study. The sample file obtained from DWP contained contact telephone numbers for 89% of sample members. The remaining 11% (the “opt-in sample”) were sent an alternative version of the advance letter inviting them to “opt-in” to the survey by getting in touch with the Freephone team and providing a contact telephone number for an interviewer to call.
The PPLL survey asked for detailed information about any pensions the respondent had, what type of pensions they are, the value of the pension and, if the respondent has already accessed their pension, how they are taking their pension. To try and maximise the accuracy of this information, respondents were advised prior to the start of the interview that they may want to have their pension statement(s) available. The interview script gave respondents the option of making an appointment to conduct the interview at a later date when they had their statement(s) available or of going to find them and then whilst the interviewer was waiting on the line. However, because it was recognized that not everyone who had a pension would necessarily be able to access their statements, or may be reluctant to because of data confidentiality concerns, it was not compulsory to have statements available before completing the interview. Only one in four pension holders had statements available during the interview.
A £10 Love2Shop voucher was sent to all respondents on completion of the interview as a thank you. The voucher could be spent at a range of high street shops. Given the nature of the topics covered in the interview, it was considered possible that respondents may want to find out more information about pensions and retirement planning at the end of the interview. An information sources leaflet containing details of some organisations (and relevant web links) was made available for people to consult either electronically or in hard copy.
The median length of the interview was 48 minutes. The interview was longest for those individuals currently semi-retired, with a median length of 54 minutes, , and the shortest interview length was for the fully retired (median length of 45 minutes).
Response rates
Overall, 2,655 interviews were obtained, with a response rate of 29%. Nearly all of these interviewers were fully productive (28.6%) but a small number (34 or 0.4%) were partial completes. To count as a partial interview the respondent had to have reached question PenConsol, part-way through Module 5 in the questionnaire. The main reason for interviews not being achieved was interviewers not being able to make contact with respondents, either because there was no phone number available or because the sample member was unreachable. If non-contacts are excluded, the co-operation rate for the survey – that is productive interviews as a proportion of all sample members with whom interviewers made contact – was 53.7%[footnote 21].
Weighting
Weights were constructed to ensure that the PPLL survey data are representative of 40-75 year olds living in Great Britain and that findings from the survey can be generalised to this population of interest.
A key methodological feature of the FRS is that it is designed to be representative of UK private households. As the sample for PPLL was selected as a random probability sample from a defined sub-group of FRS respondents, the responding sample for PPLL is notionally representative of that sub-group, that is 40-75 year olds living in Great Britain. To ensure that the findings from PPLL could be generalised to the population of interest, survey weights were calculated to account for selection and non-response biases from each of the surveys in turn. In essence, the survey weights address any differences in the likelihood that an individual is selected to take part in FRS and in PPLL, as well as any factors that may be associated with differences in the probability of responding to the two surveys. The weights were constructed in several stages as described below.
FRS and PPLL selection weights
The first stage of the weighting design for PPLL accounts for the chance of being selected to participate in the FRS. This stage of weighting was constrained by the availability of data relating to the issued sample for FRS. Specifically, NatCen only had access to data for those individuals selected for the PPLL sample[footnote 22]. No data was available relating to addresses from which no FRS survey response was received, nor for those households which responded to FRS but did not contain any respondents who would be eligible for PPLL. It was not, therefore, possible to calculate non-response weights for FRS which account for patterns of response across all addresses in the survey sample. Instead, a proxy FRS weight was created which accounted for bias with respect to the chance of being selected for the FRS sample, as well as some limited aspects of non-response. A selection weight (W1) was calculated as the inverse of each address’ probability of selection, i.e. W1 = 1 / P1, where P1 is the probability of an address selection for FRS 17/18.
Next, the weighting approach accounts for the selection of eligible FRS respondents within households into the sample frame eligible for selection into PPLL. In instances where there were multiple people who were eligible for PPLL from the same household, a single person was randomly selected to be approached for an interview. Those with employment status of self-employed were identified as being of particular analytic interest for the survey, so were assigned a boosted probability of selection. Specifically, individuals who were classed as self-employed when they responded to the FRS were given twice the probability of being selected compared to other eligible individuals in the same household who gave an alternative employment status. The probability of each person in the PPLL sample having been selected was calculated based on the number of eligible individuals in the household and their respective employment statuses. The individual selection weight (W2) was then calculated as the inverse of this probability, i.e. W2 = 1 / P2, where P2 is the probability of each member of the PPLL sample being selected from their respective households. After the two component selection weights had been created, a combined selection weight was calculated as the product of the two (i.e. W3 = W1 * W2).
A simple calibration adjustment was made to create weights that act as a proxy for individual-level weights for the FRS. These, in turn, ensure that the weighted profile of the sample selected for PPLL matches the profile of the population in terms of region and age/sex. The combined selection weights (W3), in this case, were adjusted so that the weighted sample matches the Office for National Statistics (ONS) mid-year population estimates for the population of interest (40-75 year olds, living in Great Britain)[footnote 23]. The resulting weight created from this calibration step (W4) acts as a proxy FRS weight for individuals selected for the PPLL sample.
PPLL pilot selection weight
From the PPLL sample, a small number of cases (159) were randomly allocated to the pilot survey (with a known probability). As responses from the pilot survey are not included in the final PPLL data, the probability of selection for the pilot also needed to be accounted for in weighting. Again, to help ensure that there were sufficient numbers of self-employed respondents for sub-group analysis in the final achieved sample, different probabilities of selection were used. In this case, the self-employed were selected for the pilot with a lower probability compared to those with a different employment status, and this is reflected in the weights. As with the selection weights in earlier steps, the pilot selection weight (W5) was calculated as the inverse of the probability (on this occasion, of not being selected for the pilot). This was then combined with the proxy FRS weight (W4) by multiplying the two (i.e. W6 = W4 * W5).
PPLL non-response weight
In the final weighting stage, the combined weight (W6) was applied to a non-response model which was used to estimate the probability of response to the PPLL survey given the known characteristics of those sampled. To this end, logistic regression was used to model the probability of response using a combination of geographic data (inferred from postcode) and individual-level characteristics recorded at the FRS. The final selection of explanatory variables for the model was determined using a stepwise approach, where the incremental effect of either adding or removing variables on the fit of the model is tested. Using this approach, the following were used in the final model to estimate the probability of response to PPLL: age/sex, region, employment status, ethnicity, housing tenure, household composition, highest educational qualification, council tax band, the National Statistics Socio-Economic Classification (NS-SEC) classification and population density (quintile).
Once the probabilities of response had been estimated, the non-response weights were then calculated as the inverse of the estimated probability of response, given each member of the sample’s characteristics (i.e. W7 = 1 / PResponse). The final PPLL weight was then calculated as the product of this and the preceding weight: WPPLL = W6 * W7. These were then scaled so that the mean weight is equal to 1, i.e. the unweighted sample size is equal to the weighted sample size[footnote 24].
The final PPLL weights account for a range of survey biases. These include not all people having the same probability of being selected for the survey, as well as systematic differences in the propensities of different groups to respond. When applied, the survey weights minimise the effect of these sources of bias and enable us to generalise the survey findings to the population.
-
The FCA have since (in 2019) introduced rules which include requirements for a ‘wake up’ pack given at age 50 (to align with the age that consumers can access pensions guidance provided by Pension Wise), then again 4 to 10 weeks before age 55, and then every 5 years until consumers have fully crystallised their pension. ↩
-
A respondent was deemed to have got their SPa correct if they gave the same age in years for their SPa as the government’s State Pension calculator. The current timetable for gradually increasing the SPa means that some people will have an SPa of between 66 and 67 or between 67 and 68 years. Anyone with an SPa of 66 (67) years and x months was judged to have a SPa of 66 (67) for the purposes of comparing their self-reports of expected and actual SPa. The number of respondents in these “bridging” groups was relatively small (n=136). ↩
-
Finding significant at 10% level. ↩
-
It should be noted that, whilst most people born after 1964 will receive the full nSP amount when they reach SPa, currently the amount received depends on a person’s National Insurance record and many people receiving the nSP in 2020/21 will have been receiving less than this (the average amount received was £164 per week). ↩
-
Significant at 10% level. ↩
-
Significant at 10% level. ↩
-
Respondent-specific replacement rates have not been calculated. That is beyond the scope of this report and the possibilities for analysis are limited by the fact that income was collected in banded amounts and the bands do not map exactly on to those required for the PLSA or Pension Commission measures. ↩
-
The figure of 68% of self-employed people expecting to use a private pension in retirement is higher than found in some other studies. For example, a 2018 study of the self-employed found that only 36% of the self-employed expected to use income from a private pension in retirement (Dabhi et al, 2018). The difference in findings is likely to be explained (at least in part) by the fact that, whereas the 2018 study covered all self-employed people regardless of age, PPLL respondents were aged 40-75. Furthermore, PPLL self-employed respondents tended to be older than the rest of the sample. They had therefore had longer to experience employment as well as self-employment and, potentially, save into a workplace pension. ↩
-
The definition of caring used in the questionnaire was a broad one and included activities such as keeping an eye out for neighbours as well as more intensive caring responsibilities. The exact question wording was: “Do you help family members, friends, neighbours or others because they have long-term physical or mental ill-health or disability, or problems relating to old age?” This may include help with personal or medical care or looking after the home but also activities such as “keeping an eye out”, offering social support or accompanying trips out of the house. ↩
-
Significant at the 10% level. ↩
-
Significant at the 10% level. ↩
-
Significant at 10% level. ↩
-
Significant at 10% level. ↩
-
The Financial Lives report (FCA, 2021) found that 39% of people with a DC pension in accumulation had a combined DC pot size of less than £10,000. That figure covered all UK adults whereas PPLL only covers adults aged 40-75. ↩
-
Data on pension enrolment collected from employers suggests this figure may be an underestimate and that more than 80% of 40-60 year olds are currently in workplace pensions (ONS, 2021b). ↩
-
The minimum contribution level is set at 8% of qualifying earnings whereas the PPLL questionnaire asked for the percentage of the respondent’s total pay (which may be lower than the percentage calculated on qualifying earnings) paid in contributions. It is possible for people to opt in to automatic enrolment and contribute less than the advised minimum. ↩
-
The median pot size of all DC pots accessed where a value was recorded (not just since 2015) was £35,000. ↩
-
Please note, the sample size for this data point is very low so should be treated with caution. ↩
-
See Family Resources Survey Question Instructions 2017-18, pp. 329-30, for the full question wording: ↩
-
In addition to these criteria, a small number of respondents to FRS 2017-18 were ineligible to be selected for PPLL as they had already been sampled for an earlier follow-up study by the Department for Education. As there is little overlap between the population of interest for that study and PPLL this is likely to introduce minimal bias. ↩
-
The co-operation rate excludes anyone not capable of participating due to illness/language barrier. ↩
-
The grossing weights that are produced for the Family Resources Survey are calculated at the household level. As the PPLL weights needed to be calculated at the person-level, it was not appropriate to use the FRS grossing weights to account for selection and non-response biases at FRS. Further details regarding the FRS weighting methodology are available in the FRS grossing methodology review published in June 2014 ↩
-
The most recent available update of the estimates was used to create targets for the calibration weighting. These were the mid-year population estimates for 2019 (published April 2020). The data used is available here: https://www.ons.gov.uk/peoplepopulationandcommunity/populationandmigration/populationestimates/datasets/populationestimatesforukenglandandwalesscotlandandnorthernireland ↩
-
Having been scaled to a mean of 1, the minimum weight is 0.16 and the maximum weight is 5.96. The weights have an estimated design effect of 1.50. ↩