Pension Schemes Act 2026 Evaluation Strategy (accessible)
Published 13 July 2026

© Crown copyright 2026
This publication is licensed under the terms of the Open Government Licence v3.0 except where otherwise stated. To view this licence, visit nationalarchives.gov.uk/doc/open-government-licence/version/3 or write to the Information Policy Team, The National Archives, Kew, London TW9 4DU, or email: psi@nationalarchives.gov.uk.
Where we have identified any third party copyright information you will need to obtain permission from the copyright holders concerned.
This publication is available at https://www.gov.uk/government/publications/pension-schemes-act-2026-evaluation-strategy/pension-schemes-act-2026-evaluation-strategy-accessible
A report carried out by the Department for Work and Pensions.
Crown copyright 2026.
You may re-use this information (not including logos) free of charge in any format or
medium, under the terms of the Open Government Licence. To view this licence, visit National Archives on GOV.UK or write to the Information Policy Team, The National Archives, Kew, London TW9 4DU, or email psi@nationalarchives.gov.uk.
This document/publication is also available on our website at: Research at DWP - Department for Work and Pensions - GOV.UK
If you would like to know more about DWP research, email socialresearch@dwp.gov.uk
First published July 2026.
ISBN 978-1-80786-025-7
List of Abbreviations
| CDC | Collective Defined Contribution |
| DB | Defined Benefit |
| DC | Defined Contribution |
| DWP | Department for Work and Pensions |
| FCA | Financial Conduct Authority |
| GPP | Group Personal Pension |
| HMRC | His Majesty’s Revenue and Customs |
| HMT | His Majesty’s Treasury |
| M&E | Monitoring and Evaluation |
| TPR | The Pensions Regulator |
| VfM | Value for Money |
| AE | Automatic Enrolment |
| AUM | Assets Under Management |
| PPF | Pension Protection Fund |
| NMPA | Normal Minimum Pension Age |
Executive summary
Introduction
This Evaluation Strategy document develops the Monitoring and Evaluation plans laid out in the Pension Schemes Act Impact Assessment. This expands the established core metrics and explores the outcomes and evaluation questions for individual policies, which will be essential in understanding the impact of the policies in the act and assessing the progress being made across the DB and DC landscape. The contents have been developed by DWP in collaboration with The Pensions Regulator (TPR), the Financial Conduct Authority (FCA), and HM Treasury.
The policies within the Act concern schemes and firms across the trust-based and contract-based sides of the market. For clarity, this document refers to these collectively as “schemes”.
Overview
The Evaluation Strategy contains:
-
Logic models: For a number of the key policies to be delivered by DWP in the Act[footnote 1], DWP has created a logic model which demonstrates the high-level link between the policy and its outcomes. These have been used to help establish the key metrics and individual policy evaluation questions.
-
Headline metrics and latest position: Using currently available data, DWP has provided estimates of our current position against the metrics laid out in the Pensions Scheme Act Impact Assessment[footnote 2], as well as outlining plans for future data collection. The high level summary is as follows:
-
Metric 1: Number of small deferred pots: DWP currently estimates there are 16 million small deferred pots and intends to update this periodically using industry engagement (prior to implementation) and TPR returns (post implementation).
-
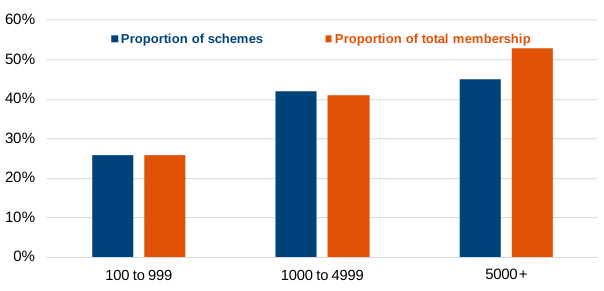
Metric 2: Number of DC schemes offering (or partnering to offer) decumulation products: TPR data found 45% of large schemes offer at least one in-scheme decumulation product. DWP is developing an approach with TPR and FCA to collect this data as part of scheme returns in the future.
-
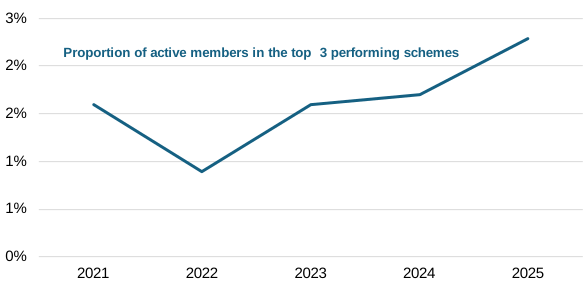
Metric 3: The proportion of members in schemes with high investment performance: 2.3% of members are in the top 3 performing Master Trusts and GPP’s of the 19 within the scope of Corporate Advisor’s report. Once in place, DWP will use the VfM data submitted by schemes to monitor this metric, but may use an alternative measure of high investment performance to do so.
-
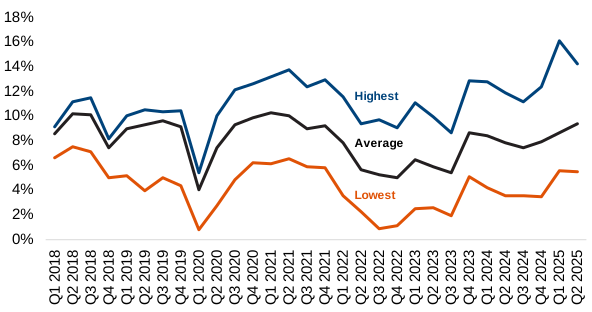
Metric 4: The range of investment performance seen between providers: The latest Corporate Advisor data shows there was a roughly 10ppt gap in the 5-year annualised gross returns amongst DC schemes of the lowest and highest performers. Once in place, DWP will use the VfM data submitted by schemes to monitor this metric, as well as the industry average to ensure the lowest performing schemes are the ones closing the gap.
-
Metric 5: The proportion of DC assets invested in Private markets and the proportion invested in UK based assets: Corporate Adviser data indicates that Master trust and GPP investment in UK and overseas private markets comprises roughly 4% of their total investment. Once in place, DWP will use the VfM data submitted by schemes to monitor this metric.
-
Metric 6: The number of large multi-employer DC schemes that are of scale (Megafunds): Currently 10 DC schemes are estimated to have surpassed the £25bn AUM threshold, according to Corporate Advisor and GoPensions data. Once the policy in in place, DWP will use data from TPR and FCA to monitor the number of Megafunds.
-
Metric 7: The number of default arrangements across DC schemes: Consultation responses from the Pension Investment Review and the FCA’s VfM review find that currently 20 of 30 observed schemes hold less than 10 defaults. Once the policy is in place, DWP will use data from TPR and FCA collected as part of the Megafunds policy to monitor this metric.
-
Metric 8: The number of authorised DB superfunds: This metric will be monitored using TPR authorisation data and continued DB scheme surveys. There is not currently any data on the number of schemes intending to become authorised superfunds, however 6% of schemes surveyed by TPR were considering entering a Superfund, while 1% had entering a Superfund as a Long Term Objective.
-
Metric 9: The number of DB schemes extracting their DB surplus and the value of asset surplus being released: HMRC data finds there were £32m of surplus payments made by DB schemes. DWP will continue to use HMRC quarterly surplus data to monitor this metric and future information received from TPR by schemes.
-
Metrics 10-12: Industry Readiness: DWP is currently exploring options for the measurement of these metrics, working with the cross government monitoring and evaluation working group (with representatives from DWP, TPR, FCA, and HMT) to identify opportunities to understand the industry’s readiness for the reforms.
3. Evaluation questions: DWP has scoped out six evaluation strategies in detail that explore the questions and sub-questions that will be answered as part of the evaluation plans. These cover Value for Money, Small Pots, Guided Retirement, DC Megafunds, DB Superfunds, and DB Surplus Extraction. These are the policies in the Pension Schemes Act for which Impact Assessments were produced[footnote 3]. Other policies introduced as part of the Act are equally important and will still be closely monitored. For example, Metric 5 above strongly relates to the asset-allocation reserve power, while Metric 7 links to the Contractual Override policy and the fragmentation review. The evaluation questions are presented at a high-level to be transparent on the emerging plans and capture the key indicators of success across the policy areas to guide future research plans and data requirements.
4. Sources of information: Working across departments and regulators, DWP has established a list of preferred data sources to be used in the build up to, and the implementation of the Act. Some of these are already available, while others are under development or being scoped out. It is fully recognised that any additional data or requests will need to be proportionate and minimise burden on business and therefore metrics have been aligned as much as possible with existing sources and the planned Value for Money framework. However, given the significance of the reform across a £2 trillion[footnote 4] industry a strong monitoring and evaluation approach is required, with the appropriate data being gathered. This will support the effective tracking of benefit realisation from the reforms, including their contribution to improved member outcomes and wider economic growth.
DWP also recognises that it will need to continue to work with TPR and FCA as the policies develop and evolve to establish what data will be necessary to collect, and determine the best means of obtaining it.
Acknowledgements
We would like to thank the cross-Government Monitoring and Evaluation working group that includes representatives from the DWP, The Pensions Regulator, the Financial Conduct Authority, and HM Treasury.
We would also like to thank all the colleagues across the DWP that have supported the development of this document.
Authors
Conor Frow: Fast Stream Economist, Department for Work and Pensions
Chris Lord: Principal Social Researcher, Department for Work and Pensions
Richard Mosley: Senior Principal Economist, Department for Work and Pensions
1. Introduction
The Pension Schemes Act 2026, which received Royal Assent in April[footnote 5], introduced 12 policies aimed at improving both the Defined Contribution (DC) and Defined Benefit (DB) markets. The measures introduced by the Act present a significant change to the pensions landscape over a number of years. DWP is committed to putting in place a strong monitoring and evaluation plan to ensure the measures are meeting the objectives, learning takes place, and policies are reviewed as new evidence emerges.
This Evaluation Strategy provides a framework for evaluating the effects of these measures and outlines the areas of interest for Government in understanding the changes. It is structured around the four core aims of the Act which will assess the effects of the reforms against the policy objective of:
- Improvements to member outcomes
- Diversified investment and improved market performance
- Fewer, bigger DC schemes and a strong DB market
- An industry adapting and ready for reform
The following sections set out:
- The broad policy context
- The logic models used to show the intended outcomes and impacts of the policies and how these were used to help design the monitoring and evaluation strategy
- The 12 key headline metrics developed to monitor at a high level if the Act measures are leading to the desired outcomes, and the latest position on each of these
- More detailed monitoring and evaluation plans across the main measures
1.1 Policy Background
Automatic Enrolment (AE) was first introduced in 2012 and has led to a significant increase in the number of workplace pension savers. 89% of eligible employees (nearly 22m) are now saving into a workplace pension, the vast majority of these savers are saving into a Defined Contribution (DC) workplace pension[footnote 6]. However, inertia is strong and engagement is low. 50% of savers have not reviewed how much their pension is worth in the last 12 months[footnote 7] and over 94% of pension savers are invested in a pension scheme’s default investment strategy in the trust-based market[footnote 8].
The market is also highly intermediated, with employers selecting pension schemes on behalf of their employees. This may mean that the employers themselves are not placing as much competitive pressure as individuals selecting their own scheme directly would.
This highlights the responsibility of government to act, where appropriate, to deliver good outcomes for members who may not otherwise engage with their pension, or have employers engage on their behalf.
The pension industry has a large amount of assets (£2 trillion[footnote 9] and pension fund investment in domestic markets has the potential to support stronger economic growth and capital market development[footnote 10]. However, the UK does not have the same number of large pension providers seen in other countries such as USA, Australia, and Canada. Additionally, investment by DC pension funds in the UK has been falling and remains lower than comparator countries’ investment in their own economies (for example, Australia and New Zealand) as well as having significantly lower proportions in private markets.
Over the last two years, there has also been a significant increase in the level of DB funding with around three-in-four schemes in surplus on a low-dependency basis[footnote 11]. This offers the opportunity for schemes to return money to employers and individuals, supporting investment and UK growth, alongside increasing the likelihood of members receiving the pensions they have been promised.
To legislate for policy development in this area the Pension Schemes Bill was announced in the Kings Speech in July 2024[footnote 12]. The Bill was then introduced into the House of Commons in June 2025[footnote 13], before receiving Royal Assent in April 2026[footnote 14]. The Act has a number of policies, which include:
-
Value for Money (VfM)
-
Small pots
-
Guided Retirement
-
Contractual Override
-
Megafunds for DC (including the fragmentation review)
-
Megafunds (Local Government Pension Schemes (LGPS))
-
DB superfunds
-
DB Surplus Flexibilities
-
PPF Schemes Rules for Terminal Illness (SRTI)
-
Pensions Ombudsman (TPO)
-
PPF Levy
-
Display of PPF and FAS information on the pensions dashboard service provided by MaPS
-
Asset allocation reserve power
-
Contractual override
More information on each of these policies and the legislation for them can be found in the Impact Assessment[footnote 15], and at the official government legislation website[footnote 16].
1.2 Timetable
As outlined in the new Pensions Roadmap[footnote 17], there are a significant number of reforms taking place over the next 5 years. The sequencing and implementation timing of the different reforms is important, as it reflects lead-in times and industry capacity. A similar approach being planned for the Evaluation Strategy.
Prior to the implementation of a policy, DWP will seek to establish a baseline for each metric, followed by the monitoring of short, medium, and long term effects of each policy. As policies are being developed to different timelines, specific Monitoring and Evaluation plans will need to develop alongside them. The Evaluation Strategy will evolve as policy and delivery details become clearer whilst emerging findings will help influence the shape and design of the policy.
Planned timings for each policy can be found in the Roadmap that has been published alongside this document.
2. Logic Models
As part of the M&E plans, logic models have been developed for the key policies in the Act. Their purpose is to highlight the key direct outcomes expected, how they may arise, and help shape the key evaluation questions and metrics.
Each of the models identifies the link between government/regulator interventions, industry responses, and member, investment, employer, and pension scheme outcomes. The following key is used to differentiate between them:
Key 2.1
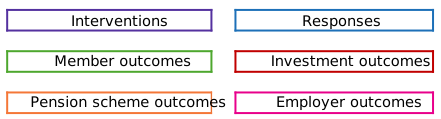
Key 2.1 displays the categories used in the logic models, and the colours used to identify them. It includes Interventions (purple), Responses (blue), Member outcomes (green), Investment outcomes (red), Pension scheme outcomes (orange), and employer outcomes (pink).
Outcomes that are considered core to the “headline metrics” (section 3.1) have been underlined. Most of the other outcomes can be found as part of the individual policy M&E plans (section 3.3).
While these logic models aim to highlight the key features of the policies, effects, and outcomes, they are not exhaustive. Further detail on each of the policies can be found in the Pension Scheme Bill Impact Assessment[footnote 18].
The links set out in the logic models should not be viewed as established causal relationships, but instead DWP’s current assumptions about how the policy interventions will lead to the identified outcomes. The evaluation plans laid out later in this document will assess the extent to which each policy achieves these.
2.1 Value for Money (VfM)
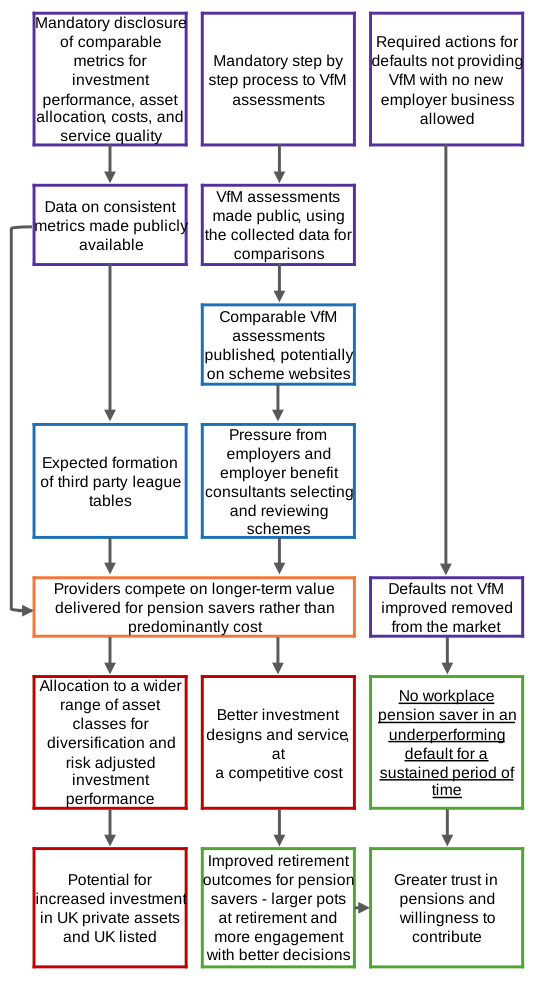
Figure 2.1 is a logic model demonstrating the assumed link between the Value for Money legislation and its potential outcomes. Below are the expected responses and outcomes that follow each of the interventions for this policy.
VfM Intervention 1
Mandatory disclosure of comparable metrics for investment performance, asset allocation, costs, and service quality.
Responses
-
Data on consistent metrics made publicly avaliable
-
Expected formation of third party league tables
Outcomes
-
Providers compete on longer-term value delivered for pension savers rather than predominantly cost
-
Allocation to a wider range of asset classes for diversification and risk adjusted investment performance
-
Better investment designs and service, at a competitive cost
-
Potential for increased investment in UK private assets and UK listed
-
Improved retirement outcomes for pension savers - larger pots at retirement and more engagement with better decisions
-
Greater trust in pensions and willingness to contribute
VfM Intervention 2
Mandatory step by step process to VfM assessments.
Responses
-
VfM assessments made public, using the collected data for comparisons
-
Comparable VfM assessments published, potentially on scheme websites
-
Pressure from employers and employer benefit consultants selecting and reviewing schemes
Outcomes
-
Providers compete on longer-term value delivered for pension savers rather than predominantly cost
-
Allocation to a wider range of asset classes for diversification and risk adjusted investment performance
-
Better investment designs and service, at a competitive cost
-
Potential for increased investment in UK private assets and UK listed
-
Improved retirement outcomes for pension savers - larger pots at retirement and more engagement with better decisions
-
Greater trust in pensions and willingness to contribute
VfM Intervention 3
Required actions for defaults not providing VfM with no new employer business allowed.
Responses
- Defaults not VfM improved removed from the market
Outcomes
-
No workplace pension saver in an underperforming default for a sustained period of time
-
Greater trust in pensions and willingness to contribute
2.2 Small Pots
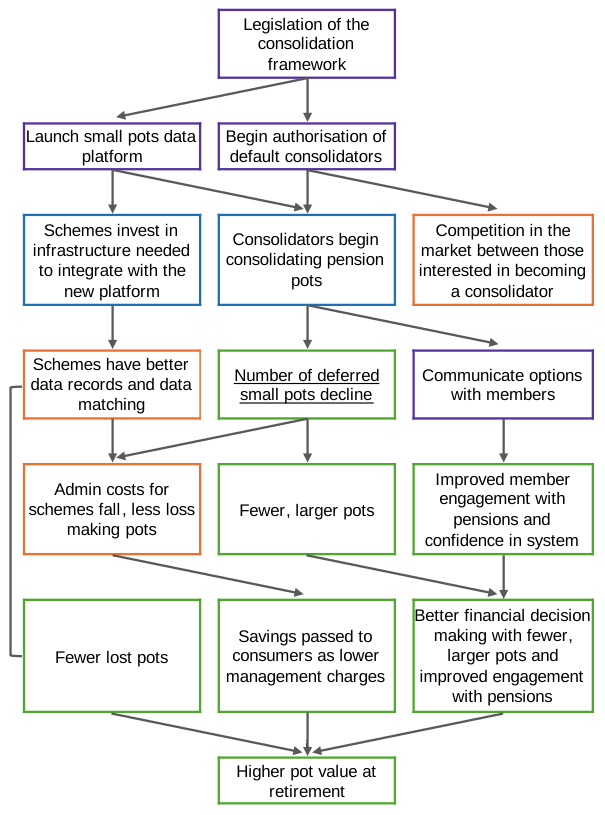
Figure 2.2 is a logic model demonstrating the assumed link between the Small Pots legislation and its potential outcomes. Below are the expected responses and outcomes that follow each of the interventions for this policy.
Small Pots Intervention 1
Legislation of the consolidation framework.
Launch small pots data platform.
Responses
-
Schemes invest in infrastructure needed to integrate with the new platform
-
Consolidators begin consolidating pension pots
Outcomes
-
Schemes have better data records and data matchings
-
Number of deferred small pots decline
-
Communicate options with members
-
Admin costs for schemes fall, less loss making pots
-
Fewer, larger pots
-
Improved member engagement with pensions and confidence in system
-
Fewer lost pots
-
Savings passed to consumers as lower management charges
-
Better financial decision making with fewer, larger pots and improved engagement with pensions
-
Higher pot value at retirement
Small Pots Intervention 2
Legislation of the consolidation framework.
Begin authorisation of default consolidators.
Responses
- Consolidators begin consolidating pension pots
Outcomes
-
Competition in the market between those interested in becoming a consolidator
-
Number of deferred small pots decline
-
Communicate options with members
-
Admin costs for schemes fall, less loss making pots
-
Fewer, larger pots
-
Improved member engagement with pensions and confidence in system
-
Savings passed to consumers as lower management charges
-
Better financial decision making with fewer, larger pots and improved engagement with pensions
-
Higher pot value at retirement
2.3 Guided Retirement
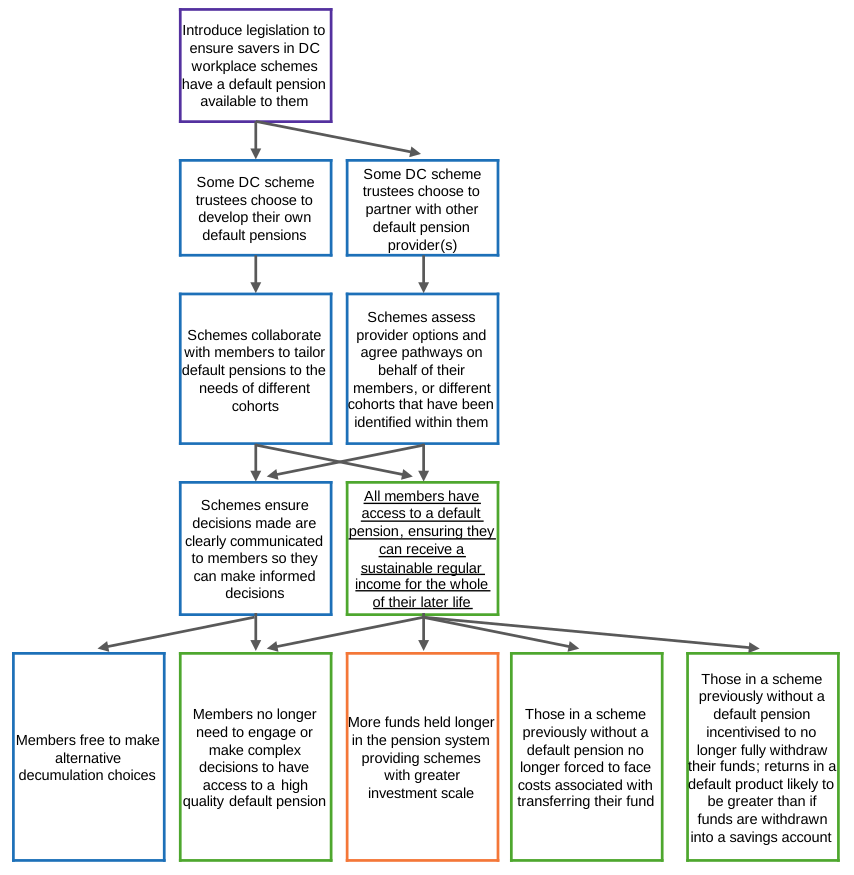
Figure 2.3 is a logic model demonstrating the assumed link between the Guided Retirement legislation and its potential outcomes. Below are the expected responses and outcomes that follow each of the interventions for this policy.
Guided Retirement Intervention 1
Introduce legislation to ensure savers in DC workplace schemes have a default pension available to them.
Responses
-
Some DC scheme trustees choose to develop their own default pensions
-
Some DC scheme trustees choose to partner with other default pension provider(s)
-
Schemes collaborate with members to tailor default pensions to the needs of different cohorts
-
Schemes assess provider options and agree pathways on behalf of their members, or different cohorts that have been identified within them
-
Schemes ensure decisions made are clearly communicated to members so they can make informed decisions
-
Members free to make alternative decumulation choices
Outcomes
-
All members have access to a default pension, ensuring they can receive a sustainable regular income for the whole of their later life
-
Members no longer need to engage or make complex decisions to have access to a high quality default pension
-
More funds held longer in the pension system providing schemes with greater investment scale
-
Those in a scheme previously without a default pension no longer forced to face costs associated with transferring their fund
-
Those in a scheme previously without a default pension incentivised to no longer fully withdraw their funds; returns in a default product likely to be greater than if funds are withdrawn into a savings account
2.4 DC Megafunds
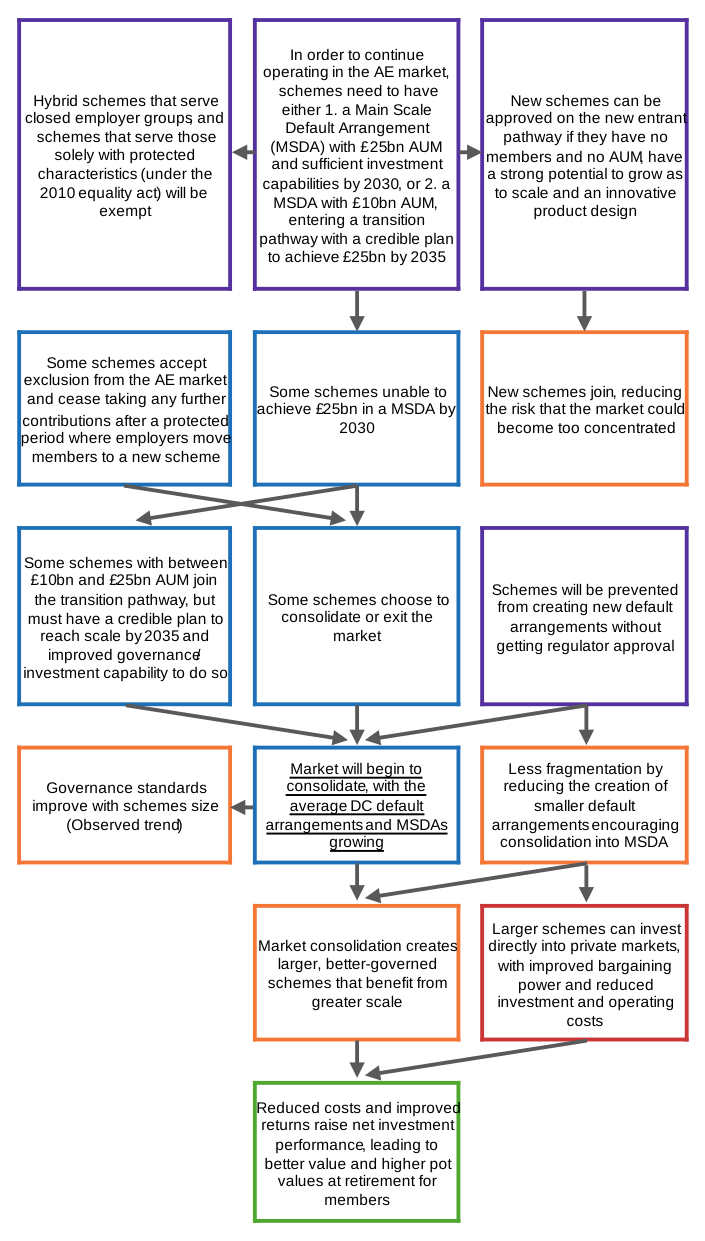
Figure 2.4 is a logic model demonstrating the assumed link between the DC Megafunds legislation and its potential outcomes. Below are the expected responses and outcomes that follow each of the interventions for this policy.
DC Megafunds Intervention 1
In order to continue operating in the AE market, schemes need to have either 1. a Main Scale Default Arrangement (MSDA) with £25bn AUM and sufficient investment capabilities by 2030, or 2. a MSDA with £10bn AUM, entering a transition pathway with a credible plan to achieve £25bn by 2035.
Responses
-
Some schemes unable to achieve £25bn in a MSDA by 2030
-
Some schemes accept exclusion from the AE market and cease taking any further contributions after a protected period where employers move members to a new scheme
-
Some schemes with between £10bn and £25bn AUM join the transition pathway, but must have a credible plan to reach scale by 2035 and improved governance/ investment capability to do so
-
Some schemes choose to consolidate or exit the market
-
Market will begin to consolidate, with the average DC default arrangments and MSDAs growing
Outcomes
-
Governance standards improve with schemes size (Observed trend)
-
Market consolidation creates larger, better-governed schemes that benefit from greater scale
-
Reduced costs and improved returns raise net investment performance, leading to better value and higher pot values at retirement for members
DC Megafunds Intervention 2
New schemes can be approved on the new entrant pathway if they have no members and no AUM, have a strong potential to grow as to scale and an innovative product design.
Outcome
- New schemes join, reducing the risk that the market could become too concentrated
DC Megafunds Intervention 3
Schemes will be prevented from creating new default arrangements without getting regulator approval.
Responses
- Market will begin to consolidate, with the average DC default arrangments and MSDAs growing
Outcomes
-
Less fragmentation by reducing the creation of smaller default arrangements encouraging consolidation into MSDA
-
Governance standards improve with schemes size (Observed trend)
-
Larger schemes can invest directly into private markets, with improved bargaining power and reduced investment and operating costs
-
Market consolidation creates larger, better-governed schemes that benefit from greater scale
-
Reduced costs and improved returns raise net investment performance, leading to better value and higher pot values at retirement for members
2.5 DB Superfunds
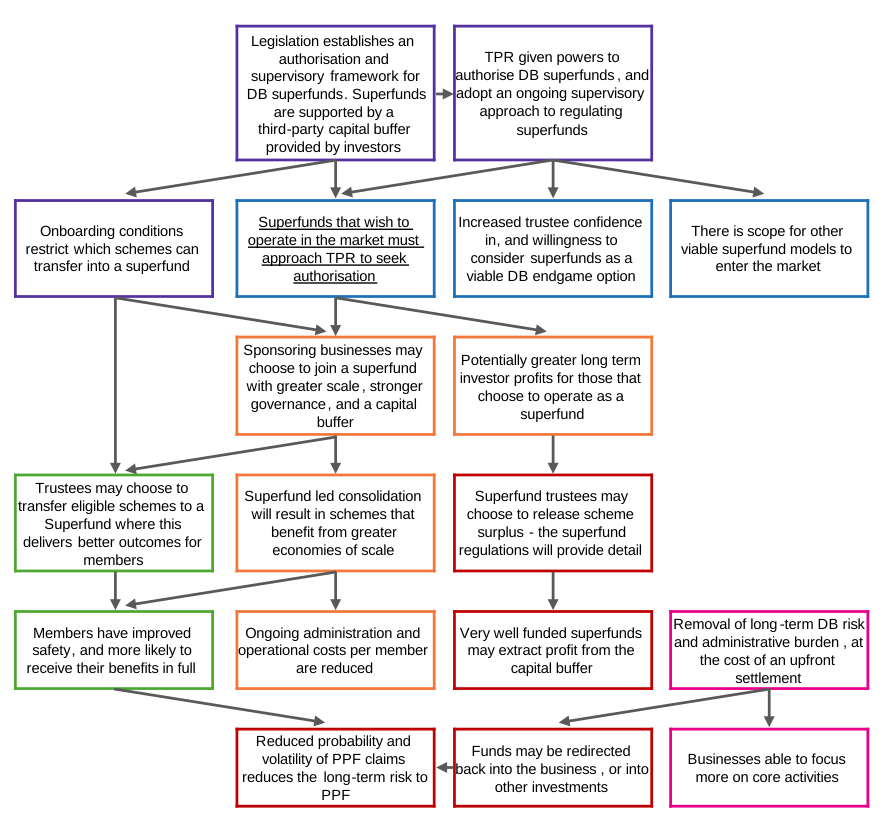
Figure 2.5 is a logic model demonstrating the assumed link between the DB Superfunds legislation and its potential outcomes. Below are the expected responses and outcomes that follow each of the interventions for this policy.
DB Superfunds Intervention 1
Legislation establishes an authorisation and supervisory framework for DB superfunds. Superfunds are supported by a third-party capital buffer provided by investors.
Onboarding conditions restrict which schemes can transfer into a superfund.
Responses
- Superfunds that wish to operate in the market must approach TPR to seek authorisation
Outcomes
-
Sponsoring businesses may choose to join a superfund with greater scale, stronger governance, and a capital buffer
-
Potentially greater long term investor profits for those that choose to operate as a superfund
-
Trustees may choose to transfer eligible schemes to a Superfund where this delivers better outcomes for members
-
Superfund led consolidation will result in schemes that benefit from greater economies of scale
-
Superfund trustees may choose to release scheme surplus - the superfund regulations will provide detail
-
Members have improved safety, and more likely to receive their benefits in full
-
Ongoing administration and operational costs per member are reduced
-
Very well funded superfunds may extract profit from the capital buffer
-
Reduced probability and volatility of PPF claims reduces the long term risk to PPF
DB Superfunds Intervention 2
TPR given powers to authorise DB superfunds, and adopt an ongoing supervisory approach to regulating superfunds.
Responses
-
Superfunds that wish to operate in the market must approach TPR to seek authorisation
-
Increased trustee confidence in, and willingness to consider superfunds as a viable DB endgame option
-
There is scope for other viable superfund models to enter the market
Outcomes
-
Sponsoring businesses may choose to join a superfund with greater scale, stronger governance, and a capital buffer
-
Potentially greater long term investor profits for those that choose to operate as a superfund
-
Trustees may choose to transfer eligible schemes to a Superfund where this delivers better outcomes for members
-
Superfund led consolidation will result in schemes that benefit from greater economies of scale
-
Superfund trustees may choose to release scheme surplus - the superfund regulations will provide detail
-
Members have improved safety, and more likely to receive their benefits in full
-
Ongoing administration and operational costs per member are reduced
-
Very well funded superfunds may extract profit from the capital buffer
-
Reduced probability and volatility of PPF claims reduces the long term risk to PPF
2.6 DB Surplus
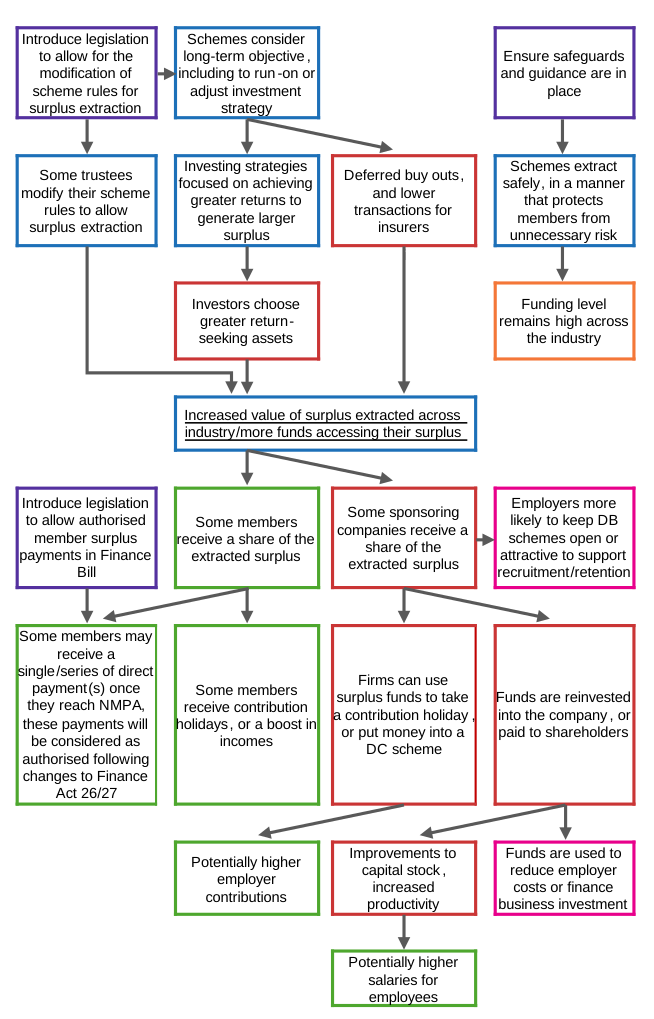
Figure 2.6 is a logic model demonstrating the assumed link between the DB Surplus legislation and its potential outcomes. Below are the expected responses and outcomes that follow each of the interventions for this policy.
DB Surplus Intervention 1
Introduce legislation to allow for the modification of scheme rules for surplus extraction.
Responses
-
Some trustees modify their scheme rules to allow surplus extraction
-
Increased value of surplus extracted across industry/more funds accessing their surplus
-
Schemes consider long-term objective, including to run-on or adjust investment strategy
-
Investing strategies focused on achieving greater returns to generate larger surplus
-
Investors choose greater return-seeking assets
-
Deferred buy outs, and lower transactions for insurers
Outcomes
-
Some members receive a share of the extracted surplus
-
Some members receive contribution holidays, or a boost in incomes
-
Some sponsoring companies receive a share of the extracted surplus
-
Firms can use surplus funds to take a contribution holiday, or put money into a DC scheme
-
Potentially higher employer contributions
-
Funds are reinvested into the company, or paid to shareholders
-
Improvements to capital stock, increased productivity
-
Potentially higher salaries for employees
DB Surplus Intervention 2
Introduce legislation to allow authorised member surplus payments in Finance Bill.
Outcomes
- Some members may receive a single/series of direct payment(s) once they reach NMPA, these payments will be considered as authorised following changes to Finance Act 26/27
DB Surplus Intervention 3
Ensure safeguards and guidance are in place.
Responses
- Schemes extract safely, in a manner that protects members from unnecessary risk
Outcomes
- Funding level remains high across the industry
3. Headline Metrics and Evaluation Questions
The Pension Schemes Act Impact Assessment[footnote 19] had an overall monitoring and evaluation plan along with more detailed individual policy plans. Further steps were then taken to develop those plans, building on feedback from Parliament and the Regulatory Policy Committee (RPC)[footnote 20] as the Bill was introduced into the House of Lords.
As part of this, a Cross-Departmental and Regulator Steering Group was established (bringing together DWP, HMT, TPR and FCA) to develop data requirements, align research programmes, and monitor progress. Together this group developed key headline metrics across four broad categories, covered in detail below, to identify the areas to closely monitor ahead of, and during implementation to determine progress.
The below sets out key evaluation questions for each policy, the metrics that will be used to monitor progress, and the data requirements.
3.1 Headline metrics
As outlined, 12 headline metrics have been developed to provide insights on the overall progress of the measures. They are not exhaustive; but are aimed at understanding overall performance and are key indicators as to whether the measures are leading to desired outcomes.
Theme 1: Improvements to member outcomes
The Act aims to deliver better outcomes to savers through improving returns, consolidating small pots, and driving value over cost. The headline metrics to monitor are:
-
Metric 1: A reduction in the number of small deferred pots
-
Metric 2: All DC schemes offer (or partner to offer) decumulation products
-
Metric 3: An increase in the proportion of members in schemes with high investment performance
Theme 2: Diversified investment and improved market performance
The Act aims to encourage greater investment in a wider range of assets to improve diversification and help improve returns for members. In addition, this should lead to greater home bias by pension funds and support UK economic growth. The headline metrics to monitor are:
-
Metric 4: A decline in the range of investment performance seen between firms
-
Metric 5: An increase in the proportion of DC assets invested in Private Markets and an increase in investment in UK-based assets by DC schemes
Theme 3: Fewer, bigger DC schemes and strong DB market
The Act aims to reform the private pension landscape. For DB schemes, this is through increasing the options available through the introduction of Superfunds and facilitating greater access to the surplus schemes may hold to support members and employers. For DC schemes, it aims to lead to fewer, bigger, but better schemes through increased consolidation and greater focus on value over costs. The headline metrics to monitor are:
-
Metric 6: An increase in the number of large multi-employer DC schemes that are of scale (Megafunds)
-
Metric 7: A decline in the number of default arrangements across DC schemes
-
Metric 8: A growth in the number of authorised DB superfunds
-
Metric 9: An increase in the number of DB schemes extracting their DB surplus and the value of asset surplus being released
Theme 4: An industry adapting and ready for reform
DWP wants to ensure that the industry is prepared for the introduction of the Act. The following metrics will help gauge how the industry is understanding the changes and what will be required of them, while also giving an insight into what is being done in preparation. The headline metrics to monitor are:
-
Metric 10: Providers are aware of and understand the reforms
-
Metric 11: Providers have started to put plans in place to be ready for implementation
-
Metric 12: Providers feel they will be ready for when the reforms come in
3.2 Latest position
With the Pension Schemes Act having received Royal Assent, it is important to establish the latest position on these headline metrics. The below presents the best estimates using available data. Ahead of the policies coming in, this can be seen as a baseline position which the department will continue to monitor and update as new data becomes available.
Metric 1: Number of small deferred pots
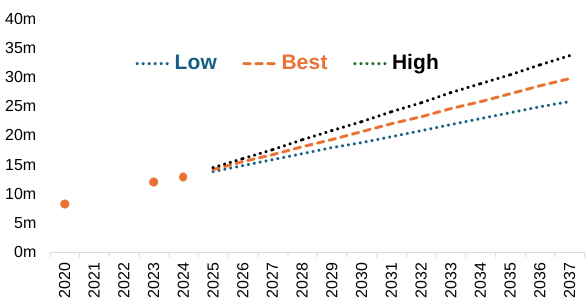
Figure 3.1: Projected number of small deferred pots (those of £1,000 or less) without intervention (millions), 2026
Source: DWP
Figure 3.1 is a line chart showing the projected number of small deferred pots, without intervention, up to 2037. Key findings are described in the accompanying text below.
Based on DWP data gathers in 2020 and 2024, and a call for evidence in 2023, an estimate[footnote 21] of the number of small pots in the market if there were to be no intervention has been made. In 2026 it is estimated there are roughly 16 million small pots. DWP plans to update this estimate periodically by asking providers to share data ahead of the policy implementation, and to work with TPR to receive annual data on this as part of their annual scheme returns.
Metric 2: Number of DC schemes offering (or partnering to offer) decumulation products
Figure 3.2: Schemes offering at least one regular in-scheme decumulation product (% of total, by size of scheme membership), 2025
Source: TPR[footnote 22]
Figure 3.2 is a bar chart showing the proportion of schemes, and members in a scheme that offer at least one regular in-scheme decumulation product. This is broken down by scheme size. Key findings are described in the accompanying text below.
Figure 3.2 draws from TPR’s Occupational DC landscape publication, which from 2026 will be sourced from their mandatory DC scheme returns. It finds 45% of large schemes (with 5000+ members) offer at least one regular in-scheme decumulation product.
Metric 3: The proportion of members in schemes with high investment performance
Figure 3.3: Proportion of active members in top performing Master Trusts / GPPs (in terms of gross investment performance)
Source: Corporate Advisor[footnote 23]
Figure 3.3 is a line chart showing the proportion of active members in one of the three top performing schemes, between 2021 and 2025. Key findings are described in the accompanying text below.
As the DC market consolidates, we expect a higher proportion of members to end up in high performing schemes. The latest data shows that currently 2.3% of active members are in the top 3 performing Master Trusts and GPPs (of those covered by Corporate Advisor data), and increase of 1.4% against 2022. Once in place, DWP will use the VfM data submitted by schemes to monitor this metric, but may use an alternative measure of high investment performance to do so.
Metric 4: The range of investment performance seen between providers
Figure 3.4: Annualised performance for younger savers (5-year annualised returns, highest, lowest and average performer)
Source: Corporate Advisor[footnote 24]
Figure 3.4 is a line chart showing the highest, lowest, and average annualised scheme performance for younger savers between 2018 and 2025. Key findings are described in the accompanying text below.
The Value for Money framework and other policies in the Pension Scheme Act aim to close the gap between the highest and lowest performing DC schemes, by raising the performance of the lowest performing schemes and improve the industry investment average. The latest data shows there was around a 10ppt gap in the 5-year annualised gross returns amongst DC schemes of the lowest and highest performers. Once in place, DWP will use the VfM data submitted by schemes to monitor this metric.
Metric 5: The proportion of DC assets invested in Private Markets and the proportion invested in UK-based assets by DC schemes
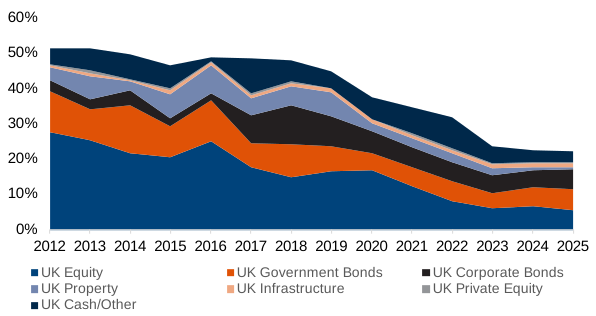
Figure 3.5.1: DC Assets invested in the UK (% of total)
Source: Corporate Advisor[footnote 25]
Figure 3.5.1 is a stacked areas showing proportion of DC assets invested by various means into the UK over time, between 2012 and 2025. Key findings are described in the accompanying text below.
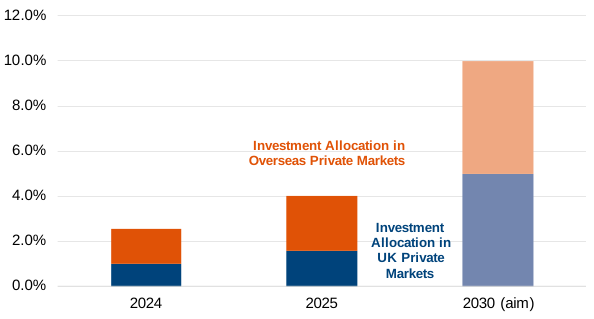
Figure 3.5.2: Investment allocations in private markets (UK and Overseas, % of total investment)
Source: Corporate Advisor[footnote 26]
Figure 3.5.2 is a bar chart showing the proportion of DC assets invested in private markets for 2024, 2025, and the aim for 2030. Key findings are described in the accompanying text below.
Data from Corporate Advisor’s annual Master Trusts and GPP Default Report suggests investment in the UK (as a % of total DC assets) is currently at 22%, declining against preceding years. Investment in UK and Overseas private markets is currently at around 4%. The Act, supported by industry initiatives such as the Mansion House Accord, is expected to increase this private market allocation to around 10%. Once in place, DWP will use the VfM data submitted by schemes to monitor this metric.
Metric 6: The number of large multi-employer DC schemes that are of £25bn scale (DC Megafunds)
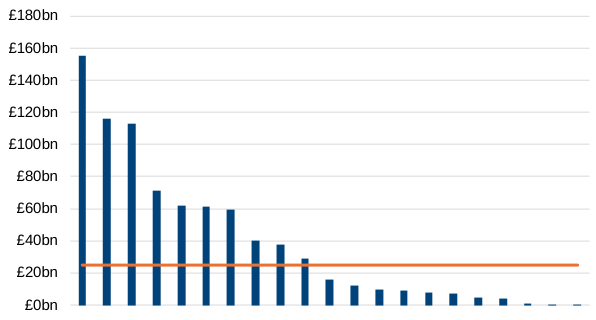
Figure 3.6: Master Trusts Assets Under Management (£bn).
Source: Corporate Advisor[footnote 27], GoPensions[footnote 28]
Figure 3.6 is a bar chart showing the number of Master trusts exceeding the £25bn assets under management threshold. Key findings are described in the accompanying text below.
Data from Corporate Advisor and GoPensions indicates 10 schemes are currently surpassing the £25bn threshold laid out as part of the Act. This data reflects provider level AUM, the threshold applies at arrangement level and so the chart should be treated as indicative. By 2035 DWP estimates this will reach around 15-20 schemes. Once in place, DWP expects to use data collected as part of TPR and FCA regulation of the DC Megafunds policy to monitor this.
Metric 7: The number of default arrangements across DC schemes
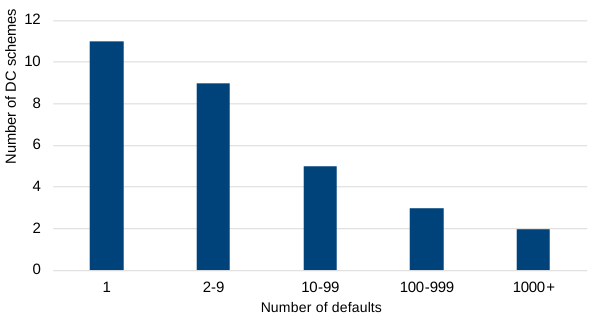
Figure 3.7: Number of defaults held by a provider (Number of providers), 2024
Source: PIR Consultation responses, FCA Survey data
Figure 3.7 is a bar chart showing the number providers holding 1, 2-9, 10-99, 100-999, and more than 1000 defaults. Key findings are described in the accompanying text below.
Once the Act is implemented, it is expected the number of default arrangements to decline. Currently 20 of the 30 observed schemes hold less than 10 defaults, with 11 holding only one. This data was collected as part of consultation responses to the Pension Investment Review[footnote 29] and an FCA survey as part of their 2024 VFM consultation cost benefit analysis[footnote 30] and therefore does not capture the whole market. Once in place, data from TPR and FCA is expected to monitor this information.
Metric 8: The number of authorised DB superfunds
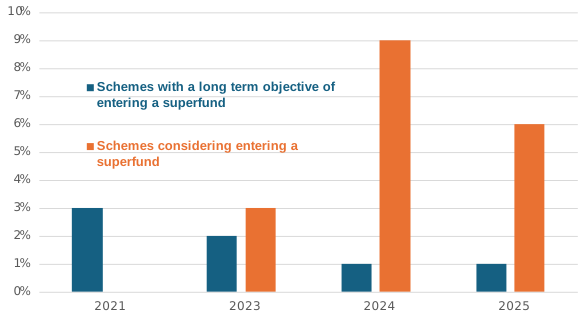
Figure 3.8: Scheme interest in Superfund Entry (% of total surveyed)
Source: TPR[footnote 31]
Figure 3.8 is a bar chart showing the proportion of schemes either with a long term objective to enter a superfund, or considering entering a superfund for each year between 2021 and 2025. Key findings are described in the accompanying text below.
Figure 3.8 summarises the responses from the 2025 TPR Defined Benefit Scheme Survey, which found 6% of schemes were considering entering a superfund and 1% had entering a Superfund as a Long-Term Objective. Once in place, DWP will use TPR DB Superfunds authorisation data to monitor this metric and ongoing DB Scheme Survey’s on Long-Term Objectives.
Metric 9: The number of DB schemes extracting their DB surplus and the value of asset surplus being released
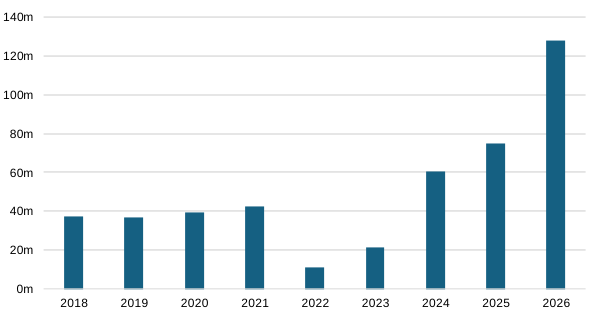
Figure 3.9: Total Value of Surplus Payments (£m)
Source: HMRC
Figure 3.9 is a bar chart showing the total value of surplus payments made each year between 2018 and 2026. Key findings are described in the accompanying text below.
The most recent data (2026 Q1) estimated £32m of surplus payments. A full year 2026 projection has been made based on assuming this level of extraction was continued for the remaining 3 quarters. DWP will continue to use this HMRC Surplus quarterly extraction data monitor this metric alongside information received by TPR from schemes.
Metrics 10-12: Scheme Readiness for the Bill
Metrics 10-12 specifically focus on if:
-
Schemes are aware of and understand the reforms
-
Schemes have started to put plans in place to be ready for implementation
-
Schemes feel they will be ready for when the reforms come in
While DWP is exploring ways to formally measure these metrics, there are already some indicators of industry readiness available, such as TPR’s DC trust-based pension schemes research[footnote 32], which found that 26% of all surveyed schemes were aware of the proposed duty to provide a default decumulation solution. DWP will continue to engage with TPR, FCA, and the industry itself to develop these plans, using future research to ensure that schemes are ready for the reforms.
3.3 Policy specific evaluation questions (EQs)
Under each key policy, there are evaluation questions which set out the key areas and research questions planned to examine the policy success in more detail as part of the monitoring and evaluation strategy. The questions are not intended to be final nor exhaustive but will continue to be refined as the policy detail is developed. They are presented at a high-level to be transparent, and capture the latest thinking on key indicators of success across the policy areas to guide future research plans and data requirements.
As mentioned elsewhere, this focusses on the policies in the Pension Schemes Act for which Impact Assessments were produced[footnote 33]. However, there is strong crossover with other policies introduced by the Act. For example, EQ2 below also covers evidence questions that are relevant for the asset allocation reserve power. The Department will be closely monitoring investments with the expectation the percentage of DC assets invested in private markets and UK based assets increases in line with Mansion House targets. Similarly, EQ9.3 has a strong link with the Contractual Override policy and with the Fragmentation review.
3.4 Value for Money (VFM)
The below sets out key evaluation questions developed for the Value for Money policy.
EQ1: Are members seeing improved investment designs and improved service at a competitive cost?
EQ1.1. Are a higher proportion of members in schemes with high investment performance? (Headline Metric).
EQ1.2. Has the range in net investment returns reduced as underperforming schemes will improve or exit the market? (Headline Metric).
EQ1.3. Are schemes offering better service to their members at a competitive cost?
EQ1.4. What is the impact of the schemes’ lifestyling glidepath?
EQ2: Is there are a trend towards a wider range of asset classes being invested in for diversification and risk adjusted investment performance?
EQ2.1. Has the percentage of DC assets invested in private markets and UK based assets increased in line with Mansion House targets? (Headline Metric).
EQ2.2. Are schemes allocating assets to a wider range of asset classes for diversification and risk adjusted investment performance?
EQ2.3. Are net returns well balanced against the risk profile and risk strategy of the fund?
EQ2.4. Are a greater number of providers bringing more of their investment in-house?
EQ3: Are workplace pension savers in underperforming defaults for a sustained period of time?
EQ3.1. Are clearly/persistently underperforming arrangements flagged effectively by the VFM framework and either removed from the market or supported to improve?
EQ3.2. Has the switch rate by employers increased since the implementation of the VfM framework?
EQ3.3. How aware are employers of the performance of the scheme their employees are in, particularly where underperforming?
3.5 Small Pots
The below sets out key evaluation questions developed for the Small Pots policy.
EQ4: Are there fewer small deferred pots and lost pension pots, with members holding fewer pots but of higher value?
EQ4.1. To what extent has the number of small deferred DC pension pots in the market reduced? (Headline Metric).
EQ4.2. Has the overall number of pension pots per member reduced, with members holding fewer pots of higher value?
EQ4.3. Has the number of lost pension pots decreased?
EQ5:Are Default Consolidator schemes operating in the pensions market, and what impact has this had on DC schemes and the market?
EQ5.1. How many schemes have expressed a strong interest in becoming a consolidator?
EQ5.2. How many Default Consolidator schemes are operating in the pensions market?
EQ5.4. Has data matching improved, enabling smoother and more accurate matching of member data across schemes for pot transfers?
EQ5.5. Have data transfer costs reduced?
EQ6: Has the consolidation of small pots had a positive impact for members?
EQ6.1. Do members understand the reforms?
EQ6.2. What proportion of members have opted out from small deferred pot consolidation?
EQ6.3. Have average member outcomes and investment performance improved, particularly for members who previously held multiple small deferred pots?
EQ6.4. Have member charges reduced as a result of consolidation and scale?
3.6 Guided Retirement
The below sets out key evaluation questions developed for the Guided Retirement policy.
EQ7: Are DC pension schemes offering appropriate default pensions?
EQ7.1. How many DC schemes offer (or partner to offer) decumulation products (Headline Metric)?
EQ7.2. Are pension schemes offering appropriate retirement income pathways at the point members retire?
EQ7.3. Is Guided Retirement leading to changes in asset allocations in the run-up to and during retirement?
EQ7.4. How many default pensions are being offered by schemes? Are any groups being excluded from Guided Retirement?
EQ7.5. How many schemes are offering retirement CDC as their Guided Retirement default?
EQ8: What impact is Guided Retirement having on member outcomes?
EQ8.1. What proportion of members are defaulted into Guided Retirement products? How many are opting out?
EQ8.2. Are members protected against longevity risk following the introduction of Guided Retirement?
EQ8.3. Do default decumulation products deliver good value and outcomes for members including against investment performance and the investment strategy glidepath?
EQ8.4. Are charges in decumulation appropriate and proportionate?
EQ8.5. Is the threshold used to allocate individuals into defaults that include longevity protection delivering value for money?
3.7 DC Megafunds
The below sets out key evaluation questions developed for the DC Megafunds policy.
EQ9: What has the impact of the DC Megafunds policy been on the size and shape of the DC market?
EQ9.1. Has there been an increase in the number of large multi-employer DC schemes that are of scale (£25bn)? (Headline Metric).
EQ9.2. Has the percentage of DC assets invested in private markets and UK based assets increased in line with Mansion House Accord targets?
EQ9.3. Is there less fragmentation in the market, as the number of default arrangements has reduced?
EQ9.4. Are new schemes, or those with a credible plan to reach scale, being successful in joining the DC market?
EQ9.5. Is the DC market still seeing innovation and competition?
EQ10: How has the DC Megafunds policy impacted scheme performance?
EQ10.1 Have net investment returns increased across schemes?
EQ10.2. Are schemes benefiting from economies of scale? Is this resulting in lower costs to members?
EQ10.3. Are schemes allocating assets to a wider range of asset classes, such as investing directly in private market assets?
EQ10.4. Are an increased number of schemes bringing investment in-house, rather than commissioning out?
EQ10.5. Have governance standards improved due to there being fewer larger schemes in the market?
3.8 DB Superfunds
The below sets out key evaluation questions developed for the DB superfunds policy.
EQ11: How is the market for DB superfunds emerging?
EQ11.1. How many Authorised DB superfunds are there in the market? Is it increasing over time?
EQ11.2. How many schemes, members, and assets are entering DB superfunds?
EQ11.3. How many schemes have a Long-Term Objective to enter a DB superfund?
EQ11.4. What is the balance in the market between DB superfunds and insurance buy-out?
EQ12: How has DB Superfunds impacted member security and levels of risk across the DB landscape?
EQ12.1. Are members more likely to receive their benefits in full in a DB superfund compared to schemes which do not enter a DB superfund?
EQ12.2. How do asset allocations differ between DB superfunds and DB schemes?
EQ12.3. Are different models of DB superfunds more effective than others?
3.9 DB Surplus
The below sets out key evaluation questions developed for the DB Surplus policy.
EQ13: To what extent are surplus flexibilities being taken up?
EQ13.1. How many schemes are running on/amending scheme rules as a result of surplus flexibilities?
EQ13.2. How many schemes are extracting surplus? What is the amount of surplus being released and is this increasing over time?
EQ13.3. How is surplus being used and what is the balance of sharing between employers and savers?
EQ14: How is surplus extraction impacting scheme funding and levels of risk across the DB landscape?
EQ14.1. How are scheme funding levels developing and what is the impact on surplus extraction on scheme funding across schemes?
EQ14.2. How has surplus changed DB scheme’s long-term objectives?
EQ14.3. How has surplus extraction influenced asset allocation amongst schemes? Has the level of investment risk increased?
4. Sources of information
In order to monitor and evaluate the Act, a range of information across different Departments and Regulators will be drawn on and developed. These include a wide range of existing sources alongside data which will emerge from policies within the Act. For example, Value for Money requires providers to provide historical data of their pension scheme, and this data will help assess the performance across the market by provider. Details of current plans for collection of this data are discussed below.
4.1 Summary of preferred data sources for metrics
Currently, plans are at different stages for the various sources of data that are intended to be used as part of the monitoring and evaluation plans:
Established data sources
There are a number of key sources which will form a critical part of monitoring and evaluation. These include:
-
Corporate Adviser’s Master Trust and GPP Defaults report which analyses investment returns, asset allocations, and size of schemes on an annual basis
-
The Pension Regulator’s DB/DC Scheme Returns which provides scheme level data on membership, assets, governance, and investment arrangements
-
The Pension Regulator’s Trustee survey gives an annual estimate of DB schemes’ intention to join a DB superfund. DWP will work with TPR to consider whether use of this survey or another data source is the most appropriate for further questions on DB and DC schemes
-
GoPensions Master Trust league table compares multiple Master Trusts by assets and membership size
-
HMRC Surplus extraction data, which is shared quarterly and provides the total value of surplus extracted by DB schemes. This will be supported by information shared with DB schemes to TPR when surplus is extracted
-
PPF’s Purple Book outlining the DB Landscape with the number of members, assets, and liabilities
Sources under development
Value for Money Returns will be part of the new requirements for schemes as part of the act, and will inform some of our key metrics, such as scheme investment performance, scheme sizes, and investment allocations. These will become annual returns from 2028, allowing regular comparisons. In the interim, existing sources alongside the FCA/TPR asset allocation surveys will support 2026 and 2027 monitoring.
DWP Consultations are planned to be sent out for the different policies at various points over the next few years. DWP plans to use these as an opportunity to gather data from the industry, where gaps have been identified. This will remain proportionate and insights shared to support industry preparation.
Superfund and Small Pot Consolidator regulatory data will be collected by TPR and FCA as part of the implementation and operation of the superfunds and small pots policy. This will be collected on an ongoing basis and reported annually. This will also include the number of transfers taking place in terms of Small Pots being consolidated each year and number of members/assets held in Superfunds.
Default decumulation product take-up will be a key part of new data to understand how guided retirement is working. DWP are working with TPR and FCA to further develop DC scheme data collection. This is expected to include:
-
How many DC memberships are accessing their workplace DC pension each year
-
How many DC memberships have entered their providers guided retirement default pension and the available pension types available per provider
-
The number of pots being accessed through different decumulation pensions, such as drawdown and annuity, each year
-
The average and total pension values being accessed by pension type
New data sources
The significance of the reform across a £2 trillion[footnote 34] industry requires a strong monitoring and evaluation approach, with the appropriate data being gathered. However, all organisations are mindful of the impact of data asks on industry. Therefore, collectively, DWP, TPR and FCA will work together on minimising the additional burden placed on businesses and be proportionate in the asks and using existing sources/returns wherever possible. Nevertheless, gaps remain which are important to fill. This includes:
-
The provision of an annual lists of schemes, whether they are DC ‘Megafunds’ and estimates of total scheme AUM, AUM in the largest default arrangement and the number of default arrangements
-
Industry engagement and surveys to provide a better understanding of how ready and prepared the industry is for the various aspects of the reforms. Between 2026 and 2030 to report on an annual basis using DC/DB scheme surveys on the understanding, awareness, and readiness for reforms. This will include:
-
Questions on how many schemes have already planned or introduced the reform
-
Any current challenges faced ahead of the reforms coming in
-
How well the reforms have been understood and delivered
-
Qualitative and Quantitative research with members and employers to understand awareness, views, and attitudes towards a number of reforms both pre and post implementation
-
While this list reflects our current plans, DWP may need to collect additional data to support monitoring and evaluation of the Act. Where possible, DWP will seek to minimise the additional burden placed on businesses in doing so, and will seek to collaborate across organisations to minimise asks and use existing data sources where possible. The Department will also regularly report back in the most appropriate way to update on progress, including directly with industry via provider forums and other channels.
5. References
Corporate Adviser. (2026). Master Trust and GPP Defaults Report on the Corporate Adviser Website
DWP. (2026a). Pensions Scheme Act press release
DWP (2026). Workplace Pensions an updated Roadmap
DWP. (2025). Workplace pension participation and saving trends statistics
DWP. (2024). Pension fund investment and the UK economy
FCA. (2025). Financial Lives 2024 survey selected findings on the FCA website
FCA. (2024). Consultation Paper: The Value for Money Framework on the FCA website
GoPensions. (2026). DC Master Trust League Table 2026 ~ H1 on the Go Group Website
HMT, DWP, MHCLG. (2025). Pensions Investment Review: Final Report and consultation responses
Legislation.gov. (2026). Pension Schemes Act 2026
PMO. (2024). The King’s Speech 2024: background briefing notes
RPC. (2025). Pension Schemes Bill IA: RPC Opinion (green-rated)
TPR. (2026a). Occupational defined contribution landscape in the UK 2025 on Pension Regulator
TPR. (2026b). Decumulation products within DC occupational pension schemes: 2025 DC scheme return analysis on Pension Regulator
TPR. (2025a). Estimated DB scheme universe funding splits and assets under management on Pension Regulator
TPR. (2025b). Defined benefit trust-based pension schemes research on Pension Regulator
UK Parliament. (2024-2026). Pension Schemes Act 2026 on the Parliament website
-
Other departments are responsible for some of the other measures within the Act, and are therefore not covered in this strategy. ↩
-
DWP. (2026b). Pension Schemes Bill Impact Assessment. ↩
-
DWP. (2026b). Pension Schemes Bill Impact Assessment. ↩
-
DWP. (2024). Pension fund investment and the UK economy. ↩
-
DWP. (2026a). Pensions Scheme Act press release. ↩
-
DWP. (2025). Workplace pension participation and saving trends statistics. ↩
-
FCA. (2025). Financial Lives 2024 survey selected findings. ↩
-
TPR. (2026a). Occupational defined contribution landscape in the UK 2025. ↩
-
DWP. (2024). Pension fund investment and the UK economy. ↩
-
Literature review of the evidence at: DWP. (2024). Pension fund investment and the UK economy. ↩
-
TPR. (2025a). Estimated DB scheme universe funding splits and assets under management. ↩
-
PMO. (2024). The King’s Speech. ↩
-
UK Parliament. (2024-2026). Pension Schemes Act 2026. ↩
-
DWP. (2026a). Pensions Scheme Act press release. ↩
-
DWP. (2026b). Pension Schemes Bill Impact Assessment. ↩
-
Legislation.gov. (2026). Pension Schemes Act 2026. ↩
-
DWP. (2026). Workplace Pensions an updated Roadmap ↩
-
DWP. (2026b). Pension Schemes Bill Impact Assessment. ↩
-
DWP. (2026b). Pension Schemes Bill Impact Assessment. ↩
-
RPC. (2025). Pension Schemes Bill IA: RPC Opinion (green-rated). ↩
-
Methodology can be found from page 179 of the Pension Schemes Bill Impact Assessment ↩
-
TPR. (2026b). Decumulation products within DC occupational pension schemes: 2025 DC scheme return analysis. ↩
-
Corporate Adviser. (2026). Master Trust and GPP Defaults Report. ↩
-
Corporate Adviser. (2026). Master Trust and GPP Defaults Report. ↩
-
Corporate Adviser. (2026). Master Trust and GPP Defaults Report. ↩
-
Corporate Adviser. (2026). Master Trust and GPP Defaults Report. ↩
-
Corporate Adviser. (2026). Master Trust and GPP Defaults Report. ↩
-
GoPensions. (2026). DC Master Trust League Table 2026 - H1. ↩
-
HMT, DWP, MHCLG. (2025). Pensions Investment Review: Final Report and consultation responses. ↩
-
FCA. (2024). Consultation Paper: The Value for Money Framework. ↩
-
TPR. (2025b). Defined benefit trust-based pension schemes research. ↩
-
TPR. (2025c). Defined contribution trust-based pension schemes research. ↩
-
DWP. (2026b). Pension Schemes Bill Impact Assessment. ↩
-
DWP. (2024). Pension fund investment and the UK economy. ↩