Pension fund investment and the UK economy
Updated 27 November 2024

© Crown copyright 2024
This publication is licensed under the terms of the Open Government Licence v3.0 except where otherwise stated. To view this licence, visit nationalarchives.gov.uk/doc/open-government-licence/version/3 or write to the Information Policy Team, The National Archives, Kew, London TW9 4DU, or email: psi@nationalarchives.gov.uk.
Where we have identified any third party copyright information you will need to obtain permission from the copyright holders concerned.
This publication is available at https://www.gov.uk/government/publications/pension-fund-investment-and-the-uk-economy/pension-fund-investment-and-the-uk-economy
Executive Summary
This paper attempts to present the best estimates for, and trends in, UK pension fund investments with comparisons to selected countries. Estimating levels of UK pension fund investment and comparing internationally is challenging due to the availability of data, consistency in definitions, and comparability of different pension systems. As a result, any estimates are highly uncertain and based on a number of assumptions. Key findings include:
- around 20% of workplace Defined Contribution (DC) assets are invested in the UK. This has fallen substantially over the last 10 years, from around 50%, driven primarily by a movement away from UK listed equities (Chapter 1).
- around 30% of public-sector Defined Benefit (DB) (the majority of which is comprised of Local Government Pension Scheme in England and Wales (LGPS)) assets are invested in the UK, mostly through investment in UK listed equities, UK Government Bonds and property (Chapter 1).
- over 60% of private-sector DB assets are invested in the UK. This has remained broadly constant over the last 20 years as a decline in UK listed equity allocations (now just 1% of assets) has mostly been replaced by investment in gilts (Chapter 1).
- home bias towards the UK varies by asset class. Data suggests DC and LGPS private market portfolios are disproportionately weighted towards domestic investments, and this is greater than in some comparator countries (Chapter 2).
- however, in listed equities, this bias is lower compared to countries such as Australia and Canada. UK pensions’ share of equities held domestically is around 8% in DC, 11% in private DB and 17% in LGPS. These are lower than the equity share held domestically in Canada (22%), New Zealand (42%) and Australia (45%) (Chapter 2).
- pension fund investment in domestic markets has the potential to support stronger economic growth and capital market development. This will vary according to the type of asset being invested in and factors such as the extent of investor demand in those markets (Chapter 3).
- diversified pension fund investment may improve member outcomes. Scenarios modelled by the Government Actuary’s Department illustrate how including higher allocations to private markets may deliver improved risk-adjusted returns compared to a largely overseas equity portfolio (Chapter 3).
- there is no consensus on the optimal size of a DC pension fund. However, a growing number of papers suggest a greater number of benefits can arise at £25 billion to £50 billion (or greater) of assets under management (Chapter 4).
Introduction / Overview
1. In relation to achieving the twin objectives of driving better outcomes for members and support to the UK growth agenda, the Chancellor commissioned a Pensions Review in July 2024, requesting the Minister for Pensions to lead Phase 1 (investment). The review aimed to explore the size and shape of the Defined Contribution (DC) pension scheme market and the Local Government Pension Scheme in England and Wales (LGPS) and current trends in relation to the investment approaches taken. The Minister for Pensions has worked closely with the Deputy Prime Minister and Minister of State for Local Government on reviewing the LGPS investment framework. On 14 November 2024, the Chancellor, the Minister for Pensions and the Minister of State for Local Government presented the interim review findings. This analytical publication outlines the emerging evidence and trends on pension fund investment.
2. Workplace pensions are split into two markets:
a. Defined Benefit (DB) – This is a type of pension which pays a retirement income based on earnings, accrual rate, and length of service rather than the amount of money an individual has contributed to the pension. Of which, the market is further split into:
- public sector DB, where the main funded scheme is the Local Government Pension Scheme in England and Wales (LGPS) which is made up of 86 Administering Authorities which operate 87 individual funds in 2023 to 2024.
- private sector DB where there were around 5,000 pension schemes in 2023.
b. Defined Contribution (DC) – This is a type of pension whereby pension contributions are made by employees/employers and are invested to create a pension pot at retirement. The DC market is further split into:
- trust-based market - A pension scheme governed by a board of trustees who have a fiduciary duty towards scheme members. The board of trustees manage investments on the members’ behalf. This is regulated by the Pensions Regulator (TPR). In 2023, there were around 1,100 pension schemes with 12 or more members.
- contract-based market - A pension scheme governed by a provider and an independent governance committee (IGC) where a contract exists between the individual scheme member and the provider. This is regulated by the Financial Conduct Authority (FCA). In 2023, there were estimated to be around 30 firms with an authorised DC workplace pension business.
3. Collectively, these types of workplace pensions account for over £2 trillion in assets and support tens of millions of people. This makes the UK one of the largest pension markets in the world.
4. The terms of reference of Phase one of the Pensions Review specify a focus on DC schemes and the LGPS (England and Wales[footnote 1]). Private sector DB is out of scope. However, it is recognised, with over £1 trillion in assets, these schemes can, and do, play a key role in investing in the UK. Therefore, the trends in private sector DB have been included for comparisons to DC and to explore the evidence on scale and private market investment.
5. This paper explores a number of key themes which are relevant to the Pension Review. These include:
- Chapter 1: Patterns of investment in the UK by pension funds over time and by pension scheme type.
- Chapter 2: Comparisons of other countries’ domestic investment levels compared to that of UK pension funds to provide wider international context.
- Chapter 3: The potential theoretical links between pension fund investment and UK economic growth, presenting a range of existing literature and considered by asset class. This also includes analysis conducted with the Government Actuary’s Department (GAD) to consider the link with returns.
- Chapter 4: The scale of UK pension funds and the associated benefits and challenges of a more consolidated market.
- Chapter 5: How UK pension funds compared in scale to international comparators, and the benefits and challenges of a more consolidated market.
- Chapter 6: Wider evidence and scenario analysis which is being used to support the Pensions Review
- Annexes: Which cover data sources, additional analysis and methodologies.
6. It is important to note that there is no single source of information that perfectly captures the data in this area, particularly on the trend, level or scale of domestic investment across UK workplace pensions over time. Numerous commentators have recently highlighted this challenge in respective papers (linked below). This makes any estimates highly uncertain, challenging, and based on a number of assumptions. This paper attempts to be fully transparent with regard to these uncertainties, how estimates have been derived, and the limitations.
7. Estimates have been validated against a range of other sources, including from New Financial, PPI and the ONS, who have all made significant contributions to the evidence base on the geographical splits of pension assets. Findings have been shared with relevant departments to support the peer-review process, and input from GAD has been sought to help explore the potential impacts on members. While numbers on asset allocation are highly uncertain at the granular level; there is greater overall confidence in the wider trends. Any estimates will continue to be revised in light of better data emerging.
Chapter 1: Trends in investment in the UK by pension funds
8. Chapter 1 explores the trends and patterns of investment in the UK by pension funds over time and how this differs by different pension scheme type.
9. Estimating trends in investment in the UK by pension funds requires a number of assumptions and draws on a number of data sources across different time periods. No one single source of information provides this information. Although there is confidence in the overall trend in UK investment levels by pension funds, the specific estimates and splits by asset class have a greater degree of uncertainty. It is also recognised this will vary significantly across pension providers.
10. Defining the geography of an investment can also be a challenge. Different approaches are taken by different market participants, and this will vary by asset class. For example:
- listed equities may be allocated to geography based on the listing venue (e.g. London Stock Exchange) but the company may operate globally.
- direct investments in assets such as infrastructure could be considered to be located either where the infrastructure is being built or the location of the issuer.
This paper uses data from a number of sources and underlying definitions may vary[footnote 2]. Annex A details each of the data sources and assumptions used throughout this chapter.
Defined Contribution
11. Figure 1 shows the estimated asset allocation of workplace DC in 2023, with around £600 billion assets under management. Most assets (70%) are invested in overseas equities, with a further 6% in UK equities. The workplace DC market has been historically largely invested in listed equities and bonds. However, it has been shown in both UK and international papers that a more diversified portfolio, including investments in private markets (such as Private Equity, Venture Capital and Infrastructure) may deliver stronger member returns on a risk-adjusted basis. It is estimated around 4% (1% private equity and 3% infrastructure) of workplace DC is currently invested in private equity and infrastructure assets.
Figure 1: Private sector workplace DC asset allocation (2023)
| Asset | Percentage |
|---|---|
| Overseas Equities | 70% |
| Corporate Bonds | 8% |
| Other | 7% |
| UK Equities | 6% |
| Government Bonds | 4% |
| Property | 2% |
| Cash | 2% |
Source: DWP analysis based on Corporate Adviser MT/GPP report 2024 data.
12. Figure 2 presents estimated total DC asset allocation over time and shows most DC assets have been invested in equities. Equity exposure has risen in the last 5 years, with corporate bonds typically being the second most common asset class. The rise in equities may reflect strategic decisions to take on a slightly greater level of risk or reflect the strong performance of global equities in recent years.
Figure 2: Estimated Private Sector DC asset allocation over time (2012 to 2023)
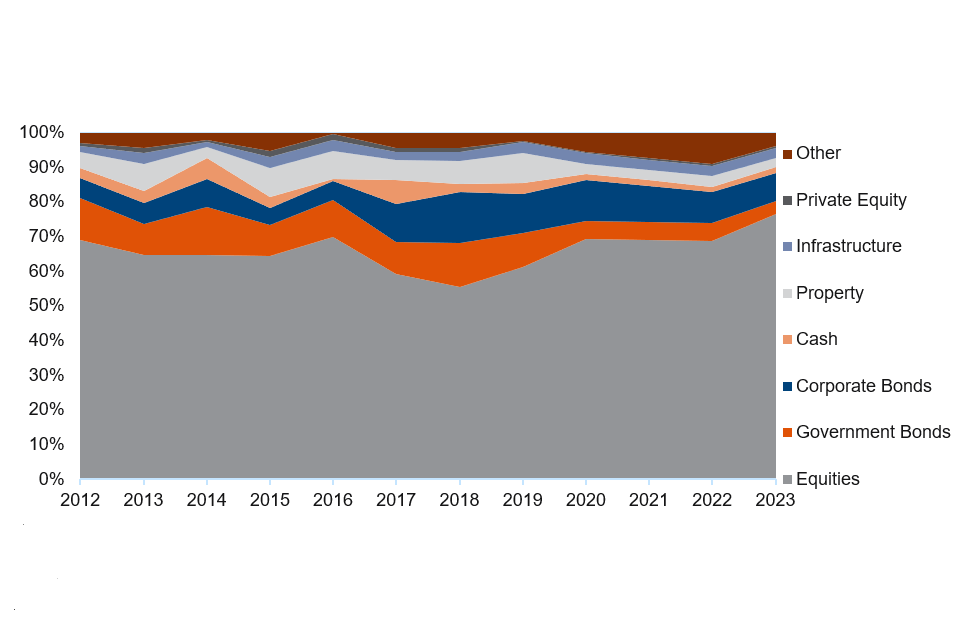
Source: DWP analysis of PLSA, PPI and Corporate Adviser data. See Annex A.
13. To examine trends in domestic investment over time, various sources are drawn upon (outlined in Annex A). These sources highlight an overall trend of decreasing investment in UK assets. Figure 3 shows just over 50% of DC assets were invested domestically in 2012 which has gradually declined to just over 20% by 2023. Much of this decline has been driven by lower allocations to UK listed equities as schemes have pursued global mandates which has become cheaper over time.
14. Other contributing factors to this trend likely include the mechanical effect of comparatively strong investment performance of overseas markets (particularly the USA) and changes to the portfolio aimed at gaining greater exposure to those markets. The decline in domestic DC investment has accelerated in recent years and current domestic allocations appear low internationally (see Chapter 2).
Figure 3: The proportion of private sector DC assets invested in UK assets has fallen over time driven by declining allocations to UK equities
Source: DWP analysis of PLSA, PPI, Corporate and ONS data.
15. Figure 4 presents further context of investment becoming more global (less ‘UK-based’) in certain asset classes over the last decade. It shows the relative proportion of each asset class invested domestically in 2012 (the oldest available data) compared to 2023. This ‘domestic exposure’ has fallen the most for listed equities, down from 40% of investments being UK-based in 2012 to 8% in 2023. Although, property and cash holdings have also become more global, these represent a lower proportion of total DC asset allocations.
16. It is estimated that corporate bonds and private equity[footnote 3] have maintained, or slightly increased, their level of domestic exposure over time with around half of these investments being UK-based. Potential reasons for, and benefits of, high domestic exposures among these asset classes are detailed further in Chapter 3.
Figure 4: Estimated level of DC UK exposure within each asset class over time
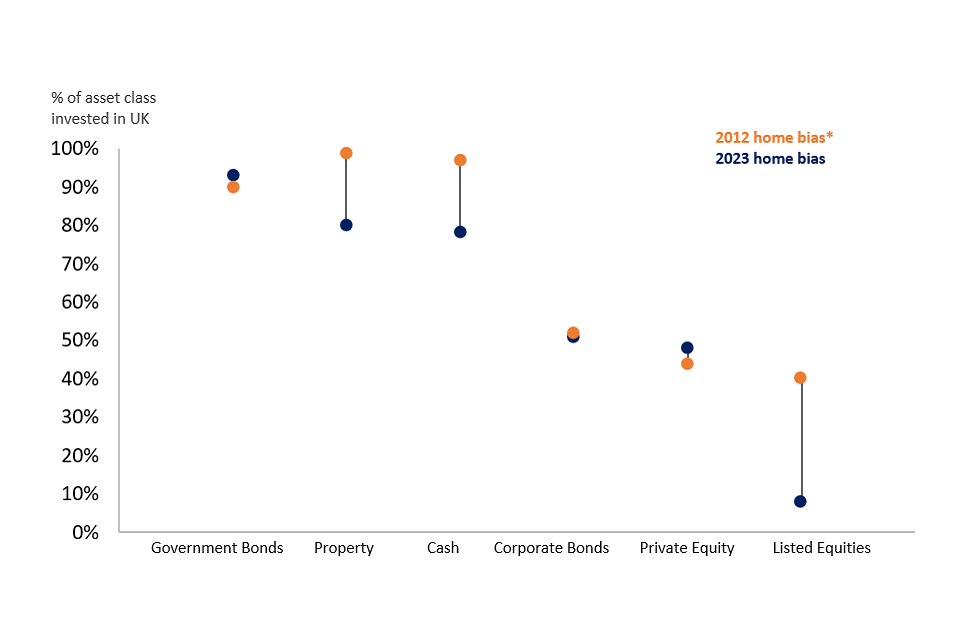
Source: DWP analysis of PLSA, ONS, Corporate Adviser Data. *Private equity oldest data 2019.
Local Government Pension Scheme
17. A recent Ministry for Housing, Communities and Local Government (MHCLG) survey of LGPS assets estimated total assets at £392 billion (also reported at £392bn in the latest MHCLG statistical release), with just under half of this held in pooled assets. It is estimated that around £120 billion (28%) of LGPS assets are invested in UK assets. Table 1 highlights total and UK-based allocations by asset class across LGPS.
Table 1: Total and UK-based asset allocations for LGPS in 2024[footnote 4]
| Asset Class | Total | UK | UK share of asset class |
|---|---|---|---|
| Gilts | 6% | 6% | 100% |
| Corporate Bonds | 11% | 3% | 26% |
| Listed Equity | 50% | 9% | 17% |
| Private Equity | 6% | 1% | 14% |
| Infrastructure | 8% | 3% | 42% |
| Property | 7% | 5% | 82% |
| Private Debt | 4% | 1% | 17% |
| Other | 6% | n/a | n/a |
| Total | 100% | 28% |
18. Despite relatively high UK exposures in some asset classes, Figure 5 (from the LGPS Scheme Advisory Board) outlines that there has nonetheless been a notable shift away from UK equities with some of this divestment re-allocated to global equity mandates. This is broadly consistent with what has been observed across workplace DC. The LGPS has also shown a greater re-allocation towards investment in alternative asset types such as property, infrastructure and private equity/debt.
Figure 5: LGPS trends in UK and global equities as % of total AUM
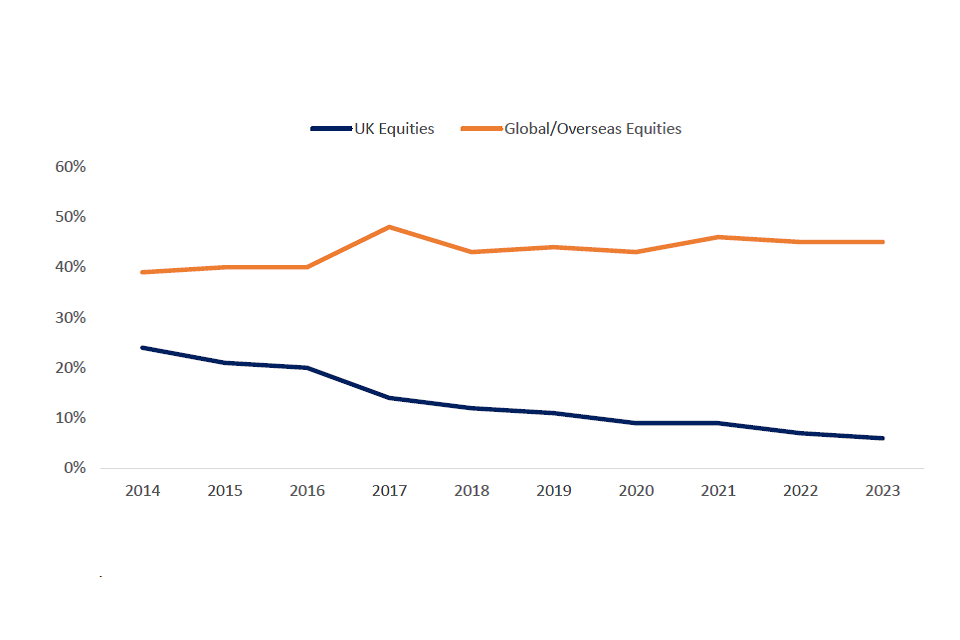
Source: LGPS Scheme Advisory Board
Private Sector Defined Benefit
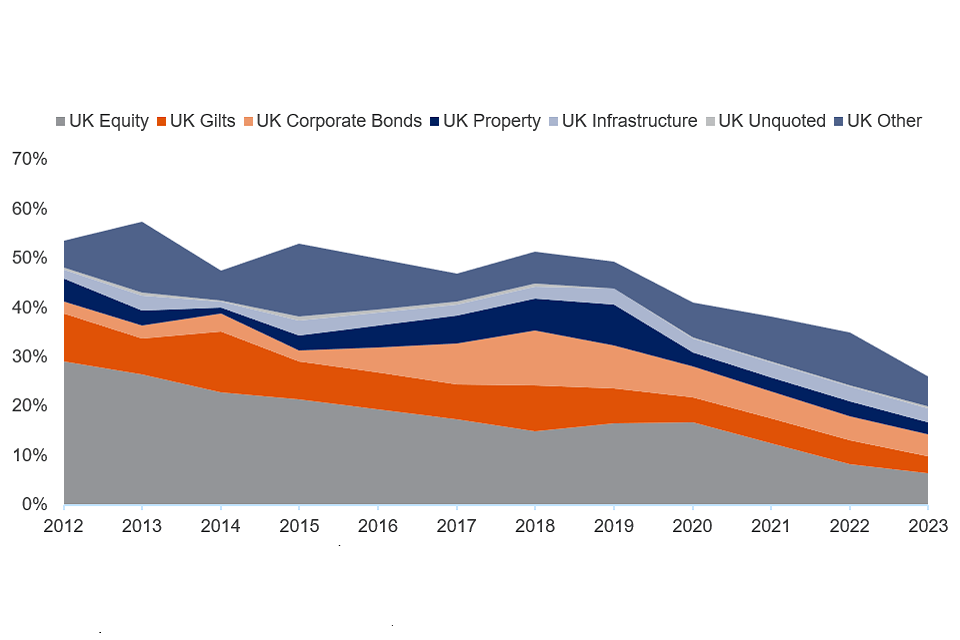
19. Levels of UK investment in private sector DB have remained relatively high over time. However, there has been a notable shift in the type of UK assets held. There has been a large shift away from UK listed equities and into Gilts (see Figure 6). There are several reasons explaining this shift, most notably the maturing of DB schemes which has led to schemes de-risking and looking for assets that provide a regular cash flow to support the payments they need to make.
20. It is estimated around 32% of DB assets were invested in UK equities in 2006, falling to under 2% by 2023. At the same time, allocations to Gilts have risen from 15% in 2006 to 37% in 2023.
21. Consequently, the overall allocation of DB assets being ‘UK-based’ has slightly increased since 2006. ‘Other’ assets include hedge funds and annuities. Allocations to UK-based unquoted equities are low (3%) but rising.
Figure 6: The proportion of private sector DB assets invested in UK assets has remained high but experienced notable compositional shifts
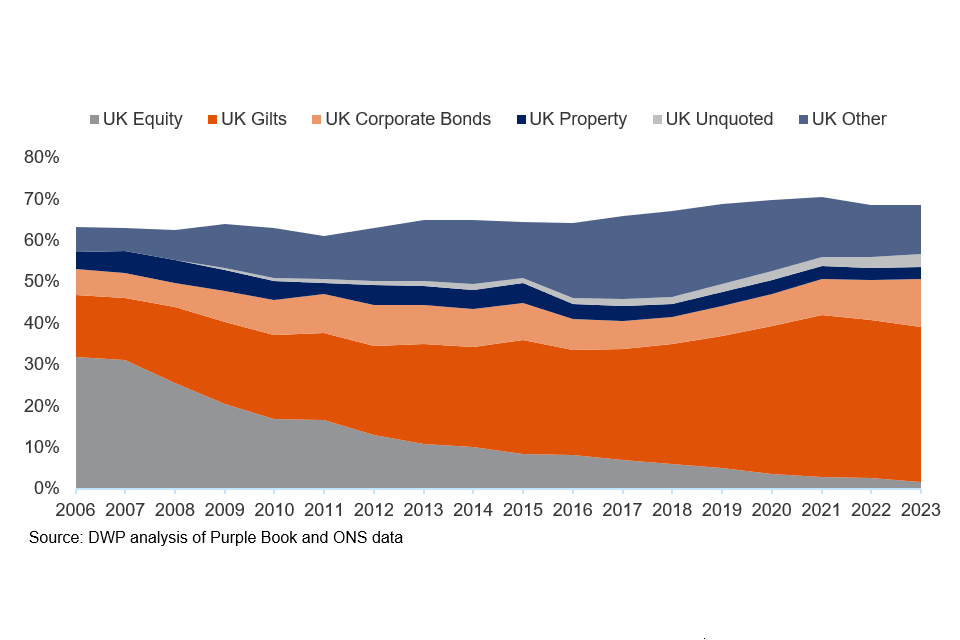
Source: DWP analysis of Purple Book and ONS data
22. There is significant uncertainty in estimating asset allocations over time. Therefore, comparisons were made against a number of other publications, to provide assurance and validation. These broadly find similar trends, giving confidence in overall trends and estimates. For example:
- new Financial estimated DC pension funds allocate around 8% to UK listed equities. This is largely similar to the estimates found in this paper. The report also highlights the significant reduction in allocation towards UK listed equities by pension funds.
- Pensions Policy Institute estimated around 10% of DC assets, including personal pensions, are directly invested in UK business (including equities, corporate bonds and alternatives). This is similar to estimates for these asset classes in this paper, despite the application of differing assumptions, definitions and coverage.
- ONS data on the ownership of UK shares shows a continued decline in pension fund ownership of UK shares after peaking in nominal terms around 1999 with pension funds accounting for around 2% of ownership of UK quoted shares in 2022.
Chapter 2: International comparisons of domestic investment by pension funds
23. Chapter 2 builds on the findings of UK pension fund investment in the UK and compares trends to other countries’ domestic investment levels by pension funds to provide wider international context.
24. While cross-country comparisons of pension investments are challenging given the different sizes of domestic markets, idiosyncrasies in countries’ pension systems, and different cultural contexts, it is an informative exercise in understanding the relative level of domestic investment by UK pension funds. Information has been gathered from multiple data sources, including official statistics from the relevant countries where available, and are detailed in Annex B.
25. Domestic investment in any asset class will depend on the supply of available opportunities and investor demand as well as other factors such as tax and differences in governance structures.
26. Ideally, a large number of countries would be compared against. However, publicly available information and differences in pension systems makes this challenging. Instead, the paper attempts to present a cross-section of countries with available data based on similarities, such as a growing DC market (e.g. Australia), having a similar automatic enrolment system (e.g. New Zealand), large pension fund assets (e.g. Canada) and to ensure coverage across different geographical areas (e.g. Japan).
Total domestic investment levels
27. The UK DC market appears an international outlier in its total level of investment in its domestic markets compared with a selection of other countries[footnote 5]. This paper estimates around 22% of UK workplace DC is invested domestically compared to 44% and 55% in New Zealand’s Kiwisaver and Australia’s Superannuation systems respectively. This is despite each country estimated as having had similar levels of total domestic investment in the recent past.
28. The UK private DB market has a relatively high total level of domestic investment. This market is best compared against other international DB (or reserve fund[footnote 6]) markets such as Canada, Japan and the Netherlands. Around 70% of private sector DB is invested in UK assets, higher than levels seen in Japan (50%), Canada (46%), and the Netherlands (41%). Much of this exposure comes through UK bonds which account for around half of UK private sector DB assets. Other countries’ domestic exposures are lower in total but include higher exposures to assets such as listed and unlisted equities[footnote 7].
29. Figures 7a and 7b show that most countries, across both DC and DB pension systems, have seen declines in their total level of domestic exposure over time. This is likely to have been driven by a number of factors, including the increased ease of diversification, looking to reduce investment costs, and strong overseas returns (driven by US technology companies). This is a finding supported by the Thinking Institute Global Pension Assets Study which has highlighted the significant decline across a range of countries in home bias of equities.
30. However, the relative decline in UK DC domestic exposure looks disproportionate against international comparators. The remainder of this chapter considers this trend by asset class.
Figure 7a: The total domestic allocation of UK DC appears low relative to international comparators and has fallen faster
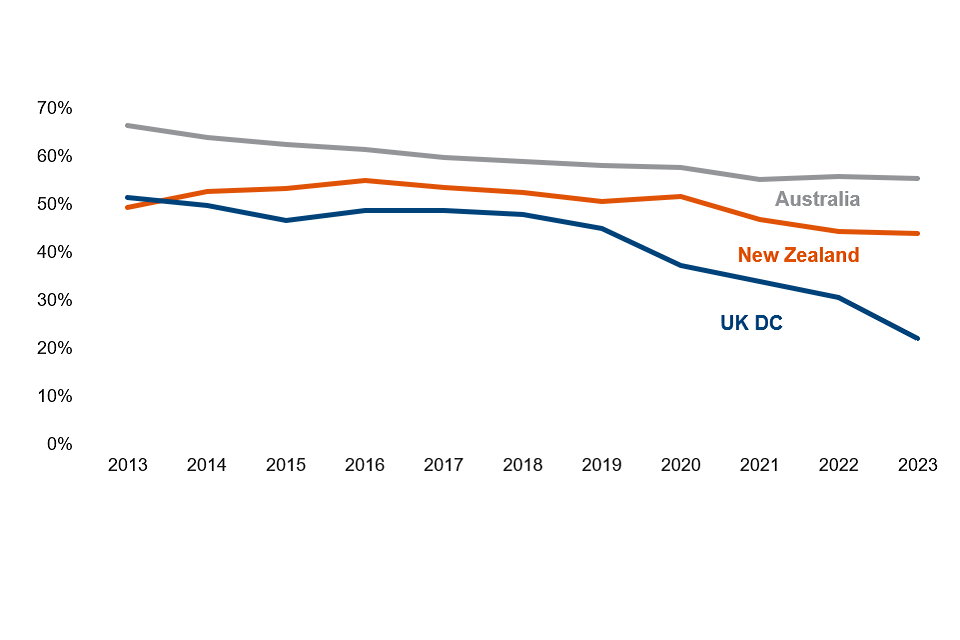
Source: DWP Calculations as figure 3. Australia: APRA Quarterly Superannuation Statistics, New Zealand, RBNZ Kiwisaver Assets
Figure 7b: Total domestic allocation of UK Private Sector DB has remained high relative to international comparators driven by high allocations of Gilts

Source: DWP Calculations as Figure 6. Canada Statistics Canada (definitional change Q42020), Japan, GDIF data Netherlands, de Nederlandsche
Listed Equities
31. The shift towards global investment is most evident in the case of listed equities. Cross-country domestic listed equity comparisons over time are complicated as different markets rise and fall in prominence and countries make use of different incentives to invest domestically. Nonetheless, some overall conclusions can be drawn.
32. As a proportion of total listed equity investments, domestic equity allocations are lower in most peer countries’ pension systems today than they were a decade ago (Figure 8). Both UK DC and private DB started from lower initial domestic levels than peer countries and have fallen by a greater amount. UK listed equity allocations have also fallen further than pure performance differentials would imply (explored further in points 34 and 35). This appears to suggest a disproportionate allocation away from domestic listed equities across UK pensions schemes.
Figure 8: UK DC and private DB have low domestic allocations of listed equities as a proportion of their total listed equity investments
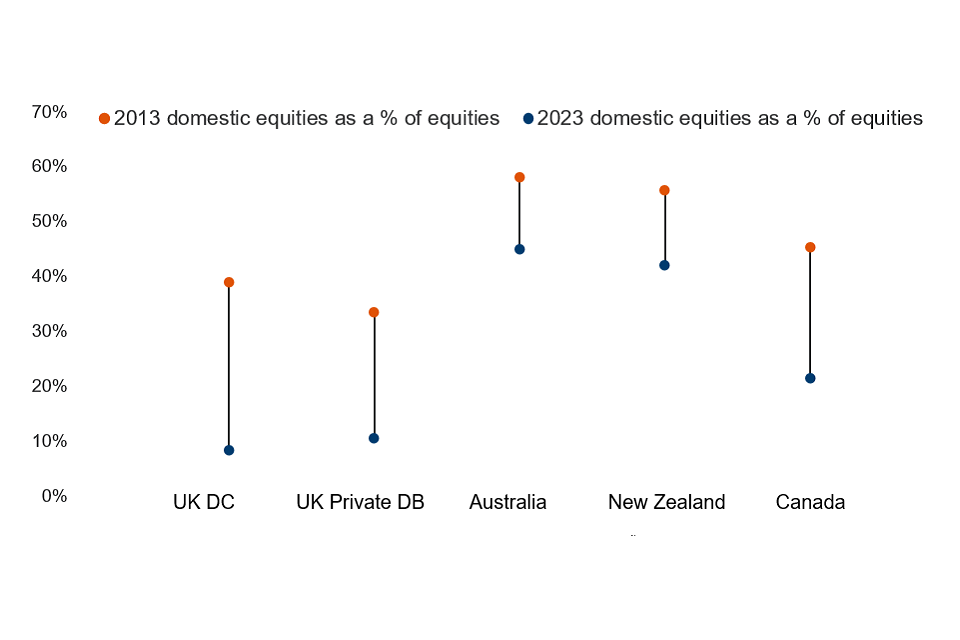
Source: DWP Calculations. UK, ONS, Corporate Adviser and Purple Book data, Australia, APRA quarterly superannuation statistics. New Zealand, RBNZ Kiwisaver assets, Canada, Statistics Canada
33. There are a number of reasons why a home bias may be preferable for investors. One report identified 6 reasons why having a greater home bias in equities may arise from investors. These included:
a. Hedging domestic risk as domestic stocks may provide a natural hedge against risks such as inflation and exchange rates.
b. Costs and barriers for foreign investment such as trading costs and formal barriers or legislative restrictions.
c. Information asymmetries as domestic investors may have better and more accurate information on domestic assets.
d. Familiarity stemming from trade with countries you are close to.
e. Governance and transparency as poor transparency will make information more costly and less reliable to obtain.
f. Behavioural biases may lead to individuals having greater confidence in domestic markets or patriotism in investment.
34. The report found strong empirical evidence in the cases of information asymmetry and local knowledge, corporate governance benefits and behavioural biases. These factors may principally explain why some countries have a degree of home bias in their investments although importantly, as outlined paragraph 30, other countries have different financial and fiscal structures that may impact domestic investment levels overall and in certain asset classes.
35. It is also recognised that ‘too much’ home bias may bring concentration risks or mean the portfolio is highly correlated with wider domestic macroeconomic trends, especially in downturns. Therefore, pension funds will most likely seek a balance between domestic and global investment levels.
36. According to the MSCI World Index (used as a proxy for a geographically neutral portfolio) the UK accounts for around 4% of a balanced global equity portfolio. Any allocation by UK pension schemes above this 4% level could be termed ‘home bias’ i.e. the level of investment in one’s home market over and above that implied by a balanced index of global equities.
37. As UK pension funds have a greater allocation than 4% of listed equities, there is some degree of home bias in their listed equity investments (this ranges from 2x in the UK DC Market to 4x in LGPS the level the MSCI World Index would imply). However, Table 2 shows that this bias is much lower than that found in comparator countries, with the important caveat that the respective market size in each country may influence home bias calculations and comparisons as the denominator changes. The US is the only peer country with similar levels to the UK; but this is largely because the US is such a large component of the index making it difficult to display high levels of home bias.
Table 2: UK pensions exhibit some degree of home bias in listed equities, but this is lower than that seen in some other countries
| Country | MSCI Weighting | Domestic equity allocation as a % of total equities | ‘Home Bias’ estimate |
|---|---|---|---|
| New Zealand | <1% | 42% | >42x |
| Australia | 2% | 45% | 23x |
| Canada | 3% | 22% | 7x |
| UK LGPS | 4% | 17% | 4x |
| UK Private DB | 4% | 11% | 3x |
| UK Private DC | 4% | 8% | 2x |
| US | 63% | 82% | 1x |
38. MSCI weightings have changed over time as different markets have risen and fallen in prominence and delivered different levels of return. The UK’s share has fallen from around 8% in 2010 to under 4% today, largely due to the rise of the US market which has risen from 45% to 62% over the same period. This may explain part of the decline in domestic equity allocations (as a lower MSCI weighting and relative underperformance would mechanically reduce UK allocations), though the UK’s decline in listed equity allocations is much greater than its decline in the MSCI World Index.
39. Australia’s weight in the MSCI index has roughly halved since 2010 while Figure 8 shows that its listed equity allocations have declined by less than this. Canada’s decline in listed equity bias has only slightly exceeded its decline in its MSCI index weighting. These trends differ from that seen in UK pensions whose domestic listed equity allocations have declined by a greater amount than its index weight.
40. The reasons for the decline in the UK’s global weighting and investment allocations may be explained by a wide range of factors. This includes continued diversification, changing demographics (particularly in the private DB market) and differences in global returns; for example it is well-documented that US shares have outperformed UK shares over the 2010s and 2020s especially (Table 3). Many commentators have noted these, and other factors, in relation to declining investment in UK assets and note this risks feeding a downward spiral in domestic investment levels.
Table 3: Annualised total returns of UK, World and US market indices (local currency with dividends reinvested)
| Market | 1980s | 1990s | 2000s | 2010s | 2020s |
|---|---|---|---|---|---|
| FTSE 100 (UK) | 19.7% | 15.7% | 1.9% | 5.5% | 4.2% |
| MSCI World | 19.4% | 11.0% | -0.3% | 10.5% | 9.9% |
| S&P 500 (US) | 17.7% | 18.2% | 0.4% | 14.0% | 12.1% |
41. Defined Contribution pension pots are heavily influenced by investment returns. Figure 9 uses 5-year annualised average industry data for younger savers, showing a weak negative correlation between providers with higher UK equity growth phase allocations (as a % of total equities) and the returns these providers have reported. However, it should be noted other factors beyond geographic allocation may have contributed to these achieved returns, such as allocations to other non-equity asset classes and within asset class selection. Chapter 3 further considers member outcomes by presenting a series of scenarios to outline how different asset allocations might be expected to impact saver outcomes.
Figure 9: As a proportion of total equities, providers with higher UK equity allocations have seen lower annualised returns for younger savers over the last 5 years
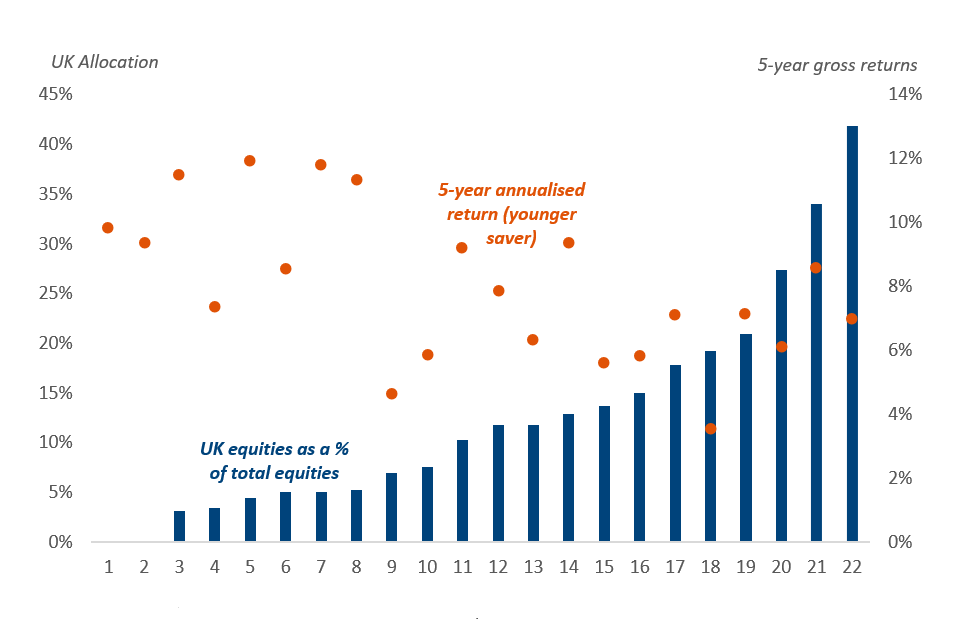
Source: DWP analysis of Corporate Adviser 2023 MT and GPP report (asset allocations) and Q22024 returns
Private markets
42. Although the home bias in listed equities has been falling and appears low internationally, there are significant differences in the level of home bias depending on the type of asset class. This most likely links to available information on the opportunities for investment and the suitability of some asset classes to act as natural hedges for natural domestic exposures like inflation (see paragraph 31).
43. Available data on alternative asset classes split by geography is a challenge. UK pension schemes currently have relatively low allocations to private markets, including Private Equity, Venture Capital, and unlisted infrastructure and property (for example, Canada invests 11% in infrastructure and Australia has 5% in private equity compared to UK DC which is estimated to have 3% and 0.5% allocations to infrastructure and private equity assets). However, private market allocations are rising for several reasons such as increasing scale, the strategic decisions by some funds to invest in new asset classes, and as more investable opportunities arise. Where private investments are made by DC and the LGPS, the limited information points towards the UK having comparable levels of home bias in these alternative asset classes. As detailed in Chapter 3, these asset types may have strong, direct links to economic growth. It is estimated around 45% of UK pension fund investment in private equity is UK-based. This appears an average level, internationally, given other countries’ private market biases:
- New Zealand; whose unlisted domestic equity exposure is 87% ‘New Zealand-based’
- Australia; whose unlisted domestic infrastructure exposure is 54% ‘Australia-based’
- Netherlands; whose unquoted domestic shares is 25% ‘Netherlands-based’
- Canada; whose domestic infrastructure is 22% and property is 44% ‘Canada-based’.
44. High domestic biases within UK private market mandates are also seen in large schemes such as USS (a DB scheme) and NEST (a DC scheme). who each allocate almost half of private investments to UK-based assets including airports and renewable energy, and infrastructure projects and lending to growing UK businesses. Legal & General (a DC scheme) have also recently launched a private markets fund with the ability to invest up to 40% in UK private assets.
45. Data therefore suggests private market portfolios are often disproportionately weighted towards the domestic economy compared to, for example, listed equities. As outlined in Chapter 4, as the DC market and LGPS continue to develop scale, this should enable greater investment in private markets. Based on current trends, this should feed through to greater levels of domestic investment compared to current levels given the natural home biases of such assets. However, as outlined in paragraph 50, the full extent of this will depend on the extent to which any new private market investment displaces existing investment in other UK assets (e.g. UK equities, bonds).
46. A key lesson from a recent report on Canadian home investment was the need for a ready supply of investable opportunities for domestic investors and that this may help increase investor demand by crowding in overseas institutional investment:
government initiatives that reduce the barriers to domestic investing by facilitating access to strategic asset classes will not only retain and attract capital from Canadian pension funds but also bring in additional capital from the much larger pool of foreign investors.
47. In the UK, future supply of investable opportunities may arise through a number of supply-side initiatives. These include the National Wealth Fund, supporting investment into clean energy and growth industries, and British Business Bank programmes to support investment into innovative companies, via the British Growth Partnership and the Long-Term Investment for Technology and Science initiative (“LIFTS”).
Chapter 3: Links between domestic investment and UK economic growth
48. Chapter 3 outlines the potential for private assets to deliver both saver and macroeconomic benefits. As previously outlined, a diversified asset allocation may deliver better risk-adjusted returns to members. In addition, pension fund investment in the UK economy has several theoretical links to real macroeconomic outcomes which could support members through a strong and growing UK economy (for example, through creation of jobs and higher wage growth).
49. The macroeconomic benefits may relate to capital market deepening, start-up risk finance, improved governance, and investment in other asset types. For example:
a. Capital market deepening: Pension fund investment in capital markets has the potential to make markets deeper, more liquid, and less volatile. This can lead to increasing market capitalisations leading to higher volume and improved valuations (for example, as explained in this paper). This can create a positive feedback loop. Deeper, more liquid public markets may also have reciprocal, positive spillover effects to private markets by providing a domestic ‘exit channel’ for private firms onto the domestic listed market. This allows capital markets to function and allocate capital more efficiently, leading to increased Initial Public Offering (IPO) activity and lower costs of capital, encouraging business investment. Significant domestic investment by pension funds may also boost market confidence in the domestic corporate sector, boosting UK investment from other entities. Pension funds’ long-term investment horizons can also help to increase market liquidity and reduce volatility through potential countercyclical effects (e.g. buying when others are selling), predictable liquidity needs and relatively low leverage.
b. Start-up risk finance: Pension fund investment can address gaps in funding for start-up and early scale-up businesses, boosting innovation and encouraging business investment, especially in high-growth companies. The additional capital provided by pension funds may develop regional business ‘ecosystems’ resulting in spillovers and agglomeration effects for local economies. Although there has been government intervention to address the issue, domestic risk capital for unlisted start-up companies in the UK remains a challenge[footnote 8], particularly at later stage funding rounds. This creates an ‘equity gap’ in the UK economy due to a mismatch in the supply of and demand for financing. Pension funds with long-term horizons and sufficient scale and expertise (detailed in Chapter 4) may be well positioned to access strong domestic investment opportunities in high potential companies when they arise and ensure they are sufficiently capitalised to generate their full economic potential.
c. Improved governance: Increased pension fund investment in businesses directly may help improve governance as firms are more accountable over longer time horizons. This can lead to better management practices, transparency, performance, and resource allocation. The stability and long-term funding offered by pension funds could allow management to focus on sustainable, strategic investment decisions rather than short-term shareholder returns.
d. Other productive asset types: Pensions funds may be able to invest in assets which may be less attractive to other types of investors, due to their longer-term investment windows or high capital requirements. This means that pension investment in these assets may reduce market failures and enable additional investment in assets which would yield greater public and private returns. Mobilising private sector capital into investments across the UK should help align government’s goals of economic growth and tackling climate change, as well as support government in forging new partnerships with business thus investing in jobs, industries and infrastructure of the future. The OECD highlighted the growing trend of pension investment in infrastructure, particularly on ESG-related investments.
50. However, any impact on the real economy from pensions investment decisions will be dependent on:
- Asset Class, as some assets may have more direct links to economic growth and/or impact growth over different time horizons.
- additionality, as pension fund investment may have just replaced money which would have been invested by another type of investor. An important consideration is whether there is a market failure for pension funds to address and whether higher demand may decrease the cost of capital.
- displacement effects, as the impact will depend on whether any change in asset allocations arises from:
- overseas to UK investment, where the impact on economic growth and reduced information asymmetries may be greater.
- one UK asset to another UK asset, in which case, this will depend on what the investment is diverted from and what is being invested in.
51. The range of asset types which pension funds can invest in are summarised in Table 4, with brief commentary on some off the theoretical and empirical links to the economic impacts of such investments.
Table 4: Summary table categorising the theoretical and empirical impact of investment in different asset classes and economic growth
| Asset Class | Theoretical Impact | Evidence of link to supporting growth |
|---|---|---|
| Infrastructure (may be equity or debt) | May drive investment in developing assets that deliver critical goods/services. Infrastructure investments have the potential to improve efficiency/productivity which can also benefit economic growth. | Evidence from Latin America found a relationship between increases in pension fund investment in infrastructure and increases to growth in GDP per capita, which is supported by other studies exploring other countries, including across the OECD. |
| Private Equity, Venture Capital and Unlisted Equities | Increases business investment and economic growth by targeting capital, expertise and innovation towards firms with high-growth potential to improve efficiency and/or increase scale. | Bank of England’s Productive Finance group outlined how “less liquid investment strategies often target newer industries or innovative business models, which are likely to play an important role in the growth of the economy more generally.” Additionally, research across 34 OECD countries found increasing pension saving is particularly beneficial for firms heavily relying on external finance suggesting “an increased amount of assets held by pension funds and other institutional investors is associated with more efficient financial markets and therefore higher economic growth.” |
| Private Credit | Drives business investment by targeting credit-constrained firms with high-growth potential, providing liquidity and capital that otherwise might not be available. | As above |
| Property | Drives investment in physical/real-estate assets in some supply-constrained areas of the UK. This may also positively impact growth by crowding in other forms of investment and spending (e.g. construction). However, there is potential for negative spillover effects which can dampen economic growth (e.g. by inflating asset prices). | A number of studies make a link between economic performance and housing undersupply. Therefore, additional housing through investment could support growth; though this may depend on the extent investment is focusing on increasing housing stock compared to buying existing stock. |
| Corporate Bonds | Investment provides companies with access to debt-finance/working capital that could support investment within the company. | Can play an important and growing source of finance for firms to invest in the company. |
| Listed Equity | Investment supports liquidity and improves corporate governance which helps support market capitalisations, IPO activity and lower costs of capital. This may spur a positive feedback loop which may further increase and improve investment decisions by businesses. | Range of studies found investment in equities can help market capitalisation and deepening of financial markets. Though this is often a two-way relationship. However, pension funds tend to be buy-and-hold investors and can therefore be an additional source of long-term investment funding. |
| Government Bonds | Gilts impact the cost of government borrowing and facilitate government spending – including investment through capital projects and public services that develop human capital and have strong links to growth. Some spillover effects may crowd-in or crowd-out private investment. | DB schemes hold around 80% of long-dated index-linked Gilts, therefore providing stable and long-term source of government borrowing. |
| Cash | Likely to have no significant effect on investment levels or consumption within the overall economy. | Likely to have no significant effect on investment levels or consumption within the overall economy. |
| Commodities | This will be dependent on the type of commodity. Some categories may have the potential for positive spillovers to certain economic sectors, it may be an asset class less likely to have any significant effect on investment levels or consumption within the overall economy. | This will be dependent on the type of commodity. Some categories may have the potential for positive spillovers to certain economic sectors, it may be an asset class less likely to have any significant effect on investment levels or consumption within the overall economy. |
International evidence on pensions and growth
52. DWP undertook a rapid literature review to explore the empirical evidence on pension funds and economic growth. This found a number of studies which explored the positive link between a well-developed pension system and supporting economic growth. However, these studies often focus more on emerging countries where the impacts are likely to be greater compared to more developed countries due to their systems being less mature. In addition, identifying and isolating macroeconomic impacts can be challenging. These are important caveats when considering the evidence.
53. Thomas and Spataro (2016) summarise the evidence and links between pension funds and growth. They identified the literature on pension funds and economic growth is sparse, but a notable exception was Holzmann (1997)[footnote 9] who found a positive relationship between financial development induced by pension reform and economic growth in Chile. However, the impact may depend on where the assets are invested, geographically, with a weaker effect more likely if greater levels of assets are invested abroad (Zandberg and Spierdijk, 2012).
International evidence on pensions & stock markets
54. Pension reforms in financial systems can promote the development of stock markets through a corporate governance channel. Pension funds can be large shareholders of various firms with long time horizons. Therefore, pension funds have a greater incentive to monitor managers and improve investor protection. Across a range of studies (see below), investments by pension fund assets positively impact the economies of different countries, and these investments can lead to deeper and more efficient capital markets and hence support economic growth.
55. However, a common feature of the literature is the two-side causal relation between stock markets and pension funds. For example:
- Liang and Bing (2010) analysed UK data from 1970-2008 and identified pension fund growth has a positive effect on the deepening of financial market development. They find a long-run relationship between fund growth and financial market development which is reciprocal.
- Alda and Marco (2016) collect data on eight European stock markets (including the UK) and find stock markets display a supportive environment for pension funds, and domestic equity pension funds also promote stock market development. Specifically, they find pension funds’ growth impacts positively on the short-term market size, growth, liquidity, activity, return and stability. Their paper points to the long-term nature of pensions also producing enduring effects, finding that pension fund expansion positively impacts on the long-term market capitalisation, flows and return.
- Alda (2017) found pension fund investment in equities helps stock market development (defined as market capitalisation) across a sample of thirteen European countries from 1999-2014. In the UK, this finding was positive but not statistically significant.
- Babalos (2020) found pension fund investment in equities enhances stock market development (defined as market capitalisation) in each of the five sub-country groups (covering 29 OECD countries from 2001-2016). This finding was positive but not statistically significant in Anglo-Saxon countries.
56. For developed economies, private pension funds may contribute less to further financial deepening. However, pension funds tend to be buy-and-hold investors and can therefore be an additional source of long-term investment funding. Whether pension funds can improve the efficiency of resource allocation, depends on many factors (see Economics of Pensions).
International evidence on pensions and productivity
57. Using Danish data, Roel et al (2024) identified a significant relationship between pension fund equity investment and firm productivity. Following such an investment, a substantial increase in firm productivity, averaging between 3% and 5%, was observed. The productivity effect increases with the equity stake. Additionally, the authors found pension funds tend to invest for longer periods than other institutional investors, such as private equity. The paper notes the finding is more pronounced for unlisted equity, over listed equities, highlighting listed firms may be able to access alternative sources of finance.
Evidence on returns
58. As well as looking at how investment in specific asset classes links to the wider macroeconomy and economic growth, it is also important to consider the impact on member outcomes. This is especially important given the recent differences in UK and Overseas market performance (as previously outlined in Table 3) which has been a large driver behind declining UK allocations.
59. Work has been completed with the Government Actuary’s Department (GAD) for DC schemes to consider the potential member impacts of different asset allocations and UK asset class exposures. This analysis covers four broad illustrative strategies:
a. Baseline: Asset allocations remain similar to current levels in the DC Market intended as a representative example pension portfolio (70% allocation to overseas equities).
b. UK Equity focussed: Overseas equity allocations are reduced from 70% to 50% of assets and reallocated to UK equities.
c. UK “Balanced” focussed: Overseas equity allocations are reduced and reallocated across a diverse range of assets including UK equities and private markets.
d. Private Markets: Overseas equity allocations are reduced and reallocated to private markets.
60. It is recognised that these allocations are simplistic and illustrative, and providers would seek a wide range of information, such as levels of risk, when making their investment decisions. The analysis is simply aimed at highlighting the potential implications of member returns to changes in asset allocations.
61. Modelling is highly sensitive to economic conditions, assumptions and allocations. This is detailed further in Annex C. To present these sensitivities, 3 variations are modelled for the above strategies:
a. GAD scenario: This projects the impact on member outcomes across the four portfolios using 30 June 2024 capital market assumptions which GAD have procured from Moody’s and applied the 10-year median annualised returns to the projections made here.
b. Selection of other providers’ capital market assumptions: Expected returns vary across financial institutions. Some project UK equity outperformance compared to global equities[footnote 10] whereas the Moody’s assumptions have roughly equal UK and World equity expected returns at the modelling date chosen. To reflect these wider views, a scenario is developed projecting UK equity outperformance of 1 percentage point above the Moody’s world equity expected return for 10 years. This is an approximation of these other institutions’ expectation for UK vs World equities.
c. Past performance continues: It is recognised that UK equities have underperformed overseas equities over the recent past, by approximately 4 percentage points per year over the last 20 years. In this scenario, this performance differential continues for 10 years (by creating a UK equity return which is 4 percentage points lower than the world equity return assumption).
62. Figure 10 shows that each of the portfolios are expected to deliver similar returns (across GAD’s analysis and providers of other capital market assumptions). For a member earning £30,000 per year saving at 8% for 30 years, the UK Equity portfolio is slightly above other portfolios in each case, though each deliver a pot between £330,000 and £340,000 in cash terms. However, UK-focussed strategies would be expected to underperform the Baseline and result in smaller pot sizes were recent past market conditions to persist.
Figure 10: Member pots saving at the AE minimum are projected to be similar under different asset allocation and return assumptions for a member earning £30,000 per year
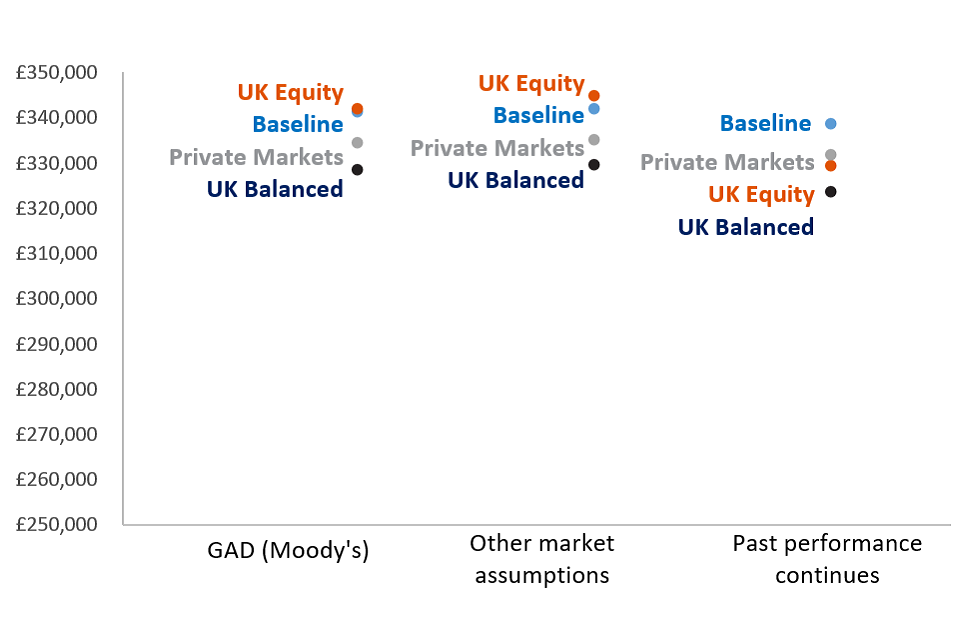
63. The analysis above models outcomes on a deterministic basis using average, smooth returns. Table 5 below presents stochastic, risk-adjusted analysis from GAD using their Moody’s data. This is a modelling technique where a range of simulated outcomes are produced which account for the balance of risk and correlation between asset classes[footnote 11]. The modelling shows that strategies with higher UK and/or private market exposures mostly have higher pot values compared to the Baseline strategy. For example, the Private Markets strategy has a higher pot size across all scenarios and the UK Balanced strategy also offers improved pot outcomes in both downside and median scenarios. This suggests such portfolios may provide better risk-adjusted returns, and that this is achieved through increased diversification and greater exposure to both UK equity and private market assets.
Table 5[footnote 12]: On a risk-adjusted basis, returns are similar with greater allocation to private markets giving slightly greater expected returns through diversification benefits
| Scenario | Baseline | UK Equity | UK Balanced | Private Markets |
|---|---|---|---|---|
| Low Scenario | £116,000 | £121,000 | £124,000 | £121,000 |
| Median | £259,000 | £259,000 | £260,000 | £264,000 |
| High Scenario | £674,000 | £652,000 | £642,000 | £676,000 |
64. Overall, the analysis highlights:
- an asset allocation with a greater level of exposure to private markets may deliver slightly greater returns to members (up to 2% greater pension pot compared to a baseline scenario).
- however, there is considerable uncertainty, particularly around the extent future performance will differ compared to past performance.
Chapter 4: Evidence on scale of pension funds
65. Chapter 4 explores the scale of UK pension funds and the associated benefits and challenges of a more consolidated market.
66. DWP have previously explored the evidence on the potential benefits of DC consolidation and the optimal size of pension schemes: in a Call for Evidence; in the Pension Trends analytical report; and in a review of Master Trusts. From those reports we have seen a wide range of evidence on the benefits of scale within the pension market. Key benefits include:
- better governance
- economies of scale, with greater size helping to reduce average costs per member
- the ability to move investment in-house, potentially reducing investment costs
- access to a wider range of assets
- being able to invest directly in certain assets, rather than needing to be part of a pooled fund to do so
- an improved bargaining power, including the ability to pay lower investment fees.
67. These benefits can also be linked to potential changes in pension funds’ asset allocations with associated economic and growth impacts. For example, having the scale to move investment in-house and to negotiate lower investment fees may allow more scope to invest in typically more expensive asset classes and private markets. Similarly, having the scale to diversify investment and to be able to invest directly should allow greater access to a wider range of asset classes. This is particularly true of asset classes that are shown to have a high (theoretical or empirical) impact on growth, such as infrastructure, as outlined in Chapter 3.
68. There is some evidence to support the existence of a good governance premium, particularly in Defined Benefit pension schemes[footnote 13]. Academic studies across international pension schemes identifies a correlation between the features of better governance structures and sustained long-term performance (detailed further in Chapter 6).
69. There are, however, potential disadvantages and challenges for pension providers in reaching a large scale, as measured by Assets Under Management (AUM). For example:
- investment difficulties, including the ability to find attractive assets to invest in that are large enough. This risk is particularly pronounced in the less liquid asset classes.
- costs can go up, at least in the short-term, due to investing in more expensive asset types over sustained periods and the cost of bringing more expertise in-house.
- concentration and competition risks if there are too few providers holding a large proportion of assets.
70. The evidence linking pension provider scale and gross investment returns is mixed. DWP analysis of CAPA data, as shown in Figure 11, shows weak correlation between the asset size of Master Trusts / GPPs and 5-year gross investment performance. However, this is based on a small sample of providers. Across the AUM spectrum, there are examples of small, medium and large-sized schemes with both high and low gross returns.
Figure 11: UK DC pension providers, assets under management by annualised gross returns for younger savers over the last 5 years
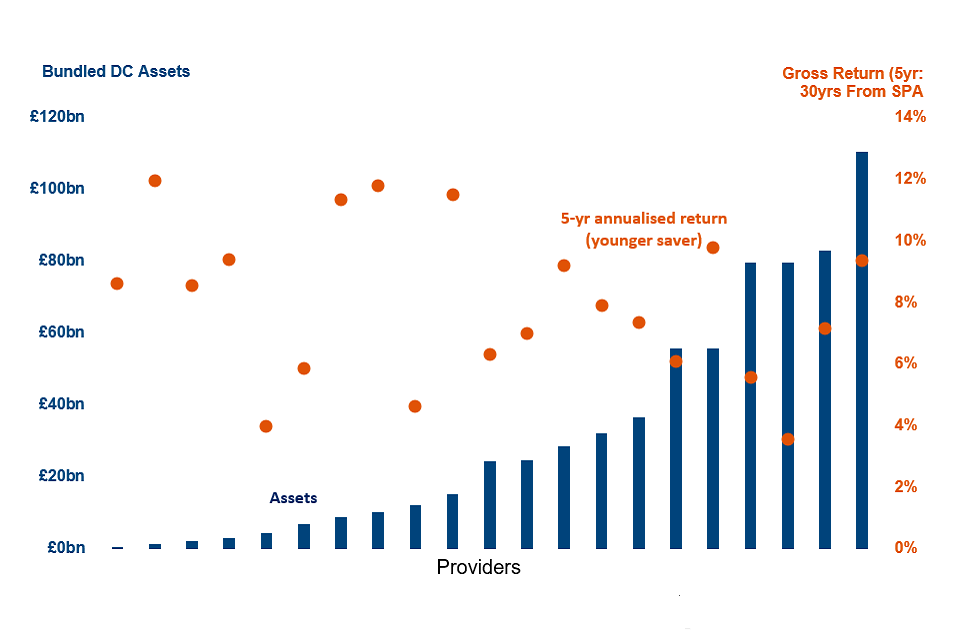
Source: DWP calculations of Corporate Adviser MT/GPP Default Report 2024 and Q22024 Returns
71. International evidence also seems inconclusive on the benefits of scale on gross investment returns[footnote 14] with any benefit in returns through greater scale often being driven by lower costs (which improve net returns) due to being able to negotiate lower prices or conducting investment in-house.
72. There are also examples of smaller schemes, including single employer trusts, who are delivering good outcomes for their members. Some single-employer trusts may offer higher pension contributions or other guarantees for members. Some single-employer schemes are quite large in size or may be able to benefit from the expertise of their wider business. For example, HSBC and J.P. Morgan both run their own DC pension scheme for their employees. Given their wider financial expertise, they may be able to access similar investment opportunities to larger pension schemes; for example J.P. Morgan reported 6% of their £6bn pension scheme is invested in unlisted equities.
Evidence on benefits of scale
73. A review of the evidence on scale of pension providers indicates benefits can take effect at a range of different levels with no clear consensus on the right “optimal” level of assets. This will depend on which benefits are being considered. Some reports suggest economies of scale (in terms of costs and charges) begin, and even peak, at low levels, such as for providers with assets in the low hundreds of millions of pounds. Other analysis indicates that scale benefits continue for providers with a higher level of assets, and that new advantages arise at this level.
74. Nevertheless, across a number of studies (see Table 6 below), these tend to suggest broadly around £25 to £50 billion may give a wide-range of benefits. However, there is further evidence signalling advantages to scale that can only be realised by pension providers with an even greater level of assets (£50 billion or more). As discussed below, the benefits seen at these higher levels tend to be around investment capability. This capability may mean pension providers have a greater ability to invest in asset classes that have been linked to having a potentially higher impact on economic growth.
Scale benefits at a lower level
75. There is evidence from TPR which shows that there are benefits of scale in terms of scheme governance. One example is research from 2019 showing a strong positive correlation between scheme size and the number of key governance requirements being met. Only 12% of micro schemes (2 to 11 members) and 15% of small schemes (12 to 99 members) met 2 or more applicable requirements. This contrasted with large schemes (1000+ members) where 84% were meeting 2 or more applicable requirements, as were all Master Trusts.
76. This is supported by TPR research published in 2023 which showed that 78% of Master Trusts and 53% of large schemes met the requirement for trustee boards to assess the extent member-borne charges and transaction costs provide good value for money. However, only 45% of medium and less than 20% of small/micro schemes met this requirement.
77. This evidence supports the fact that larger pension schemes may be able to offer better governance than smaller schemes. As this better governance seems to start for schemes with 1,000 or more members, it could be that governance scale benefits are most apparent for schemes with hundreds of millions of pounds in assets under management.
78. DWP research has shown that larger pension schemes have lower charges (and well below the current charge cap of 0.75%). For example, Master Trusts had an average charge of 0.48%; though this fell to 0.40% for larger Master Trusts. There was a similar pattern for both Contract-based providers and other (non-Master Trust) Trust-based providers.
79. This is further supported by PPI international research on value for money in pension schemes. Its analysis of the Netherlands found, once a scale of £0.5 billion was reached, the impact of scale on reducing charges is negligible. It also found that in the US significant reductions in charges level off for pension schemes of around US$500 million (about £400 million).
80. Similarly, a study by the Australian Prudential Regulation Authority (APRA) looked at economies of scale in Australian pension funds and found that estimated efficiencies peak for funds below Aus$1bn (about £0.5 billion). Analysis by CEM Benchmarking shows that pension funds with more than US$10 billion (about £8 billion) in assets have consistently delivered returns significantly higher than smaller funds with under US$1 billion (about £0.8 billion).
Scale benefits at a medium level (£25 billion to £50 billion)
81. However, there is also evidence that scale benefits for pension providers exist at a higher level of assets. For example, the previously mentioned study by APRA also finds pension funds between Aus$32 billion and Aus$100 billion (about £16 billion to £50 billion) are still achieving scale benefits. Similarly, another APRA research report found funds with assets of more than Aus$50 billion (about £25 billion) can more easily spread their costs over a wider membership base to keep their fees lower.
82. The PLSA reported larger schemes, those with £25 to £50 billion of assets, have considerable governance capability and find it easier to invest directly, or alongside others, in productive finance. In the recent Pensions Review Call for Evidence, the PLSA also said that:
Based on PLSA member feedback, as AUM reach c.£20 billion schemes can start to co-invest in private markets; above this, schemes can invest directly and may increasingly use in-house investment. Above c£100 billion benefits of scale increase more slowly. Data from CEM highlights that a typical £1 billion fund invests 11% in private markets; a £20 billion fund invests 20%; and a £100 billion fund invests 23%.
83. Conexus Institute explored Australian pension providers of A$50 billion to A$100 billion (about £25 billion to£50 billion) and beyond. It concludes there are advantages, disadvantages and significant challenges from such scale, and that ensuring funds are configured to succeed at scale is the key issue. The key advantages they find include:
- reduced costs through internal investment management
- scale economies in administration
- greater scope to offer customised member services
- increased ability to invest effectively in private market assets.
Scale benefits at a higher level (£50 billion+)
84. There are some scale benefits identified for even larger pension providers. For example, the Conexus Institute report also finds some important advantages for very large funds of A$100 billion+ (about £50 billion+). These include:
- an even higher proportion of assets can be managed internally, further reducing costs
- larger mandates with external managers which can attract a lower fee rate
- the opportunity to exploit potentially attractive investments not readily accessible at smaller size
- ability to invest directly (rather than through pooled structures)
- greater capability (and need) to invest overseas and have an overseas presence. Though a challenge and entailing expensive upfront costs this can bring advantages such as diversification benefits, building local knowledge, boosting organisational skills and intellectual diversity.
85. New Financial has also argued that a more concentrated market of pension super trusts, with around £50 billion of assets each, would be enabled to invest in a broader range of assets in the long-term interest of their members, by economies of scale, wider investment horizons, and increased professionalisation.
86. The Ministry for Housing, Communities and Local Government (MHCLG) previously explored asset pooling within the LGPS and concluded the benefits of scale are present in the £50 billion to £75 billion range and may improve as far as £100 billion. This is due to improved bargaining power with asset managers, access to a wider set of opportunities such as private markets and enabling build of internal capacity.
87. Similarly, a report by NMG Consulting looked at how LGPS pools could learn from the experiences of global peers. This found that the benefits of scale are improved long-term performance after fees, better control over - and better choice of - assets, and reduced investment costs. This is due to both greater ability to negotiate external fees down and by bringing more investment in-house. This included the finding that economies of scale began once a pool hits US$100 billion of assets (about £80 billion).
88. J.P. Morgan on Australian Superfunds describes how the largest funds are managing more of their portfolios in-house, and that this drives down investment costs. It also notes that two very large funds, Hostplus (which has over £50 billion in assets) and Australian Retirement Trust (which has over £100 billion in assets) had not yet insourced as they felt their size allowed them to negotiate lower fees with asset managers.
Scale and economic growth
89. The reports summarised above suggest a clear link between scale among pension providers and the ability to diversify investments. This particularly seems to be the case for investment into private market asset classes. This is as pension providers reach £25 billion to £50 billion and some investment starts to be brought in-house, with the scale also allowing more funds to be allocated to these asset classes. As pension providers reach £50bn or more, the scale can also help with direct investment and negotiating lower investment fees.
90. There are also examples from the UK where very large pension providers have used their scale to negotiate lower investment fees, to invest in private markets and to invest directly (rather than through pooled structures). For example, NEST advanced investments in private markets as they reached £30 billion. Nest have also made the case for scale leading to “stronger negotiating conditions” when making these investments. Similarly, the larger LGPS pools have reported being able to invest directly in private markets, reducing costs.
91. As outlined in Chapter 3, there is evidence that private market asset classes may have a positive impact on economic growth. Therefore, greater scale among UK pension providers could, through greater investment in these asset classes, lead to higher economic growth. In addition to this, there is evidence that if scale can reduce costs and improve member outcomes this could lead to increase the amount of pension members have to spend upon retiring. Some international evidence points to this leading to higher economic growth.
Summary of evidence
92. Table 6 summarises the potential benefits from scale and AUM size the evidence points towards to achieve this. Although there is not one single estimated optimal size, the evidence does point towards £25 to 50 billion as a level where many benefits could be achieved.
Table 6: Summarising the emerging evidence against asset size required to achieve different benefits relating to scale
| Aspect of Scale | AUM size required to achieve scale benefit | References |
|---|---|---|
| Governance | £100 million’s | TPR 2019 and TPR 2023 |
| Economies of scale | £100 million’s | Pension Charges survey 2020, PPI 2021, APRA 2023 |
| Better Governance | £25 billion to £50 billion | PLSA 2023, Conexus Institute 2023 |
| Further scale benefits | £25 billion to £50 billion | APRA 2023, APRA 2022, Conexus Institute 2023 |
| In-house investment | £25 billion to £50 billion | Conexus Institute 2023 |
| Access to wider range of assets | £25 billion to £50 billion | PLSA 2023, Conexus Institute 2023 |
| Even broader range of assets, including direct investment | £50 billion+ | New Financial 2023, DLUHC 2023, NMG Consulting 2021, Conexus Institute 2023 |
| Improved bargaining power | £50 billion+ | DLUHC 2023, NMG Consulting 2021, Conexus Institute 2023, J.P. Morgan 2022 |
| Even more in-house capacity | £50 billion+ | DLUHC 2023, NMG Consulting 2021, Conexus Institute 2023, J.P. Morgan 2022 |
Chapter 5: International comparisons of pension fund scale
93. Chapter 5 builds on the previous chapter to explore more on UK and international comparisons of fund sizes, particularly as UK pension funds are only just starting to reach the level of AUM cited across many reports.
94. Individual pension fund data is challenging both in the UK and internationally. Comparisons can be challenging due to definitions (for example, is it covering all pension assets, the default fund, or workplace pensions) and many large funds are often public sector DB funds. However, there is evidence (outlined below) to show funds in the UK DC market hold lower amounts of assets than other developed countries with large DC pension funds, such as Australia and US. This may be expected as AE was only fully rolled out by 2019 at the current contribution levels.
95. The UK’s largest workplace DC providers have around £100 billion of bundled assets under management and the largest Master trust, Nest, is expected to reach that size of £100 billion by 2030. However, this remains lower than the largest pension funds of many other countries. In addition, direct comparisons are difficult since in the UK market a pension provider may manage saver assets across numerous default funds, the largest of which may be relatively small compared to the overall assets the provider manages.
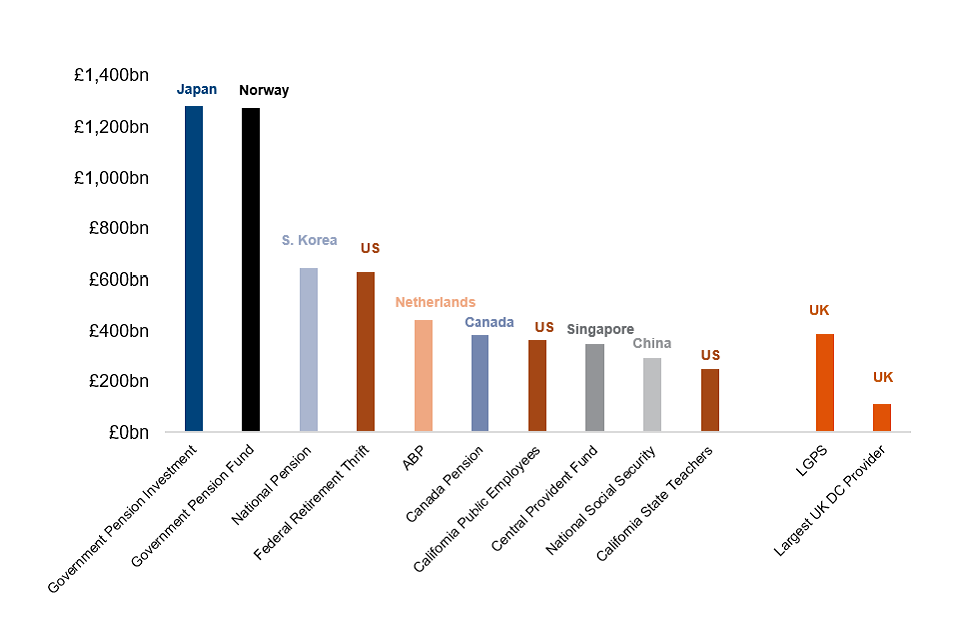
96. The US holds 7 funds in the largest global 20 funds, with their largest holding over £500 billion. Japan has the largest fund in the world holding over £1.2 trillion and has 2 funds in the top 20 global pension funds. Similarly, Netherlands, Canada and Australia also hold positions in the largest 20 pension funds by AUM. However, an important factor to consider is that many of the largest 20 funds are public sector DB pension funds. In total, sovereign and public sector pension funds accounted for 152 funds in the top 300 funds.
97. In comparison, the largest workplace DC provider in the UK holds over £100 billion in bundled assets. This is made-up of multiple schemes and funds including a master trust, Group Personal Pension (GPP) and Group Self-Invested Personal Pension (GSIPP). Although the LGPS stands at £392 billion and would therefore be, as a global comparison, the 7th largest global fund, these assets are spread across 87 funds (see Figure 12 which uses Thinking Ahead Institute, LGPS Scheme Advisory Board and Corporate Adviser data).
Figure 12: Largest 10 Global Funds and UK’s LGPS and largest workplace DC provider
Australia vs UK fund sizes
98. Although Australia and the UK have comparable pensions markets, given high participation levels and growth of DC, Australian funds tend to be much larger than the UK’s Master Trust providers. This is to be expected given the higher contribution levels and longer time period many Australian funds have been operating (as well as recent large mergers between funds), with superannuation funds introduced 20 years before AE in the UK. Australia’s largest MySuper fund is Australian Super, which holds over £100 billion assets, whereas the UK’s largest Master Trust, NEST, has around £40 billion (including managed assets). Figure 13 illustrates that the UK has providers significantly lower in size compared to Australian funds. Two funds in Australia have £50 billion+ of assets each in their MySuper fund alone, whereas the UK is yet to have a Master Trust alone surpass the £50 billion mark.
Figure 13: DC fund size comparison between Australia’s MySuper and UK’s Master Trusts (£billion, 2024)
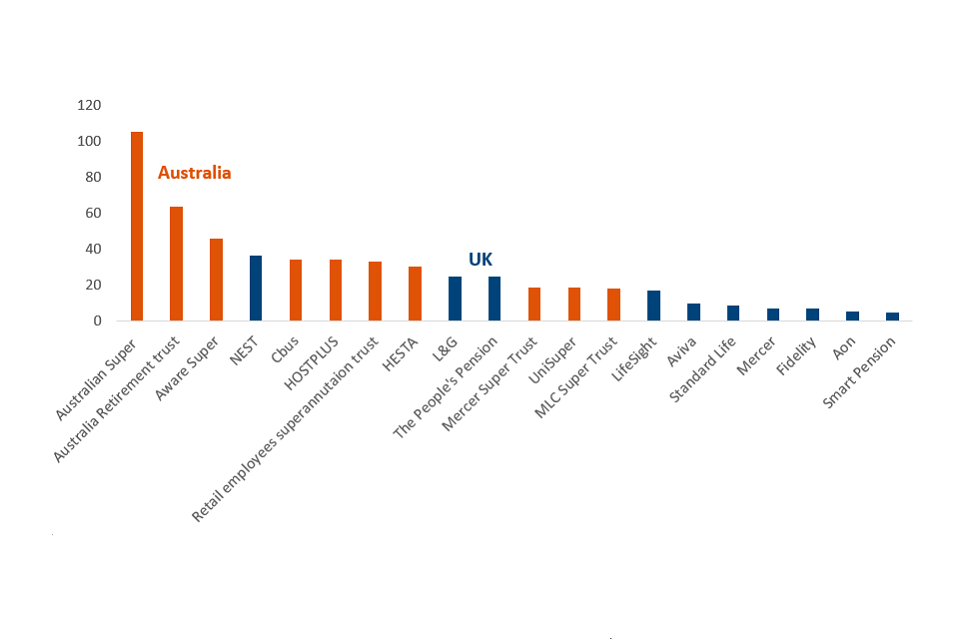
Source: APRA, Corporate Adviser
Asset concentrations
99. Although the UK does not necessarily have the same sized providers as Australia, the level of asset concentration is nevertheless high, with a large proportion of the assets held by a small number of providers. The largest 5 and 10 defined contribution funds (either a Master Trust or GPP) in the UK hold 55% and 74% of total DC assets respectively. Similarly, around 30 Master Trusts alone account for 78% of DC trust market assets. These proportions have been steadily increasing each year since the introduction of Automatic Enrolment and the increasing market share of Master Trusts. This growing trend towards Master Trusts is likely given around 95% of active savers in the trust-based market are in Master Trusts.
100. Although international comparisons are challenging due to available data and differences in pension system, it appears that compared to other countries, UK DC displays a relatively high concentration level. However, Australia has a much lower level of asset concentration with the top 5 funds in Australia accounting for around one-third of DC assets, whilst the top 10 accounts for 43%.
101. The US has the largest number of DC schemes, holding over £8 trillion assets with over 700,000 offered DC plans, meaning the assets in their pensions market may be fragmented. As a result, their concentration levels are very low among their largest DC funds, with their top 5 funds accounting for less than 10% of total DC assets.
102. Although there is limited data on Canada’s DC schemes and concentration levels, their DB pension market is highly concentrated, with Canada’s “Maple 8”, who are the largest 8 public funds in Canada, accounting for around 72% of total DB assets in Canada.
Figure 14: Market asset concentration comparison of the top 5/10 largest funds in the DC market (UK, US, Australia) and DB market (Canada)[footnote 15], [footnote 16]
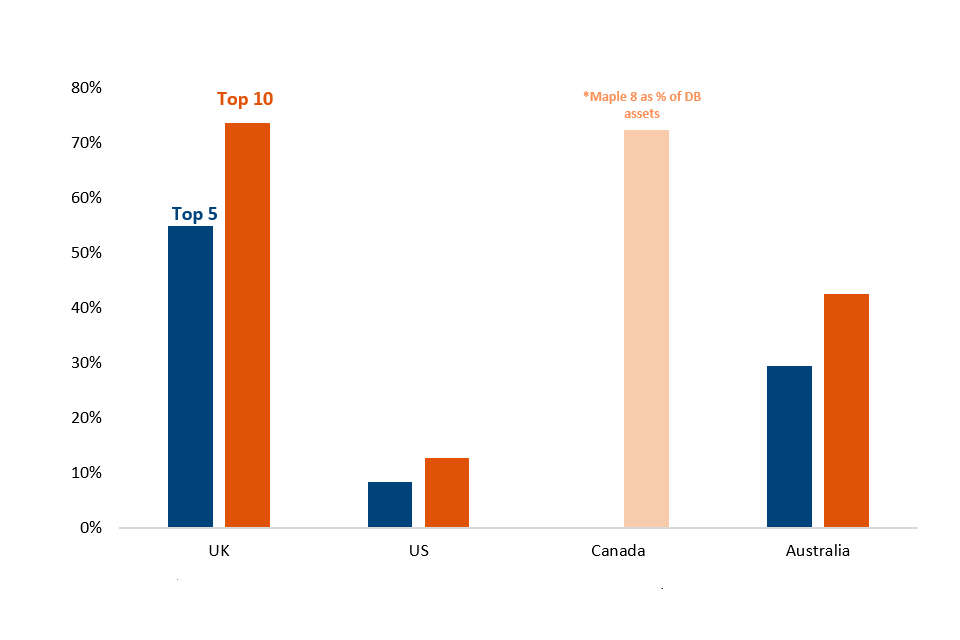
Source: Corporate Adviser data (UK), Pensions and Investments data (US and Canada), APRA Annual Superannuation Statistics (Australia)
Chapter 6: Wider evidence
103. Chapter 6 explores wider evidence and considerations for the Pension Review, including the potential level of additional money that may arise through increases in UK asset allocation and the views of members.
What-if Analysis
104. Estimates suggest around 22% of private DC assets are invested in the UK. This is down from around 55% in 2012. As outlined, there are several reasons that explain this decline in domestic exposure and the UK is not alone in seeing its pension funds pursue more global mandates.
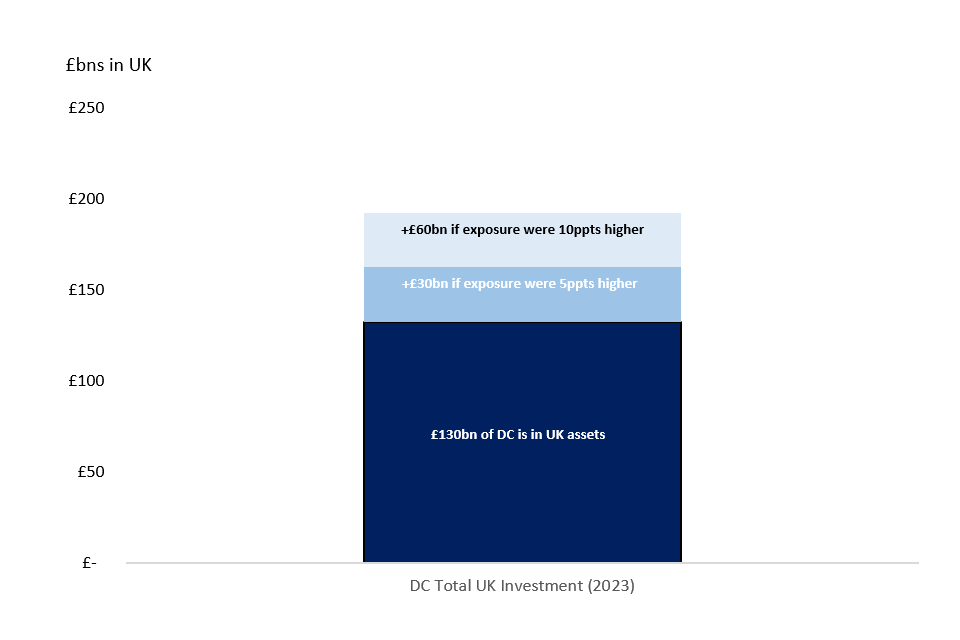
105. Purely illustratively, Figure 15 outlines the potential change in UK investment if pension funds increased UK allocations closer to historical levels and/or international peers.
- it is currently estimated private sector DC invests around £130 billion in UK assets, representing around 22% of total assets (based on PPI DC Future Book estimates of £600 billion private DC assets in 2023)
- if this domestic investment level increased by 5 to 10 percentage points, then from the £600 billion estimated workplace DC market, this would equate to an additional £30 to 60 billion of investment in the UK by DC pension funds. Assuming an £800 billion DC market size by 2030, an extra 5ppts of domestic investment would represent an additional £40 billion invested in UK assets
- at between 27% and 32% of assets, this would still be below the domestic investment levels seen in the Australian and New Zealand DC systems and align with recent past levels of UK investment by DC pensions
- together with the theory and evidence outlined in Chapters 3 and 4, investment on this level has the potential to deliver spillover, external growth benefits across UK markets and the wider domestic economy.
Figure 15: Total UK asset ownership by workplace DC pensions would rise from around £130bn to between £160-£190bn if domestic exposure increased by 5-10 percentage points
Members
106. Pension engagement is low with only 25% of those contributing to a DC pension having “high” levels of engagement. Additionally, 29% of people saving into a DC pension are not aware it is even invested and over 90% are in default funds.
107. Whilst it could be hypothesised some members may prefer their pension to be invested in the UK, evidence for whether members do want this is limited. However, there is some evidence members want more information regarding where their pension scheme invests in the world.
108. PLSA undertook a survey of employees saving into a DC workplace pension, finding:
- 67% of savers advocate for tax incentives to encourage pension schemes to invest in UK companies.
- 53% of savers say they would like some of this investment to be in UK companies.
- however, 50% believe the UK Government should not dictate where pension companies invest savers’ money.
109. NEST recently conducted research finding the majority of members (70%) wanted more information on how Nest invests in the UK. Three in four (75%) of members were unsure or underestimating current levels of UK investment in their pension pots. Around 7 in 10 (69%) of members were interested in where in the world their money was invested.
110. A number of pension providers, including L&G, Aviva and Royal London have all asked members about green, social and ethical related investments. They have tended to find that members are willing to pay greater fees for types of investment which may be likely to have a home bias, for example funds that invest in assets such as affordable homes and better roads. However, research has also found members engage more around investment performance compared to environmental performance.
International evidence on the benefits of good governance
111. Chapter 4 highlights how enhanced scale has been seen to provide benefits including better governance. Pension scheme governance involves the structures, processes, and practices that ensure a pension scheme is managed effectively and in the best interests of its members. Governance is particularly important for funded DB schemes because it ensures the scheme’s long-term sustainability and ability to meet its pension promises to members, by effectively managing risks, investments, and regulatory compliance.
112. Effective governance includes internal controls, allowing the pension scheme to identify, evaluate, and manage risks and opportunities. It has been argued that effective governance is therefore conducive to mitigating downside risks and capturing upside opportunities. Over the longer-term this could realise a benefit for the scheme, measured through stronger, more robust investment returns. This has been called the governance premium.
113. There is some evidence to support the existence of a governance premium. Whilst there is no consensus on how to measure good governance objectively, research collated by the PPI has estimated this premium could be as high as 2% per annum.
114. Analysis of the benefits of governance is largely reliant on self-assessment techniques and identifying correlations with outperformance of peer groups or relative to benchmarks. However, the range of academic input on this subject from across the international pension schemes industry, including Canada, Switzerland and the UK, suggests a premium may exist from good governance on outcomes.
Annex A: Assumptions and sources
Private Defined Benefit
- in Chapter 1, asset allocations over time for DB are taken from Purple Book annual publications from 2006 through to 2023. This provides annual breakdowns of asset allocation broken down by:
- listed equities (broken down into UK vs non-UK); bonds (broken down into gilts and corporate); property; unquoted equities; insurance assets; cash[footnote 17]; annuities; hedge fund investments; and other.
- to calculate the proportion of each of the above remaining asset classes that are ‘UK-based’, investment data from the ONS is used:
- ONS MQ5 dataset is available from 2006 to 2017. We use the dataset on self-administered pension funds’ assets and liabilities that is broken down into UK vs Overseas holdings. This includes the proportion of government bonds, corporate bonds, property, cash and loans that are invested in the UK vs Overseas.
- ONS FSPS dataset is available from 2019 onwards. This provides information on the direct investments of funded occupational pension schemes available at the UK vs Overseas level. This includes the proportion of government bonds, corporate bonds, property, unquoted equities and cash that are invested in the UK vs Overseas.
- As holdings on insurance assets (including annuities) are not broken down in either the MQ5 or FSPS dataset, it is assumed these are 100% UK-based.
- As holdings on unquoted equities are only available in the FSPS dataset and not MQ5, we take the proportion of unquoted equities that are UK-based in 2019 (45%) and apply this to pre-2019 unquoted equity allocations.
- These are the best available datasets on DB scheme asset investment through time. Nonetheless, both the MQ5 and FSPS data are presented at total pension fund level (combining DB, DC, public and private sector) and are not specific to DB. The FSPS data is also only based on direct investment and does not include the geography of indirect (or pooled) investments. There may also be some discrepancy between the geographic registration of a fund/asset, and where the underlying investment activity takes place.
- for the total amount of £ assets in private DB schemes, annual Purple Book publications are used directly.
Defined Contribution
- in Chapter 1, 2012 to 2015 DC asset allocations are based on a PLSA survey of its members. This provides the asset allocation of members’ main default fund (capturing most members) broken down into:
- Equities; Fixed income; Inflation-linked; Cash; Other
- 2016 DC asset allocation are taken from a PLSA ESG Default Report which surveyed FTSE350 companies for their DC default asset allocations. This was broken down into:
- Equities (UK, Global and Emerging markets); Fixed Income; Alternatives; Other
- 2017 to 2019 DC asset allocations are based on the PPI DC Future Book annual publications
- these are broken down inconsistently over time. The 2018 report is the most useful and provides asset allocation information on:
- Equities; Fixed income; Property; Infrastructure; Cash; Private Equity; Commodities; Other.
- The relative weight of ‘other’ assets in this 2018 data (those not equity or fixed income) is applied to the 2016, 2017 and 2019 data which are not presented this granularly. 2019 is also presented as a range so the midpoint is taken in each case. Where data is presented separately for Master Trusts, Group Personal Pensions and Stakeholder pensions, a simple average is taken between the three.
- 2020 to 2023 uses data from the Corporate Adviser annual MT/GPP reports that covers the largest Master Trust and Group Personal Pension providers across the DC market. The annual report shows the asset allocations of these largest providers default funds broken down into:
- Equities (UK and Overseas); Government bonds; Index-linked government bonds; Corporate bonds; Property; Cash; Other.
- data is often presented as two or three portfolios (where a ‘younger saver/30years to retirement’, ‘older saver/5 years to retirement’ and/or ‘at retirement’ saver are shown). ASHE data is used to weight these portfolios in each year based on how many DC savers are estimated to be in each phase of saving.
- the same ONS datasets (MQ5 and FSPS) are used to determine the UK vs Overseas weightings for all asset classes. This is with the exception of UK equity investments since 2020 which are included in the CAPA dataset directly.
- Total DC assets for 2012 to 2015, 2017 to 2018 and 2020 to 2021 uses ONS data. DC assets in 2022 and 2023 are taken from the PPI DC Future Book. Assets in 2016 and 2019 are imputed using midpoints.
Annex B: International Sources
Chapters 2 and 3 makes use of a number of international comparisons. The data sources and assumptions underpinning these figures are detailed in this Annex.
- Australia data is taken from Quarterly superannuation statistics – APRA with quarterly asset allocation across the superannuation sector. For assets which do not have a direct domestic vs overseas breakdown, assumptions are applied. In the absence of definitive data, we assume 25% of unlisted equity, and 55% of property/infrastructure investments are domestic[footnote 18]. We assume 100% of cash, commodity and other investments are domestic.
- for our 2023 estimate of 56% of Superannuation assets invested domestically, this is validated against the NAB Super Insights Report which reaches a similar estimate of 53% based on a smaller sample of Supers and against AustralianSuper’s latest holdings who are just over 50% domestic.
- New Zealand data is taken from Kiwisaver assets data from the Reserve Bank of New Zealand. This provides a quarterly series of domestic and overseas allocations across of all asset classes in the KiwiSaver system.
- Canada data uses Statistics Canada. It is a quarterly publication of trusteed pension funds covering ~90% of market assets and provides domestic investment information of stocks, bonds and, in the latest releases, real estate and infrastructure. Data reporting changes between Q42020 and Q12021 which causes a drop in the series. Assets included in the ‘nationality unknown’ row are not accounted for.
- Netherlands data is taken from de Nederlandsche Banke and shows domestic and overseas holdings across all major asset classes.
- Japan data is based on GPIF Past Holdings releases and it is noted that the Fund now aims for 25% each domestic bonds, foreign bonds, domestic equities, and foreign equities.
- US data is sourced from Table 16 of the Investment Company Institute which has quarterly data on US DC plan holdings of domestic and world equity.
Annex C: Government Actuary’s Department analysis: Assumptions and allocations
The analysis is based on 4 illustrative investment strategies presented below. These are, very approximately, designed to reflect:
- Baseline – Roughly the type of asset allocation many schemes are currently applying to their fund.
- UK equity focused – Increasing the level of UK equities at the expense of overseas equities only.
- UK balanced focused – Trying to reflect an asset allocation closer to Australian funds, which tend to have greater private market investment and home bias.
- Private Markets – Reflecting an increased exposure to private markets compared to baseline allocations. This is presented in the stochastic analysis to demonstrate the diversification benefits of these assets.
The asset allocations are used purely to illustrate the potential differences in returns. There is a wealth of other information, including the level of risk, providers would consider alongside returns.
| Asset | Baseline | UK Equity Focused | UK “Balanced” Focused | Private Markets |
|---|---|---|---|---|
| Overseas Equities | 70% | 50% | 45% | 55% |
| UK Equities | 5% | 25% | 10% | 5% |
| Overseas Corporate Bonds | 5% | 5% | 5% | 5% |
| UK Corporate Bonds | 5% | 5% | 10% | 5% |
| Gilts | 5% | 5% | 5% | 5% |
| UK property | 5% | 5% | 5% | 5% |
| Infrastructure | 0% | 0% | 10% | 10% |
| Private Equity | 0% | 0% | 5% | 5% |
| Cash | 5% | 5% | 5% | 5% |
The analysis assumes an annual salary of £30,000 that rises in line with prices and a starting DC pot of £10,000 contributing 8% pension contributions for 30 years. Analysis is presented in cash terms and on a net of fees basis. Fees are assumed to be 0.25% for all asset classes except for private markets where a 1% fee (and 10% performance fee) is used.
Three return scenarios are used for each portfolio to reflect the uncertainty of future returns. For the second and third deterministic scenarios (that modify the underlying Moody’s capital market assumptions), the UK equity performance differential is projected to last for 10 years before reverting to baseline Moody’s assumptions.
It is important to note further analysis may set out other outcomes, such as if varying asset allocations, modelling assumptions and member saving rates. There will also be factors not illustrated by the modelling, but which would be important to consider when evaluating investment strategy, such as the different operational challenges using private markets relative to listed assets, how allocations are implemented, such as the degree of active management, or passive indices used and costs of changing portfolios.
Annex D: Role of investment performance in pension pots
The role of net investment returns is incredibly important for people’s pension pots in retirement. This could account for around 60% of the final pension pot. The role of this is outlined by using DWP’s iPEN case study model[footnote 19] (below) to disaggregate an individual’s pension pot by different contributors, investment growth, and charges for an average male earner on AE minimum contribution levels.
Figure D1: Illustrative case study of a median male earner’s pension pot at retirement made-up of different components (assuming saves at 8% contribution levels over a full career history). Current earning levels
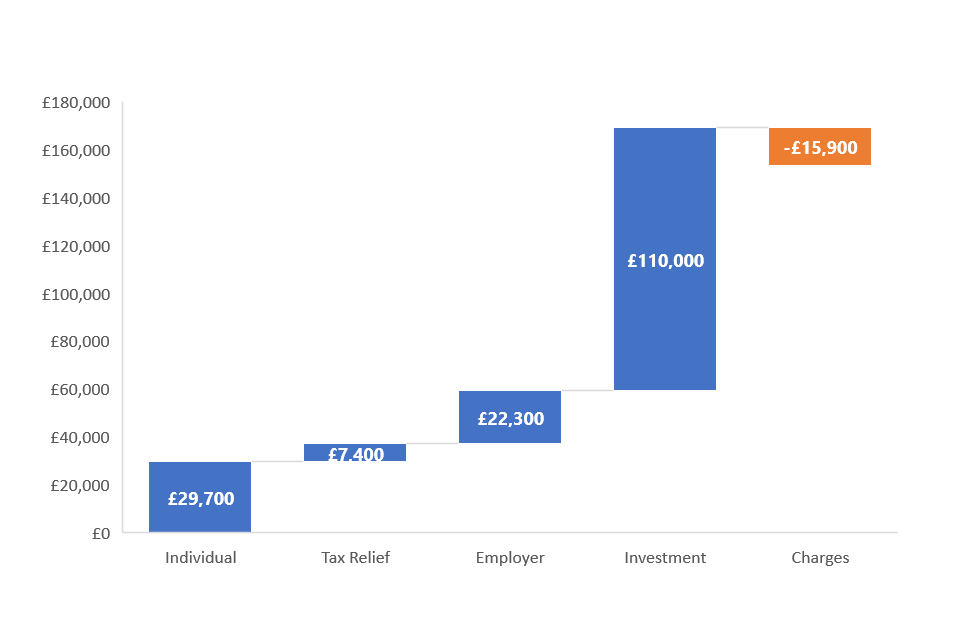
Annex E: Potential additional private market investment in workplace DC and LGPS
It is estimated that 4% of workplace DC assets are invested in private equity (1%) and infrastructure (3%) asset classes. This compares with 13% seen in Australia’s (5% private equity and 8% infrastructure) superannuation system (Table 1d). If UK DC (with £600bn in assets) invested in these assets to the same extent seen in Australia’s Superannuation system, i.e. applying the Australia Superannuation allocations to the current UK DC market, this would mean an additional £54 billion invested in private equity and infrastructure assets by UK DC pension funds.
It is estimated 14% of the LGPS (with £392 billion in assets) is invested in private equity and infrastructure assets. This compares with 20% seen in the LPPI pool (a LGPS pool managing £26 billion in assets). If the whole LGPS invested in line with LPPI investments in these categories, this could mean an additional £24 billion – or 6% more – investment in private equity and infrastructure assets.
Annex F: Statement of compliance with code of practice for statistics
The Code of Practice for Statistics (the Code) is built around 3 main concepts, or pillars:
- trustworthiness – is about having confidence in the people and organisations that publish statistics
- quality – is about using data and methods that produce assured statistics
- value – is about publishing statistics that support society’s needs for information.
The following explains how we have applied the pillars of the Code in a proportionate way.
Trustworthiness
The figures are based on a range of sources from key institutions, including the ONS, and validated against other external estimates. To support departmental business, figures have been seen in advance by ministers and officials. This is in line with the Code of Practice for Statistics, where pre-release access does not apply for releases based on analysis.
Quality
This publication uses data drawn from a wide range of sources and, as outlined, there is no single clear source for pension investment levels. As a result, the underlying data cannot be quality assured to Official Statistics publication standards. Nevertheless, engagement has taken place with departments and external organisations with expertise to ensure the analysis and statistics included are as accurate as possible, show consistent trends and patterns compared to other sources, and is of sufficient quality for publication. This has been complemented by work with GAD to draw on their modelling expertise and bring independence to the analysis on returns. Rigorous quality assurance has taken place throughout.
Value
In publishing the paper, the aim is to support the information needs of society, parliamentarians, and stakeholders, providing a detailed evidence source for the work of the Pensions Investment Review.
Authors
Danny Hatton
Jennifer Szulc
Christopher Lord
Richard Mosley
-
Reflecting the scope of the Review, all LGPS references in this paper refer to England and Wales only. ↩
-
See PPI Report for discussion on data challenges – (pensionspolicyinstitute.org.uk) ↩
-
This includes unquoted private equity and alternatives (including venture capital). The majority of this paper considers private equity and venture capital together (as data is often grouped) however recognises these areas of private markets may have different impacts. ↩
-
Note, the LGPS estimates are highly preliminary and subject to change as feedback from an MHCLG survey is analysed ↩
-
Domestic investment defined as investment in domestic based markets across all asset classes (e.g. UK capital markets including stocks and bonds, UK-based property/infrastructure, UK-based private companies etc.) ↩
-
Reserve funds share similarities with traditional private/public sector DB markets but differ in that they are designed to supplement or finance future state pension provision. ↩
-
The extent DB schemes are open, or closed, will impact direct comparisons. ‘Open’ DB schemes are open to new members who can accrue benefits and therefore the schemes may still be growing and investment time horizons can be much longer. Whereas ‘Closed’ DB schemes are closed to future accruals and may prioritise asset-liability matching above return-seeking assets to minimise fluctuations in funding ratios. In the UK, only around 4% of DB schemes are fully open to new members. ↩
-
For example, BBB note: “While UK companies have been as successful in progressing to later funding rounds than their US counterparts, they raise less on average at each round. This gap is most acute for later stage funding, with US companies receiving 2.6 times and 2.3 times more at the fifth and sixth rounds respectively” Small Business Equity Tracker 2024 ↩
-
Holzmann, R. (1997) Pension reform, financial market development, and economic growth: preliminary evidence from Chile. Staff Papers—International Monetary Fund, Washington, DC, pp. 149–178. ↩
-
This includes the publicly available JP Morgan; Blackrock; Amundi assumptions (who each project UK equity outperformance by 0.8ppts, 0.6ppts and 1.4ppts respectively) but does not include the extensive range of other capital market assumptions used privately by investors and advisers. ↩
-
This is then ordered by ‘percentiles’. The 10th percentile (‘lower case’) is where modelling suggests that there are only a 1 in 10 scenarios that would result in a lower pot value ; the 50th percentile (median) suggests return outcomes have an even chance of either being higher or lower and the 90th percentile (‘higher case’) is where modelling suggests there is only a 1 in 10 scenarios would result in a higher pot value. ↩
-
Stochastic analysis from GAD. ‘Low scenario’ refers to the 10th percentile pot value and ‘High Scenario’ refers to the 90th percentile pot value. The median value presented in Table 5 differs from the value presented in Figure 10 due to the stochastic nature of the modelling meaning returns experience more volatility rather than consistent growth in the deterministic scenario. ↩
-
Research by the PPI and others has attempted to quantify a “governance premium”, providing an indicative guideline in evaluating the potential governance reforms. PPI – Defined Benefits: the role of governance ↩
-
For example, Is-big-really-beautiful-the-limits-of-pension-consolidation.ashx (mckinsey.com); Why bigger pension funds are better for the UK (ft.com); Does Size Benefit Super Fund Members - Lawrence and Warren (24 March 2023) (theconexusinstitute.org.au); and Drivers of Performance: Insights from a Member Outcomes Perspective (apra.gov.au) ↩
-
What can U.K. pension funds learn from Canada’s Maple 8 – Pensions & Investments ↩
-
Asset Mix Report - PIAC – Pension Investment Association of Canada ↩
-
In some years, Defined Benefit ‘cash’ allocations are negative. This reflects a number of large schemes with significant negative cash holdings and is likely related to net holdings of swaps and repurchase agreements. Where cash allocation is negative, this is set to 0 in this analysis. ↩
-
Based on numerous sources: The 55% listed infrastructure assumption is based on the current home bias of unlisted infrastructure and applied across to property investments. This is validated against AustralianSuper’s holdings (whose balanced fund real asset home bias is around 55%) and a recent JPMorgan Superannuation report. The 25% private equity home bias assumption is around the home bias seen in listed equities and validated against a recent AustralianSuper press release confirming around 75% of private equity investments targeted for overseas investment. ↩
-
See here for further details and modelling assumptions: Impact Assessment ↩