Trends in the Defined Contribution trust-based pensions market
Published 22 November 2023

© Crown copyright 2023
This publication is licensed under the terms of the Open Government Licence v3.0 except where otherwise stated. To view this licence, visit nationalarchives.gov.uk/doc/open-government-licence/version/3 or write to the Information Policy Team, The National Archives, Kew, London TW9 4DU, or email: psi@nationalarchives.gov.uk.
Where we have identified any third party copyright information you will need to obtain permission from the copyright holders concerned.
This publication is available at https://www.gov.uk/government/publications/trends-in-the-defined-contribution-trust-based-pensions-market/trends-in-the-defined-contribution-trust-based-pensions-market
Analysing the pensions landscape and consolidation in the DC trust-based pensions market
22 November 2023
Introduction
1. On 10 and 11 July 2023, the Chancellor and Minister for Pensions announced a wide range of pension reforms designed to improve member outcomes and support the UK economy. This builds on the success of automatic enrolment (AE) which has seen 10.9 million employees automatically enrolled[footnote 1], 88% of eligible employees participating in a pension, and £33 billion more (in real terms) being saved into workplace pensions in 2021 compared to 2012[footnote 2].
2. On 22 November 2023, further announcements and confirmation of planned reforms were included in the Autumn Statement. This included a number of documents highlighting the changing pensions landscape and the increasingly important role of master trusts (large multi-employer pension schemes) in the defined contribution (DC) workplace market.
3. Workplace pensions are split into two markets:
a) Defined benefit (DB) - Pays a retirement income based on your earnings, accrual rate, and length of service rather than the amount of money you’ve contributed to the pension.
b) Defined contribution (DC) - Pension contributions made by employees and employers which are invested to create a pension pot at retirement. Of which, the market is further split by[footnote 3]:
- Trust-based market - A pension scheme governed by a board of trustees who have a fiduciary duty towards scheme members. The board of trustees manage investments on the members behalf. This is regulated by the Pensions Regulator (TPR).
- Contract-based market - A pension scheme governed by a provider and an independent governance committee (IGC) where a contract exists between the individual scheme member and the provider. This is regulated by the Financial Conduct Authority (FCA).
4. This report focuses on only the DC trust-based market; though many of the trends/findings may have similar applicability to the contract-based market too. The focus on trust-based markets is driven by:
-
Availability of data – There is a greater level of information available across the trust-based market to analyse and project forward.
-
Department for Work and Pensions (DWP) policy ownership – DWP own the policy area within trust-based market and the analysis was used to support the Master Trust Review published in November assessing the important role of multi-employer schemes in the market. Master trusts are pension providers used by two or more employers who are not connected with each other[footnote 4].
- A greater share of current savers – Over 10m people currently save into a DC trust-based workplace pension compared to around 5.6m in DC contract-based and less than 1m DB schemes[footnote 5].
5. This publication provides high-level estimates of the changing pension landscape since the roll-out of AE and assesses the potential outlook by 2030. Any estimates are subject to change and considerable uncertainty, particularly as the market will continue to evolve, policy announcements will be developed, and is subject to macroeconomic and business conditions. In addition, data is not as readily available for the contract-based market. It is important to note the caveats and inclusions/exclusions around the data. For example, assets generally exclude hybrid and micro scheme assets given availability of data.
6. However, the overall aim is to show the growing importance of the pensions industry, the emerging evidence around market consolidation, and the potential benefit to members. As a separate DWP document published[footnote 6] finds, there is evidence that schemes operating at a very large scale, with a healthy active membership, are likely to realise scale efficiencies in future, and can be better placed than smaller schemes to create diversified investment strategies, including investments in new asset classes with the associated potential benefits for saver outcomes.
7. We will continue to identify areas to ensure a robust evidence-base is available to inform future policy.
8. Since the introduction of automatic enrolment (AE) in 2012 the trust-based pensions market has grown considerably, particularly in terms of assets and members. According to data from the Pensions Regulator (TPR) there were around 2.4 million memberships in 2012 and this had risen to 26.4 million by 2023 [footnote 7].
9. TPR data also shows that the size of assets in the trust-based has grown from around £22 billion in 2012 to over £143 billion at the start of 2023[footnote 8] . As is shown in Figure 1, much of this growth has been driven by master trusts, with around 75% of trust-based assets held by just over 30 master trusts.
Figure 1: DC trust assets, master trust assets, and master trust assets as a proportion of DC trust assets (right-hand axis)[footnote 9]
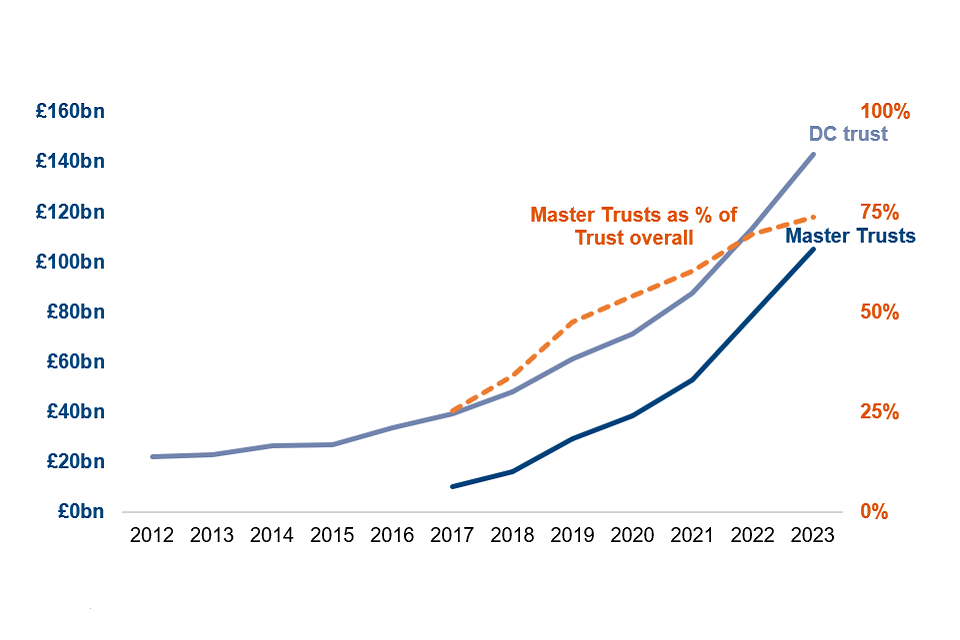
10. Most memberships of DC trust-based pension schemes are in master trusts with 90% of all memberships (23.7m out of 26.4m) and 95% of active memberships (10.0m out of 10.5m)[footnote 10] . Within master trusts there is also a concentration of memberships within the largest master trusts, with 80% of memberships across master trusts concentrated in just 5 schemes[footnote 11] .
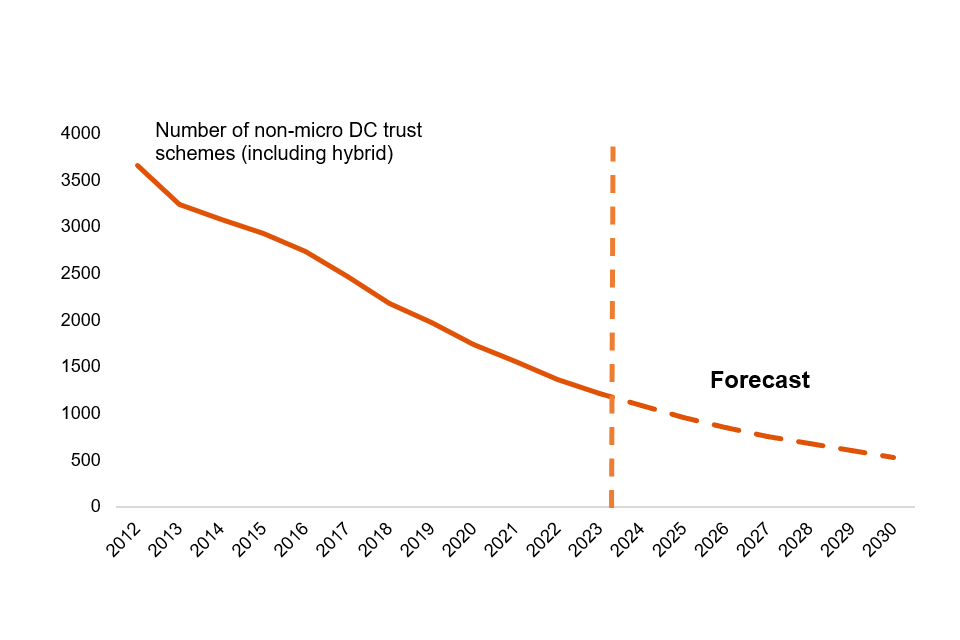
11. However, the number of DC trust-based pension schemes has been falling over the same period, from nearly 3,700 in 2012 to about 1,200 in 2023[footnote 12]. This has been driven as many schemes move their scheme into a master trust. There have been falls in the number of schemes of around 11% per year over the past few years, which if continued, could mean the number of DC trust-based schemes falling to just over 500 by 2030. This could be reduced further by policy initiatives, such as Value for Money framework, where evidence from Australia has shown (via their Performance Test) it could lead to further substantial number of mergers or exits from the market[footnote 13].
Figure 2: Consolidation of the DC trust market at the current rate[footnote 14]
Projection methods and assumptions
12. Estimating how the trust-based DC market might look in the future is highly challenging given limited data, a changing landscape, and uncertain economic conditions. However, it is possible to look at recent market trends and project how the market could potentially look if those trends continued. We assess a potential scenario of what might happen.
13. By looking at multiple scenarios, such as if some of the growth rates were higher or lower than previously seen, we can test how sensitive the projections are to the assumptions we have made. Where possible, we have looked to sense-check and cross-reference our estimates with other sources. At a high-level, our methodology:
-
Assesses the current 2023 landscape using TPR DC scheme return data for total market assets/memberships and Go Pensions for top 5/10 providers by AUM[footnote 15].
-
Use historical growth annual growth rates to project forward those estimates to 2030.
14. These projections are based on past trends and do not account for potential policy or business changes which may further accelerate growth or composition of the market. For example, the introduction of the Value for Money framework could lead to greater consolidation of pension schemes, and the introduction of a multiple default consolidator approach to address the small, deferred pots challenge could result in more assets/memberships in some of the largest providers, and fewer memberships (pots) overall.
Assumptions
15. We have made a number of key assumptions for the central estimate:
-
Growth rates of the assets – The trust-based market estimate is an average over the last 11 years (covering period since AE roll-out). But due to the fact growth was lower in the early years of automatic enrolment (where contributions were lower, for example) we have weighted more recent asset growth (last 4 years) higher than the growth in early 2010s.
-
Growth rate of savers – is an average of the growth rate of 2021/22 and 2022/23 – these growth rates have been relatively stable over time giving us greater confidence.
-
Growth rate of master trust assets – we use a weighted average (one-third 2021/22 growth rate and two-thirds 2022/23 growth rate) for the largest five and largest ten schemes. Sensitivity is applied (see below) but we considered a weighting approach may be sensible given the rebound in markets following Covid-19 and more recent data perhaps reflecting more stable levels of asset growth. Nevertheless, this is still based on a limited time-series and therefore very sensitive to assumptions used.
-
Growth rate of master trust (MT) savers – we use an average of the growth rates from 2021/22 and 2022/23. The average growth rate is applied to the published H1 2023 figure from Go Pensions[footnote 16].
-
Data calibration – Recognising there are differences in time periods and definitions being collected between Go Pensions[footnote 17] and TPR[footnote 18], we make an adjustment to align the data. There is around a 10% difference between estimates of MT assets; we therefore calibrate fund-level estimates from Go Pensions to TPR’s official scheme estimates to align.
- 2021 prices – in line with previous internal analysis, we have deflated to 2021 earning price levels.
16. To estimate the DC trust-based market, we take an average of two approaches:
a) The average growth rate of trust-based assets from 2012 to 2023 (19%) is applied to the published TPR figure in 2023 (£143 billion) for every year to 2030, giving £478 billion. This is deflated to align with 2021 prices to be £360 billion.
b) The average growth rate of trust-based assets from 2020 to 2023 (24%) is applied to the £143 billion every year until 2030, giving around £630 billion. This is deflated to 2021 prices, which is about £480 billion.
- An average of £360 billion and £480 billion is taken, which is around £420 billion.
17. To sense check this finding, we consider a range of other sources including:
a) The DC trust-based market is currently approximately half of the overall workplace DC market in terms of assets[footnote 19]. The PPI DC Future Book 2023[footnote 20] estimates the workplace DC market to be around £800 billion in 2030 (in 2023 prices). If the trust-based market remained around half of the DC assets then this would be about £400 billion, in line with our £420 billion figure.
b) DWP have previously estimated using a stock-flow approach of contributions and withdrawals which estimated around £800 billion of assets in 2030 across contract and trust-based market – again, showing a similar range.
c) ONS’ Funded Occupational Pension Schemes data shows an annual average growth rate over the last 3 years in DC trust-based market of around 26%[footnote 21] .
18. For sensitivity and recognising the high degree of uncertainty, we show a higher and lower bound for each of the scenarios. In particular:
-
Growth rate of assets – We use the 11-year average growth rate in assets for the lower-bound and 4-year average for the higher-bound.
-
Growth rate of savers – we use an average of the growth rate of 2021/22 and 2022/23 and take a total that is 5% lower (lower bound) and 5% higher (higher bound).
-
Growth rate of master trust assets – We halve the average annual growth rate between 2021/22 and 2022/23 (lower bound) and use the average annual growth rate for 2021/22 and 2022/23 (higher bound).
-
Growth rate of master trust savers – We halve the average of the growth rates from 2021/22 and 2022/23 (lower bound) and apply a 20% uplift to the average annual growth rate for 2021/22 and 2022/23 (higher bound). The average growth rate is applied to the published H1 2023 figure from Go Pensions.
Projections
Table 1: Assets in the trust-based market for largest master trust providers
| Year | Largest 5 | Largest 10 | Overall DC Trust | Largest 5 | Largest 10 | |
|---|---|---|---|---|---|---|
| – | 2023 | £80bn | £100bn | £130bn | 58% | 75% |
| Lower bound | 2030 | £160bn | £200bn | £360bn | 44% | 55% |
| Central | 2030 | £300bn | £360bn | £420bn | 72% | 86% |
| Higher bound | 2030 | £370bn | £440bn | £480bn | 77% | 93% |
Table 2: Savers in the trust-based market for largest master trust providers
| Year | Largest 5 | Largest 10 | Overall DC Trust | Largest 5 | Largest 10 | |
|---|---|---|---|---|---|---|
| – | 2023 | 20m | 21m | 25m | 82% | 85% |
| Lower bound | 2030 | 29m | 30m | 48m | 61% | 63% |
| Central | 2030 | 42m | 44m | 51m | 83% | 86% |
| Higher bound | 2030 | 48m | 50m | 53m | 91% | 95% |
Table 3: Proportion of savers and assets by master trust scheme size in 2030
| Over £20 billion | Over £30 billion | Over £50 billion | ||
|---|---|---|---|---|
| Lower bound | Savers | 83% | 81% | 49% |
| Lower bound | Assets | 40% | 34% | 14% |
| Central | Savers | 83% | 79% | 77% |
| Central | Assets | 77% | 65% | 56% |
| Higher bound | Savers | 91% | 91% | 84% |
| Higher bound | Assets | 83% | 77% | 59% |
Potential landscape in 2030
19. Taking the projections from our central estimate, the trust-based market could grow from around £130 billion in 2023 to about £420 billion in 2030 in real terms. In cash terms the 2030 figures would be significantly higher. Much of this growth would come from the largest master trusts, with the five largest potentially holding around £300 billon in assets.
20. Were the growth in savers in the largest providers continue to grow, we could see over 80% of trust-based members in the largest 5 master trusts, with around 86% in the largest 10 master trusts.
21. Looking at schemes by size, this could lead to over half of trust-based assets being in schemes of over £50 billion, nearly two-thirds in schemes holding more than £30 billion and over three-quarters in schemes of over £20 billion. With the potential growth in members of these schemes, this could mean over three-quarters of trust-based members being in schemes of over £50 billion, approaching 80% being in schemes holding more than £30 billion and over 80% in schemes of over £20 billion. In cash terms, these percentages would be higher.
22. These assumptions are of course highly volatile and dependent on future market conditions and potential policy changes.
23. Available data does not permit the same calculations directly to be made for the contract-based (GPP) workplace market, but given the known concentration of active memberships in the trust-based market combined with the dominance of a small number of large schemes in the contract-based market[footnote 22] we consider it is reasonable to expect that, across the DC workplace market as a whole, the vast majority of savers will be in schemes holding £30 billion or above by 2030.
The potential benefits of consolidation
24. Analysis above shows the market is consolidating at a fast pace and we may expect that to continue. There are a number of ways this could potentially support members (and the industry) through, for example:
-
Economies of scale – Greater size can help reduce average cost per member.
-
Reduction in member charges – Larger schemes may be able to lower charges for members as a result of their size and reduction in costs.
-
Greater investment opportunities – Larger schemes may be able to invest in a greater variety of investment opportunities (including private equity and venture capital, and at lower costs/fees). This will help deliver greater diversification within investment portfolios.
25. This does not mean smaller schemes cannot deliver for their members. For example, some single-employer trusts may be offering higher than AE minimum contributions, and some may offer other guarantees for members. There are also some single employers who are quite large in size and may already invest in alternative asset classes. There may also be potential risks around consolidation, for example in relation to competition and the potential for schemes to become systemically important, and the DWP document “Evolving the regulatory approach to master trusts” sets out the Government’s thinking on how to approach these issues in the context of a rapidly growing master trust market[footnote 23].
Governance
26. There is a range of evidence showing a positive relationship between size and governance. Research carried out by the Pensions Regulator (TPR) in 2019 showed around 70% of micro (2-11 members) and 60% of small (12-99 members) schemes were not hitting any of the five key governance requirements[footnote 24] that applied to them. In contrast, 84% of large schemes (1000+ members) are meeting at least two of the five key governance requirements.
27. This is further supported by TPR research[footnote 25] in 2022 which showed 78% of master trusts and 53% of large schemes met the requirement for trustee boards to assess the extent member-borne charges and transaction costs provide good value for money. However only 45% of medium and less than 20% of small/micro schemes met this requirement.
Costs
28. DWP research showed all members of qualifying pension schemes have charges below the charge cap of 0.75%, with 83% members subject to fees of 0.5% or less. As Figure 3 highlights, the larger the scheme, the lower the costs.
Figure 3: Average costs by scheme type and size[footnote 26]
| Bundled trust | 0.29% |
| Master trust (1000+ members) | 0.40% |
| Contract-based workplace (1000+ members) | 0.41% |
| Average | 0.48% |
| Master trust (All) | 0.48% |
| Unbundled trust | 0.49% |
| Contract-based workplace (All) | 0.50% |
29. This is further supported by PPI analysis[footnote 27] , highlighting master trusts have substantially lower total expense ratios (around 0.5%) compared to around 1% for single-employer trusts, GPPs and Stakeholder schemes.
Investment
30. The current evidence linking scheme size with gross investment returns (i.e. excluding the impact of cost on returns) is mixed. Analysis of CAPA data[footnote 28] shows no correlation between asset size of master trusts/GPPs and investment performance. International research finds inconclusive evidence on the benefits of scale on gross investment return[footnote 29] . However, this is an area DWP are looking to develop the evidence further in the coming months.
International
31. There has been a number of studies exploring consolidation, particularly in Australia, where research has studied the potential benefits to fund members of a fund size of A$50-$100 billion (about £25 billion-£50 billion) of assets and beyond is likely to benefit fund members. Lessons from this research[footnote 30] include:
-
Size was helpful in reducing cost ratios through internal investment management and scale economies.
-
Fund size is a clear driver of performance, largely through reducing operating expenses. Efficiency gains were found through both organic growth and through mergers; though merger-generated efficiencies were on average greater.
-
Efficiencies through growth were achievable at all fund sizes and largest for those below $1 billion (around £0.5 billion) in assets.
-
Larger funds are likely to have additional resources to achieve stronger investment performance through quality of investment governance and access to specialist advisers, although size can bring added complexity.
-
Estimates of the relationship between fund size and relative returns suggested a doubling of fund size is associated with an annual improvement in relative returns of around 5 basis points.
32. Separate research by PPI’s research[footnote 31] on value for money (VFM) frameworks in other countries, outlined:
-
Achieving scale has positive impacts on costs, albeit subject to diminishing returns. Large funds face new opportunities to achieve diversity in assets through unlisted or direct investments to secure consistent high returns.
-
Analysis of Netherlands data found that the impact of scale specifically on reduced charges is weak after a scale of £0.5 billion.
-
US experience shows the greatest VFM gains are available to smallest schemes and significant reductions in charges level off around $500 millio (about £400 millio). Though investment fees paid by 401k members fall by half as scale increased.
Optimal size
33. There have also been numerous studies and publications looking at the size of pension schemes, particularly very large-scale schemes, at which the potential benefits of consolidation may be strongest. Alongside the evidence above from the PPI, other studies include:
-
The Pensions and Lifetime Savings Association has argued that larger schemes, for example those with more than £25 billion-£50 billion of assets, have considerable governance capability and find it easier to invest directly, or alongside others, in productive finance. Though they do also state there are ways of ensuring these assets can be made accessible to much smaller pension funds[footnote 32].
-
New Financial has argued a more concentrated market of super trusts with around £50 billion of assets each would be enabled by economies of scale, wider investment horizons and increased professionalisation to invest in a broader range of assets in the long-term interest of their members[footnote 33].
-
The Department for Levelling Up, Housing and Communities (DLUHC) explored asset pooling within the Local Government Pension Scheme, and the scale benefits that this can bring. It is DLUHC’s assessment that in pooling assets, the benefits of scale are present in the £50 billion-£75 billion range and may improve as far as £100 billion[footnote 34].
- The previously mentioned analysis from Australia[footnote 35] found that despite diminishing returns efficiency gains could still be achieved at A$100 billion (around £50 billion).
The member benefits of consolidation
34. As outlined above, there are potentially many benefits to members for consolidation; though some of these are harder to quantify than others (for example, the benefit of better services or governance). However, to understand the potential gain, we use illustrative case studies to review the effect of consolidation on hypothetical individuals. The baseline scenario continues with current AE plans to implement the 2017 Review Measures[footnote 36].
35. As costs and charges are where the strongest evidence is found, we have analysed the impact of lower costs on member outcomes. The analysis uses the Annual Survey of Hours and Earnings (ASHE) our DWP iPEN modelling to estimate pot sizes in retirement for an average (median) earner.
36. Any estimate of consolidation is challenging and will be dependent on market performance, provider and individual behaviour. The analysis may be an underestimate of the total gain as many of the benefits are challenging to quantify and evidence is missing in places (e.g. on investment performance).
37. As the table below shows, an average earner could have £3,000 more in their pension pot as a result of moving into a large master trust provider due to lower costs. If costs were to further lower due to increase scale and efficiency, this may lead to further gains.
| Median Earner, full work history[footnote 37] | Pension pot (current earnings terms) | Gain |
|---|---|---|
| 0.48% AUM charge – current market average | £134,600 | |
| 0.40% AUM charge – larger master trust average | £137,400 | +£2,800 |
| 0.35% AUM charge – potential scenario | £139,200 | +£4,600 |
Annex A – iPEN assumptions
The following key assumptions have been made when calculating these case studies. The modelling is known to be sensitive to assumptions made about future economic determinants and the methodology used. The baseline assumptions are:
a) Each individual saves into a defined contribution scheme with an annual management charge of 0.48% (and then adjusted to 0.4% and 0.35% for comparison)
b) Each individual contributes 5% and their employer contributes 3%
c) Each individual’s fund is invested in 65% equities and 35% bonds with real fund growth of 3.73% and 1.73% respectively
d) Each individual retires at State Pension age of 68
e) Each individual does not opt-out of pension saving
f) Full time employees work 37 hours per week
g) Each individuals’ earnings increase in-line with average earnings growth. The final pension pot size is reported in 2022/23 earnings using the Average Weekly Earnings growth deflator.
h) Where earnings have been reported, these are the current (2022/23) values.
i) The median annual salary for a male working full-time is £31,414 (Source: ASHE 2021)
j) The median annual salary for a female working full-time is £28,305 (Source: ASHE 2021)
k) The individual is born in 2008; they start contributing from 2026.
-
Automatic enrolment declaration of compliance report - The Pensions Regulator ↩
-
Workplace pension participation and savings trends of eligible employees: 2009 to 2021 - GOV.UK (www.gov.uk) ↩
-
2023-the-pensions-primer.pdf (pensionspolicyinstitute.org.uk) ↩
-
More info on master trusts can be found here: Check scheme master trust - The Pensions Regulator ↩
-
DC trust: scheme return data 2022 to 2023 - The Pensions Regulator ↩
-
A review of the master trusts market, and authorisation and supervisory regime add link to doc when published. ↩
-
TPR DC trust: scheme return data 2022 to 2023 - The Pensions Regulator. Includes memberships of hybrid schemes but excludes memberships of micro schemes (schemes with fewer than 12 members). ↩
-
TPR DC trust: scheme return data 2022 to 2023 - The Pensions Regulator. Excludes assets in hybrid schemes and assets in micro schemes. ↩
-
DWP analysis based on DC trust: scheme return data 2022 to 2023 - The Pensions Regulator ↩
-
TPR DC trust: scheme return data 2022 to 2023 - The Pensions Regulator. Excludes memberships of hybrid schemes and memberships of micro schemes. ↩
-
DWP workings from Go Pensions data ↩
-
TPR DC trust: scheme return data 2022 to 2023 - The Pensions Regulator. Includes hybrid schemes but excludes micro schemes ↩
-
DWP analysis based on DC trust: scheme return data 2022 to 2023 - The Pensions Regulator. Dotted line shows what could happen if the average consolidation rate over the past three years (of 11% per year) continued. ↩
-
This is also supported by comparing/contrasting to Corporate Adviser GPP & Master Trust Report 2023. ↩
-
DC Master Trust League Table 2023 ~ H1 - Go Pensions (go-group.co.uk) ↩
-
DC trust: scheme return data 2022 to 2023 - The Pensions Regulator ↩
-
Driving value for money in defined contribution pensions - The Pensions Regulator ↩
-
The DC Future Book: in association with Columbia Threadneedle Investments 2023 (pensionspolicyinstitute.org.uk) ↩
-
Funded occupational pension schemes in the UK - Office for National Statistics ↩
-
E.g., see Corporate Adviser’s Master Trust and GPP Defaults Report ↩
-
Evolving the regulatory approach to Master Trusts, DWP, November 2023 ↩
-
Key Governance Requirements that DC schemes are subject to: 1. Trustee boards must possess or have access to the knowledge and competencies necessary to properly run the scheme 2. Trustee boards must assess the extent to which charges/transaction costs provide good value for members 3. Core scheme financial transactions must be processed promptly and accurately 4. Trustees of master trusts must meet independence requirements (applicable only to master trusts) 5. Trustee boards must ensure the default investment strategy is suitably designed for their members (applicable only to schemes with a default investment strategy) ↩
-
https://www.thepensionsregulator.gov.uk/-/media/thepensionsregulator/files/import/pdf/dc-trust-based-pension-schemes-research-report-2022.ashx ↩
-
Pension charges survey 2020: charges in defined contribution pension schemes - GOV.UK (www.gov.uk) ↩
-
20230926-the-dc-future-book-9-2023.pdf (pensionspolicyinstitute.org.uk) ↩
-
Corporate Adviser: Master Trust and GPP Report 2023 ↩
-
For example, Is-big-really-beautiful-the-limits-of-pension-consolidation.ashx (mckinsey.com) and Why bigger pension funds are better for the UK - Financial Times (ft.com) ↩
-
https://www.apra.gov.au/sites/default/files/2023-06/Drivers of performance - APRA paper for MMF conference Feb 2023.pdf ↩
-
20211118-value-for-money-final.pdf (pensionspolicyinstitute.org.uk) ↩
-
UK capital markets - a new sense of urgency (newfinancial.org) ↩
-
Local Government Pension Scheme (England and Wales): Next steps on investments - GOV.UK (www.gov.uk) ↩
-
https://www.apra.gov.au/sites/default/files/2023-06/Drivers of performance - APRA paper for MMF conference Feb 2023.pdf ↩
-
No Lower Earners Limit and from age 18 ↩
-
This takes the average of a male and female median earner ↩