The Annual Report of His Majesty’s Chief Inspector of Education, Children’s Services and Skills 2021/22
Published 13 December 2022
Applies to England

© Crown copyright 2022
This publication is licensed under the terms of the Open Government Licence v3.0 except where otherwise stated. To view this licence, visit nationalarchives.gov.uk/doc/open-government-licence/version/3 or write to the Information Policy Team, The National Archives, Kew, London TW9 4DU, or email: psi@nationalarchives.gov.uk.
Where we have identified any third party copyright information you will need to obtain permission from the copyright holders concerned.
This publication is available at https://www.gov.uk/government/publications/ofsted-annual-report-202122-education-childrens-services-and-skills/the-annual-report-of-his-majestys-chief-inspector-of-education-childrens-services-and-skills-202122
The Annual Report of His Majesty’s Chief Inspector of Education, Children’s Services and Skills 2021/22
Presented to Parliament pursuant to section 121 of the Education and Inspections Act 2006.
Ordered by the House of Commons to be printed on 13 December 2022.
© Crown copyright 2022

Clive House
70 Petty France,
SW1H 9EX
13 December 2022
The Rt Hon. Gillian Keegan MP
Secretary of State for Education
Sanctuary Buildings
Great Smith Street
London
SW1P 3BT
Dear Secretary of State
The Annual Report of His Majesty’s Chief Inspector 2021/22
I have pleasure in presenting my sixth Annual Report to Parliament.
This report addresses the full range of our inspection and regulation in both education and care. It is underpinned by evidence from our inspections of, and visits to, schools, colleges and social care, early years and further education and skills providers. I also draw on findings from our research, evaluation, data and analysis this year.
Our aim is to be a force for improvement. As Chief Inspector, it is my priority not only to report on individual providers, but to offer the national picture of education and care from Ofsted’s broad and independent viewpoint. As always, we want to support improvement and raise standards for all children and learners.
It has been a difficult year and the lasting impact of the pandemic on children and learners will take time to emerge fully. I have seen how constructively everyone working in education and social care has generally responded to the challenges faced, and I want to recognise the substantial efforts that have been made. I also highlight in the report where more should be done to ensure that this generation of young people get the education, training, care and opportunities they deserve.
I trust that this report will help to inform policies that promote the very best futures for our children and learners.
Copies of this report will be placed in the Libraries of both Houses.
Amanda Spielman
His Majesty’s Chief Inspector

1. HMCI commentary
This report looks back at the academic year to August 2022. When that year began, the education and social care sectors were still picking up the pieces after the pandemic storm. There was huge interest in COVID-19 recovery and Ofsted continued reporting on this topic, as our inspection and regulatory work had largely returned to normal.
This report describes the shadow cast by the pandemic over education and children’s social care, and how that was addressed over the last year. In doing so, it reflects the considerable efforts made by everyone working in these sectors. I would like to record my thanks for their efforts in what was clearly another very difficult year.
As the year ended, and in the months since, there has been more turbulence, with an energy crisis and cost pressures facing households, the public sector and businesses alike. These new economic pressures have really started to bite this autumn and so are not reflected in this report. But we know they are already making life harder for the education and social care sectors and testing the resilience of both.
This year our inspection and regulatory work happened largely as normal, with a more flexible approach when needed, in response to continuing COVID-related pressures. Using the aggregated insights from our work, we published three sets of COVID recovery reviews. These reviews explained how the pandemic impact on children and learners was addressed this year.
1.1 The start of the year – COVID impact
The impact of the pandemic and resulting restrictions have been well rehearsed. Our youngest children were hit particularly hard. They have lived much of their lives in a time of social distancing, mask-wearing and limited interaction. This delayed some children’s speech and language and slowed their social development. Children often took longer to settle at nursery and arrived at school with a wider range of starting points than normal.
Older children and learners in further education also took more time to adjust to the relative freedoms of the new year. Schools and colleges reported poor behaviour as children and learners slowly readjusted to classrooms, corridors and each other. And after such an extended period of stop-start remote education, many children and learners had made less progress than usual.
Staffing shortages compounded the problem. In schools, COVID-related staff absences left gaps not easily filled by the limited number of supply teachers. Managing with fewer staff slowed the pace of intervention where children needed extra help. It also delayed the return of sports, drama, music and other programmes that are normally part of the school experience.
As we reported last year, the SEND (special educational needs and/or disabilities) system was put under even greater strain during the pandemic. Young people with SEND found that services such as speech and language therapy and mental health support were not always available. There were also delays in assessments for education, health and care plans. Demand for services has also grown significantly.
Nearly 1.5 million school pupils are currently identified as having SEND, an increase of almost 77,000 in the year. But with the system under pressure, accurate identification is critical. We know that many children fell behind during the pandemic and need help to catch up, but nonetheless do not have SEND in the normal usage of the term. Labelling these children as having SEND is not right for them and also puts an unnecessary burden on the system.
There is a widespread recognition that effective mainstream education – particularly getting a good foundation early on – is integral to an effective SEND system. A sound curriculum and good teaching can prevent special educational needs from developing, or from worsening to the extent that specialist help is needed. However, the SEND system is widely seen as adversarial. This can encourage a rush to formal diagnosis, even in the early years. Yet diagnosis can lower expectations for children who might otherwise thrive with good education and some targeted support, freeing up specialist services for the children with complex and profound needs. As it is, a system that was struggling to cope well before COVID is creaking and ripe for long-promised reform.
The further education sector suffered a dual setback under COVID lockdowns. Classroom learning was largely restricted to remote education, and practical courses and on-the-job training were often impossible. Learners and apprentices developed knowledge gaps as a result. Some lost confidence, particularly in work environments. This interruption to practical training is a frustration for any industry struggling with staff shortages and desperate to recruit people with the right skills.
Social care was also under pressure. For a long time, most children were out of daily sight of the teachers and others who would normally refer concerns to social care. Child protection services were braced for an influx of referrals. The surge was not as great as feared, but this was small comfort to a sector already stretched by an increasing number of children needing help. Those pressures have been exacerbated by unaccompanied children arriving from overseas, as well as worsening staff shortages and the greater complexity of many child protection referrals.
1.2 Building back
I noted last year, ‘Every generation gets one chance to enjoy its childhood and fulfil its potential. We must do all we can to make sure this generation is not denied its opportunity.’
This year we have been able to see how successfully the education and social care sectors have addressed the needs of this generation – and there is much to be commended.
Schools continued to face challenges in the last year – not least issues around attendance and staffing. But our inspections told a broadly positive story.
There has been understandable interest this year in our inspections of schools previously graded outstanding. From 2012, the outstanding grade granted an exemption from routine inspection, unless there were specific concerns about a school. Our view had long been that parents deserve up-to-date information, so we welcomed the lifting of the exemption last year.
Over 80% of the formerly outstanding schools that had a graded inspection last year did not retain the outstanding grade. To some extent this was to be expected. We were inspecting schools that had gone longest without inspection, generally a decade or more. The exemption was a policy founded on the hope that high standards, once achieved, would never drop, and that freedom from inspection might drive them even higher. Inspection outcomes show that this hope was not realised. It is particularly disappointing that a significant minority of these schools have been judged requires improvement or inadequate.
Inspections of other schools paint a more heartening picture.
Eighty-eight per cent of all state funded schools are now judged good or outstanding – up nearly 2 percentage points from 2021. This shift was caused by improved outcomes at schools previously graded requires improvement or inadequate.
Seventy per cent of schools requiring improvement that were inspected last year improved to good or outstanding. We inspected 220 previously inadequate schools and nearly two thirds were graded good or better; only 5% remained inadequate.
Improving schools had thought deeply about the curriculum in each subject, and were ambitious for what they wanted pupils to learn and how it would be taught. For all age groups, careful thought was given to how curriculums should be adjusted in light of lost learning. We should all nevertheless recognise that recovery is far from complete. As I foresaw from early in the pandemic, the latest secondary results published this autumn showed that attainment gaps have widened.
In early years, there was a focus on children’s speech and language, with turn-taking and sharing helping to build social skills. Schools used informal assessments to understand what children had missed. Reading and numeracy were emphasised at primary level.
This year we published curriculum research reviews to ground our inspection approach and to support schools’ work. In 2023 we will start to publish subject reviews, giving deeper insights into many aspects of curriculum, teaching and learning.
In further education and skills, most providers have returned to normal teaching and training. Many have shown resilience and creativity, and the sector as a whole is heading in the right direction. However, a small number of providers continue to teach programmes online when this is not in the best interest of learners – thereby limiting their development of knowledge and skills, as well as their opportunities to socialise.
1.3 Looking forward
This year we launched our new 5-year strategy. It is not easy to anticipate the priorities and challenges of the years ahead. But we know we want to emphasise early years education. We want every child to have the best start in life. We must keep stressing the value of early education: from speech development to socialisation; physical dexterity to counting.
As children progress to primary school, it’s imperative that they learn to read as soon as possible. There are still too many children coming to the end of primary school unable to read fluently. Reading is the gateway to learning.
At the other end of the age range, there have been big changes – particularly with the introduction of T levels in 2020. Our interim report showed that not all students felt prepared for the demands of these courses, which may in part be a consequence of COVID disruption.
We also reviewed skills bootcamps this year. We praised bootcamps that made good use of local intelligence to meet skills needs; and we also pointed out a number of challenges with the teaching and evaluation of some courses.
As we look to the future, we have begun enhanced inspections of colleges, looking at how they contribute to local skills needs. In time, we are likely to see more courses commissioned by mayoral and combined authorities, as skills funding is devolved to regions.
The landscape in which we work is ever-shifting. We are determined to keep pace with sector changes, in every area of our work. We will need the government’s support to do so.
For the most part, we continue to inspect and regulate individual institutions. We inspect schools individually – but nearly 4 in 10 of them are in multi-academy trusts (MATs), and trusts are becoming larger. These trusts have a huge influence on how children are being educated, so we would like to be able to assess how this influence is being used.
We inspect and regulate individual nurseries – but around half are part of a group, with many owned and operated by large national or international providers. There is no scrutiny of these owners.
A lot of attention has been given to private ownership of children’s homes, particularly the increasing influence of private equity groups. Yet, as the regulator, we must consider each children’s home in isolation, without reference to the home’s ownership. This is a significant gap in system oversight.
Furthermore, the market-driven supply of homes does not match the pattern of demand across England. It can also destabilise the system. Good homes can lose their staff if another home opens nearby paying more. That has damaging consequences for children, who need stable relationships in their lives.
We continue to talk to the government about accountability and regulation across our sectors. We have made our own recommendations for regulatory changes in many areas. We are also contributing to the government’s academy regulatory and commissioning review, its reform work for children’s social care and its review of the SEND system. Our MAT summary evaluations (MATSEs) have already laid some of the groundwork for a better-balanced regulatory system for schools.
Where we can make improvements without the government’s help, we do so. Our joint targeted area inspections were redesigned last year to make them more agile and bring greater focus to particular areas of interest. We are currently in the process of revamping our area SEND inspections. And our research into care leavers’ experiences last year highlighted how few of them knew about the support for which they are eligible. It is alarming that more than 4 in 10 care leavers aged 19 to 22 years old are not in education, employment or training; among all 19- to 22-year-olds, that figure is just over 1 in 8. So we are adding a separate judgement, assessing the experience of care leavers, into our local authority inspection framework.
1.4 Focused attention
As we keep pace with sector changes, we also continue to highlight particular areas in need of attention.
From the earliest weeks of the pandemic, we expressed our concerns about children who were out of sight. When schools were closed to most children, we spoke about the risks for those enduring a chaotic home life. With the school experience now restored, there are children who continue to be largely invisible to authorities.
For the last 6 years we have highlighted the plight of children at unregistered, illegal schools. Most of these places offer, at best, a poor standard of education and a narrow curriculum. At worst, they are simply unsafe. The government has indicated that it will give us greater powers to seize evidence and tackle illegal schools. This is very welcome and we hope the measures come to fruition.
The government also plans to create a register of home-educated children – something we have long supported. The Association of Directors of Children’s Services survey in 2021 estimated a 7% increase in elective home education compared with 2020. Some of these children may well return to school, but others will continue their education at home. A register is important because it records who is taking responsibility for a child’s education, and where it’s happening.
Children who are permanently excluded from a mainstream school, or whose needs are not met there, usually continue their education in alternative provision (AP). Registered AP, such as pupil referral units, are inspected by Ofsted and in most cases are graded good or better. But there is a large unregistered AP sector that sits outside regulation and inspection. Many young people with SEND attend unregistered AP. This is unsatisfactory and can even be dangerous. We would like to see compulsory registration for all AP.
In previous reports I have spoken about the practice of off-rolling – removing children from a school roll without the due process of a formal exclusion. The pandemic has obscured trends in exclusions and off rolling, so it is harder to tell if off-rolling is still a problem.
However, there is anecdotal evidence that part-time timetables are being used more regularly in schools. This is where children attend school, but their attendance is limited to a handful of lessons. This might be held up as an alternative to exclusion, but it is another avenue by which children can slowly slide out of education.
Attendance since the pandemic has been the subject of much discussion. There were undoubtedly problems getting children back into school early in the year. Initial high levels of absenteeism have fallen, but there are still concerns about a smaller number of persistent absentees. For a minority of families, the social contract around schooling – attendance in return for education – has become fractured, perhaps tested by periods of lockdown. It is vital that all parents commit to full attendance for their children.
Away from education, we have long been concerned about unregistered children’s homes. These typically operate in the grey area where care for children transitions into support for those preparing to leave care. Too many unregistered homes are providing care but avoiding scrutiny. In 2021/22 we looked into 595 possible unregistered homes. We found that 92% should indeed have been registered with us, and must register or close. While we use our existing powers to address the problem, we continue to talk to the Department for Education about increasing the options available to us, so that we can take swift action.
There are enormous issues with the children’s homes market, as described earlier. They are scattered unevenly, often concentrated where housing is cheapest and lacking where house prices are high. As a result, demand far outstrips supply in many areas. Children are often placed in unregistered homes because local authorities can find no alternatives. This may be a reason, but it cannot be an excuse. These children are being let down by a system that is stretched too thinly.
Children with the most complex needs are often the least well served in already overstretched systems.
For example:
-
by the end of March 2022, around 50 children were waiting for a place in a secure children’s home – double the previous year
-
homes that can take children with acute mental health needs are in short supply
-
less than half of the independent specialist colleges inspected this year were judged good or outstanding
-
over half of local area SEND inspections required a written statement of action
-
child protection arrangements across the country were put under renewed scrutiny, following the harrowing and high-profile murders of children known to social services
Local authorities continue to manage an unprecedented influx of unaccompanied asylum-seeking children. This presents a mounting challenge and has given rise to the worrying phenomenon of children living in hotels block-booked by the government, with limited oversight and safeguarding. This deficiency has been highlighted by recent stories of children going missing.
In a section about areas for attention, it would be remiss not to mention prison education. Every year we report that it is the worst performing sector we inspect. If anything, it has become worse still. The pandemic had a chilling effect on prison education and the thaw is yet to come. This year half of the prisons we inspected were judged inadequate and 10 required improvement. Only one was judged good. We also published a joint review of reading in prisons with His Majesty’s Inspectorate of Prisons. It highlighted how far prison education still has to go – even on something as fundamental to rehabilitation as reading. More must be done.
1.5 Sector workforce
Many of the problems highlighted in this report are either created or exacerbated by workforce and resourcing problems. If education and social care are to be resilient in the face of future challenges, these problems must be addressed.
There are a number of pressures on the early years sector. Registered childminder numbers have fallen sharply, either because of a fall in demand as parents work from home, or as childminders take work in better-paying sectors.
There are issues in the nursery sector too. We have seen nursery chains grow too fast and then face closure because they cannot recruit or retain high-quality staff. More nurseries lack enough qualified and experienced staff and become over-reliant on apprentices to fill gaps. That has a knock-on impact on the quality of their early education, as well as their safeguarding expertise.
Recruiting and retaining good staff are arguably the biggest challenges in the social care sector as well. This is as true for social workers at local authorities as it is for residential workers in children’s homes. Care workers in homes are often tempted away by alternative employment in retail or hospitality, while many local authorities increasingly rely on agency staff to make up their numbers of social workers. Agency workers often have agreed terms and conditions, including more remote working, which can affect the quality of relationships they build up with children and their level of local knowledge. They often have agreed workloads and are more expensive than permanent staff, which can lower the department’s overall headcount and capacity.
Teacher recruitment continues to be a frustration for leaders in schools, colleges and independent learning providers. Schools also report shortages of teaching assistants. Colleges are finding it difficult to recruit tutors in many areas. Fewer college staff can result in larger class sizes of mixed abilities, making it difficult to pitch the training at the right level.
In more positive developments, the government has made changes to the training and development of teachers, to bring more coherence to the system. There is now a clear thread running from initial teacher education (ITE), through the early career framework (ECF) and into national professional qualifications (NPQs). This year was the first full year of ITE inspections under the new framework, which puts a firm focus on curriculum. There have been positive judgements in early years and schools ITE, but too many further education and skills ITE providers were judged less than good. We also published our new framework for inspecting the subsequent professional development and training for teachers. Early signs are positive.
Professionals working in education and social care are extremely valuable. We entrust them with our children, to help them learn and keep them safe. And successful teachers, carers, tutors and trainers all play their part in supporting the economy and advancing society. The sectors need to be able to recruit and retain talented and capable people.
1.6 In conclusion
Last year’s report described the pandemic impact on education and social care and this year’s report describes the extent of recovery. It remains a work in progress.
Our inspections show an improving picture in schools and further education. But the lasting impact of lost education will take time to reveal itself fully, in terms of achievement as well as any longer-term harm to mental or physical health. The attainment gaps in this summer’s exam results show us the scale of the task that lies ahead.
Early years providers are adjusting their work with the youngest children, within the context of cost-of-living pressures and demands for more affordable childcare. In social care, an overstretched workforce is struggling with growing demand.
We must also look forward. The economic outlook is uncertain and the cost of living is rising. This will affect sectors still recovering from the effects of the pandemic. The gains made over the last year must be consolidated quickly.
This generation of young people has lacked stability in recent years. We owe them as much security and certainty as we can provide for what remains of their childhood. And we must offer those children, and older students too, the education, training and opportunities they need to secure their future.
2. Early years and childcare
‘Early years’ refers to the education and care of children from birth to 5 years old. This includes childminders, nurseries and pre-schools.[footnote 1] It also includes maintained nursery schools, as well as Nursery and Reception classes in schools.[footnote 2]
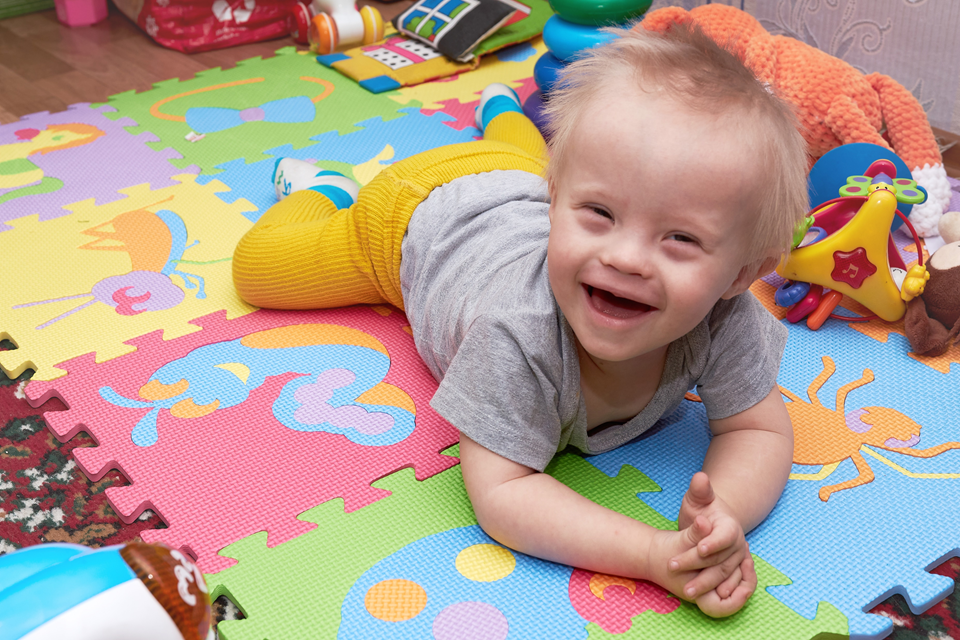
Every child deserves the best start in life. The experiences children have in their first 5 years are crucial for their future well-being, learning and development. High-quality early years education and care have a positive impact on children’s attainment up to the end of secondary school.[footnote 3] Disadvantaged children benefit significantly from good-quality pre-school experiences.[footnote 4] This is why ‘the best start in life’ is one of our strategic priorities. We want to make sure that we have good evidence about what constitutes high-quality early years education, including curriculum and pedagogy, and act on it.
Ofsted inspects and regulates around 65,600 early years and childcare providers that are on the Early Years Register (EYR) and the Childcare Register (CR):
-
The CR is split into 2 parts: the Compulsory Childcare Register (CCR) and the Voluntary Childcare Register (VCR). The CR includes 4 types of childcare provider: childminders, nannies, childcare on domestic premises, and nurseries and pre-schools. Providers who care for children aged 5 to 8 are part of the CCR. Providers who care for children over the age of 8 can choose to register on the VCR. Nannies and other providers that look after children before and after school can also choose to join the VCR. We inspect 10% of CR providers to check that they are meeting registration requirements.
-
Registration on the EYR is compulsory for most childcare providers that look after children from birth to age 5. It includes nurseries, pre-schools, holiday clubs, childminders and other private provision on business premises. We use the education inspection framework (EIF) to inspect providers on the EYR against the principles and requirements of the early years foundation stage (EYFS) framework.


View data in an accessible table format.


2.1 State of the nation
At their most recent inspection, 96% of all EYR providers were judged good or outstanding. This is slightly lower than last year (97%). There is little difference between the proportion of good and outstanding childminders (97%) and nurseries and pre-schools (96%).

View data in an accessible table format.
2.2 What we did this year
During 2021/22, we returned to a full programme of inspections after the pause during the pandemic. We carried out 11,700 inspections of EYR providers. We also inspected 410 CR providers.
Most EYR providers have a full inspection and are given a graded judgement for overall effectiveness. They receive separate judgements for the quality of education, behaviour and attitudes, personal development, and leadership and management. The remaining providers are given a judgement of met or not met because they are out-of-school settings or had no children on roll at the time of the inspection.
Of the EYR providers who had a full inspection this year, 83% were judged either good or outstanding overall. All of these providers were judged good or outstanding for their quality of education. The proportions of individual key judgements that were good or outstanding were: 83% for leadership and management; 84% for personal development; 86% for quality of education; and 87% for behaviour and attitudes.


View data in an accessible table format.
2.3 Overall effectiveness of providers over time
When we resumed graded inspections, we prioritised providers that were:
-
judged less than good at their last inspection (including those that received an interim visit in autumn 2020)
-
registered recently and not previously inspected
-
overdue for their first inspection
-
not inspected in the last inspection cycle because of the pause in routine inspections
This selection process meant that fewer providers were judged good or outstanding in 2021/22 than in 2019/20. The gap in the quality of education also widened between outstanding and weaker providers.
The fall in the proportion of good and outstanding judgements is not entirely unexpected, given that we prioritised providers that had not been inspected recently or were previously graded less than good.
The proportion of EYR providers judged good or outstanding overall fell by 6 percentage points, from 89% in 2019/20 to 83% this year. 2019/20 was the last year of routine inspections before they were suspended in March 2020. The greatest decline has been among those providing education and care in nurseries and pre-schools. The proportion of nurseries and pre-schools judged good or outstanding has fallen by 6 percentage points, from 85% in 2019/20 to 79% this year.

View data in an accessible table format.

2.4 Impact of the pandemic
As children return to early years settings, we are seeing the longer-term impact of the pandemic and the effect that missing early education has had on them. There were signs of this last year, but now it is clearer where children have fallen behind, and what longer-term challenges providers face in helping them to catch up.
During the pandemic, children’s absence from early years settings and delays in routine health checks meant that early speech and language problems were not picked up as they might have been previously. Young children’s communication and language development is still affected. Many providers have noticed delays in some children’s speech and language development and they are making more referrals for specialist help with speech and language than previously.
The pandemic has also had a negative impact on children’s personal, social and emotional development (PSED). Some children’s social skills are less advanced than they might otherwise have been at their age. These include the skills needed to make friends, to become more confident and to communicate with adults. They have missed out on socialising with other children and adults, and lack confidence during social interactions. Some children are taking longer to settle into a nursery or with a childminder, and they need a lot of support to share and take turns. The foundations of future learning, and of thriving at school and beyond, include being able to share, take turns and build relationships with adults and other children. Without these skills, children may be less prepared for the Reception Year.
2.5 Pandemic recovery
Early years providers now focus more on addressing the gaps in children’s learning. They are identifying the children who have missed opportunities in their learning, and are helping them to catch up by:
-
creating more opportunities for interactions between adults and children that help children to develop speech and language
-
refocusing their curriculum on language and communication, for children who have fallen behind in language development
-
creating more opportunities for staff to read to children and talk to them about the books they read
-
providing opportunities in day-to-day routines to develop social skills, including tasks such as cutting and sharing fruit and laying tables for lunch
-
providing as many opportunities as they can for children to mix with others and build their confidence in social situations
Some providers have realised that children need to be better prepared for the start of the Reception Year. They are teaching children the PSED skills they will need to move successfully to school. These include helping children to make friends, building children’s confidence and increasing their independence.

2.6 Early years curriculum and pedagogy
We have been talking about the importance of curriculum for several years now. Some early years providers have a better understanding than others of the concept of curriculum. These providers know to plan a curriculum that defines what they want children to learn and be able to do. However, the weakest providers often do not know what a coherent curriculum looks like, or how to implement it. Where providers struggle to implement a curriculum, this may be linked to recruitment issues and reliance on less-experienced staff.
This year we published the first in a series of early years research reviews. These reviews are building on our previous published work on teaching and learning in the early years.[footnote 5][footnote 6]
Part 1 of the research review covers the early years context and workforce, and describes the features of high-quality early years curriculum and pedagogy for children aged from birth to 4.
One of the important messages in this review is that practitioners should prioritise curriculum planning, and decide what children need to learn, before they plan children’s activities and experiences. Children’s interests alone should not determine what they need to learn, but practitioners should be responsive to children’s interests when deciding how to teach the curriculum. This is important so that children have the opportunity to develop new interests and learn new knowledge, and so that the curriculum does not begin to narrow for them.
The review also reiterates the importance of play, and skilful adult intervention in play, as part of high quality learning in the early years. Explicit teaching followed up by practice and reinforcement through play can also be very effective, especially when introducing children to new knowledge.
2.7 Caring for the youngest children
In the first 3 years of life, a child’s brain develops faster than at any other time.[footnote 7] During these years, children’s language development and their social and emotional development are particularly sensitive to their experiences and interactions with other people and the world.[footnote 8]
Children born since March 2020 have lived most of their life during the pandemic. They missed out on many vital early experiences and interactions because of the disruption to family life, early education and childcare provision. They were not able to socialise widely with other children and adults, and could not as easily benefit from high-quality learning experiences in early years settings.
Many 2-year-olds started government-funded childcare with lower levels of communication, language and social skills than they would have had in the past.[footnote 9]
Seventy-two per cent of eligible 2-year-olds were registered for a funded childcare place in 2022. This take-up rate is now back to where it was in 2018, after a decrease between 2019 and 2021.[footnote 10] Nevertheless, some of the most disadvantaged children do not access the free education they are entitled to. Providers say families are not always aware of funded places because of the disruption to routine contact and support from health and education services.

2.8 Workforce challenges
Many providers have faced ongoing challenges in recruiting and retaining qualified staff. Nurseries had problems retaining high-quality, qualified and experienced staff before the pandemic and this is getting worse. The early years sector is competing with, and losing out to, higher paid or more flexible employment. Staffing problems have not affected the profile of inspection judgements so far, but may affect quality in the future if experienced and qualified staff continue to leave.
Many providers who leave the sector after a considerable time take with them a wealth of experience, knowledge and commitment to children. Two thirds of childminders who have responded to our post-resignation survey since March 2020 were judged good or outstanding in their most recent inspection.
Problems with recruiting and retaining staff can lead to a lack of continuity and consistency in education and care for children. The EYFS framework highlights the importance of quality and consistency in providing the right foundation for children aged under 5.
Some providers are not managing the impact of staffing challenges as effectively as others, and in the best interests of children. We have seen examples where leaders had not considered having their better qualified, more experienced staff working with all ages of children, rather than just with older, pre-school children.
Nurseries that are part of a multiple provider group have typically managed staffing better.[footnote 11] They were more able to keep experienced staff and could balance staff across different nurseries. They provided training for staff, who learned from seeing and sharing good practice in other nurseries. Multiple providers used temporary placements across their nurseries to develop staff and improve practice. Some have their own apprenticeship schemes, which has also helped them overcome the shortage of qualified staff.
Our analysis has found a link between the number of staff in nurseries and pre-school settings with higher-level qualifications, and the quality of provision. Outstanding providers have, on average, nearly twice as many staff with a degree-level qualification as those receiving other inspection outcomes.[footnote 12]
2.9 Early years apprenticeships
Early years apprenticeships may provide a way to raise the quality and size of the early years workforce. Currently, there are early years apprenticeships that lead to a qualification at level 2, 3 or 5. The first early years educator apprenticeship standard, at level 3, was introduced in 2019.
Apprenticeships may provide a solution to the problems with recruiting qualified early years staff. However, it is too early to know the long-term impact of apprenticeships on the sector.
There has been a large fall in the number of people beginning children’s care, learning and development (levels 2 and 3), early years educator (level 3) and early years practitioner (level 2) apprenticeships since the standard and framework for each qualification level were introduced.[footnote 13] The number of people beginning relevant apprenticeships at levels 2 and 3 fell from 27,200 in 2016/17 to 16,200 in 2021/22.
There are also concerns about how providers support apprentices, and the training they receive. For example, employers may not always release apprentices for off-the-job training. Given the recruitment challenges in the sector, providers may also use unqualified, unskilled apprentices to replace the skilled, experienced practitioners they have lost.
2.10 Early years registration and regulation
Registration and regulation of providers are an important part of our work. We register anyone who joins the EYR or CR to check that they are suitable to care for, or be in regular contact with, children. This includes VCR providers.
What we did this year
We carried out around 2,240 registration visits during 2021/22. These were to childminders, nurseries and pre-schools wanting to register on the EYR, or, where there were concerns about the applicant’s suitability, on the CR. The majority of visits were to prospective childminders, because they are the largest single group of EYR providers.
We carried out around 6,020 regulatory visits and telephone calls during the reporting period. Ninety-two per cent of these visits were to childminders or nurseries and pre-schools on the EYR.
Regulation of multiple providers
This year we published research into how multiple providers operate, and the direct impact they have on the education and care of young children in their nurseries. In recent years, the number of registered multiple providers that own 2 or more individual childcare settings, such as nurseries and pre-schools, has grown. According to our registration data, around 50% of pre-schools and nurseries are owned by multiple providers.
Our research showed that multiple providers influence the education and care provided at their nurseries by:
-
setting the curriculum and what they want children to know
-
establishing the culture and values
-
writing and reviewing policies
-
visiting nurseries regularly to monitor practice
-
making sure nurseries meet legal requirements
-
monitoring ongoing incidents in individual nurseries
-
providing training for staff
-
moving staff between nurseries so that they can observe good practice
We are subject to the same limitations here as in other remits, namely that our inspection powers cover individual providers, even when a larger organisation is responsible for decision-making and ownership. We will continue to discuss the evolution of the regulatory framework with the government, so that we can provide appropriate assurance at ownership level.
Joiners and leavers over time
Last year we reported that the number of registered providers had fallen steadily since 2015. The decline has continued this year, and the number of places has fallen to 1.28 million, with a net overall decrease of around 5,410 providers. This is the largest annual decrease since 2015/16. The number of places offered by EYR providers has also declined; however, this trend is in the context of a decline in the population aged 7 and under, and a long-term trend of decreasing births.

View data in an accessible table format.
Childminders continue to experience the largest decline in the overall number of providers. There has been a downward trend in the number of registered childminders since the introduction of the EYFS framework in 2008. The majority (67%) of childminders that responded to our post-resignation survey, and had been inspected, had been judged as good or outstanding at their most recent full inspection.


View data in an accessible table format.
This year, 5,590 childminders left the sector, but only 1,530 joined. The decline in the number of providers and available places may in part be caused by the considerable decrease in the birth rate.[footnote 14] There are also more parents working from home, which may reduce demand for childcare places.
Reform of childcare regulation
This year, we are reviewing and improving the way we register people who want to provide childcare. We will remove any unnecessary steps to make the registration process more streamlined, and reduce registration time. We will maintain the same level of scrutiny without compromising safeguarding. We are working to simplify health checks, guidance materials for staff and medical-screening thresholds. The review will make sure we continue to manage the health risk of providers well, and that our processes and materials are proportionate and reflect current medical best practice. We are also considering doing more steps in the registration process at the same time, rather than one after the other. This means we will be able to do the final registration visit earlier in the process, if it is safe to do so.
The Department for Education and other government departments are keen to understand our registration processes, particularly as it continues to deal with cost-of-living increases. It supports the work we are doing to simplify registration, especially where any changes encourage more people to register as childcarers. We continue to work closely with the Department for Education and other departmental officials on these initiatives.
There has been a decline in the number of registered childminders reported year-on-year in our annual reports. We have raised some of the possible reasons for this decline, including the way in which the law requires us to regulate childminders. This year, we amended and republished our early years inspection handbook to clarify the requirements that childminders must meet.[footnote 15]

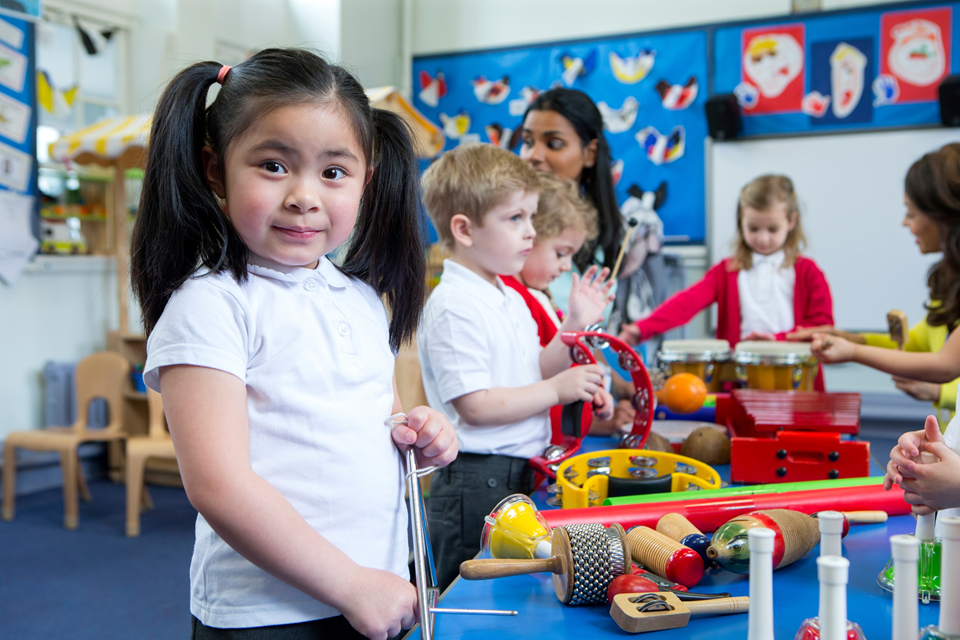
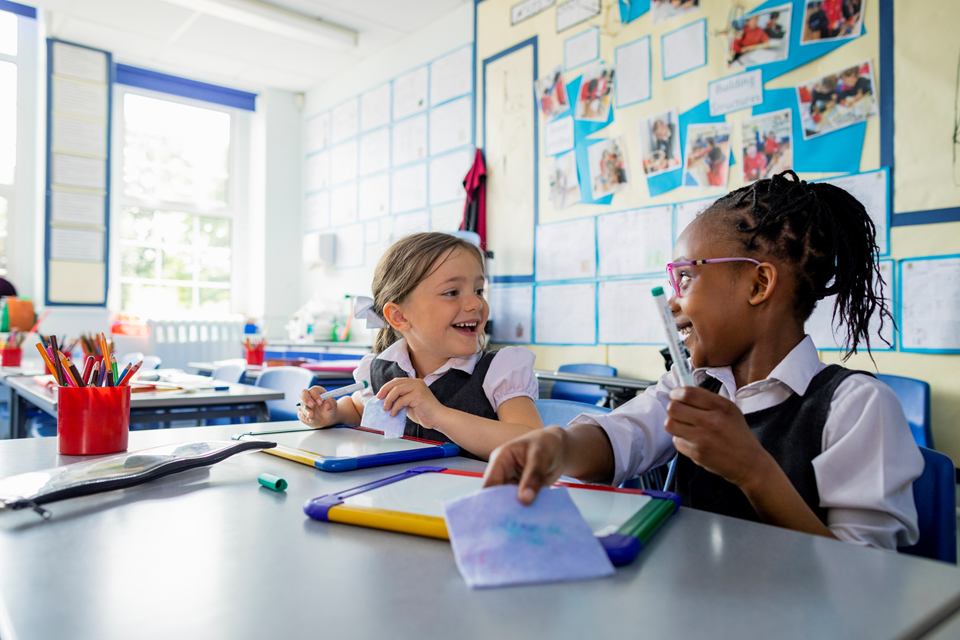
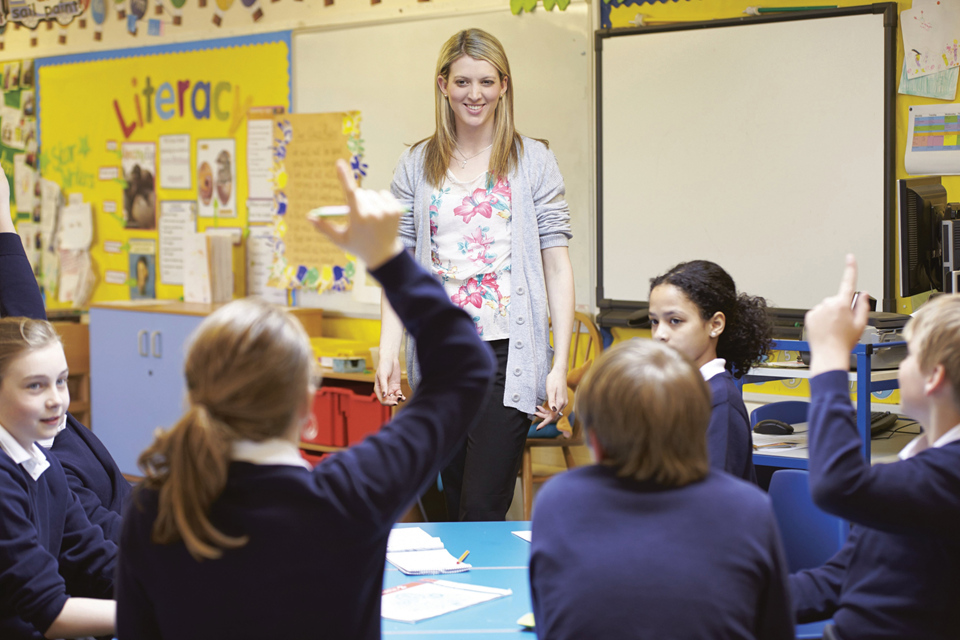
3. Schools
Schools have worked hard to overcome the challenges of the pandemic. This year slightly more schools have achieved a judgement of good or outstanding at their most recent inspection than last year. Nevertheless, COVID-19 continues to have an impact: pupils’ learning, attendance, mental and physical health and personal development remain areas of concern. Schools have also continued to experience COVID-related staff absences and recruitment issues.
For the last 6 years, we have raised concerns about the number of children being educated in unregistered schools. The limitations of existing legislation mean that we lack the powers to investigate unregistered schools properly. We want the power to make sure that pupils are receiving a safe and suitable education and to take action when they are not.
Meanwhile, nearly half of pupils in state-funded schools in England attend a school that is part of a MAT.[footnote 16] The support provided by MATs has been important in helping schools to recover from the impact of the pandemic. As MATs have legal responsibility for, and make significant decisions about, children’s education, they should be subject to the appropriate accountability.
In 2021 we published our review of sexual abuse in schools and colleges, which highlighted the prevalence of abuse and provided recommendations for schools and colleges.[footnote 17] We updated our education inspection handbook and practice from September 2021, to clarify how inspectors assess the way schools and colleges confront sexual harassment, abuse and violence among children and young people. We have provided evidence to the Independent Inquiry into Child Sexual Abuse and welcome the publication of the final report. Many of our own concerns are reflected in the findings and we stand ready to work with government in considering their response to the Inquiry’s recommendations.

3.1 State-funded schools
At 31 August 2022, there were around 22,000 state-funded schools, and in 2021/22 we carried out 4,620 inspections. In 2018/19, the last year before the pandemic, we carried out 5,580 inspections of state-funded schools.

View data in an accessible table format.
State of the nation
Overall, 88% of all state-funded schools were judged good or outstanding at their most recent inspection, a slight increase from 86% in 2021.
The proportion of good and outstanding primary schools increased from 88% to 89% this year and the proportion of good and outstanding secondary schools increased from 77% to 80%. This was mainly because a large number of schools that previously required improvement were judged good this year. This more than offset, for example, the smaller number of previously exempt outstanding schools that were judged as requires improvement or inadequate.

View data in an accessible table format.
We are concerned that 64% of all schools have not had a graded inspection in the last 5 academic years, and 14% have not had one in the last 10 academic years.[footnote 18] This is due to a combination of factors, including:
-
most inspections of good schools since 2015 have been ungraded inspections
-
outstanding primary and secondary schools were exempt from routine inspection between 2012 and 2020
-
routine inspection was paused for 18 months due to the pandemic
-
schools that become academies are not reinspected until their third year as an academy, irrespective of the date of their last inspection
Ungraded inspections do not change the underlying judgements of quality of education, behaviour and attitudes, personal development, and leadership and management. As a result, they leave parents, governors, local authorities, school trusts and central government with a limited understanding, and sometimes an outdated profile, of the strengths and weaknesses of a school.
In 2021/22 we fully restarted all types of inspection. We resumed routine inspections of all outstanding schools and increased the proportion of good schools that receive a graded inspection. This means that the length of time since each school’s last full graded inspection will gradually decrease.
What we did this year
The pandemic continued to affect the inspection programme. This year we carried out 4,620 inspections, compared with 5,580 in 2018/19 (the last full year of inspection activity before the pandemic). Due to a rise in the number of COVID-19 infections, we stopped inspections a week earlier than planned in December 2021. We restarted in January 2022, but with a limited programme for the first half term that did not draw on contracted inspectors who worked in schools. This avoided placing any extra burden on schools in a period that was likely to see high staff absence.[footnote 19]
In autumn 2021 and spring 2022, we invited schools to ask for an inspection deferral if they were significantly affected by COVID-19. Most schools did not ask for a deferral, and we approved most requests. In the first half of the school year, 262 inspections of state-funded schools were deferred for this reason.[footnote 20] Deferred inspections are usually rescheduled as soon as is practical, and most were completed by the end of the academic year.
Nearly three quarters of the graded and ungraded inspections carried out this year were of schools previously graded good or outstanding. The type of inspection an outstanding school receives is generally determined by the length of time since its last graded inspection. For good schools, it is based on a risk assessment of the likelihood of the judgement declining. In addition to graded and ungraded visits, some schools that were previously judged as requires improvement or inadequate had a monitoring visit.
Table 1: Number of inspections by previous grade and type of inspection, 2021/22
| Previous grade | Graded inspections | Ungraded inspections | Monitoring and urgent inspections | Total |
|---|---|---|---|---|
| Outstanding | 400 | 200 | 4 | 600 |
| Good | 790 | 1,900 | 35 | 2,730 |
| Requires improvement | 860 | 0 | 75 | 930 |
| Inadequate | 220 | 0 | 86 | 310 |
| No previous inspection | 52 | 0 | 0 | 52 |
| Total | 2,330 | 2,090 | 200 | 4,620 |
1. Includes 2021/22 inspections with a report published by 7 October 2022.
2. Numbers over 100 are rounded.
Sixty-eight per cent of state-funded schools that had a graded inspection were judged good or outstanding overall. However, many good and outstanding schools had an ungraded inspection rather than a graded one, so are not included in this data. This means that these figures are not representative of the sector as a whole, and exclude many of the stronger schools visited this year.
The proportion of key judgements that were good or outstanding at these graded inspections was 70% for the quality of education, 73% for leadership and management, 84% for behaviour and attitudes and 88% for personal development. The relationship between these different judgements (for instance, the close alignment of the grades for quality of education and overall effectiveness) is similar to that seen in 2019/20.
Only small differences were observed between most primary and secondary key judgements, but there were some noticeable differences in judgements for behaviour and attitudes, where 89% of primary graded inspections were judged good or outstanding, compared to 72% of graded secondary school inspections.
Of the schools with early years provision (such as Nursery and Reception classes) that received a graded inspection this year, 80% were graded good or outstanding for that provision.
Of the schools with sixth forms that received a graded inspection this year, 84% were graded good or outstanding for that provision.

View data in an accessible table format.
Inspections of previously exempt outstanding schools
Schools that were previously judged outstanding are now being inspected routinely, and we are pleased to return to schools that have not been inspected for a long time.[footnote 21] All formerly exempt schools will be inspected before August 2025, and we are prioritising those that have gone longest without an inspection.
In 2021/22, we inspected nearly 500 schools that were previously exempt.[footnote 22]
Schools that had last been inspected before September 2015 had a graded inspection. Of these, 17% retained their outstanding grade, while 21% were judged requires improvement or inadequate. The remainder were judged to be good. A higher proportion of these previously exempt schools are now inadequate or requires improvement than is the case for all schools nationally (see Figure 8).

View data in an accessible table format.
Some outstanding schools are excelling, but others have fallen behind. Most schools that did not retain an outstanding grade were also judged less than outstanding for the quality of education, and leadership and management. In some schools that did not retain an outstanding grade, the curriculum was not accessible for all pupils, in particular those with SEND.
Safeguarding was a weakness in a small number of schools. We also found that some previously outstanding schools that had relied on strong performance data to achieve an outstanding judgement had not demonstrated the necessary substance and integrity under the scrutiny of an EIF inspection.
In early 2023, we will publish a fuller report on the findings from the first year of reinspecting formerly exempt outstanding schools. This final report will build on the quantitative analysis, with additional qualitative analysis looking at the reasons why formerly exempt outstanding schools are no longer outstanding.

View data in an accessible table format.
Schools graded outstanding after September 2015 usually receive ungraded inspections. These inspections cannot change the school’s overall effectiveness grade, but can flag concerns that the school may no longer be outstanding. We carried out 130 ungraded inspections of previously exempt schools, and recorded this concern in 59% of them. These schools will receive a graded inspection about 12 months after the ungraded inspection.


View data in an accessible table format.
Schools that required improvement
Over 800 of the graded inspections this year were of schools that had previously been judged requires improvement. Of these, 70% had improved to good or outstanding, compared with 56% in 2019/20.
Improvement this year was most noticeable among secondary schools. Sixty-six per cent of formerly requires improvement schools improved, compared with 42% in 2019/20. Of the primary schools inspected this year, 72% improved from requires improvement, compared with 62% in 2019/20.

View data in an accessible table format.
We reviewed 30 published inspection reports and held focus groups with a number of inspectors to understand the reasons for improvement in secondary schools. Fifteen of the reports were from schools that had not improved from requires improvement at their most recent inspection.[footnote 23]
During the pandemic, some schools paused, reassessed and reset their curriculum.
Schools that improved:
-
made sure that their curriculum was ambitious and well sequenced
-
identified the precise knowledge that they wanted pupils to learn
-
had leaders and governors with a clear understanding of what the school did well and how it could improve
-
gave staff opportunities to share expertise and access subject-specific professional development and networking opportunities
In the schools that had not improved, leaders and teachers had not sufficiently identified the core knowledge that they wanted pupils to know and remember. The needs of some pupils with SEND were also not fully met in some schools.
Inadequate schools
We inspected 220 schools that had previously been judged inadequate. Of these, 2% improved to outstanding, 63% improved to good, and 29% went up to requires improvement. It is encouraging to see that just 5% stayed inadequate, a decrease from 8% in 2019/20.
The relationship between performance data and inspection outcomes
School performance data, including test and qualification results, is an important consideration during inspections. However, in 2019/20 and 2020/21 pupil outcomes were recorded on the basis of teacher assessments, with little or no external moderation or standardisation. Recognising the consequent limitations, the Department for Education did not publish school-level outcome data for either year, nor was it made available to Ofsted for accountability purposes. In 2021/22, we inspected with no outcome data more recent than 2018/19. Inspectors continued to use a range of contextual data, such as attendance data.
In the past, we have analysed the relationship between performance data and inspection outcomes.[footnote 24] Performance data for 2021/22 is once again based on exam results, and so we have looked at key stage 2 and key stage 4 performance data against the inspection outcomes for the year.
This performance data was not available to inspectors at the time of the inspections, so could not have affected outcomes. However, as we would expect, there continues to be a relationship between performance data and inspection outcomes. This is because a good quality of education, as assessed by inspection, will normally lead to good outcomes. So the average performance data scores for outstanding schools are notably higher than those for inadequate schools. Nevertheless, just as we saw in earlier years, this is not a rigid relationship.
Performance data for inadequate schools (in particular primary schools) shows wide ranges, including for schools with high performance data. These results can be driven by the schools being judged inadequate on safeguarding grounds. A school that is judged inadequate for safeguarding will be judged inadequate overall, regardless of its performance.


View data in an accessible table format.

View data in an accessible table format.
Although there is a correlation between 2021/22 performance data and 2021/22 inspection outcomes, it is not a strong relationship. Nevertheless, data for outstanding schools is typically different to those for good schools, particularly at key stage 4 where interquartile ranges (represented by the shaded boxes in Figures 14 and 15) do not overlap.[footnote 25]
The relationship between performance data and inspection outcomes in 2021/22 is broadly similar to that in 2018/19.[footnote 26] In 2018/19, inspections were carried out under the common inspection framework, which preceded our current EIF and placed more emphasis on performance data. It is encouraging to see this year that, despite us inspecting under the EIF without using internal performance data, outstanding and good schools continue to correlate with higher Progress 8 scores at key stage 4.
Attendance
COVID-19 has continued to affect pupils’ attendance this year, due to anxiety among pupils and parents, and families taking rescheduled holidays during term time. In some cases, attendance has also been affected directly by illness or pupils self-isolating.
Pupils missed fewer sessions in autumn 2021 than in autumn 2020. Total absence fell from 11.7% in autumn 2020 to 8.5% in autumn 2021. Of the 8.5%, 1.6% is attributed to COVID circumstances. This is down from 7% in autumn 2020.[footnote 27] However, the absence rate is still much higher than in autumn 2019, when it was 4.9%.
Total absence rates were highest among pupils in Year 12 and above (14.3%), Year 11 (11.4%) and Year 10 (11.0%) compared to pupils across all year groups (8.5%). Pupils in Year 3 had the lowest rate of overall absence (7.0%).
However, the number of pupils identified as persistent absentees increased. In autumn 2021, almost 1 in 4 pupils missed at least 10% of sessions, equivalent to around 7 days in the autumn term. Persistent absences were highest in Year 11 (31.7%). Fourteen per cent of all pupils missed 10% or more sessions due to illness alone, including positive cases of COVID-19. It is particularly concerning that around 1 in 70 pupils missed 50% or more possible school sessions in autumn 2021, up from around 1 in 120 in autumn 2019.
Schools that were successful in securing good attendance:
-
set high expectations for attendance from the outset, and communicated them clearly and consistently to parents and pupils
-
challenged parents if attendance was a concern, but also listened to parents to understand what was preventing their child from attending school
-
analysed attendance data to understand patterns and trends, which helped them to target their actions

Exclusions and suspensions
The most recent national data on exclusions and suspensions shows that, in 2020/21, the permanent exclusion rate was 5 exclusions in every 10,000 pupils. This is down from 6 exclusions in every 10,000 pupils in 2019/20.[footnote 28]
This year, there were 352,500 suspensions. This is an increase compared with last year (310,700 in 2019/20), but is still lower than pre-pandemic levels (438,300 in 2018/19). In 2020/21, there was an increase in secondary school pupil suspensions (17%), but a decrease in both primary (2%) and special school (1%) pupil suspensions.
As in previous years, exclusion and suspension rates are higher for boys, disadvantaged pupils and pupils with SEND than for other pupils. The main reason for permanent exclusions and suspensions continues to be persistent disruptive behaviour, followed by physical assault against a pupil or adult.
Unusual pupil movement between Year 10 and Year 11
Pupils sometimes move between schools because of off-rolling. This is when a pupil is removed from a school, without a formal exclusion, for the benefit of the school rather than because it is in the pupil’s best interests. We compared the school census data from January 2020 with the data from January 2021 to identify pupils who had changed school between Year 10 and Year 11. It is encouraging to see that last year fewer schools (160) had exceptional levels of pupil movement compared with 2020 (320).[footnote 29] The 2020 and 2021 performance data was not used for accountability, which may mean that schools have had less incentive to off-roll pupils.
But data alone does not tell us why pupils moved, and this is why it is important to have conversations with schools leaders as part of inspections. We also know that pupil movement is not always a cause for concern. There may be legitimate reasons for high levels of pupil movement, such as a school being located near a military base. This is why it is important to discuss unusual pupil movements in inspections.
Schools with exceptional pupil movement are highlighted to inspectors in the inspection data summary report used during inspections. Schools found to be off-rolling are likely to be judged inadequate for leadership and management. We continue to analyse pupil movement to monitor changes over time.
3.2 Impact of the pandemic (all schools)
This year we published a series of briefings on the ongoing impact of the COVID-19 pandemic and how schools were responding to the challenges. These briefings were based on our findings from routine inspections, and discussions with school inspectors.
Pupils’ learning and personal development were affected this year. In autumn 2021, pupils arrived at school with a wider range of starting points than in previous years. By summer 2022, some pupils had caught up. However, some were not where they needed to be for their next stage of education, employment or training.
In many primary schools, children in Reception, Year 1 and Year 2 are still catching up. For example, speech and language development is behind compared to before the pandemic. Some pupils in Reception are not as used to sharing and taking turns, and more work is needed to develop pupils’ listening skills. In the key stage 2 national curriculum tests, pupils’ attainment fell in all subjects, other than reading, between 2019 and 2022.[footnote 30]
Some Year 6 pupils were not as ready for secondary school as they usually would be, and their transition to Year 7 was affected. Secondary schools highlighted concerns about some Year 7 pupils still catching up on learning from key stage 2. This was especially evident in reading.
Careers information, education, advice and guidance (CIEAG) was varied in schools this year. Some Year 11 and Year 13 pupils had missed opportunities for work experience before they left school. Work experience was often difficult to set up because employers were reluctant to offer placements. Some schools had organised alternative opportunities, including virtual work experience and work experience within the school or trust.
We are reviewing the quality of CIEAG in schools and further education and skills providers, and will publish our findings in autumn 2023. As well as in mainstream schools and further education and skills providers, we will also review careers guidance in specialist settings, including special schools and alternative provision. We will make research visits to a sample of schools and further education and skills providers in spring and summer 2023. In these visits, we will consider how providers ensure that learners get high-quality careers provision and how well they engage with employers, career networks and other providers.[footnote 31]
The impact of the pandemic on some pupils’ mental health and well-being has remained a concern this year. Schools have reported that pupils are more anxious, especially about exams and socialising with peers. Many schools have found accessing external support services difficult. Services were unable to go into schools or provide the same level of face-to-face support as before. Waiting lists for services are long. This has placed an extra burden on schools.
Staff absence was also an issue, with the spring 2022 term being particularly challenging. It was difficult to recruit supply teachers because of high demand and many schools used their own staff to cover absences, which increased workloads. Staff absence prevented some schools from providing enrichment activities, interventions and catch-up programmes.
3.3 Pandemic recovery
Schools have worked hard to respond to the challenges of the pandemic, and to help pupils catch up. Many schools are using effective strategies, such as:
-
Assessment – schools use regular, informal and targeted assessment to identify what pupils remember and to inform teaching. They assess pupils to identify those who need extra help. We see weaker practice when schools use standardised tests that are not as effective at identifying specific gaps in pupils’ knowledge.
-
Catch-up – schools are giving pupils opportunities to revisit learning and consolidate their knowledge. Pupils who need extra help are being supported through one-to-one or small-group work.
-
Curriculum – staff have a clear understanding of the curriculum and strong subject knowledge. Schools are focusing on helping pupils to catch up in core subjects.
Curriculum enrichment activities have resumed, including opportunities that had been put on hold, such as clubs, inviting external speakers into school, day trips and residential trips.
In many schools, poor behaviour following lockdowns has been addressed or schools have seen improvement in pupils’ behaviour. However, in some schools, pupils’ levels of engagement and ability to stay on task have continued to be worse than before the pandemic.
In 2021, the Department for Education commissioned us to review the National Tutoring Programme (NTP) and the 16 to 19 tuition fund. The schemes aim to provide high-quality tuition to help children and young people affected by the pandemic to catch up. Our review, which is continuing this year, is assessing the progress and, where possible, the effectiveness of the tutoring provided through these schemes.[footnote 32]
We have found that, in the first instance, schools typically considered using a tuition partner as the government envisaged. However, most schools have shifted to using school-led tutoring. This is because it gives them more autonomy in setting up tutoring and allowing them to control the content of tutoring sessions, to better meet pupils’ academic needs. They could also make sure that tuition was well aligned with the school’s main curriculum.
Schools have considered how to fit tutoring into their normal timetable. Primary schools often provide tutoring during the school day. The strongest schools make sure that this does not disrupt the regular school curriculum too much. Secondary schools tend to provide tutoring before or after school. Attendance can be low when tutoring takes place outside school hours, so it is important for schools to promote the benefits of tutoring to parents.[footnote 33]

3.4 Independent schools
There are 2,420 independent schools in England, which must all meet the independent school standards (ISS).[footnote 34] We inspect around 1,170 of these. The remaining independent schools belong to an association and are inspected by the Independent Schools Inspectorate. Over half of the schools we inspect are special schools (see the chapter on SEND for further information). A quarter are faith schools and the rest are non-faith, typically smaller schools.
In a standard inspection, we check whether the school is meeting the ISS, and inspect it against the EIF. As well as standard inspections, we carry out additional inspections of non-association independent schools when commissioned by the Department for Education. Reasons for these additional inspections include changes to the school’s registration, problems with meeting ISS or complaints about the school.[footnote 35]
Non-association independent schools are inspected on a 3-year inspection cycle. This will restart in January 2023, following the disruption of the original 2018 to 2021 cycle by the pandemic.

View data in an accessible table format.
State of the nation
Overall, 75% of non-association independent schools were judged good or outstanding at their most recent inspection. This is a small decline from last year (78%). The proportion of good and outstanding independent special schools is 81%. This is lower than the proportion of good and outstanding state funded special schools (89%), but higher than other independent schools (69%).

View data in an accessible table format.
At their most recent inspection, 16% of non-association independent schools did not meet all the ISS. Independent special schools are less likely to fail the standards (9%) than other independent schools (22%).
What we did this year
This year, we carried out nearly 460 standard inspections of non-association independent schools. This is similar to the number we carried out in 2018/19 before the pandemic.
Sixty-three per cent were judged good or outstanding overall. This is broadly similar to previous years, excluding 2020/21 when only a small number of inspections were carried out. All of the schools judged good or outstanding overall were also judged good or outstanding for the quality of education. The proportion of schools judged outstanding in 2021/22 was 5%, compared with 9% in 2019/20.
In 27 (71%) schools previously judged outstanding, overall effectiveness had declined. This was generally due to the quality of education, which was judged less than outstanding in 89% of these schools. Most (93%) of these schools were also judged less than outstanding for leadership and management.
This year we inspected 37 schools that had previously been judged inadequate. Of these, 14 had improved to good, 13 were judged requires improvement, and 10 remained inadequate.
Independent special schools vary considerably in size, as well as the type of support they offer. Many offer a combination of educational and therapeutic support. Just under two thirds (64%) of independent special schools inspected this year were judged good. A much smaller number were judged outstanding (7%), and the remaining schools (29%) were judged requires improvement or inadequate.
Of the other independent schools inspected this year, 54% were judged good or outstanding, compared with 60% in 2019/20. Only 4% were judged outstanding, compared with 10% in 2019/20.
This decline is most likely due to the pandemic, although other factors cannot be ruled out. Many other independent schools have limited resources and a small number of staff, or offer a form of specialist or alternative education where a small change in staffing can have a disproportionate impact. Larger schools are more likely to be able to absorb the disruption that COVID-19 has caused to staffing or work patterns.

View data in an accessible table format.
The proportion of schools judged good or outstanding for leadership and management (65%) was slightly higher than the proportion for overall effectiveness (63%). These are similar to the proportions in 2019/20 (63% for both). Behaviour and attitudes and personal development had the highest proportions of schools judged good or outstanding, 89% and 83% respectively. These are both around 3 percentage points higher than 2019/20. The proportion of schools judged good or outstanding for quality of education was 66%, which is again consistent with 2019/20.
Of the independent schools with early years provision, 75% were judged good or outstanding for that provision this year. Of the independent schools with a sixth form, 87% were judged good or outstanding for their sixth-form provision.
In 2021/22, we carried out nearly 240 additional inspections and evaluated around 110 independent school action plans at the request of the Department for Education. Of these, 52 were progress monitoring inspections of schools that had previously not met the ISS. In these inspections, 58% (30) of the schools again failed to meet the standards that we checked. We also carried out 14 emergency inspections, in which 6 schools did not meet the standards checked.
Independent faith schools
The independent faith school sector comprises 3 main religions. Schools with a Muslim faith character or ethos make up 44% of the sector, Christian schools make up 31% and Jewish schools 25%.[footnote 36] Most faith schools (90%) fall into the ‘other independent schools’ category and 30 are ‘special schools’ (see Figure 17). Independent faith schools have worse inspection outcomes than non-faith independent schools and faith schools in the state sector. Of schools inspected, 65% of all independent faith schools were judged good or outstanding compared with 74% of non-faith other independent schools (excluding special schools). In state-funded schools the proportions are more similar, with 90% of faith schools and 87% of non-faith schools judged good or outstanding. The characteristics of state-funded faith schools are often quite different from those of independent faith schools.
As we identified in last year’s annual report, there are 3 main reasons for worse inspection outcomes for independent faith schools:
-
independent faith schools are often small and poorly resourced
-
some of these schools limit the curriculum in areas that they consider to conflict directly with their religion; as a result, their curriculum is insufficiently broad
-
some schools serve communities that want children’s education to prepare them only for life within that community, and this restricts children’s knowledge of the wider world
These issues mean that some faith schools operate in a way that conflicts with fundamental British values and equalities law. These problems are almost never found in state-funded faith schools.
3.5 Curriculum
Publications
We continue to contribute to a growing pool of subject expertise by publishing research reviews. We will also publish subject reports for each curriculum subject:
Research reviews: Set out what we consider to be a high-quality education in each subject, informed by current research.
Subject reports: Inform the school sector, parents and policymakers about what inspection evidence shows about the quality of the school curriculum.
Up to the end of August 2022, we have published 10 research reviews.[footnote 37] These have been welcomed by the sector, with over 550,000 views.
Our work has also fed into our inspectors’ learning and development, giving them a greater depth of subject knowledge. Inspector training has drawn on insights into high-quality curriculums and how to apply the inspection handbook to each subject. This helps inspectors to promote improvement through inspection.
The importance of reading
Being able to read proficiently is the ‘gateway to learning’ in all curriculum areas. Early reading, including the teaching of systematic synthetic phonics, provides the foundation for academic success and lifelong opportunities.
It is encouraging to see that the proportion of pupils reaching the expected standard in reading at age 11 has remained similar to 2019, at 74%.[footnote 38] This reflects the priority given to reading by schools even as the pandemic disrupted teaching. But this still means that around 1 in 4 pupils are not reading at a standard that gives them full access to the secondary curriculum.
There is still more to do to make sure every pupil becomes a proficient reader. Secondary leaders tell us that many pupils are not reading well enough for their age.[footnote 39] Staff in key stages 2 and 3 need expertise in teaching phonics to address weaknesses in reading. If pupils cannot read words accurately and automatically, their comprehension suffers. Their working memory is taken up with reading individual words and they cannot make sense of what they read and cannot recall previous content. As a result, they quickly fall behind their peers in any subject that requires reading, and are unable to access the wider curriculum.
Pupils starting secondary school who are struggling to read age-appropriate books accurately and speedily need urgent help to catch up quickly. Some pupils may have suffered from a legacy of poor phonics teaching or have missed important phonics catch-up teaching in key stage 2. Others may read accurately but without the speed needed for good comprehension. So, it is important that teachers use diagnostic assessments to check which aspect of reading pupils are struggling with so that they can target teaching effectively.
This year we visited 6 high-performing secondary schools to see how they supported struggling readers.[footnote 40] We wanted to know what worked in these schools to identify struggling readers and target additional teaching to address specific gaps in their reading.
In each school, senior leaders:
-
prioritised screening of all new pupils’ reading, and followed this with a diagnostic assessment to identify struggling readers’ specific gaps and weaknesses
-
made sure staff working with struggling readers were trained to teach reading
-
monitored the impact of support on struggling readers’ progress so they could make changes if something was not helping pupils to catch up quickly
-
made sure additional help for struggling readers was part of a wider whole-school strategy and well planned curriculum to improve the reading of all pupils
3.6 Multi-academy trusts
The majority (87%) of academies are part of a MAT. There are 1,180 MATs, which run around 8,620 schools. Eighty-one per cent of MATs run 10 schools or fewer, and around half of MATs run between 2 and 4 schools. Only 28 MATs are made up of more than 30 schools.

View data in an accessible table format.
The number of MATs has been fairly stable since August 2019. However, the number of schools that are part of a MAT has increased from 7,130 to 8,620 in the past 3 years. The typical MAT has grown from 6 schools to 7.
Multi-academy trust summary evaluations (MATSEs)
We did 5 MATSEs this year. Our summary evaluations draw on key themes in the EIF to investigate a MAT’s strengths and areas for improvement. Insights from these have been broadly positive, and show the different approaches MATs take to securing improvement across their trust.
Many MATs have centralised some policies while giving schools autonomy in other areas. This enables their schools to tailor policies to their individual school and pupils. For example, in one MAT, senior trust leaders developed a curriculum overview that makes sure that curriculums across the trust are aligned with the MAT’s values and ethos. Individual schools then ‘flesh out’ their own curriculum. Other MATs have highly centralised models with significant consistency across the trust in areas like curriculum and behaviour policies.
We also found some areas for improvement, including for trusts to collaborate more with other trusts and schools, and for better assessment practice and governance.
We will continue to develop the MATSE programme. This will include other MAT ‘events’ (some MATSEs, and some similar to MATSEs but with slightly different themes), covering more sizes and types of MATs, to improve our methodology and understanding of the MAT sector. Our ambition is to complete 12 MAT events in total this financial year.
Our findings have fed into the Department for Education’s academy trust regulation and commissioning review. This has looked at the accountability and regulation of academy trusts, including how trusts will be held to account in the future. We strongly believe, as we have for some time, that routine inspection of trusts must have a significant role to play in trust regulation. We continue to work with the Department for Education as it considers the future model of regulation, by building on our research and understanding of the sector.
3.7 Children outside Ofsted’s line of sight
Unregistered schools
In England, anyone who runs an unregistered school is committing a criminal offence.[footnote 41] However, many of these institutions operate without oversight because they do not meet the current rigid definition of a school. They remain on the cusp of the law by exploiting loopholes.
In 2021/22, we opened over 100 new investigations into possible illegal schools. We have also carried out 120 inspections (inspectors may inspect an unregistered school more than once) and issued 19 warning notices. There has been one prosecution of an illegal school this year.
Since the unregistered schools team was established in 2016, we have received almost 1,030 referrals and have investigated just under 960 unregistered schools across England. We often inspect them as part of our investigation. We have carried out around 660 inspections since 2016 and issued nearly 160 warning notices to the owners and managers of these unregistered schools. As a result, 81 unregistered schools have changed their service to comply with the current legislation, usually by reducing their hours of operation or the number of children attending. Sixteen have registered as schools as a result of our investigations.
For the last 6 years, we have raised concerns with the government about the number of children being educated in unregistered schools. Unregistered schools are often unsafe and of poor quality, and some promote ideas contrary to British values. Because of our limited powers, we have only brought 6 successful prosecutions in 6 years.
During our investigations, we have found children in chaotic institutions where disorganised managers and staff fail to provide a proper education. Some children are in unregistered schools where they are exposed to misogynistic, homophobic and extremist materials that are contrary to British values. We have found unregistered schools operating in unsafe and inappropriate premises. We identified serious safeguarding concerns in more than a quarter of the unregistered schools we inspected, which have put children as young as 5 at risk.
Most of these unregistered schools offer a poor standard of education, where children are restricted to an extremely narrow curriculum. Pupils often do not learn basic skills such as English and mathematics. Approximately a fifth of unregistered schools inspected following an investigation show evidence of having a faith ethos:[footnote 42] about 11% are Muslim, 6% are Jewish and about 4% are Christian. The remaining are either non-faith or unknown.
Alternative provision makes up a third of the investigations we have carried out into unregistered schools since January 2016.
While we have made progress in this area, we have limited powers to investigate illegal schools, and could do much more to protect children from the inadequacies of their education provision. The proposals in the 2022 Schools Bill would enable Ofsted and the Department for Education to make sure that thousands more children have a safe and suitable education. Part 4 of the Bill would grant Ofsted much-needed powers to investigate unregistered schools to see if they are operating illegally. This was welcomed by all parties and won strong support during its passage through the House of Lords. We hope the proposals in the Bill will come to pass, and help prevent groups that educate children illegally from putting more children in danger.[footnote 43]
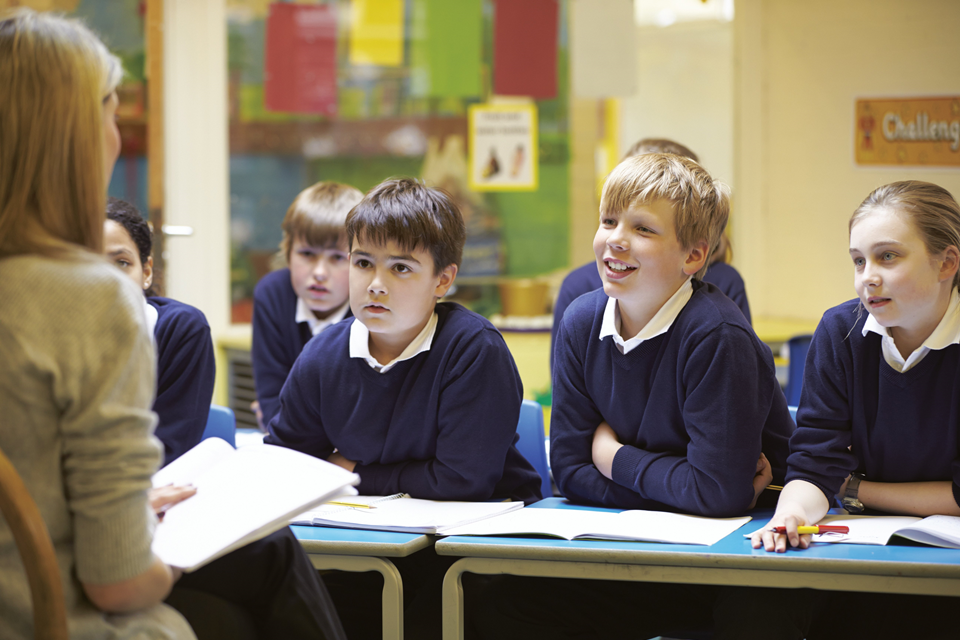
Elective home education
The use of elective home education increased this year. On the 2021 school census day, 81,200 children were estimated to be home educated. This is a 7% increase from the previous year. However, local authorities say that the number of children being home educated has fluctuated, with many returning to schools after previously leaving to be home educated. The number of children being educated at home was rising steadily before the pandemic. In 2019, 54,700 children were registered as home educated.[footnote 44] It is currently voluntary for parents to register home educated children, so these numbers are likely underestimates.
Many parents who choose to educate their children at home do so because it is their preferred way of educating their child, and they do a good job. However, for some children, often those with additional needs, the move to home education has come about following difficulties at school. Schools, local authorities and parents need to work together to ensure that home education is genuinely in the interests of children and that parents are aware of all the implications of home-educating their child.[footnote 45]
We welcome the government’s plan to create local authority registers of children who are not in school, including home educated children and others such as children in unregistered alternative provision. School attendance is a protective factor for many children, as was shown by the steep fall in children’s social care referrals from schools during the pandemic.[footnote 46] When schools cannot see pupils, they cannot see things going wrong in their lives. These new measures will help local authorities to better monitor the education and welfare of children in their area who do not attend school, without inconveniencing home educating parents who educate their children well.
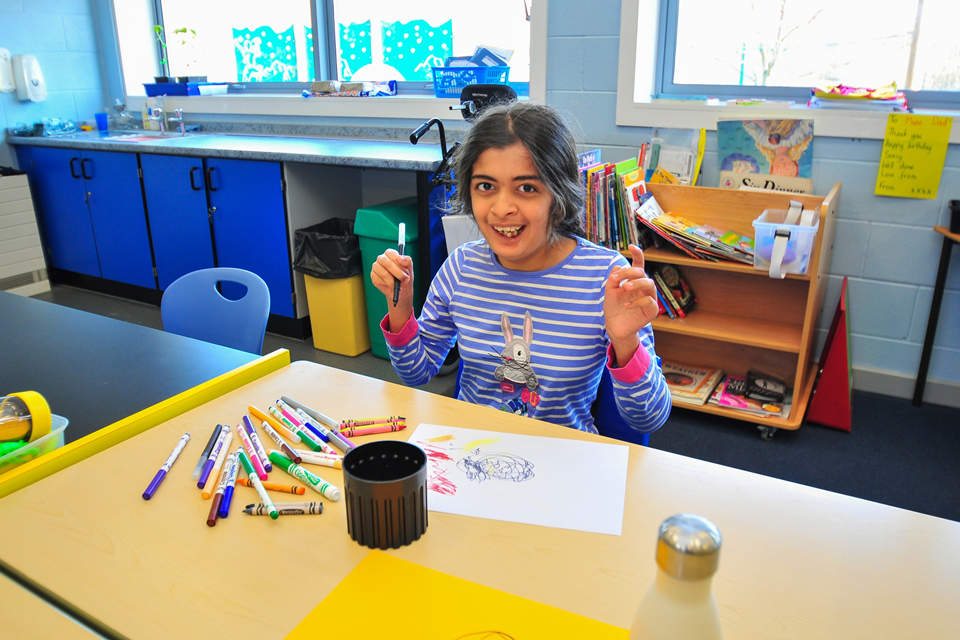
4. SEND and alternative provision
The system of provision for children with SEND continues to have significant weaknesses, even though many individual providers are good. Many children, young people and families experience significant delays and difficulties in accessing support, particularly wider health and therapeutic services. They frequently have a frustrating and adversarial experience of the system. These issues, and their effect on children and young people with SEND, have intensified during the COVID-19 pandemic and are reflected in the Department for Education’s proposals for reform.[footnote 47] [footnote 48]
We continue to promote high standards of provision for children and young people with SEND through our inspections. In addition to mainstream schools, we inspect state and independent special schools as well as alternative providers.[footnote 49] Inspections consider the quality of provision for pupils with SEND and whether schools have a clear vision for providing inclusive education to all. We are also introducing a new framework for area SEND inspections. This focuses on the impact of local area partnership arrangements for children and young people with SEND.
Information on learners with high needs in further education colleges and independent specialist colleges can be found in the ‘Further education and skills’ chapter.
4.1 Impact of the pandemic
Over time, the number of children and young people identified as having SEND has grown, in all types of settings. Nearly 1.5 million pupils are now identified as having SEND, an increase of almost 77,000 from the year before.[footnote 50] The number with education, health and care plans has grown by 51% since 2014/15 and the number with SEN support grew by 6% in the same period. This may in part be a consequence of children missing education during the pandemic. Most of these children and young people are educated in mainstream schools, although the number and proportion in state-funded special schools are increasing each year.[footnote 51] The most common primary needs are speech, language and communication needs.
The COVID-19 pandemic has exacerbated long-standing issues in the SEND system. Even before the pandemic, the lack of high-quality education, health and care services in some cases could have resulted in some children being mistakenly identified as having SEND.[footnote 52] For example, some SEND identified during key stage 2 or 3 can be traced back to poor curriculum and teaching in the early years and key stage 1.
While timely identification of SEND and additional needs is important, it is vital to identify carefully whether an additional need derives from SEND, missed learning, poor curriculum, poor teaching or poor early care. Even when they share a diagnosed need, children and young people with SEND are not a homogenous group and cannot be treated as such.
Delays in assessing children and young people for education, health and care plans are a persistent problem. These are caused by rising demand, staff absences and recruitment issues.[footnote 53] In 2021, only 60% of education, health and care plans were issued within the 20-week statutory limit, the same as in 2018 and 2019. There is substantial variation between local authorities. In 2021, 20 authorities issued less than a third of plans within the 20 weeks, but 80 authorities issued more than two thirds within the same timescale.[footnote 54] The long wait-times have made parents frustrated. Some parents resort to private assessments to speed up support for their children.
Delays are particularly severe for certain types of need, such as autism spectrum disorder. There are also longer waiting lists for health services such as child and adolescent mental health, and speech and language therapy. Even when children and young people have been able to access services, the service has often been interrupted or scaled back.
The pandemic continues to affect the school absence rates of pupils with SEND. Across each of the Department for Education’s core attendance measures, the attendance of pupils with SEND has deteriorated since 2019, and had not yet returned to pre-pandemic levels by the autumn of 2021. COVID-related isolation has decreased following changes in government guidance. However, the overall absence rate (which includes illness of any kind) remains high. Absences are not evenly spread across pupils, and around a third of pupils with education, health and care plans, and of those with SEN support, missed at least 10% of sessions in autumn 2021. This remains substantially higher than before the pandemic, and is clearly detrimental to their education.
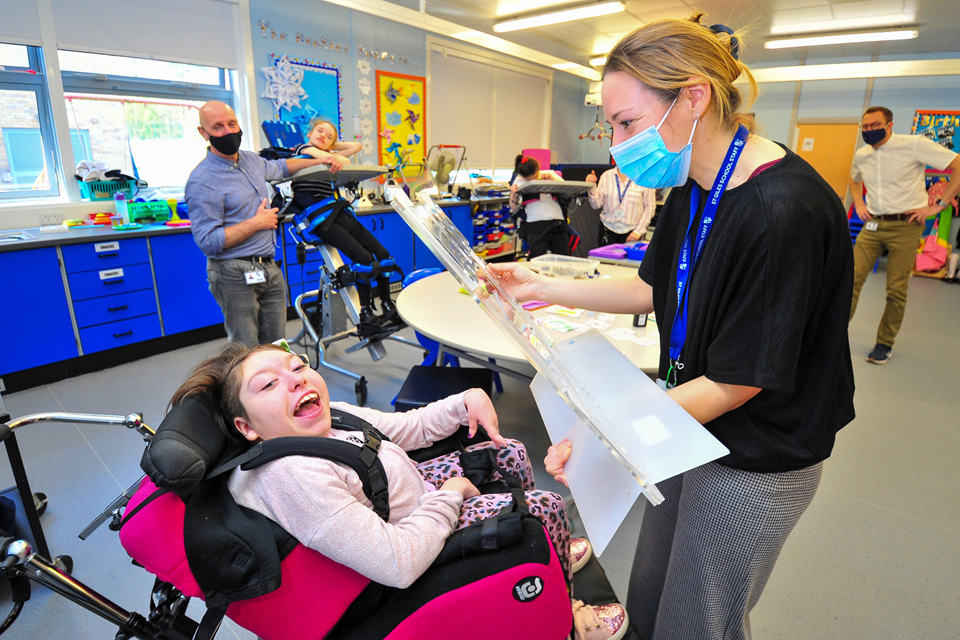
Table 2: Attendance of pupils with SEND, autumn 2019 to autumn 2021
| Education health and care plan: Autumn term 2019/20 | Education health and care plan: Autumn term 2020/21 | Education health and care plan: Autumn term 2021/22 | SEN support: Autumn term 2019/20 | SEN support: Autumn term 2020/21 | SEN support: Autumn term 2021/22 | |
|---|---|---|---|---|---|---|
| Overall absence rate | 9.2 | 9.4 | 11.6 | 6.8 | 6.6 | 9.1 |
| Authorised absence rate | 7.1 | 7.1 | 9.0 | 4.7 | 4.3 | 6.5 |
| Unauthorised absence rate | 2.1 | 2.3 | 2.6 | 2.1 | 2.3 | 2.6 |
| Rate of sessions recorded as not attending due to COVID-19 (in addition to the overall absence rate) | n/a | 8.6 | 2.3 | n/a | 7.4 | 1.8 |
| Percentage of persistent absentees (pupils missing 10% of sessions) | 26.3 | 25.6 | 35.9 | 19.8 | 19.3 | 30.6 |
| Percentage of extreme persistent absentees (pupils missing 50% of sessions) | 3.5 | 4.4 | 4.7 | 1.6 | 2.1 | 2.4 |
1. Authorised absence includes absence due to illness, including COVID-19. Other absences related to COVID-19 are not included in the overall absence rate figures, but are counted separately.
2. ‘Sessions recorded as not attending due to COVID-19’ includes self-isolation due to exposure or waiting for a test result. Different policies applied during the period, and this affects the data. For example, by autumn 2021 pupils were no longer in bubbles and did not need to isolate if classmates were infected.
3. Based on absence data published by the Department for Education.
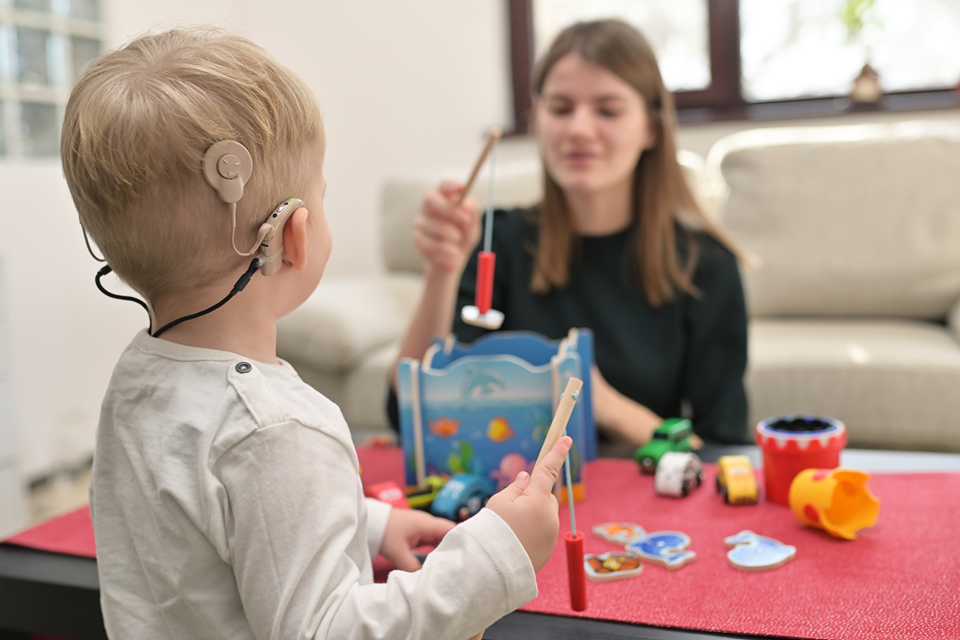
4.2 Pandemic recovery
The work schools do to help pupils with SEND catch up with missed learning is crucial. Schools that have done this best often had strong systems in place before the pandemic, aligned with a strong vision and clear intent for their curriculum. These schools helped pupils to catch up by identifying gaps in pupils’ knowledge and skills quickly, using interventions to target them, and avoiding inappropriate narrowing of the curriculum or reduced expectations.
Even the children who find learning most difficult do not learn in fundamentally different ways from other children. They require more expert, rigorous, evidence-based teaching, as well as an ambitious and well-designed curriculum that emphasises literacy, speech, language and communication. The pandemic has given some local authorities the opportunity to reflect on their approach to supporting children and young people with SEND. For example, some local authorities have started working with health partners to reduce long waiting times for assessments and diagnoses. Some are looking strategically at how they can meet children’s needs in future, increase capacity and reduce the long-term impact of COVID-19.
As we introduce the new area SEND inspection framework, we will report on how the sector is recovering.
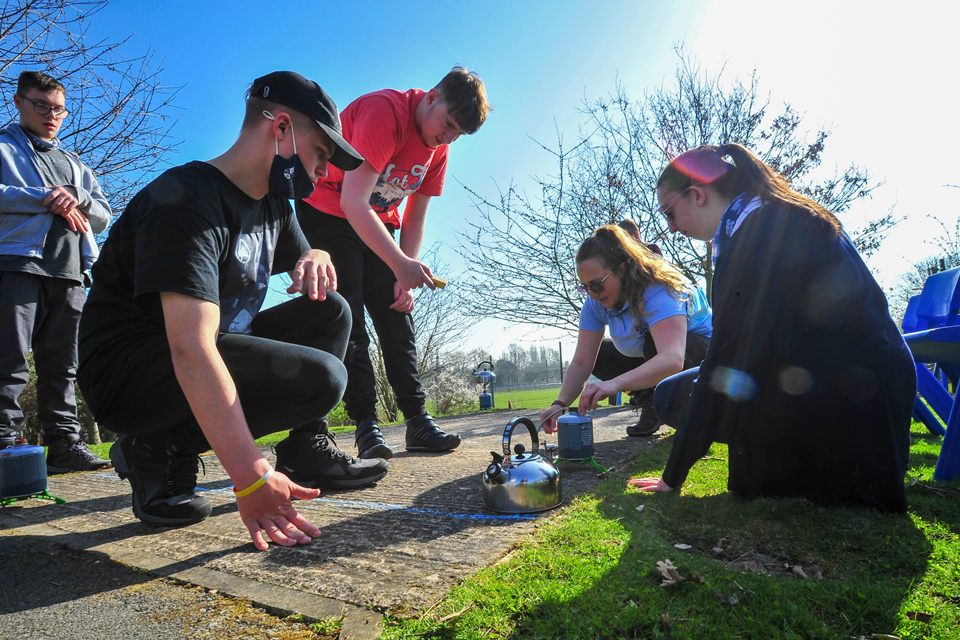
4.3 Area SEND inspections
Since May 2016, we have inspected local areas jointly with the Care Quality Commission (CQC).[footnote 55] These inspections look at how well local partnerships fulfil their responsibilities for children and young people with SEND. We completed our programme of full inspections in March 2022, and revisits continued in summer and autumn 2022.
State of the nation
Between May 2016 and March 2022, 151 local areas were inspected.[footnote 56] Over half of these (55%) were required to produce a written statement of action. This indicates that the areas have significant weaknesses. The proportion ranged from 1 in 3 in London (33%), to more than 4 out of 5 in the East of England (82%).

View data in an accessible table format.
With CQC, we revisit local areas that were required to produce a written statement of action. We had revisited 46 areas by 31 August 2022.[footnote 57] Of those:
-
20 had made sufficient progress in addressing all significant weaknesses
-
24 had made sufficient progress in addressing some significant weaknesses
-
2 had made insufficient progress in addressing any significant weaknesses

What we did this year
This year we inspected 26 areas, 16 of which were required to submit a written statement of action because of significant weaknesses. These were the last inspections carried out under the current framework.
It is extremely concerning that over 60% of inspected areas had significant weaknesses. We identified inconsistencies in the way that areas identified children’s and young people’s needs and in the joint working between education, health and care partners. In many areas, the quality of education, health and care plans was poor and plans did not always reflect children and young people’s needs and aspirations. In some areas, families did not know where to get help for their children and felt that their views were not heard or valued. Many areas did not have an effective SEND strategy and self-evaluation. Leaders did not always use data to evaluate the effectiveness and quality of services and to make improvements.
We also revisited 17 areas this year and found that:
-
9 had made sufficient progress in addressing all significant weaknesses
-
7 had made sufficient progress in addressing some significant weaknesses
-
1 had not made sufficient progress in addressing any of its significant weaknesses
Most areas revisited in 2021/22 had improved in some respects. For example, the areas that had lacked a coherent vision and strategy for SEND provision at their initial inspection had made sufficient progress in developing them. Also, most areas where joint commissioning was previously weak had improved. Their arrangements are now planned well across education, health and social care, and are being overseen by leaders.
However, there were still weaknesses in some areas, such as transition arrangements, the quality of education, health and care plans, identification of needs and the quality or availability of adult/post-19 provision. A couple of areas had focused on processing new education, health and care plans more quickly at the expense of quality or updating and amending existing plans promptly. Parents were still dissatisfied in some areas, especially where local services did not engage with them – for example when planning their child’s support.
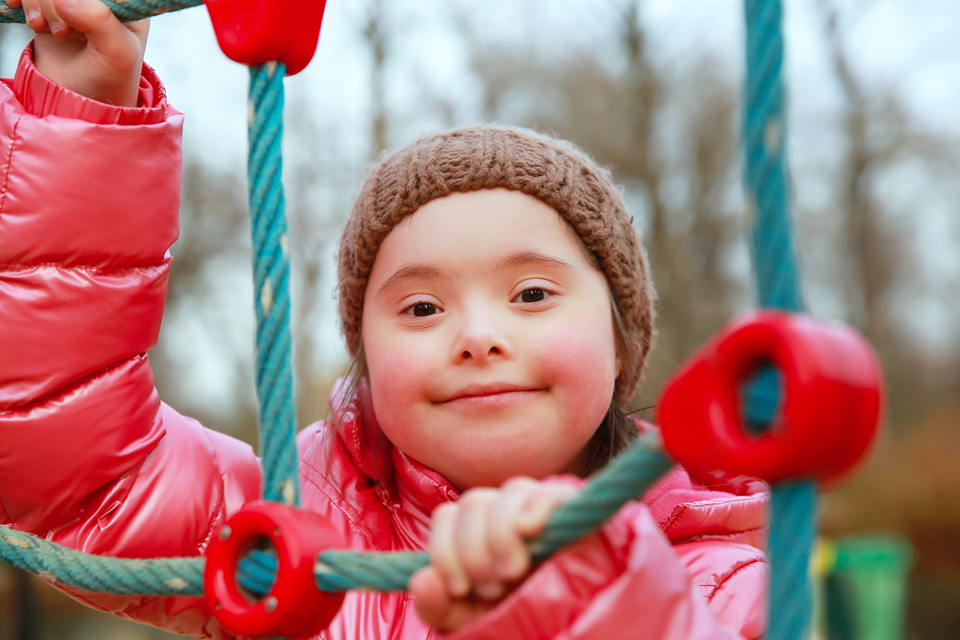
Our new area SEND inspection framework
In early 2023, we will introduce a new framework, after extensive stakeholder engagement, a series of pilot inspections and a public consultation.[footnote 58] [footnote 59]
The new model aims to help area SEND services improve continuously. The framework focuses on what makes local area arrangements most effective. This will include looking at how local partnerships ensure that children and young people with SEND are as healthy as possible and well prepared for education, employment, independent living and participation in society.
In inspections we will:
-
gather more evidence directly from children and young people and their families and carers, and from SEND service practitioners
-
look in greater depth at how local authorities use, commission and oversee alternative provision
-
include social care inspectors in inspection teams to get a better overview of the impact of SEND services
We will also strengthen accountability through:
-
an ongoing cycle of inspections and monitoring visits, with a risk-based approach to scheduling
-
having 3 inspection outcomes to provide clear information on performance, what needs to improve and who is accountable
-
an expectation that all areas will publish a strategic plan for SEND and update it after their inspection
-
introducing engagement conversations between local area partnerships, Ofsted and CQC
We are also introducing thematic visits, with a different focus each year. These will examine in depth and report on specific aspects of the SEND system. In 2023, our visits will focus on alternative provision, specifically on how partners use and commission these providers. We will publish more details about thematic visits in early 2023.
4.4 Special schools
Eighty-nine per cent of state-funded special schools were judged good or outstanding at their most recent inspection (see Figure 21). This percentage is almost identical to the 90% figure a year earlier. Eighty-one per cent of non-association independent special schools were judged good or outstanding at their most recent inspection. Since 2019, both types have been inspected under the EIF, but for many schools their most recent graded inspection was under a previous framework.
The proportion of non-association independent special schools judged good or outstanding has declined slightly from 84% in August 2021. This was because a larger number of good and outstanding schools declined to less than good this year than improved. Also, a larger proportion of inspections were first inspections of new schools, which had poorer judgements than established schools. The number of independent special schools has continued to grow, from around 520 in August 2020 to around 620 currently.

View data in an accessible table format.
In the summer term in 2022, most special schools had resumed offering activities to develop independence, such as trips in the local community, travelling on a bus and shopping. They had also re established enrichment opportunities for pupils. However, transport was reported to be a barrier which meant that some special schools had a restricted offer during the school day.
Staff turnover and absence were challenges for leaders of special schools. In some special (and mainstream) schools, recruiting staff with SEND expertise had been difficult and staff turnover had been higher than pre-pandemic. This had a negative impact on pupils, especially when new staff were not familiar with pupils’ individual needs or when certain provision required 2 members of staff, for example hydrotherapy. More broadly, staff absence may result in non-specialist teaching, as lessons are covered by supply teachers or non-specialist staff. This may affect the quality of education.

4.5 Alternative provision
Characteristics of the sector
Alternative provision (AP) is commissioned by schools or local authorities for pupils who have been excluded or otherwise fallen out of mainstream school, for example due to medical needs. It is a diverse and complex sector, spanning hospital schools, pupil referral units, state-funded AP schools, independent schools and other providers not registered as schools or further education colleges.[footnote 60] More than four fifths of the children and young people in AP have SEND. The most common primary needs are social, emotional and mental health needs.[footnote 61]
We inspect AP in a variety of ways, which reflects the complexity and diversity of the sector. Those registered as schools are inspected as schools. Providers operating part time do not have to register as schools so are not inspected.
The total number of AP placements in state-funded schools fell by 16% to 22,000 between January 2020 and January 2021. The number of placements in independent schools and unregistered providers continues to rise. The rise in placements in unregistered AP is concerning, given that they operate without oversight.

View data in an accessible table format.
While the overall profile of inspection outcomes for AP schools is in line with all schools, this year’s inspection outcomes have been worse for AP schools than other schools.
In graded inspections this year, only 61% of AP schools were judged good or outstanding overall, compared with 68% of all schools. The quality of education in AP schools was weaker than other judgement areas. While 84% of AP schools were good or outstanding for behaviour and attitudes, only 61% were good or outstanding for quality of education.
Some AP placements lack a clear purpose. AP is sometimes used as a shadow SEND system, with pupils referred there while they wait for a suitable placement in a special school. Pupils with complex needs sometimes spend years in AP waiting for a special school place. APs can be perceived as a ‘dumping ground’.[footnote 62]
Some schools commission AP placements without checking suitability or legality and safeguarding arrangements. For example, several schools were commissioning places from the same unregistered AP this year without proper checks on safeguarding arrangements and without monitoring pupils’ attendance. Our unregistered schools team visited and notified the AP that it was operating illegally. The team also spoke to mainstream school staff about the issue. When we subsequently inspected some of those mainstream schools, they had already improved their approach to commissioning.
This stems from a lack of clarity about the purpose of AP and what constitutes good outcomes for children and young people in AP. The Department for Education should consider this when developing national standards and a new performance framework for AP. It should analyse current patterns of use to ensure that performance measures reflect the best pathways in and out of AP.
We intend to focus more on AP through our area SEND inspections. Through thematic visits, we want to understand better how agencies can best work together to plan AP services strategically. We have seen many examples of schools and local authorities failing to work together. The absence of any obligation to do so is a clear weakness in the current system. We welcome the Department for Education’s ambition to include AP in local joint working arrangements.
The definition of success in AP should be broader than reintegration into mainstream education. In many cases – especially for younger children – this is an appropriate aim. However, it is not always successful or in pupils’ best interests, especially for young people who enter AP in their GCSE years and may struggle to catch up if they return to mainstream school.[footnote 63] Also, a significant minority of pupils move from AP to special schools.[footnote 64] It may be better to aim for successful transitions for young people leaving AP, whether into mainstream or special schools, college or training.
Unregistered alternative providers
The unregistered AP sector educates some of most vulnerable children in England. Around 65% of pupils placed in unregistered AP by local authorities have an education, health and care plan.[footnote 65] We know that 81% of pupils in AP have SEND.[footnote 66]
Despite this, unregistered providers are subject to no direct oversight. Through our suspected unregistered school visits, we have seen too many settings that provide an obviously poor quality of education. We have seen far too many examples of providers that offer an extremely narrow curriculum, for example providing only farm therapy. Furthermore, pupils attending unregistered AP are more likely to be exposed to safeguarding risks than their peers in state-funded AP. Others do not keep attendance records, carry out proper checks on staff, or operate safe environments.
Local authorities without state-funded AP rely more heavily on independent and unregistered AP. In 63 local authorities, most AP places are in the independent or unregistered sector.

View data in an accessible table format.
The current system relies on schools and local authorities to quality assure and monitor unregistered AP placements. However, we know from both school inspections and investigations of illegal schools that there are major weaknesses in commissioning. This means there is little independent scrutiny of the education that pupils receive, and makes it unlikely that they are receiving a full, balanced and coherent curriculum.
We have identified and investigated almost 320 APs that we believe to be operating illegally. We have carried out around 290 inspections of AP. Since 2015/16, an increased proportion of unregistered school inspections have been inspections of AP. This year, over half of unregistered school inspections were of AP providers. This has increased from a third in 2015/16. Unregistered AP now accounts for 7 out of 10 warning notices that we issue to unregistered providers.
Wholesale change is needed to make sure thousands of, often vulnerable, children get the high-quality education they need and deserve.

5. Teacher development
After the challenges of COVID-19, it is more important than ever that the education sector can recruit, train and retain a highly skilled workforce. Our inspections of ITE, ECF and NPQ providers support the government’s reforms of teacher recruitment and retention, and check whether the programmes are providing high-quality training. Our education inspections also look at the impact of teacher training and development on the quality of education in schools and further education providers.
5.1 Initial teacher education
ITE programmes prepare people to become teachers in early years, in primary, secondary and special schools and in further education. They must equip trainees with the subject knowledge and skills to teach all pupils well.
The best providers have an ambitious curriculum that makes sure trainees acquire the key subject knowledge they will need. On primary and secondary courses, this includes the Department for Education’s core content framework. Trainees can then build on this strong foundation as they move into their early career.
Around 400 age-phase providers train teachers, including higher education institutions, school-centred initial teacher training providers, and colleges.

View data in an accessible table format.
State of the nation
At the end of August 2022, 94% of age-phase partnerships had been judged good or outstanding at their most recent inspection. This proportion has fallen since the introduction of the new framework, from 100% in August 2020 and 95% in August 2021.
Only around a quarter of the age phases inspected have yet been inspected under the current framework. The new framework intentionally raised expectations, so the most recent inspection grade of partnerships and providers last inspected under the previous framework may not reflect the grades they would get if inspected under the new framework.
Inspections under the new ITE framework
We began inspecting under the new ITE framework in summer 2021. In each of the last 2 academic years since the framework was introduced (2020/21 and 2021/22), a lower proportion of age-phase partnerships have been graded good or outstanding than in any of the previous 8 academic years (2012/13 to 2019/20).

View data in an accessible table format.
What we did this year
This year we inspected 76 age phases.

View data in an accessible table format.
Importance of ITE curriculum
The ITE framework focuses on the ITE curriculum and how well it introduces trainees to subject- and phase-specific knowledge, building on the core principles of the EIF. While this has meant that a lower proportion of providers have received a judgement of good or outstanding, we know that our framework is improving standards. We know through reinspection that some providers that did not receive a judgement of good or outstanding have subsequently made significant and sustained improvements to their curriculums.
We have also identified weaker ITE curriculums; for example, some providers have not fully implemented the Department for Education’s mandatory ITT core content framework. Some of these weaker providers treat the core content framework as a ‘bolt-on’, adding key principles in an ad hoc way, with little thought to how they build trainees’ knowledge or practice. Also problematic are providers that rely too heavily on the core content framework, treating it as a generic curriculum model, with little attention to the specific subject expertise trainees will need.
In contrast, the best providers have reviewed their curriculum carefully, incorporating the core content framework in a coherent way. Leaders have carefully considered the subject knowledge they want trainees to learn and what they need trainees to be able to do in the classroom.
Weaknesses in ITE usually stem from problems with strategic leadership. In weaker providers, leaders’ self-evaluation of their programmes is sometimes not reliable, and their quality assurance of training and mentoring programmes is limited or unrealistic. These providers do not ensure that what trainees learn in the classroom can be put into practice on placement. Sometimes, placement schools are not aware of what trainees are learning on their course, or the information they get is too vague to be meaningful. While some trainees have a good experience on placement, there is limited cohesion with the centrally taught course.
Some providers have had difficulty finding school placements. There have been a number of reasons for this. The pressure the pandemic placed on schools and providers has made some less willing to host trainee teachers. Equally, high-quality mentors now have to divide their time between supporting early career teachers on the ECF programme and trainee teachers. These increased expectations and competing demands have exacerbated previous placement shortages. The Department for Education and other stakeholders have helped to link up schools and providers to alleviate some of these pressures.
Poorest outcomes in FE and skills ITE
We inspected a small number of further education and skills providers that deliver ITE apprenticeships this year. While some provision is strong, 5 out of 7 providers were judged to be less than good. Overall, we found weaknesses in curriculum, in mentoring and in how leaders assured the quality of the programmes. Curriculum weaknesses were usually due to insufficient planning and a lack of grounding in up-to-date research in education. This was often compounded by leaders not having a clear enough understanding of their own curriculum or the work of their mentors. Mentors worked diligently to support trainees, but the programme leaders did not make sure that these mentors were familiar with the course content or help them to take this into account in their work with trainees.
These providers will be reinspected within 12 months, giving them the opportunity to make the necessary improvements.
Initial teacher training market review
This year, we contributed to the Department for Education’s re-accreditation process for ITE providers by assessing the application questions on curriculum design. To avoid any conflict between the accreditation process and our ongoing ITE inspections, all the applications that we assessed had been anonymised.
We will begin to inspect newly accredited providers in the next ITE inspection cycle, starting in 2024/25.
5.2 The early career framework and national professional qualifications
State of the nation and what we did this year
This area of teacher training has been significantly reformed over the last 2 years, through the introduction of the ECF and expansion of the NPQs by the Department for Education.[footnote 67] In March 2022, we published our new ECF/NPQ inspection framework. This sets out how we inspect the lead providers of these 2 new professional development programmes. For the first time, we have oversight of the quality of teachers’ professional development and training, from ITE, support for early career teachers, and ongoing training for middle and senior leaders.
In summer 2022, the Department for Education contracted 10 lead providers to provide ECF training and NPQ professional development. These organisations coordinate this work through national delivery partners such as teaching school hubs, universities and MATs. In 2021/22, 5 lead providers offered both ECF and NPQ programmes. One offered only the ECF and 4 offered only NPQs. These lead providers train substantial numbers of participants: 26,900 early career teachers undertook the ECF induction and almost 29,300 teachers undertook an NPQ.[footnote 68]
In summer 2022, we made monitoring visits to all lead providers to check that implementation of the programmes was on track in the first year. We found that 9 out of 10 providers were taking effective action towards ensuring that ECF training and/or NPQ professional development was of a high standard. From spring 2023, we will inspect each lead provider at least once every 2 academic years.

What we learned this year
Early career teachers’ and NPQ participants’ experiences
Many ECF and NPQ participants are happy with their training and believe it is helping them to improve in their roles. However, some early career teachers find it difficult to complete the training alongside their school responsibilities. Schools are concerned about the workload that the ECF programme creates for early career teachers and mentors. Difficulties managing workload had an impact on the availability and quality of mentoring where lead providers had not worked with delivery partners to support mentors to work with ECTs. It is vital that mentors have the curriculum expertise, experience and time to provide effective support for early career teachers. NPQ participants gained the most from courses when they had been tailored to their specific learning contexts. They told us about the impact the programmes were already having on their leadership. Some lead providers have established processes such as user feedback groups and surveys to engage with course participants and use their views to shape the future of the programmes.
Quality of curriculum
All the providers visited were teaching the ECF content. The strongest providers had a well-sequenced, evidence-led curriculum that took into account early career teachers’ and NPQ participants’ prior knowledge and experience. Some lead providers had developed good-quality resources to show how to apply learning in the relevant school phases and subjects. This enabled delivery partners to teach the programmes effectively. It was essential that lead providers and delivery partners worked closely together to coordinate and deliver a high-quality curriculum.
Quality assurance
Rigorous approaches to governance and quality assurance are a strength of many of the lead providers and important for successful early implementation of these programmes. Lead providers check the quality of the programmes by visiting delivery partners. They share information on quality and outcomes with their governing boards. Many lead providers collaborate with their delivery partners to make sure that the quality assurance processes are manageable and effective. In the providers with weaker quality assurance processes, leaders did not have accurate information about the quality of the professional development and training provided by their delivery partners.
Open channels of communication
Most delivery partners report that communication with their lead provider is good, and that this helps them to feel supported. This is particularly important when dealing with operational issues, such as making sure learning platforms and portals are running smoothly and easily accessible. In some cases, better communication between lead providers and delivery partners would enable them to work more closely together and improve the quality of the training.
5.3 Impact of the pandemic
The pandemic restricted the amount of time that trainees could spend in the classroom. As a result, some have needed more support with the transition to becoming early career teachers. This is especially true for those who had less practical experience, for example in teaching early reading. However, trainees generally felt that ITE providers supported them well through the pandemic.
5.4 Pandemic recovery
Providers have mostly returned to normal working this year. For example, they have secured high-quality classroom placements and provided face-to-face training in ITE and in ECF/NPQ. This has enabled trainees to apply what they are learning in a classroom environment. Where providers have continued to rely solely on online working, some mentors and trainees have felt too remote from their training provider.

6. Further education and skills
The further education (FE) and skills sector is made up of several types of provider that teach learners over the age of 16. These providers offer courses and qualifications that prepare learners for further study and entry into employment.
This year, learners’ and providers’ experiences varied, as the COVID-19 pandemic continued to affect the sector.
6.1 State of the nation
On 31 August 2022, there were 2,050 publicly funded FE and skills providers, offering education, training and/or apprenticeships. This year we started reporting on an additional 130 providers, of which 90% were independent learning providers or employer providers. Over the same period, we stopped reporting on 130 providers, because they merged, ceased to be publicly funded or stopped providing education, training and/or apprenticeships. Of those, over 90% were independent learning providers or employer providers.

View data in an accessible table format.
Sixty-six per cent of FE and skills providers have received a full inspection, and 22% have received a new provider monitoring visit (NPMV). The remaining 11% are not yet due for inspection. Of those not yet inspected, 73% are independent learning providers (including employer providers). The other 27% are made up of 31 higher education institutions, 16 colleges, 9 independent specialist colleges, 5 16 to 19 academies and one adult community education provider.[footnote 69]
On 31 August 2022, the overall proportion of FE and skills providers judged good or outstanding at their most recent full inspection was 82%, the same as the previous year. However, the proportion of colleges judged good or outstanding at their most recent full inspection was 91%, an increase of 11 percentage points since last year. This is because 15 colleges were judged good or outstanding at their first full inspection after merging, and 18 colleges improved from requires improvement or inadequate to good. The proportion of 16 to 19 academies judged good or outstanding at their most recent full inspection has increased by 6 percentage points to 98%. Similarly, this is because 6 new 16 to 19 academies were judged good or outstanding at their first full inspection and 3 improved from requires improvement to good or outstanding.

View data in an accessible table format.

6.2 What we did this year
In 2021/22, we carried out just over 500 inspections and 220 monitoring visits:
-
330 full inspections of providers that had not previously had a full inspection, of which 65% were judged good or outstanding
-
34 full inspections of providers that were previously judged outstanding; of these, 14 remained outstanding, 17 were judged good and 3 were judged requires improvement
-
49 full inspections of providers that were previously judged good; of these, 38 remained good, 8 declined to requires improvement and 3 declined to inadequate
-
79 full inspections of providers that were previously judged requires improvement, of which 62% improved to good or outstanding
-
6 full inspections of providers that were previously judged inadequate, of which 4 improved to good, one improved to requires improvement and one remained inadequate
-
12 short inspections of providers that were previously judged good and remained good
-
one short inspection that was extended to a full inspection and the provider declined to inadequate
Overall, of 500 full inspections carried out this year, 67% resulted in an overall judgement of good or outstanding.
All providers judged good or outstanding overall were also judged good or outstanding for quality of education. Sixty-seven per cent of providers were judged good or outstanding for leadership and management, 68% for quality of education, 71% for personal development and 85% for behaviour and attitudes. The relationship between the key judgements and overall effectiveness is similar to that seen in previous years, with a higher proportion of providers judged good or outstanding for behaviour and attitudes than for overall effectiveness.

View data in an accessible table format.
Providers at their first full inspection
Outcomes from first inspections have continued to improve since 2017/18. Of the 330 providers that received a first full inspection this year, 65% were judged good or outstanding (190 good and 20 outstanding). This was an increase of 14 percentage points compared with the 2018/19 reporting year. This improvement should be understood in the context of the new provider monitoring visits we introduced in early 2018. These have flagged progress and areas for improvement to providers. The Education and Skills Funding Agency and other regulatory bodies have also taken steps to improve the quality of providers. For example, they have introduced the register of apprenticeship training providers and other quality management processes. Finally, the successive improvements are down to the efforts of providers themselves.

View data in an accessible table format.
Common themes identified in inspection reports of providers judged outstanding were:
-
leaders ensured that the curriculum was ambitious, challenging and varied, and gave learners the opportunity and aspiration to excel
-
tutors knew their learners well, challenged them and gave them useful feedback
-
learners were inspired and motivated and took responsibility for their own learning
-
learners worked towards ambitious targets that motivated them to make good progress and prepared them well for their future career
-
leaders worked effectively with the community and employers to ensure their curriculum met market needs


6.3 Inspections of previously exempt providers
This year we prioritised inspections of providers that had gone longest without inspection. These providers were previously exempt because they had been judged outstanding at their previous inspection.
This year, we inspected 31 formerly exempt providers: 14 were judged outstanding, 14 were judged good and 3 were judged requires improvement. Most had not been inspected for over 10 years, and all were previously inspected under superseded inspection frameworks. Common themes identified in inspection reports as areas for improvement were:
-
leaders should ensure the curriculum is planned effectively and provide support and challenge to ensure that learners’ needs are met
-
leaders and managers should make sure that all learners and apprentices have access to impartial careers advice, so that they are aware of the full range of progression opportunities available to them
-
all learners should benefit from appropriate work experience and activities to help them prepare for work
-
leaders should ensure that tutors have the necessary understanding and confidence to teach learners how to keep themselves, and others, safe with regard to safeguarding, radicalisation and extremism
-
leaders should make sure learners and apprentices receive useful feedback to understand how they can improve
6.4 Apprenticeships
On 31 August 2022, 1,560 FE and skills providers were offering apprenticeships. Of these, 82% had been judged on the quality of their apprenticeship provision at their most recent full inspection or NPMV. The remaining 18% of providers had yet to have their apprenticeship provision inspected.
Of the providers inspected, 77% were judged good or outstanding in a full inspection or to be making at least reasonable progress in an NPMV. This is a decrease of 4 percentage points since last year.

View data in an accessible table format.
Providers judged requires improvement or inadequate tended to face similar challenges; for example:
-
pressure on business and high workloads meant that apprentices were not always released for off the job training and made slower progress as a result
-
on- and off the job training was not always well coordinated
-
the curriculum focused too much on compliance and achieving qualifications, rather than on the quality of education
-
apprentices were not always prepared for their end-point assessments, and leaders and apprentices did not fully understand the assessment requirements
Level 6 and 7 apprenticeships
We started inspecting level 6 and 7 apprenticeships in April 2021. These are degree or degree-equivalent apprenticeships for a wide range of professions and occupations, such as registered nurses, social workers, solicitors and police constables. The most commonly used level 6 and 7 apprenticeship standards are those for senior managers and for accountants and tax practitioners. Some of these new apprenticeships succeed earlier employer training programmes, making use of the apprenticeship levy.
This year we carried out full inspections of 97 providers that offer level 6 and/or 7 apprenticeships.[footnote 70] Of these, 68% were judged good or outstanding for the apprenticeship judgement, compared with 66% for apprenticeship judgements across all providers. The vast majority of providers that deliver level 6 and/or 7 apprenticeships also deliver apprenticeships between levels 2 and 5.
We carried out NPMVs to 24 providers that deliver level 6 and/or 7 apprenticeships. Of these, 88% were judged to be making at least reasonable progress in all standard themes (leadership and management, quality of training and safeguarding).
6.5 Impact of the pandemic
Learners and staff continued to be absent because of COVID-19. This was particularly challenging in the spring, and some small providers closed temporarily.
The disruption to learners’ and apprentices’ education in 2020/21, including furlough and breaks in learning, meant that many had learning gaps, particularly in practical skills, English and mathematics. In some cases, providers had reduced the amount of time spent on English and mathematics to allow more time and resources for catch up in practical and vocational skills. This meant that learners had lower levels of skill in English and mathematics compared with previous cohorts. Apprentices working in key worker roles had been unable to learn the theory for their course. By the summer term, some apprentices were catching up.
Apprentices continued to be affected by the pandemic in 2021/22. Some made slower progress and remained on programmes beyond their planned end date. The pressures on sectors, particularly in hospitality, travel and tourism, and health and social care, meant that many apprentices could not be released for off-the-job training.
In the autumn and spring terms, employment opportunities for apprentices and work placements for full-time learners were difficult to secure. By the summer term, this had improved, except in the sectors hardest hit by the pandemic, particularly health and social care. In some apprenticeships, the tasks assigned to learners in the workplace were not always meaningful. This was because the needs of the business were sometimes given priority over developing learners’ skills.
A number of learners, particularly the youngest, had less confidence than previous learners. They found it harder to interact with peers and more difficult to focus. Their mental health and well-being were poorer. In the summer term, they were more anxious about exams because they were taking external exams for the first time.
Many providers are finding it difficult to recruit and retain high-quality staff, particularly specialist and vocational staff. The reasons for this include salaries being lower than those in the sector, particularly engineering, construction, hospitality and travel, and staff reconsidering their careers after the pandemic.
6.6 Pandemic recovery
Providers have worked hard to support learners and responded with creativity and resilience to the continuing challenges of the pandemic. This included:
-
providing one-to-one and group support
-
securing alternative work placements that, while not career-specific, gave learners a chance to develop employment skills
-
in larger FE colleges, providing internal work experience in on-site facilities and teams like marketing and IT
-
developing new programmes and/or adding elements to existing programmes to reflect the post pandemic employment market
Providers increased their use of initial assessment because centre-assessed and teacher-assessed grades were not comparable with previous years. This helped them to identify the level of learners’ knowledge and learning gaps. Providers had also assessed existing learners returning to their programmes after periods of lockdown and remote learning.
Resequencing the curriculum was a popular catch-up strategy. This included revisiting elements of the programmes that had been taught remotely, once learners were back in face-to-face classes, and moving practical elements so that they were taught earlier.
Providers recognised that summer 2022 would be the first time many learners had taken exams. They supported learners by:
-
increasing their familiarity with exam conditions
-
providing structured specimen answers and then gradually removing elements of them
-
providing extra revision sessions
-
offering more pastoral support
Most providers, particularly general FE and sixth-form colleges, had returned to face to face teaching. However, we are concerned that a small number of providers continue to teach programmes substantially or entirely online, with no clear benefit for learners. This can limit the opportunities for learners to receive support from teachers when they need it, to develop practical skills and to socialise with peers. In providers where online learning is not planned or sequenced appropriately to complement face-to-face teaching, learners do not develop knowledge, skills and behaviours as effectively and are not as confident in applying their learning.
6.7 Learners with high needs
We inspect and grade provision for learners with high needs in FE colleges, independent specialist colleges and other colleges for learners with high needs and education, health and care plans. Independent specialist colleges, in particular, provide for those with severe or multiple disabilities.
This year we carried out full inspections of 39 general FE colleges, 32 independent specialist colleges and 40 other providers that educate learners with high needs.
The outcomes for independent specialist colleges were poor overall. Only 47% were judged good or outstanding overall, 31% were judged requires improvement and 22% were judged inadequate. Compared with their previous inspection, 28% stayed the same grade, 25% improved and 22% declined. Eight colleges were inspected for the first time.
The good colleges provided an effective and appropriately planned curriculum and well-tailored support for learners. However, throughout the pandemic, too many learners with high needs were not challenged by the curriculum. We are pleased that, by the summer term, this had changed. Many learners were given extensions to their programmes. This meant they were able to engage in the full curriculum once COVID-19 restrictions were lifted.
However, in too many independent specialist colleges:
-
leaders and managers were not yet doing enough to improve the poor quality of education
-
the curriculum was not sufficiently ambitious, well planned, well taught and coherent
-
learners were not developing their social and communication skills sufficiently
When colleges were judged inadequate, this often related to recent changes of leadership and management, and difficulties in recruiting and retaining staff with sufficient experience and training in education.
We also carried out 8 NPMVs of new independent specialist colleges. Two were judged to be making insufficient progress in all standard themes. All of the others were making reasonable and/or significant progress in all standard themes.
Of the 79 inspections of other providers that educate learners with high needs, 23% of providers were judged outstanding for their high needs provision, 61% good and 15% requires improvement. One was judged inadequate.
6.8 T levels
In 2020, the Department for Education introduced T levels, a 2-year vocational course taken after GCSEs that is broadly equivalent to 3 A levels. The courses combine practical and knowledge-based learning with an industry placement.
Using the EIF as a basis, we made research visits to providers in spring 2022 to evaluate the quality of T-level courses and transition programmes for education and childcare, health, construction and digital production.[footnote 71]
Providers had worked hard to prepare learners for courses. Despite this, some learners found their course to be more challenging than expected and were not always well prepared for the amount of work they needed to do. The most effective providers had developed the curriculum in collaboration with employers. They had used the programme’s flexibility to sequence the curriculum in a logical way so that learners could develop their knowledge and skills. Some providers had built high-quality simulated work environments to help learners develop theoretical knowledge and work-ready behaviour.
Learners appreciated the quality of teaching on their courses. Providers supported teachers in a variety of ways, including internal training and using links with employers to support continuous professional development. However, in too many cases, teachers did not feel prepared to teach courses and found teaching the curriculum too challenging. At the time of our visits, teaching and assessment resources were either not readily available or varied in quality. Some providers did not have staff with the required levels of knowledge and experience.
Most learners benefited from high-quality work placements. In the more effective placements, learners were able to experience different roles in industry and were given tasks that helped them to make faster progress through the curriculum. This helped them to make decisions about their future. However, the impact of COVID-19 and staff shortages, particularly in digital, construction and health, meant that some placements had been delayed. In some cases, learners who were on placement had only observed or completed basic tasks.
The T Level Transition Programme (TLTP) is a one-year post-GCSE level 2 course to support progression to a T level. The quality of teaching on the programme was generally high. Teachers gave constructive feedback, engaged learners and used a range of assessment tools to check their understanding. However, work placements were often not of a high quality, and securing them was difficult. Some providers’ TLTP curriculum enabled learners to gain skills, knowledge and behaviours that could be expanded on a T level. However, too many learners on the TLTP were unlikely to progress to a T level. Reasons for this included:
-
subjects that were available on the TLTP were not offered as T-level courses
-
learners did not know what their post-TLTP options were
6.9 Skills bootcamps
Skills bootcamps are short courses (up to 16 weeks) at levels 3 to 5. They are designed to meet employers’ skills needs by upskilling existing staff and improving the skills of self-employed and unemployed adults. This enables people to move into areas of skills shortage, including digital and engineering, construction, manufacturing, and green and other new technologies.
Our thematic review of skills bootcamps found that learners on these courses valued the opportunity to train and to develop their skills and knowledge.[footnote 72] Leaders and managers ensured that trainers had good technical skills and curriculum knowledge, and relevant expertise in the sector. Leaders at most providers had also used regional partnerships and labour market information effectively to develop courses that met the skills needs of both the employer and regions.
Most providers organised the curriculum appropriately and used learning resources and materials of a high quality. They included opportunities for learners to develop their personal and professional behaviours and gain a range of skills, in addition to learning the vocational content of the course. Most learners were satisfied with the content and quality of their training, and learners with SEND were usually supported effectively.
However, we identified several challenges, for example:
-
a few providers were unclear about the overall purpose of the programmes
-
some leaders had not made sure that each learner had their guaranteed job interview
-
providers’ arrangements to evaluate the quality of provision were not consistently effective, and too often the prime contractor did not maintain sufficient oversight of subcontractors’ and supply partners’ activity
-
too often leaders did not give trainers sufficient training to develop their pedagogical skills, including in online training
-
the quality of teaching overall was not high enough, and too many providers did not carry out rigorous initial assessments
-
many learners had a poor experience on programmes that were taught exclusively online with limited support from teachers
-
a minority of providers had planned courses that did not give learners enough time or opportunity to master skills or develop their understanding to a suitable level
We have agreed with the Department for Education to inspect skills bootcamps as part of our regular inspection of further education and skills providers, from April 2023.
6.10 Prisons
From 2020 to May 2022, prisons were subject to exceptional delivery models mandated and controlled centrally by His Majesty’s Prison and Probation Service. This meant that much education, skills and work activity was curtailed and unavailable to a significant number of prisoners.
In October 2021, we restarted our inspections of education, skills and work activities in prisons, jointly with His Majesty’s Inspectorate of Prisons (HMIP). Since then, we have carried out, and HMIP has reported on, 22 full inspections of prisons.
Throughout the year we have witnessed the slow pace of recovery in education, skills and work in prisons. Although we understand the challenges that prison leaders have faced due to COVID-19, far too many prisons do not yet offer a full activities regime, due to staff vacancies, for example. This continues to limit severely prisoners’ opportunities to access a high-quality education, skills and work curriculum to prepare them for release.
We judged half of the prisons to be inadequate and 10 to require improvement. Only one (HMP Bronzefield) was judged good.
We also looked at the inspection outcomes for the different areas of the framework.
Table 3: Overall effectiveness and key judgements of prisons and young offender institutions, 2021/22
| Judgment | Number of inspections | Number outstanding | Number good | Number requires improvement | Number inadequate |
|---|---|---|---|---|---|
| Overall effectiveness | 22 | 0 | 1 | 10 | 11 |
| Quality of education | 22 | 0 | 1 | 16 | 5 |
| Behaviour and attitudes | 22 | 0 | 4 | 12 | 6 |
| Personal development | 22 | 0 | 1 | 12 | 9 |
| Leadership and management | 22 | 0 | 1 | 11 | 10 |
1. Includes inspections with a report published between 1 September 2021 and 31 August 2022.
2. Overall effectiveness of education, skills and work activities.

Quality of education: In inspected prisons, levels of staff absence were high, both among prison staff and among the main education contractors. This restricted prisoners’ access to the full curriculum for education, skills and work. The few prisoners able to attend education and vocational training took part in well-planned and structured learning programmes. However, in too many areas of work, prisoners were given activities that did not develop their skills or knowledge. In most cases, support for prisoners with learning difficulties and/or disabilities was ineffective. There were backlogs in assessing prisoners’ learning difficulties, and support plans were not always appropriate.
Behaviour and attitudes: In the prisons where this aspect was good, leaders helped prisoners to take part in education, skills and work activities. As a result, prisoners were motivated to learn, displayed good behaviours and took pride in their work. However, not enough prisoners were attending education, skills and work activities. In many cases, a lack of prison staff meant that prisoners could not be escorted to activities at all or that they arrived late, reducing their learning time.
Personal development: Following the pandemic, many leaders had not yet planned curriculum activities that included prisoners’ personal development. They had not fully reinstated careers information, advice and guidance. As a result, prisoners did not receive appropriate guidance on constructing their learning plan or preparing for release.
Leadership and management: The pandemic had diverted leaders’ attention from the quality of education, and, in many cases, they had been slow to reinstate a full learning programme and qualifications. In April 2022, we published a review of our prison monitoring visits. Only 2 of the 41 establishments included in this review were judged to be making significant progress towards curriculum recovery. Approximately a quarter were making insufficient progress, with the rest making reasonable progress overall. There were not enough opportunities for all prisoners to take part in education, including face-to-face lessons and vocational training. Therefore, too many remained unemployed. The curriculum did not meet prisoners’ needs for education and employment, and the process of allocating prisoners to activities was ineffective.
We also made 29 progress judgements in 9 published monitoring visit letters. Eight prisons received a judgement of reasonable progress in one or more themes. Seven of our visits highlighted that the prison was making insufficient progress towards one or more areas for improvement. No prison was found to be making significant progress on any inspected theme.
Overall, inspection outcomes this year have continued the downward trend seen in recent years. As at 31 August 2022, 37% of prisons and young offender institutions were judged good or outstanding at their most recent inspection, a decline of 9 percentage points since last year and 13 percentage points since 2019.

View data in an accessible table format.
Our joint review with HMIP on reading in prisons found that prisons are not giving enough priority to teaching prisoners to read, and that reading is not a distinct part of the core education offer. Prisoners who cannot read rely heavily on voluntary organisations to help them learn.
Assessments to identify prisoners’ specific learning needs and gaps in reading knowledge are not fit for purpose, as they do not, for example, test reading abilities. As a result, prison leaders are unable to identify and meet prisoners’ reading needs. Often, the English qualifications offered in prisons do not support the many prisoners with low reading skills well enough. This, compounded by insufficiently trained teachers and inadequate resources, makes learning to read even harder.
Much of the existing reading provision does not teach prisoners to read or to improve their reading, particularly those who need the most help. Many of the prisoners who could not read were not participating in education and were not receiving incentives to do so.

7. Social care
Social care is support for children who need help or protection, and/or who are in local authority care.
We regulate and inspect children’s social care providers, and also inspect local authority children’s services under the inspecting local authority children’s services (ILACS) programme. Across England, 152 local authorities support around 389,000 children (classed as ‘children in need’) each year.[footnote 73] Over 82,000 of these children are in care.[footnote 74]
This year, several reviews have looked at the children’s social care sector in England. These include the Independent Review of Children’s Social Care (the Care Review),[footnote 75] the Competition and Markets Authority market study of children’s social care provision[footnote 76] and the Child Safeguarding Practice Review Panel, which looked at child protection.[footnote 77]
All of these made bold recommendations on ways to improve the sector. Many of these reflect issues and recommendations for change that we have made ourselves over a number of years. We have been working with government and other inspectorates to advise on and assist with implementation. The reviews are discussed in this chapter, where relevant.
Overall, the picture for local authorities’ children’s services has improved in very difficult conditions. For social care providers, especially children’s homes, there has been little change in overall effectiveness. This is perhaps not surprising given the difficult conditions regarding workforce recruitment and retention in the sector.

7.1 State of the nation
As of 31 August 2022, there were 3,670 social care providers, offering a variety of services, including residential care, and fostering and adoption services. Children’s homes make up the majority of providers (2,970), although 70% of all children in care live with foster carers.
This year there was a 7% increase in the number of children’s homes of all types, which continues a year-on-year increase since 2015. There is now only one secure training centre, as Rainsbrook was closed in 2021 following a decision by the Justice Secretary. More information about changes in all social care provision types is available in the Children’s Social Care in England national statistics.

View data in an accessible table format.
The vast majority of providers are children’s homes. At 31 August 2022, 81% of the 2,730 inspected children’s homes were judged good or outstanding. This is broadly in line with the proportion in 2021.

View data in an accessible table format.
Of the other 650 social care providers, 92% are currently judged good or outstanding, in line with previous years. Nearly half of these providers are independent fostering agencies, which are also mostly good or outstanding (94%).

View data in an accessible table format.
Local authority children’s services inspections
As well as individual social care providers, we also inspect all 152 local authority children’s services in England. Our ILACS inspections look at the overall effectiveness of children’s services, including how they help and protect children, the experiences and progress of children in care and care leavers and the impact of leaders. The ILACS framework includes inspections (short and standard) that result in judgements, and activities (such as monitoring visits and focused visits) that do not.

View data in an accessible table format.
By August 2022, 150 of the 152 local authorities had an overall effectiveness grade from a full inspection. The remaining 2 have not yet been inspected due to a change in geographical boundaries. Of the 150 inspected local authorities, 56% were graded good or outstanding overall. This had increased from just over one third (36%) after each local authority’s first inspection under the previous single inspection framework.
Not all local authorities have yet had an ILACS inspection, because of pandemic-related delays. However, by the end of 2022 all local authorities will have had either a short or standard ILACS inspection. Some local authorities have had 2 ILACS inspections, generally because they were inspected early in the life of the new framework and judged to be inadequate, so had an early reinspection.
7.2 What we did this year
During 2021/22, we carried out inspection, regulatory and enforcement work as usual.
Local authority children’s services inspections

View data in an accessible table format.
This year we carried out 130 ILACS visits or inspections. Inspection was paused during 2020/21, which meant that we were behind where we intended to be on completing an inspection cycle. As a result, the number of completed inspections overall is smaller than planned. To be sensitive to local authorities that were still recovering from the pandemic, the largest number of visits this year were focused visits (51). We also completed 12 short inspections and 34 standard inspections.
Social care common inspection framework
We returned to routine inspections under the social care common inspection framework (SCCIF) in April 2021, so are reporting on a full year of inspections. This year we carried out 3,880 inspections, most of which (3,000) were full inspections.


View data in an accessible table format.
In the year to August 2022, we received 440 applications to register a children’s home, and registered 260 of these. Around four fifths of the remainder (160) were still going through the application process at the end of August 2022. The remaining applications (33) had been withdrawn.
This year 480 children’s homes received their first full inspection. Of these, 9% (43 homes) were judged inadequate. This was in line with previous years, with the exception of 2020/21, when 15% of children’s homes (33) were judged inadequate at their first inspection. However, it is worth noting that the number of homes receiving a first inspection in 2021/22 was more than double the number in previous years (480 compared with, for example, 220 in 2020/21).
When children’s homes are rated inadequate at their first inspection, the causes are often staffing or workforce issues that were not evident when the home was first registered, including:
-
a change in the responsible individual
-
departure of the manager
-
shortages in staffing
-
poor matching of staff skills and experience to children’s needs

Complaints, concerns and enforcement work
We receive complaints and child protection concerns about children’s social care settings. These can be from members of the public, including parents or guardians, or from staff, in a whistle-blowing capacity. Child protection concerns are usually a serious warning about a child’s welfare.[footnote 78] [footnote 79]
This year, we received 1,030 complaints about 730 providers. This is in line with the numbers in 2020/21. Most complaints (870) related to children’s homes. We received complaints about approximately one fifth of children’s homes (21%). This is a reduction from previous years, when we received complaints about around a quarter of children’s homes (25%). This suggests that we have received more complaints about a smaller number of homes than in previous years.
We also received 310 child protection concerns from members of the public, including parents and guardians, this year. This is around double the number in 2020/21, and is mainly accounted for by a large increase in child protection concerns about independent fostering agencies (from 10 to 80), as well as 13 about residential family centres. These concerns were about 230 settings. We continue to monitor concerns and complaints, so that we can take effective action where needed.
We can take several possible actions in response to a complaint or child protection concern, such as bringing forward an inspection or taking compliance and enforcement action. Of the 1,340 complaints and concerns we received this year, we had taken one or more actions for 1,080 (81%) by the end of August 2022. A further 50 were closed with no action and the rest of the cases were still open on this date, so we have not yet recorded the final actions. We can take multiple actions in response to a particular case, and across 2021/22 we took around 1,750 actions.

Table 4: Number and type of actions taken, 2021/22
| Action taken | Number taken in 2021/22 |
|---|---|
| Key line of enquiry for next inspection | 460 |
| Continued monitoring by allocated inspector | 330 |
| Provider-led investigation | 310 |
| Inspection brought forward | 180 |
| Referred to the local authority’s child protection team | 92 |
| Compliance and enforcement action | 77 |
| Monitoring visit | 72 |
| Other action not included in other categories | 190 |
| Referred to another agency | 43 |
| Total actions | 1,750 |
1. Includes cases logged by 31 August 2022.
2. ‘Other action’ includes any action that does not fall under one of the named categories, for example a complaint about a possible unregistered children’s home.
3. One case can have multiple actions.
4. Numbers over 100 are rounded.
In addition to responding to complaints and child protection concerns, we take enforcement action. This can include issuing a compliance notice, restricting accommodation and suspending or cancelling providers.
This year, we issued 810 compliance notices (around a 15% increase from 2020/21) to around 240 providers. These resulted from a mix of complaints and child protection concerns, provider notifications and concerns identified on inspection. We also restricted accommodation in 100 providers and suspended the registration of 29 providers. We issued 21 notices of proposal to cancel registration, although most of these resulted in the provider either resigning voluntarily or resolving the concerns before cancellation became necessary. We had multiple concerns about most of the providers that received enforcement action, sometimes from more than one inspection or visit.
Only one home had its registration cancelled, because children at the home had been neglected. It is more common for enforcement action to result in a home resigning its registration voluntarily. Of 120 resignations in the year, over a quarter (35 homes, 28%) had been subject to regulatory enforcement activity before resigning. This is a broadly in line with 2020/21, when around a third of homes had enforcement action before resigning.
In October 2022, the Child Safeguarding Practice Review Panel published a review of safeguarding children with disabilities and complex health needs in residential settings operated by the Hesley Group.[footnote 80] Under the current model, all the professionals involved took too long to recognise the abuse and this was made more challenging by the providers’ lack of integrity. Ofsted was asked to carry out an immediate analysis of evidence around workforce sufficiency, focusing on suitability, training and support, which we presented to the panel.[footnote 81]
The cases covered by this review, as well as other serious case reviews relating to disabled children, highlight the vulnerability of these children and our significant role in ensuring proper care for them in residential homes and other education and social care providers.
7.3 Impact of the pandemic
This year, we reported on how local authority children’s services and social care providers were managing the continuing impact of the pandemic.
The pandemic has exacerbated some of the stress in the child protection system. We have seen an increase in the number of children coming into care over the last few years. Over 82,000 children were in the care system in 2022, compared with around 75,000 in 2018.[footnote 82]
The recently published ‘Independent review of children’s social care’ argued that several issues are combining to create an environment of high-level stress and need for some children and their families, including:
-
child poverty
-
pressures on wider family support services, such as health visitors and school nurses
-
‘new and emerging’ threats, such as online harm
-
parents’ mental ill-health and substance misuse[footnote 83]
Other significant pressures on the sector are:
-
concerns about the effectiveness of multi-agency working, following the deaths of Star Hobson and Arthur Labinjo-Hughes and other serious cases
-
recent and expected rises in the cost of living, which is likely to increase the number of families living in poverty. With families under greater financial strain, local authorities expect higher numbers of children in need and child protection cases
Workforce issues
There are significant staffing challenges in the social care workforce. Although these challenges were present before the pandemic, they have worsened as a result. Staff shortages mean that local authorities may not have enough places for children to live, or enough staff with the necessary skills in providers such as children’s homes. Additionally, children lack stability in their relationships because of the high turnover of social workers and residential workers, and reliance on agency staff.
Staffing issues in children’s social care are not new, but problems with recruiting and retaining staff are arguably the biggest challenge the sector currently faces.
Many social workers are moving into agency work, as this gives them greater flexibility and higher pay than local authorities can offer. As a result, local authorities find they cannot recruit directly and are forced to turn to agencies at a higher cost. Increasingly, local authorities are employing ‘agency teams’, which is distorting the workforce.
Staff shortages are creating significant challenges for the workers who do remain in the sector. Workloads are high and the demands of an already challenging job can become unsustainable. In the year leading up to September 2021, 9% of all local authority children’s social workers left local authority social work, an increase from 7% the previous year.[footnote 84]
Registered manager vacancies
The problems with recruiting and retaining social care workers are particularly apparent in children’s homes. Staff vacancies, particularly for children’s home managers, continue to affect the quality of care. Staff turnover is also very high.
Vacancies for registered managers have increased from 9% in August 2019 to 14% in August 2022. Around a third (32%) of all children’s homes had a manager who was new in post (started on or after 1 September 2021) at 31 August 2022. However, in the 10 largest provider groups, the percentage of homes with newly appointed managers was slightly lower (29%).
In the year to March 2022, 35% of permanent care staff in children’s homes left their role. In the same period, 44% of permanent care staff were newly hired. This was similar to 2019–20, the most recent year for which there is comparable data. This very high turnover creates instability for children in care, as it reduces the chances of building relationships, which are important for well-being, stability and belonging.
Children’s mental health
The decline in vulnerable children and young people’s mental health during the pandemic has been widely reported. This has been partially attributed to the impact of lockdown on children’s relationships, as children lost face-to-face contact with peers, family members and other adults in their lives, such as teachers.[footnote 85] The move to partially or fully online forms of contact sometimes disrupted communication between children in care and their families, and between children and their social workers. Workforce issues are sometimes having a direct impact on children’s well-being, with children complaining about too many changes of social worker. Some local authorities have commissioned multi-agency teams, which include clinical psychologists, to provide coordinated services. This is because they cannot depend on access to child and adolescent mental health services for children, as waiting lists have increased and referral thresholds are higher.
7.4 Recovering from the pandemic
It is difficult to talk about pandemic recovery in the social care sector, as local authorities and providers are still working under enormous pressure and sometimes in very different ways.
During lockdowns, many social workers relied on virtual contact with children and their families. Although this form of communication presented challenges, some children preferred it to face-to-face communication with their social workers.[footnote 86] Although face-to-face visits by social workers have now returned to pre-pandemic levels, some children who prefer it, and for whom it is appropriate, are still benefiting from a more informal relationship with their social workers through virtual communication.
Attendance at multi-agency child protection conferences has improved because professionals are now able to join virtually; in particular, representation from GPs has increased. However, this does not work well for family conference meetings, as it can leave parents feeling isolated and without support. For these meetings, face-to-face contact is preferred.
Many staff and social workers have moved to hybrid working, where they spend more time working from home than they did before the pandemic. Although this varies between local authorities, it can mean that workers spend less time in the actual local authority area or working directly with children. Social workers can now choose to work for a higher salary, with a better work–life balance, for a local authority further away. They therefore do not have the same local knowledge as staff based in the area. This can affect the quality of relationships with children and the sense of ownership about what is going on in the local area. Although staff may like working from home, local authorities should not underestimate the importance of face-to-face contact and access to support and advice from peers and managers.
7.5 Help and protection
The deaths of Star Hobson and Arthur Labinjo-Hughes, who were both known to public services, triggered a national review of child protection in England by the Child Safeguarding Practice Review Panel.[footnote 87] The review focused on multi-agency child protection practice. Both this review and the Care Review have recommended that Ofsted should carry out more multi-agency inspections and that these should be broader in scope than they are currently. We and our partner inspectorates are considering this recommendation.
We have recently redeveloped the framework for our multi-agency inspections to make them more focused and agile. During the year, we replaced single joint targeted area inspections with 2 separate inspections, which we started in January 2022. These are:
-
inspections of the multi-agency response to identifying initial need and risk (sometimes referred to as ‘the front door’)
-
a programme of thematic deep dives into specific topics, for example:
-
criminal exploitation of children
-
children and families who need help.

The front door
The ‘front door’ in a social care context is local authorities’ arrangements for responding to an initial contact from a professional or member of the public who is concerned about a child.[footnote 88]
We have been concerned about vulnerable children falling out of the line of sight since very early in the pandemic, and hence about the possible effect on the front door. Many school and nursery places that were available during lockdown were not taken up. Other vulnerable children not already known to social care, or whose problems arose during the pandemic, for example through being exposed to domestic abuse, were not being seen by schools, which are normally the source of the most referrals.
Department for Education data indicates that referrals between May 2020 and January 2022 were around 10% lower than in comparable weeks in 2017 to 2020.[footnote 89] The expected surge in referrals once children returned to school did not happen. This led to concerns that children who were being harmed or were at risk were not always being identified and referred.
Local authorities have attributed the fall in referrals during the pandemic to the small proportion of children attending school in person, and to children and their families having less contact with health visitors, midwives and nurses. The referrals that they received were also more serious and complex than usual, partly because of delays in identification.[footnote 90]
During the year, we carried out a pilot inspection of the multi-agency response to initial risk and need (front door arrangements), as well as a commissioned inspection of Solihull and 2 further inspections of initial risk and need.
Our findings highlighted the critical role of partnership working through local safeguarding children partnerships and multi-agency safeguarding arrangements. When leaders understood the strengths and areas for improvement in relation to the front door, this was because of good oversight and scrutiny, in addition to accurate information on performance management and quality assurance. Strong multi-agency professional relationships that set clear expectations and a child-centred vision are essential, as is a skilled and knowledgeable workforce. Insufficient capacity leads to delays in assessment and in responding to risk, but successful partnerships can identify and respond to capacity issues in a timely and effective way. Areas for improvement include:
-
partner agencies not providing sufficient information
-
referral outcomes not communicated consistently or quickly enough
-
not all key agencies attending strategy meetings or discussions, leading to decisions about children not always being based on full information
Thematic deep dives
Criminal exploitation of children
We have carried out 2 thematic inspections in 2022 using the new joint targeted area inspection methodology. These focused on child criminal exploitation. Our findings echoed previous joint targeted area inspections on this theme. There is still too much variation between local areas in the quality of partnership work. In some areas, strong and effective joint work makes a real difference to protecting and supporting children. But in other areas joint work is ineffective, so children are left in situations where they are harmed or are at risk of harm.
Our findings highlight the importance of local areas having a thorough understanding of local need and using this information, alongside regional and national research, to develop services. Effective partnerships share a commitment to child-focused work and an understanding of children’s experiences of exploitation. This enables them to provide a well-coordinated multi-agency response to support children and reduce risk.
Children and families benefit from strong relationships with professionals who respect their individuality and are flexible in their approach. For example, children appreciated it when professionals understood their specific needs and ‘went the extra mile’ to adapt their approach to meet these needs. Children report that this helps them to feel their views and feelings are understood and addressed.
Children and families who need help
Our next thematic deep dive will look at multi-agency responses to children and families who need help. The framework for this takes into account the findings from our ‘What is early help?’ scoping study and also the Care Review.
The scoping study, carried out by Research in Practice, concluded that there is no universal definition of early help, and huge variation in how and when these services are triggered.
The Care Review proposed a new model of ‘family help’ built in partnership with the families and communities it serves. One of its principles is that services should offer support at the level a family needs. The aim is to help them function well and, where possible, avoid the need for services to be involved in the longer term. This support should build on a wider offer of help and early intervention in communities that is available to all families.[footnote 91]
We therefore amended our proposed framework to focus on children and families that need help. This means that our primary focus is targeted early help but we will also look at how children are ‘stepped up and down’ between early help and children in need. The thematic deep dive will look at how different agencies work together to ensure that children and families get the help they need at the right time and at the right level. We will report on the findings in late 2023.
7.6 Children in care and care leavers
The providers we inspect and regulate offer care and accommodation to some of the most vulnerable children in the country.
Because referrals for children needing help and protection have become more serious and complex than they were before the pandemic, local authorities are responsible for looking after a greater number of children with increasingly complex needs.
Sufficiency of accommodation for children in care and care leavers
Local authorities must have enough accommodation of the right type and in the right place for children in care and care leavers. This forms the basis of the ‘sufficiency duty’ that all local authorities are legally required to meet. This year, we reported on how local authorities plan to meet the sufficiency duty and on some of the challenges this involved.[footnote 92]
The biggest challenge is finding homes for children with complex needs. In some areas, this is leading to local authorities having to be creative about meeting the needs of the children in their area, from offering bespoke support to a foster carer, to opening up solo homes that only cater for one child to allow children to be accommodated safely.
This year, we introduced the multi-building registration of children’s homes, which means that a provider can now apply to register a single home where the care and accommodation are provided in more than one building. This reflects the changing ways in which services for children are being provided and should help increase system capacity.
However, we do have concerns about the increase in single-child homes. They can isolate children, be very expensive, and create additional safeguarding risks. They can be right for some children, but this is not a trend we should uncritically welcome.
Because of the increasing number of children entering care, local authorities often spend a disproportionate amount of time finding accommodation for individual children. Although they may be successful in meeting these children’s needs, they often do not have an established approach to sufficiency that could help them deal with future challenges in a more strategic way. However, in many areas, children are placed in unsuitable, sometimes unregulated, accommodation.
Providers currently hold a lot of power in the market, and there are often several local authorities competing for too few places. As well as providers being able to ‘cherry-pick’ the children that they accept, they can also ‘charge what they want’. We have been concerned about this for a number of years and it was also highlighted in a recent review by the Competition and Markets Authority in response to concerns about how the market for children’s social care places operates.[footnote 93]
In many cases, local authorities are unable to follow their own plans because there are not enough children’s home managers, staff and foster carers. Some local authorities have reported seeing an ageing population of foster carers, who often do not feel able to take older children or teenagers. According to our fostering data, however, 57% of new carers were aged under 50 (5% in their 20s, 21% in their 30s and 31% in their 40s).[footnote 94] Both local authority staff and providers shared the view that foster care would benefit from a national recruitment campaign, as there is for teachers.
We looked at the reasons why children go into children’s homes, based on data collected in late 2019. For just under half of the children included in the research, a residential placement was not the first choice. For 75%, the first choice was foster care. One third of the children were aged 13 or under, and 68% entered homes because their placement had broken down.
Types of needs that children’s homes offer care for
We know that there can be a mismatch between the needs of children looked after and the accommodation options to meet them. Children are sometimes moved 100 miles or more away from their local authority to be accommodated in a suitable home. Average distances range from 20 miles in the north west to 64 miles in the south west.
Children living in homes that accommodate children with mental health problems travel furthest on average to their home (44 miles). Children living in homes that can accommodate the following 3 groups of needs are generally closest to the home they lived in before coming into care: complex health needs (26 miles); sensory impairment (23 miles); and physical disabilities (21 miles). This is likely due, at least in part, to the requirement for local authorities to meet the needs of disabled children. This requirement has meant that local authorities either have their own provision for children with these needs or have a partnership arrangement with a local voluntary organisation.
Unregistered children’s homes
Alongside our regulatory work, we receive and investigate information about children’s homes that may be unregistered. An unregistered home is a place where a child is living and being provided with some form of ‘care’ but which is not registered with Ofsted. This is illegal. Once a home provides care as well as accommodation, it must register as a children’s home.
This year, we looked into 595 possible unregistered children’s homes and found that 92% of them should have been registered. Most of these have since received warning letters. Some will have closed, and we are still processing the remainder. The remaining 8% were providing unregulated services such as supported accommodation.
An increasing number of children who have complex needs or are at significant risk are looked after by local authorities in unregistered provision under deprivation of liberty orders. This is either because they do not meet the criteria to be detained under the Mental Health Act or a secure accommodation order, or because of a severe shortage of places in secure children’s homes or specialist mental health provision. For some children, the current secure estate is not able to meet their needs. There was a 462% increase in applications to deprive children of their liberty between 2017/18 and 2020/21.[footnote 95]
Many local authority professionals have talked about the impact of the lack of suitable accommodation, particularly on children deemed to be a risk to themselves or others. Local authorities sometimes use unregistered children’s homes because they need accommodation immediately. In some cases, local authorities have helped a provider register retrospectively.
However, placing children in unregistered provision is illegal and can put them at risk of harm, because there is no regulatory oversight of the suitability and experience of the adults, the building or the arrangements.
One reason that local authorities use unregistered accommodation is because, even when homes have space available, they are sometimes reluctant to take children with complex needs, such as children who have been involved in crime or are at risk of criminal exploitation. Although local authorities reassure them, homes often worry that they would be downgraded if Ofsted inspects them.
However, there is no clear link between the types of needs accommodated by children’s homes and inspection grades. Homes should clearly set out in their statement of purpose which children they can care for, and should have the staff, skills and facilities to accommodate them. The best homes do this well and can provide care to children with the most complex needs.
Supported accommodation
For several years, increasing numbers of children in care and care leavers have been living in unregulated semi-independent and independent accommodation. The use of this type of provision for children under 16 has now been banned. In December 2021, we agreed to develop plans to regulate and inspect supported accommodation for 16- and 17-year-old children in care and care leavers.[footnote 96] Because supported accommodation is hugely varied, to reflect the diverse and changing needs of individual young people, we will be flexible in our approach to regulation.
The government expects to publish the relevant regulations by early 2023, and the standards and regulations will become mandatory in autumn 2023. We expect to publish registration guidance early in 2023 and to accept applications for registration from April 2023. We will also consult next year on proposals for inspection and plan to begin inspecting supported accommodation in April 2024.
Secure children’s homes
The lack of places in secure accommodation for children has had a big impact on local authorities’ ability to find suitable accommodation in their local areas. The number of secure children’s homes (SCHs) has reduced from 29 in 2002 to 13 in 2022. At 31 August 2022, there were 227 registered places in SCHs. Of these:
-
126 are for children who the courts consider pose a significant risk to themselves or others, and cannot be kept safe by any other placement
-
101 are commissioned by the Youth Custody Service for vulnerable children who have been remanded to custody by the courts or are serving a custodial sentence.
Because of these children’s individual and increasingly complex needs, combined with staff recruitment and retention issues and some ageing buildings, some SCHs often operate at reduced capacity.
In March this year, around 50 children who are a significant risk to themselves or others were waiting for a place in secure accommodation every day. This had almost doubled from 25 the previous year. Additionally, at any one time around 30 children are placed in Scottish secure units by English local authorities because there is not enough provision in England. There has been an increase in the number of children experiencing mental health difficulties and children who have complex needs. A lack of mental health provision also means that some of these children are placed in SCHs because no other provision can look after them and keep them safe. The children who cannot be placed in an SCH often end up in unregistered provision.
Local authorities try to provide for these children in other ways, such as creating solo placements in existing homes. This then reduces the number of beds available for other children.
Unaccompanied asylum-seeking children
Local authorities that are points of entry into the UK see higher numbers of children entering the country than other local authorities. However, supporting unaccompanied asylum-seeking children is a shared national responsibility under the National Transfer Scheme (NTS), which became mandatory in November 2021.[footnote 97] Local authorities are currently exempt from accepting transfers of unaccompanied asylum-seeking children into the area if 0.1% or more of their general child population are classed as unaccompanied asylum-seeking children. The threshold increased in August 2022 and the number of exempt local authorities has reduced from 16 in 2021 to 9. Many, but not all, local authorities are meeting their legal obligation under the NTS.
Children who have no parent or responsible adult to care for them are generally accommodated under section 20 of the Children Act 1989. This means they are ‘looked after’, and owed the same duties as all looked after children. These children may also have additional needs or need specialist legal advice on immigration matters.[footnote 98]
A major concern about these children is the risk from people traffickers. In almost all local authorities, there are multi-agency networks that work to prevent harm and reduce exploitation and trafficking. They use the National Referral Mechanism if they suspect modern slavery, and work with the Home Office to process immigration status applications, based on individual legal advice. These networks help to provide security for asylum-seeking children.
Many local authorities have seen an increase in the number of children seeking asylum. Several saw unparalleled numbers of unaccompanied minors arriving in 2021/22, principally on the south-east coast or near major transport hubs. In one area, the increase in unaccompanied asylum-seeking children was so great that it resulted in a dramatic change in its care population.
Most unaccompanied asylum-seeking children have had a long and arduous journey, during which some are abused or exploited. Our inspections found that, overall, children received thoughtful support by experienced workers and carers, who were understanding about the harm the children had experienced and sensitive to their needs. Many children were helped to access psychological assistance as well as healthcare.
In spring 2022, we provided advice and assistance to the Independent Chief Inspector of Borders and Immigration (ICIBI), when it inspected the use of hotels for housing unaccompanied asylum-seeking children.[footnote 99] Our inspectors accompanied ICIBI inspectors during the on-site phase of the inspection. Our expertise helped ICIBI exercise its legislative powers to assess whether the Home Secretary has upheld her duty to ensure the welfare of children.


Care leavers
In the general population, the time to become an independent adult has lengthened. Young adults are living with their families, or being supported financially by them, for longer. Care leavers, who do not have this option, often feel less well supported than their peers. A third of care leavers we surveyed feel that they left care before they were ready and many do not have anyone to ask, or know where to go, for practical help.
Relationships are important to care leavers’ feelings of preparedness for life after care, as well as to their mental health and emotional well-being.
Children in care should be allocated a personal adviser to work alongside their social worker while they are in care. The adviser takes over as the child reaches 18, to help them with practical issues such as managing money, cooking and preparation for employment.[footnote 100] However, only 30% of the care leavers we surveyed had met their personal adviser at age 16 or earlier, and a quarter did not meet them until they were at least 18.
Not meeting a personal adviser until they are about to leave care, or in some cases after they had left care, means that many care leavers miss this vital source of information and support. Only around half of care leavers were aware of the help they were entitled to in the care leaver local offer. This is a list of all the financial and other support that care leavers are eligible for, and that each local authority must make available to them.[footnote 101]
We have recently consulted on adding a new separate judgement to our ILACS framework to highlight the experiences and progress of care leavers and the work that local authorities do to support them. This was in response to a number of factors, including some local authorities not meeting their duties; our own and other stakeholders’ interest in giving care leavers a higher profile; and early indications from the Care Review.
Respondents overwhelmingly supported a separate judgement and provided helpful suggestions for the evaluation criteria. Most also welcomed our proposal to introduce this judgement from January 2023, by which date all local authorities will have had at least one standard or short ILACS inspection. The updated framework was published in early December 2022.[footnote 102]
8. Bibliography: Ofsted’s publications this year
A list of Ofsted publications published on GOV.UK in this Annual Report’s reporting period, 1 September 2021 to 31 August 2022.
8.1 Strategy
‘Ofsted strategy 2022 to 2027’, 26 April 2022.
8.2 Research and analysis
‘Ofsted’s independent review of teachers’ professional development: terms of reference’, 22 September 2021.
‘Ofsted’s independent review of tutoring: terms of reference’, 22 September 2021.
‘How early years multiple providers work’, 28 October 2021.
‘How groups of children’s homes work’, 28 October 2021.
‘Ofsted Annual Report 2020/21: education, children’s services and skills’, 7 December 2021.
‘Education recovery in early years providers: autumn 2021’, 16 December 2021.
‘Education recovery in schools: autumn 2021’, 16 December 2021.
‘Education recovery in further education and skills providers: autumn 2021’, 16 December 2021.
‘“Ready or not”: care leavers’ views of preparing to leave care’, 19 January 2022.
‘Ofsted: gender pay gap report and data 2021’, 27 January 2022.
‘Securing good attendance and tackling persistent absence’, 7 February 2022.
‘Early help: concepts, policy directions and multi-agency perspectives’, 10 February 2022.
‘Research review series: PE’, 18 March 2022.
‘Prison education: a review of reading education in prisons’, 22 March 2022.
‘Education recovery in schools: spring 2022’, 4 April 2022.
‘Education recovery in early years providers: spring 2022’, 4 April 2022.
‘Education recovery in further education and skills providers: spring 2022’, 4 April 2022.
‘Education recovery in prisons’, 4 April 2022.
‘Why do children go into children’s homes?’, 13 April 2022.
‘Review of Ofsted’s statistical publications’, 10 May 2022.
‘Research review series: computing’, 16 May 2022.
‘Research review series: English’, 23 May 2022.
‘What types of needs do children’s homes offer care for?’, 8 July 2022.
‘Ofsted corporate annual report and accounts 2021 to 2022’, 14 July 2022.
‘Schools commentary July 2022: schools that require improvement’, 14 July 2022.
‘Ofsted survey of teachers’, 14 July 2022.
‘Education recovery in schools: summer 2022’, 20 July 2022.
‘Education recovery in early years providers: summer 2022’, 20 July 2022.
‘Education recovery in further education and skills providers: summer 2022’, 20 July 2022.
‘Children’s social care 2022: recovering from the COVID-19 pandemic’, 27 July 2022.
8.3 Commentaries
‘Launching our prison education review’, 10 September 2021.
‘HMCI commentary: Ofsted’s strategy 2022 to 2027’, 26 April 2022.
‘HMCI commentary: consulting on Ofsted’s new area SEND framework’, 13 June 2022.
8.4 Blogs
Schools and further education and skills
‘Curious about what’s it like being an inspector?’, 14 September 2021.
‘Back into a routine: looking at schools in light of COVID’, 10 November 2021.
‘Investigating unregistered schools – how you can help’, 15 November 2021.
‘Quality assuring providers of full-time online education’, 24 November 2021.
‘Inspection timetable: what will the additional funding mean for your school?’, 30 November 2021.
‘Curriculum: keeping it simple’, 8 December 2021.
‘What to expect on a primary deep dive – some guidance for subject leaders’, 2 February 2022.
‘New inspection framework for lead providers of the early career framework and national professional qualifications’, 2 March 2022.
‘Three free Ofsted webinars for school leaders and staff: register to join’, 21 March 2022.
‘Supporting secondary school pupils who are behind with reading’, 28 April 2022.
‘The education inspection framework (EIF) – looking ahead to September 2022’, 11 July 2022.
‘Asking teachers what they think: Ofsted’s recent Teacher Tapp survey results’, 14 July 2022.
‘What next for further education and skills initial teacher education inspections?’, 19 July 2022.
Social care
‘Applying to register a children’s home: top tips’, 15 September 2021.
‘Multi-building children’s homes: creating more capacity in the system’, 1 October 2021.
‘Planning for leaving care: some initial thoughts from our research’, 28 October 2021.
‘Our new report on care leavers’ experiences of preparing to leave care’, 27 January 2022.
‘Reflecting on early help’, 10 February 2022.
‘Enduring, positive relationships must be at the heart of the care system’, 26 April 2022.
‘Foster Care Fortnight – 9 to 22 May 2022’, 11 May 2022.
‘Consultation on a judgement for care leavers in our inspections of local authority children’s services’, 5 July 2022.
‘Supported accommodation – we need strong oversight to make sure young people are safe, secure and doing well’, 31 August 2022.
8.5 Official statistics and management information
‘Children’s social care statistics’.
‘Early years and childcare statistics’.
‘Further education and skills statistics’.
‘Initial teacher education statistics’.
‘Non-association independent schools statistics’.
‘State-funded schools statistics’.
‘Unregistered schools management information’.
8.6 Speeches
‘Amanda Spielman at researchED National Conference 2021’, 6 September 2021.
‘Amanda Spielman at the AoC Annual Conference 2021’, 17 November 2021.
‘Amanda Spielman at the 2021 Schools & Academies Show’, 18 November 2021.
‘Amanda Spielman at the Nursery World Business Summit 2022’, 8 March 2022.
‘Amanda Spielman’s speech at the 2022 ASCL Annual Conference’, 14 March 2022.
‘Amanda Spielman at the Annual Apprenticeship Conference 2022’, 21 March 2022.
‘Amanda Spielman’s speech at the 2022 Schools and Academies Show’, 27 April 2022.
‘Amanda Spielman’s speech to the Confederation of School Trusts’, 16 June 2022.
‘Amanda Spielman at the AELP National Conference 2022’, 27 June 2022.
‘Amanda Spielman’s speech to the Festival of Education, 2022’, 8 July 2022.
‘Yvette Stanley’s speech to the ADCS conference 2022’, 19 July 2022.
8.7 Correspondence (published for transparency and information)
‘Amanda Spielman letter to the Secretary of State for Justice about Oakhill Secure Training Centre’, 14 October 2021.
‘Supported accommodation: Education Secretary’s letter to Ofsted’, 15 December 2021.
‘Inspection of supported accommodation: Amanda Spielman’s response to the Education Secretary’, 11 January 2022.
9. Annex: data tables for figures
Figure 1: Registered early years and childcare providers, inspections and regulatory visits in 2021/22
| EYR inspections | CR inspections | EYR regulatory visits | CR regulatory visits | Total Number of providers | |
|---|---|---|---|---|---|
| Nurseries and pre-schools | 5,780 | 170 | 3,060 | 99 | 27,100 |
| Childcare on domestic premises | 76 | 0 | 120 | 1 | 230 |
| Childminders | 5,790 | 68 | 2,470 | 73 | 29,600 |
| Nannies | 0 | 170 | 0 | 200 | 8,660 |
| Childminder Agencies | |
|---|---|
| Number of childminder agencies | 7 |
| Childminders on roll | 1,300 |
| Number of inspections | 4 |
| 2021/22 | |
|---|---|
| Total number of inspections | 12,100 |
| Total number of regulatory visits | 6,020 |
1. Number of providers registered with Ofsted on 31 August 2022.
2. CR includes the Compulsory Childcare Register (CCR) and the Voluntary Childcare Register (VCR). EYR is the Early Years Register.
3. Regulatory activity is carried out on site or by telephone call.
4. Includes 2021/22 inspections with a report published by 30 September 2022.
5. Numbers over 100 are rounded.
See Figure 1
Figure 2: Overall effectiveness of early years providers: 31 August 2022
| Number of providers | % Outstanding | % Good | % Requires improvement | % Inadequate | |
|---|---|---|---|---|---|
| All providers on the Early Years Register | 39,900 | 15 | 82 | 2 | 1 |
| Childminders | 23,400 | 12 | 84 | 2 | 1 |
| Nurseries and pre-schools | 16,300 | 18 | 78 | 3 | 1 |
| Childcare on domestic premises | 170 | 20 | 70 | 4 | 5 |
1. Includes inspections carried out by 31 August 2022 with a report published by 30 September 2022.
2. Percentages are rounded and may not add to 100.
3. Numbers over 100 are rounded.
See Figure 2
Figure 3: Overall effectiveness and key judgements of providers on the Early Years Register, 2021/22
| Number of inspections | % Outstanding | % Good | % Requires improvement | % Inadequate | |
|---|---|---|---|---|---|
| Overall effectiveness | 9,710 | 13 | 70 | 8 | 9 |
| Quality of education | 9,710 | 13 | 72 | 9 | 5 |
| Behaviour and attitudes | 9,710 | 16 | 71 | 8 | 5 |
| Personal development | 9,710 | 15 | 70 | 7 | 9 |
| Leadership and management | 9,710 | 13 | 70 | 8 | 9 |
1. Includes 2021/22 inspections with a report published by 30 September 2022.
2. Percentages are rounded and may not add to 100.
3. Numbers over 100 are rounded.
See Figure 3
Figure 4: Overall effectiveness of early years providers inspected, by year
| Number of inspections | % Outstanding | % Good | % Requires improvement | % Inadequate | |
|---|---|---|---|---|---|
| All EYR providers 2021/22 | 9,710 | 13 | 70 | 8 | 9 |
| All EYR providers 2020/21 | 1,770 | 6 | 76 | 9 | 9 |
| All EYR providers 2019/20 | 7,330 | 18 | 70 | 6 | 5 |
| Childminders 2021/22 | 4,750 | 13 | 75 | 6 | 7 |
| Childminders 2020/21 | 880 | 5 | 82 | 8 | 6 |
| Childminders 2019/20 | 4,700 | 17 | 74 | 5 | 4 |
| Nurseries and pre-schools 2021/22 | 4,890 | 14 | 65 | 10 | 11 |
| Nurseries and pre-schools 2020/21 | 870 | 7 | 71 | 10 | 12 |
| Nurseries and pre-schools 2019/20 | 2,600 | 21 | 64 | 8 | 7 |
1. Includes 2021/22 inspections with a report published by 30 September 2022.
2. Data for 2020/21 has been included for reference but should be treated with caution, as inspection activity was limited due to the pandemic.
3. ‘All EYR’ providers includes nurseries and pre-schools, childminders and childcare on domestic premises.
4. Percentages are rounded and may not add to 100.
5. Numbers over 100 are rounded.
See Figure 4
Figure 5: Number of providers that joined and left the sector by provider type, 2021/22
| Joiners | Leavers | |
|---|---|---|
| Childminders | 1,530 | 5,590 |
| Nurseries and pre-schools | 2,710 | 3,030 |
1. Most leavers are provider resignations and most joiners are new provider registrations, but some will be providers moving between the Early Years Register (EYR) and the Childcare Register (CR).
See Figure 5
Figure 6: The number of places offered by EYR providers, over time
| Year | Childminders | Nurseries and pre-schools |
|---|---|---|
| 2011 | 281,000 | 1,020,000 |
| 2012 | 283,000 | 1,030,000 |
| 2013 | 275,000 | 1,020,000 |
| 2014 | 263,000 | 1,030,000 |
| 2015 | 260,000 | 1,020,000 |
| 2016 | 257,000 | 1,020,000 |
| 2017 | 254,000 | 1,030,000 |
| 2018 | 249,000 | 1,050,000 |
| 2019 | 238,000 | 1,080,000 |
| 2020 | 224,000 | 1,080,000 |
| 2021 | 206,000 | 1,090,000 |
| 2022 | 181,000 | 1,090,000 |
1. Places offered by childcare on domestic premises are excluded due to small numbers.
2. The number of places has been recorded differently since 2018 as a result of a new administrative database.
3. Data refers to places on 31 August in each year.
4. Number of places are rounded.
See Figure 6
Figure 7: State-funded schools and inspections in 2021/22
| Phase | Number of schools | Number of inspections |
|---|---|---|
| Nursery schools | 390 | 60 |
| Primary schools | 16,800 | 3,320 |
| Secondary schools | 3,410 | 960 |
| Special schools | 1,080 | 210 |
| Alternative provision | 340 | 63 |
| Total inspections | n/a | 4,620 |
1. Number of schools open on 31 August 2022.
2. Includes graded inspections, ungraded inspections, monitoring inspections and urgent inspections.
3. Includes 2021/22 inspections with a report published by 7 October 2022.
4. Numbers over 100 are rounded.
See Figure 7
Figure 8: Overall effectiveness of state-funded schools: 31 August 2022
| Number of providers | % Outstanding | % Good | % Requires improvement | % Inadequate | |
|---|---|---|---|---|---|
| All schools | 21,700 | 18 | 70 | 9 | 3 |
| Primary | 16,700 | 15 | 74 | 8 | 3 |
| Secondary | 3,330 | 18 | 62 | 14 | 6 |
| Special | 1,030 | 36 | 53 | 6 | 5 |
| Nursery | 390 | 62 | 36 | 2 | 1 |
| Alternative provision | 330 | 18 | 70 | 8 | 5 |
1. Includes inspections carried out by 31 August 2022 with a report published by 7 October 2022.
2. Percentages are rounded and may not add to 100.
3. Numbers of providers are rounded.
See Figure 8
Figure 9: Overall effectiveness and key judgements of graded inspections of state-funded schools, 2021/22
| Number of inspections | % Outstanding | % Good | % Requires improvement | % Inadequate | |
|---|---|---|---|---|---|
| Overall effectiveness | 2,330 | 5 | 63 | 25 | 7 |
| Quality of education | 2,330 | 5 | 65 | 26 | 4 |
| Behaviour and attitudes | 2,330 | 12 | 72 | 12 | 3 |
| Personal development | 2,330 | 14 | 74 | 10 | 2 |
| Leadership and management | 2,330 | 8 | 66 | 21 | 6 |
| Early years provision | 1,540 | 8 | 72 | 17 | 3 |
| Sixth-form provision | 350 | 18 | 66 | 13 | 2 |
1. Includes 2021/22 inspections with a report published by 7 October 2022.
2. Based on graded inspections only.
3. Percentages are rounded and may not add to 100.
4. Numbers of inspections are rounded.
See Figure 9
Figure 10: Outcomes of graded inspections of previously exempt schools, 2021/22
| Number of inspections | % Outstanding | % Good | % Requires improvement | % Inadequate | |
|---|---|---|---|---|---|
| All previously exempt schools | 370 | 17 | 62 | 17 | 4 |
| Primary | 260 | 14 | 65 | 18 | 3 |
| Secondary | 100 | 25 | 54 | 14 | 7 |
1. Includes 2021/22 inspections with a report published by 7 October 2022.
2. Based on graded inspections only.
3. Percentages are rounded and may not add to 100.
4. Numbers of inspections are rounded.
See Figure 10
Figure 11: Overall effectiveness and key judgements of graded inspections of previously exempt schools, 2021/22
| Number of inspections | % Outstanding | % Good | % Requires improvement | % Inadequate | % Yes | % No | |
|---|---|---|---|---|---|---|---|
| Overall effectiveness | 370 | 17 | 62 | 17 | 4 | 0 | 0 |
| Quality of education | 370 | 18 | 65 | 16 | 1 | 0 | 0 |
| Behaviour and attitudes | 370 | 34 | 57 | 9 | 1 | 0 | 0 |
| Personal development | 370 | 35 | 58 | 6 | 1 | 0 | 0 |
| Leadership and management | 370 | 21 | 61 | 14 | 4 | 0 | 0 |
| Early years provision | 260 | 22 | 62 | 15 | 2 | 0 | 0 |
| Sixth-form provision | 90 | 49 | 44 | 6 | 1 | 0 | 0 |
| Is safeguarding effective? | 370 | 0 | 0 | 0 | 0 | 97 | 3 |
1. Includes 2021/22 inspections with a report published by 7 October 2022.
2. Based on graded inspections only.
3. Percentages are rounded and may not add to 100.
4. Numbers of inspections over 100 are rounded.
See Figure 11
Figure 12: Outcomes of ungraded inspections of previously exempt schools, 2021/22
| Number of inspections | % School remains outstanding | % School remains outstanding (concerns) | |
|---|---|---|---|
| All previously exempt schools | 130 | 41 | 59 |
| Primary | 110 | 40 | 60 |
| Secondary | 20 | 43 | 57 |
1. Includes 2021/22 inspections with a report published by 7 October 2022.
2. Based on ungraded inspections only.
3. Numbers of inspections over 100 are rounded.
See Figure 12
Figure 13: Inspection outcomes of secondary schools previously judged requires improvement, by academic year
| Number of inspections | % Improved to good or outstanding | % Remained requires improvement | % Declined to inadequate | |
|---|---|---|---|---|
| 2021/22 | 230 | 66 | 25 | 9 |
| 2020/21 | 13 | 85 | 0 | 15 |
| 2019/20 | 130 | 42 | 41 | 17 |
| 2018/19 | 200 | 46 | 38 | 17 |
| 2017/18 | 180 | 46 | 44 | 9 |
| 2016/17 | 260 | 44 | 34 | 22 |
| 2015/16 | 300 | 55 | 29 | 16 |
| 2014/15 | 380 | 45 | 39 | 16 |
1. Data for 2021/22 includes inspections with a report published by 7 October 2022.
2. Data for 2020/21 has been included for reference but should be treated with caution, as inspection activity was restricted due to the pandemic.
3. Percentages are rounded and may not add to 100.
4. Numbers of inspections over 100 are rounded.
See Figure 13
Figure 14: Proportion of pupils reaching the expected standard in key stage 2 reading, writing and maths in 2021/22, for graded and ungraded inspections of primary schools in 2021/22
| Number of inspections | Maximum excluding outliers | Top of inter-quartile range | Median | Bottom of inter-quartile range | Minimum excluding outliers | |
|---|---|---|---|---|---|---|
| Outstanding | 150 | 98 | 83 | 74 | 64 | 37 |
| Good | 2,360 | 100 | 69 | 58 | 47 | 14 |
| Requires improvement | 350 | 83 | 57 | 47 | 37 | 8 |
| Inadequate | 71 | 100 | 61 | 47 | 29 | 8 |
1. Includes 2021/22 inspections with a report published by 7 October 2022.
2. Includes both graded and ungraded inspections, where an ungraded inspection is shown as the previous grade for the school (good or outstanding) unless it converted to a graded inspection. Some ungraded inspections found that the school may be improving or raised concerns, but the school retained its grade and will have a graded inspection within 12 months.
3. Based on key stage 2 data from the Department for Education. Excludes primary schools that do not offer key stage 2 (for example infant schools) and schools with missing data in 2021/22.
4. Outliers have been excluded from the chart. Outliers are values beyond 1.5 x the inter-quartile range.
5. Numbers of inspections over 100 are rounded.
See Figure 14
Figure 15: Progress 8 scores for 2021/22, for graded and ungraded inspections of secondary schools in 2021/22
| Number of inspections | Maximum excluding outliers | Top of inter-quartile range | Median | Bottom of inter-quartile range | Minimum excluding outliers | |
|---|---|---|---|---|---|---|
| Outstanding | 58 | 1.2 | 0.8 | 0.6 | 0.4 | -0.2 |
| Good | 590 | 1.1 | 0.3 | 0.0 | -0.3 | -1.0 |
| Requires improvement | 150 | 0.8 | -0.1 | -0.4 | -0.7 | -1.3 |
| Inadequate | 54 | 0.6 | -0.1 | -0.5 | -0.8 | -1.5 |
1. Includes 2021/22 inspections with a report published by 7 October 2022.
2. Includes both graded and ungraded inspections, where an ungraded inspection is shown as the previous grade for the school (good or outstanding) unless it converted to a graded inspection. Some ungraded inspections found that the school may be improving or raised concerns, but the school retained its grade and will have a graded inspection within 12 months.
3. Based on key stage 4 data from the Department for Education.
4. Outliers have been excluded from the chart. Outliers are values beyond 1.5 x the inter-quartile range.
5. Numbers of inspections over 100 are rounded.
See Figure 15
Figure 16: Non-association independent schools and inspections in 2021/22
| School type | Number of open schools | Number of standard inspections | Number of additional inspections |
|---|---|---|---|
| All non-association independent schools | 1,170 | 460 | 240 |
| Independent special schools | 620 | 230 | 150 |
| Other independent schools | 550 | 220 | 88 |
1. Number of schools on 31 August 2022.
2. Includes 2021/22 inspections with a report published by 30 September 2022.
3. Numbers over 100 are rounded.
See Figure 16
Figure 17: Overall effectiveness of non-association independent schools: 31 August 2022
| School type | Number of providers | % Outstanding | % Good | % Requires improvement | % Inadequate |
|---|---|---|---|---|---|
| All non-association independent schools | 1,070 | 11 | 64 | 17 | 8 |
| Independent special schools | 550 | 13 | 68 | 14 | 5 |
| Other independent schools | 520 | 9 | 60 | 19 | 12 |
1. Includes inspections carried out by 31 August 2022 with a report published by 30 September 2022.
2. Numbers over 100 are rounded.
See Figure 17
Figure 18: Overall effectiveness and key judgements of non-association independent schools, 2021/22
| Key judgement | Number of inspections | % Outstanding | % Good | % Requires improvement | % Inadequate |
|---|---|---|---|---|---|
| Overall effectiveness | 460 | 5 | 57 | 24 | 13 |
| Quality of education | 460 | 7 | 60 | 25 | 9 |
| Behaviour and attitudes | 460 | 20 | 69 | 8 | 4 |
| Personal development | 460 | 20 | 63 | 13 | 5 |
| Leadership and management | 460 | 7 | 58 | 23 | 13 |
| Early years provision | 84 | 14 | 61 | 14 | 11 |
| Sixth-form provision | 85 | 18 | 69 | 8 | 5 |
1. Includes 2021/22 inspections with a report published by 30 September 2022.
2. A small number of inspections were not published before 30 September 2022, a higher proportion of which were inadequate.
3. Percentages are rounded and may not add to 100.
4. Numbers over 100 are rounded.
See Figure 18
Figure 19: Number of MATs by number of schools in the MAT: 31 August 2022
| Number of schools | Number of MATs |
|---|---|
| 2 | 232 |
| 3 | 163 |
| 4 | 148 |
| 5–10 | 415 |
| 11–15 | 115 |
| 16–20 | 48 |
| 21–30 | 30 |
| 31–40 | 17 |
| 41–50 | 6 |
| More than 50 | 5 |
1. MATs with one school have been excluded from these figures.
2. Based on Ofsted’s analysis of data from the Department for Education’s Get Information about Schools database.
See Figure 19
Data for Figure 20: Number of local areas for Area SEND inspection outcomes by region: 31 March 2022
| Ofsted region | No written statement of action | Written statement of action required | Total |
|---|---|---|---|
| North East, Yorkshire and the Humber | 7 | 20 | 27 |
| North West | 10 | 13 | 23 |
| East Midlands | 5 | 3 | 8 |
| West Midlands | 5 | 9 | 14 |
| East of England | 2 | 9 | 11 |
| London | 22 | 11 | 33 |
| South East | 10 | 9 | 19 |
| South West | 6 | 8 | 14 |
1. Inspections carried out between 1 May 2016 and 31 March 2022.
Data for Figure 20: Percentage of local areas for Area SEND inspection outcomes by region: 31 March 2022
| Ofsted region | No written statement of action | Written statement of action required |
|---|---|---|
| North East, Yorkshire and the Humber | 26% | 74% |
| North West | 43% | 57% |
| East Midlands | 63% | 38% |
| West Midlands | 36% | 64% |
| East of England | 18% | 82% |
| London | 67% | 33% |
| South East | 53% | 47% |
| South West | 43% | 57% |
1. Inspections carried out between 1 May 2016 and 31 March 2022.
2. Percentages are rounded and may not add to 100. Some percentages are based on small numbers, and should be treated with caution.
See Figure 20
Figure 21: Overall effectiveness of special schools: 31 August 2022
| School type | Number of providers | % Outstanding | % Good | % Requires improvement | % Inadequate |
|---|---|---|---|---|---|
| State-funded special schools | 1,030 | 36 | 53 | 6 | 5 |
| Non-association independent special schools | 550 | 13 | 68 | 14 | 5 |
1. Includes inspections carried out by 31 August 2022 with a report published by 30 September 2022 (for independent schools) or 7 October (for state-funded schools).
2. Numbers over 100 are rounded.
See Figure 21
Figure 22: Numbers of AP placements in state-funded schools, independent schools and unregistered providers, over time
| Spring census year | Percentage of placements in state-funded schools | Percentage of placements in independent schools | Percentage of placements in unregistered providers |
|---|---|---|---|
| 2010 | 52 | 31 | 17 |
| 2011 | 50 | 32 | 18 |
| 2012 | 51 | 31 | 18 |
| 2013 | 50 | 32 | 17 |
| 2014 | 53 | 35 | 12 |
| 2015 | 53 | 35 | 11 |
| 2016 | 54 | 35 | 12 |
| 2017 | 54 | 36 | 10 |
| 2018 | 53 | 34 | 13 |
| 2019 | 49 | 37 | 15 |
| 2020 | 46 | 39 | 15 |
| 2021 | 39 | 44 | 16 |
1. ‘Unregistered provision’ includes any provision not registered as a school in England, such as FE providers, providers in Wales, prisons, secure units, one-to-one tuition, work-based placements and other unregistered providers, and provision attended by pupils because it is the placement named in their education, health and care plan.
2. ‘Independent schools’ includes independent special schools, other independent schools and non-maintained special schools. These are not registered as AP providers; pupils are sent there for AP places funded by the local authority.
3. Figures are based on actual rather than planned places. Some children may have multiple part-time places at different providers. Note that the overall population of school-age children has grown during the period.
4. The number of AP placements in independent schools, excluding non-maintained special schools, in 2010 and 2021 was 11,000 and 21,300 respectively.
5. Pupil-level data from the Department for Education’s school and AP censuses.
6. Percentages are rounded and may not add to 100.
See Figure 22
Figure 23: Number of local authorities by percentage of AP placements in the independent and unregistered sectors
| Percentage of AP placements in the independent and unregistered sectors | Number of local authorities |
|---|---|
| 0–10 | 1 |
| 10–20 | 5 |
| 20–30 | 10 |
| 30–40 | 13 |
| 40–50 | 25 |
| 50–60 | 32 |
| 60–70 | 23 |
| 70–80 | 18 |
| 80–90 | 11 |
| 90–100 | 11 |
1. City of London and Isles of Scilly excluded due to small pupil numbers.
2. Based on January 2021 pupil-level data from the Department for Education’s school and AP censuses.
See Figure 23
Figure 24: Age-phase providers and ITE inspections in 2021/22
| Age-phase | Number of age-phase providers | Number of inspections |
|---|---|---|
| Primary | 130 | 22 |
| Secondary | 120 | 20 |
| Primary and secondary | 82 | 23 |
| Further education | 35 | 7 |
| Early years | 24 | 4 |
| Age-phase inspections | n/a | 76 |
1. Number of providers open on 31 August 2022.
2. Includes 2021/22 inspections with a report published by 7 October 2022.
3. Numbers over 100 are rounded.
See Figure 24
Figure 25: Overall effectiveness of ITE age-phase partnerships inspected, by academic year
| Academic year | Number of inspections | Outstanding | Good | Requires improvement | Inadequate |
|---|---|---|---|---|---|
| 2021/22 | 76 | 6 | 48 | 16 | 6 |
| 2020/21 | 36 | 1 | 16 | 12 | 7 |
| 2019/20 | 7 | 5 | 2 | 0 | 0 |
| 2018/19 | 62 | 29 | 32 | 1 | 0 |
| 2017/18 | 70 | 26 | 39 | 5 | 0 |
| 2016/17 | 48 | 12 | 34 | 1 | 1 |
| 2015/16 | 88 | 33 | 47 | 8 | 0 |
| 2014/15 | 17 | 1 | 13 | 2 | 1 |
| 2013/14 | 62 | 16 | 42 | 4 | 0 |
| 2012/13 | 61 | 12 | 38 | 11 | 0 |
1. Includes 2021/22 inspections with a report published by 7 October 2022.
See Figure 25
Figure 26: Overall effectiveness of ITE age phases, 2021/22
| Age phase | Number of inspections | Outstanding | Good | Requires improvement | Inadequate |
|---|---|---|---|---|---|
| All age phases | 76 | 6 | 48 | 16 | 6 |
| Primary | 22 | 1 | 15 | 5 | 1 |
| Secondary | 20 | 1 | 11 | 6 | 2 |
| Primary and secondary | 23 | 4 | 17 | 1 | 1 |
| Further education | 7 | 0 | 2 | 3 | 2 |
| Early years | 4 | 0 | 3 | 1 | 0 |
1. Includes 2021/22 inspections with a report published by 7 October 2022.
See Figure 26
Figure 27: FE and skills providers, inspections and visits in 2021/22
| Provider type | Number of providers | Number of inspections | Number of monitoring visits |
|---|---|---|---|
| General further education colleges | 160 | 39 | 16 |
| Independent learning providers | 1,390 | 370 | 170 |
| Adult community education providers | 150 | 19 | 2 |
| Sixth-form colleges | 44 | 12 | 1 |
| Higher education institutions | 100 | 15 | 11 |
| Dance and drama colleges | 20 | 4 | 0 |
| Specialist further education colleges | 13 | 3 | 0 |
| Independent specialist colleges | 120 | 33 | 19 |
| 16 to 19 academies | 64 | 13 | 4 |
| Total | Number of inspections | Number of new provider monitoring visits | Number of other monitoring visits |
|---|---|---|---|
| 510 | 180 | 49 |
1. Number of providers on 31 August 2022.
2. ‘Other monitoring visits’ includes reinspection monitoring visits, safeguarding monitoring visits and monitoring visits to merged colleges.
3. ‘Independent learning providers’ includes employer providers.
4. Includes 2021/22 inspections with a report published by 7 October 2022.
5. Numbers over 100 are rounded.
See Figure 27.
Figure 28: Overall effectiveness of FE and skills providers: 31 August 2022
| Provider type | Total number of providers with an inspection judgement | % Outstanding | % Good | % Requires improvement | % Inadequate |
|---|---|---|---|---|---|
| All FE and skills providers | 1,360 | 10 | 71 | 15 | 4 |
| Colleges | 200 | 14 | 77 | 9 | 0 |
| Independent learning providers | 800 | 7 | 68 | 20 | 5 |
| Adult community education providers | 140 | 1 | 95 | 3 | 1 |
| 16 to 19 academies | 55 | 49 | 49 | 2 | 0 |
| Higher education institutions | 48 | 8 | 79 | 13 | 0 |
| Independent specialist colleges | 89 | 7 | 72 | 13 | 8 |
| Dance and drama colleges | 20 | 80 | 15 | 0 | 5 |
1. Includes inspections carried out by 31 August 2022 with a report published by 7 October 2022.
2. ‘Colleges’ includes general FE colleges, sixth-form colleges and specialist FE colleges.
3. ‘Independent learning providers’ includes employer providers.
4. Numbers over 100 are rounded.
See Figure 28.
Figure 29: Overall effectiveness and key judgements of FE and skills providers at full inspections, 2021/22
| Judgement | Total number of inspections | % Outstanding | % Good | % Requires improvement | % Inadequate |
|---|---|---|---|---|---|
| Overall effectiveness | 500 | 7 | 60 | 25 | 8 |
| Quality of education | 500 | 8 | 60 | 24 | 7 |
| Behaviour and attitudes | 500 | 17 | 68 | 13 | 2 |
| Personal development | 500 | 10 | 60 | 27 | 2 |
| Leadership and management | 500 | 9 | 58 | 26 | 7 |
| Education programmes for young people | 110 | 21 | 66 | 12 | 1 |
| Adult learning programmes | 140 | 10 | 72 | 14 | 4 |
| Apprenticeships | 400 | 5 | 61 | 27 | 8 |
| Provision for learners with high needs | 110 | 17 | 56 | 19 | 7 |
1. Includes 2021/22 inspections with a report published by 7 October 2022.
2. Percentages are rounded and may not add to 100.
3. Numbers over 100 are rounded.
See Figure 29.
Figure 30: Overall effectiveness of FE and skills providers at their first full inspection, by academic year
| Year | Total number of providers | % Outstanding | % Good | % Requires improvement | % Inadequate |
|---|---|---|---|---|---|
| 2021/22 | 330 | 6 | 59 | 26 | 9 |
| 2020/21 | 51 | 8 | 55 | 29 | 8 |
| 2019/20 | 77 | 4 | 53 | 32 | 10 |
| 2018/19 | 95 | 5 | 45 | 37 | 13 |
| 2017/18 | 40 | 3 | 35 | 48 | 15 |
1. Data for 2021/22 includes inspections with a report published by 7 October 2022.
2. Percentages are rounded and may not add to 100.
3. Numbers over 100 are rounded.
See Figure 30
Figure 31: Quality of apprenticeship provision, over time
| Total number of providers with a judgement | Full inspection % outstanding | Full inspection % good | Full inspection % requires improvement | full inspection % inadequate | New provider monitoring visit % at least reasonable in all apprenticeship themes | New provider monitoring visit % insufficient in one or more apprenticeship themes | |
|---|---|---|---|---|---|---|---|
| 31 August 2022 | 1,280 | 5 | 46 | 15 | 3 | 26 | 5 |
| 31 August 2021 | 1,180 | 4 | 33 | 10 | 1 | 44 | 7 |
1. Includes inspections that had a report published by 7 October 2022.
2. Percentages are rounded and may not add to 100.
3. Numbers over 100 are rounded.
See Figure 31
Figure 32: Overall effectiveness of education, skills and work activities in prisons and young offender institutions, over time
| Total number of prisons and young offender institutions | % Outstanding | % Good | % Requires improvement | % Inadequate | |
|---|---|---|---|---|---|
| 31 August 2022 | 120 | 2 | 35 | 44 | 19 |
| 31 August 2021 | 120 | 2 | 43 | 41 | 14 |
| 31 August 2020 | 120 | 2 | 43 | 41 | 14 |
| 31 August 2019 | 110 | 3 | 47 | 37 | 13 |
| 31 August 2018 | 110 | 4 | 44 | 41 | 11 |
1. Inspections published by 31 August 2022.
2. Numbers over 100 are rounded.
See Figure 32
Data for Figure 33: Number of social care settings and percentage changes since 31 August 2021
| Provider type | Number of providers | % change |
|---|---|---|
| Children’s homes of all types | 2,970 | 7% increase |
| Adoption support agencies | 35 | 10% decrease |
| Voluntary adoption agencies | 34 | 8% decrease |
| Independent fostering agencies | 330 | 2% increase |
| Residential family centres | 72 | 18% increase |
| Residential holiday schemes for disabled children | 13 | 19% decrease |
| Secure training centre | 1 | 50% decrease |
| Further education colleges with residential accommodation | 36 | 3% decrease |
| Boarding schools | 60 | 2% increase |
| Residential special schools | 120 | No change |
1. Number of social care settings on 31 August 2022.
2. Some percentages are based on small numbers and should be treated with caution.
3. Numbers over 100 are rounded.
See Figure 33
Data for Figure 34: Overall effectiveness of children’s homes: 31 August 2022
| Provider type | Number of providers | % Outstanding | % Good | % Requires improvement to be good | % Inadequate |
|---|---|---|---|---|---|
| All children’s homes | 2,730 | 12 | 70 | 15 | 4 |
| Children’s home | 2,500 | 11 | 70 | 15 | 4 |
| Short-break-only children’s home | 160 | 15 | 72 | 11 | 2 |
| Residential special school (registered as a children’s home) | 59 | 15 | 64 | 12 | 8 |
| Secure children’s home | 13 | 31 | 54 | 15 | 0 |
1. Includes inspections carried out by 31 August 2022 with a report published by 30 September 2022.
2. Percentages are rounded and may not add to 100. Some percentages are based on small numbers and should be treated with caution.
See Figure 34
Data for Figure 35: Overall effectiveness of other social care providers: 31 August 2022
| Provider type | Number of providers | % Outstanding | % Good | % Requires improvement to be good | % Inadequate |
|---|---|---|---|---|---|
| All other social care providers | 650 | 29 | 63 | 6 | 1 |
| Independent fostering agency | 300 | 21 | 73 | 6 | 0 |
| Residential special school | 120 | 43 | 49 | 7 | 2 |
| Residential family centre | 63 | 14 | 71 | 8 | 6 |
| Boarding school | 58 | 26 | 60 | 10 | 3 |
| Further education college with residential accommodation | 36 | 42 | 53 | 6 | 0 |
| Voluntary adoption agency | 33 | 36 | 58 | 6 | 0 |
| Adoption support agency | 26 | 58 | 38 | 4 | 0 |
| Residential holiday scheme for disabled children | 11 | 55 | 45 | 0 | 0 |
1. Includes inspections carried out by 31 August 2022 with a report published by 30 September 2022.
2. The secure training centre is not included in this chart.
3. Percentages are rounded and may not add to 100. Some percentages are based on small numbers, and should be treated with caution.
See Figure 35
Data for Figure 36: Local authority inspection outcomes, over time
| Point in time | Number of providers | % Outstanding | % Good | % Requires improvement to be good | % Inadequate | % Not yet inspected |
|---|---|---|---|---|---|---|
| As at 31 August 2022 | 152 | 16 | 39 | 32 | 11 | 1 |
| At the end of the first year of ILACS | 151 | 8 | 40 | 38 | 12 | 1 |
| After each local authority’s first SIF inspection | 152 | 2 | 34 | 43 | 22 | 0 |
1. Includes inspections carried out by 31 August 2022 with a report published by 30 September 2022.
2. In this chart, SIF stands for single inspection framework.
3. Percentages are rounded and may not add to 100.
See Figure 36
Data for Figure 37: Local authority inspections and visits in 2021/22
| Visit type | Number of visits |
|---|---|
| ILACS focused visits | 51 |
| ILACS short inspections | 12 |
| ILACS standard inspections | 34 |
| ILACS monitoring visits | 36 |
| Total inspections or visits | 130 |
1. Includes 2021/22 inspections with a report published by 30 September 2022.
2. Numbers over 100 are rounded.
See Figure 37
Data for Figure 38: Social care providers and inspections in 2021/22
| Provider type | Number of providers | Number of inspections |
|---|---|---|
| Children’s homes | 2,970 | 3,510 |
| Boarding schools | 60 | 26 |
| Voluntary adoption agencies | 34 | 10 |
| Residential family centres | 72 | 50 |
| Residential holiday schemes for disabled children | 13 | 5 |
| FE colleges with residential accommodation | 36 | 15 |
| Adoption support agencies | 35 | 8 |
| Secure training centre | 1 | 3 |
| Residential special schools | 120 | 110 |
| Independent fostering agencies | 330 | 150 |
| Full, interim, monitoring and assurance visits in 2021/22 | n/a | 3,880 |
1. Number of providers on 31 August 2022.
2. Includes 2021/22 inspections with a report published by 30 September 2022.
3. Numbers over 100 are rounded.
See Figure 38
-
The term ‘nurseries and pre-schools’ is used in this report to describe childcare on non-domestic premises. ↩
-
Please note that Nursery and Reception classes in schools are covered in the Schools chapter. ↩
-
B Taggart, K Sylva, E Melhuish and P Sammons, ‘How pre-school influences children and young people’s attainment and developmental outcomes over time’, Department for Education, June 2015, pages 1 to 50. ↩
-
I Siraj-Blatchford, K Sylva, B Taggart, E Melhuish and P Sammons, ‘The effective provision of pre-school education project: findings from the pre-school period’, Department for Education and Skills and Sure Start, November 2004. ↩
-
‘Reception curriculum in good and outstanding primary schools: bold beginnings’, Ofsted, November 2017. ↩
-
‘Teaching and play in the early years: a balancing act?’, Ofsted, July 2015. ↩
-
‘Baby’s brain begins now: conception to age 3’, The Urban Child Institute. ↩
-
J Huttenlocher, M Vasilyeva, E Cymerman and S Levine, ‘Language input and child syntax’, in ‘Cognitive Psychology’, Volume 45, Issue 3, 2002, pages 337 to 374. ↩
-
Two-year-olds are eligible for government-funded childcare if their parents receive certain benefits, they are looked after or have left care, or they have an education, health and care plan. ↩
-
‘Education provision: children under 5 years of age’, Department for Education, June 2022. ↩
-
‘How early years multiple providers work’, Ofsted, October 2021. ↩
-
The Department for Education’s 2021 early years census data for private, voluntary and independent providers (excludes state-funded schools/nurseries) that deliver funded entitlements for two- to four-year-olds was matched with our inspection outcomes data. ↩
-
Data source: ‘Apprenticeships and traineeships’, Department for Education, January 2022. ↩
-
‘Births in England and Wales: 2021’, Office for National Statistics, August 2022. ↩
-
‘The difference between registering with Ofsted or a childminder agency’, Ofsted, September 2022. ↩
-
Based on multi-academy trusts with two or more schools. ↩
-
‘Review of sexual abuse in schools and colleges’, Ofsted, June 2021. ↩
-
Graded inspections are also known as section 5 inspections (under the Education Act 2005). We use Ofsted’s full framework and grade the school for its overall effectiveness and against our key judgement grade descriptors. Ungraded inspections are also known as section 8 inspections of good and outstanding schools (Education Act 2005). An ungraded inspection does not result in individual grades, but instead determines whether a school remains the same grade as it was at its previous graded inspection, may be improving or raises concerns. ↩
-
We continued to inspect if we had urgent safeguarding concerns. ↩
-
‘Ofsted inspection deferrals’, Ofsted, February 2022. ↩
-
Outstanding schools were previously exempt from routine inspection and inspected only if there were concerns or they had changed significantly, for example if the school was taking on an additional key stage. ↩
-
‘A return to inspection: the story (so far) of previously exempt outstanding schools’, Ofsted, November 2022. ↩
-
This provided some descriptive insights from a small sample of secondary schools. Findings should not be taken as representative of the whole sector. ↩
-
See page 36 of the 2016/17 Annual Report, page 56 of the 2018/19 report and page 10 of the 2019/20 report. ↩
-
Based on the Spearman coefficient. In 2021/22 the correlation coefficient is +0.46 for Progress 8 and +0.30 for key stage 2 reading, writing and maths. A perfect, strong correlation would be +1.0 or -1.0. ↩
-
In 2018/19 the correlation coefficient was +0.59 for Progress 8 and +0.37 for key stage 2 reading, writing and maths. In order to be broadly comparable to the scenario experienced in 2021/22, these correlations are based on 2018/19 performance data that was not available to inspectors at the time. ↩
-
‘Pupil absence in schools in England: autumn term’, Department for Education, May 2022. Total pupil absence combines absence data (including those absent due to a positive COVID-19 case) and data on those not attending due to circumstances related to COVID-19 (primarily those awaiting a COVID-19 test result). A pupil is classified as a persistent absentee if they miss 10% or more of the possible sessions in a given time period. ↩
-
‘Permanent exclusions and suspensions in England’, Department for Education, July 2022. ↩
-
For a school to be identified as having exceptional levels of pupil movement, a minimum of five pupils and 5% of pupils must have moved between Years 10 and 11; the number of moves must be significantly high (as identified by our statistical model that takes account of pupil characteristics), and the school must have met both of these criteria for two consecutive years. The list of 160 schools with exceptional movements relates to the years to January 2020 and to January 2021. This covers some but not all of the pandemic period. The previous list of 320 schools refers to movement in the years to January 2019 and 2020. ↩
-
‘Key stage 2 attainment 2022: national headlines’, Department for Education, July 2022. ↩
-
‘Ofsted’s thematic review of careers guidance: terms of reference’, Ofsted, November 2022. ↩
-
‘Independent review of tutoring in schools and 16 to 19 providers’, Ofsted, October 2022. ↩
-
‘National tutoring programme’, Department for Education, May 2022. ↩
-
‘Regulating independent schools’, Department for Education, August 2019. The standards cover: quality of education; spiritual, moral, social and cultural development of pupils; welfare, health and safety of pupils; suitability of staff, supply staff and proprietors; premises of and accommodation at schools; provision of information; manner in which complaints are handled; and quality of leadership in and management of schools. ↩
-
‘Additional inspections of independent schools: handbook for inspectors’, Ofsted, July 2022. ↩
-
The faith of a school is defined by whether the school has declared a religious character or ethos on the Department for Education’s Get Information about Schools site. If the school does not declare a religious character or ethos, it is categorised in our statistics as ‘non-faith’, although it is possible that some of these schools also operate as faith schools. ↩
-
‘Curriculum research reviews’, Ofsted, May 2022. Research reviews have been published in English, computing, physical education, history, music, geography, languages, mathematics, religious education and science. ↩
-
‘Key stage 2 attainment 2022: national headlines’, Department for Education, July 2022. ↩
-
‘Supporting secondary school pupils who are behind with reading’, Ofsted, April 2022. ↩
-
‘“Now the whole school is reading”: supporting struggling readers in secondary school’, Ofsted, October 2022. ↩
-
An unregistered school in this context is an institution that meets the legal definition of a school but is not registered with the Department for Education. Note that in the alternative provision section of this report the definition is slightly different, as it refers to settings used for alternative provision that are not registered as schools. This provision is not necessarily a school (for instance, it includes one-to-one tuition) and may not be illegal. ↩
-
One setting has a faith grouping of ‘other’. ↩
-
On 7 December 2022 the government announced the Schools Bill will not progress in its current form. ↩
-
‘Elective home education survey report 2021’, Association of Directors of Children’s Services, November 2021. ↩
-
‘Exploring moving to home education in secondary schools’, Ofsted, October 2019. ↩
-
‘Characteristics of children in need’, Department for Education, October 2022. ↩
-
‘SEND: old issues, new issues, next steps’, Ofsted, June 2021. ↩
-
‘SEND review: right support, right place, right time’, Department for Education and Department of Health and Social Care, March 2022. ↩
-
For the overall effectiveness ratings of state-funded special schools and alternative providers, see Figure 8 in the ‘State funded schools: state of the nation’ section. For the overall effectiveness ratings of independent special schools, see Figure 17 in ‘Independent schools: state of the nation’. ↩
-
In 2021/22, 1.49 million pupils had an education, health and care plan/statement of SEN or SEN support (this was 1.41 million in 2020/21). See: ‘Special educational needs in England’, Department for Education, June 2022. ↩
-
The number and percentage of pupils with SEND in state-funded special schools has increased year on year from 2015/16. Similar statistics are not available for independent special schools because the Department for Education summary data does not split independent schools into those that are special and those that are not. ↩
-
Before lockdown, Ofsted and Care Quality Commission (CQC) area SEND inspections identified a number of recurring weaknesses across local areas in England. ↩
-
For example, the recruitment of speech and language therapists. Based on our analysis of area SEND inspection reports for inspections carried out in 2021/22. ↩
-
Ofsted’s analysis of the data published by the Department for Education: ‘Education, health and care plans’, Department for Education, June 2022. Based on ‘rate of EHC plans excluding exceptions issued within 20 weeks’ in each calendar year. ↩
-
The ‘local area’ is the geographical area of the local authority. This includes the local authority, clinical commissioning groups, public health, NHS England for specialist services, early years settings, schools and further education providers. The local area’s responsibility for children and young people with SEND extends to those who are residents of the local area but attend educational establishments or receive services outside its boundaries. ↩
-
Structural changes to local government have been made in several areas in recent years. Two local areas we inspected no longer exist. Figures and charts in this section do not reflect the inspection outcomes for Dorset and Northamptonshire. Dorset was inspected in January 2017 and required a written statement of action. Northamptonshire was inspected in May 2017 and did not require a written statement of action. ↩
-
Between December 2018 and August 2022. Dorset was revisited in February 2019 before structural changes to local government and is not included in the figures. Dorset was deemed to be making sufficient progress in addressing some significant weaknesses. ↩
-
We spoke with children, young people and their families, those working in education, health, care and local government, and many organisations that support children and young people with SEND. ↩
-
The consultation ran between June and September 2022. See: ‘HMCI commentary: publishing our new area SEND framework’, Ofsted, November 2022. ↩
-
Independent schools register with the Department for Education as ‘independent special schools’ or ‘other’. They do not register as alternative provision schools, but they can provide alternative provision places commissioned by local authorities. In some cases, these placements by the local authorities in independent and unregistered schools will have been named on the child’s education, health and care plan. ↩
-
In state-funded, independent and unregistered AP. This is Ofsted’s analysis of pupil-level data from the school census and the alternative provision census. For more information on the school census, see: ‘School pupils and their characteristics’, Department for Education, June 2021. For more information on the alternative provision census, see: ‘Alternative provision census’, Department for Education, July 2020. ↩
-
‘Alternative provision for primary-age pupils in England: a long-term “destination” or a “temporary solution”?’, Ofsted, November 2022. ↩
-
The proportion of pupils who left AP to return to mainstream schools decreased as pupils got older. Rates were 64% among key stage 3 pupils, 53% among Year 10 pupils, and 10% among Year 11 pupils. See ‘Alternative provision market analysis’, Department for Education, October 2018, page 85. ↩
-
A 2018 study found that 30% of primary-age pupils in AP go on to attend a special school. The same applies to 16% of key stage 3 pupils and 8% of Year 10 pupils in AP; ‘Alternative provision market analysis’, Department for Education, October 2018, page 85. The finding is based on 48 local authorities’ estimates of the percentage of pupils placed in AP over the past 12 months going to different destinations after AP. ↩
-
D Thomson, ‘How many children are in unregistered alternative provision?’, FFT Education Datalab, June 2022. ↩
-
‘Alternative provision quality toolkit’, IntegratED, 2022, page 52. ↩
-
A reformed suite of national professional qualifications is now available. These have expanded to include new areas for teachers to develop their knowledge and skills in specialist areas of teaching practice. ‘National professional qualifications (NPQs)’, Department for Education, July 2020. ↩
-
‘Teacher and Leader development: ECF and NPQs’, Department for Education, July 2022. ↩
-
This includes higher education institutions that deliver level 6 and 7 apprenticeships, which only came into scope in April 2021, and colleges awaiting their first inspection since merging. ↩
-
Some providers deliver only level 6 or 7 apprenticeships. Others deliver level 6 or 7 apprenticeships alongside apprenticeships at levels 2 to 5. Inspection judgements relate to the apprenticeship provision as a whole. ↩
-
‘A review of the quality of T-level courses: interim report’, Ofsted, October 2022. ↩
-
‘Skills bootcamps thematic survey’, Ofsted, November 2022. ↩
-
‘Characteristics of children in need’, Department for Education, October 2021. ↩
-
‘Children looked after in England including adoptions’, Department for Education, November 2022. ↩
-
J MacAlister, ‘The independent review of children’s social care: final report’, May 2022. ↩
-
‘Children’s social care market study: final report’, Competition and Markets Authority, March 2022. ↩
-
‘Child protection in England’, The Child Safeguarding Practice Review Panel, May 2022. ↩
-
These do not include notifications made by providers themselves about the most serious incidents that happen to children living there and what they have done in response, or things providers are obliged to notify Ofsted about and which do not typically require further action (such as child illness). Provider notifications are not covered in this commentary. ↩
-
A more detailed breakdown of provider notifications is available in ‘Children’s social care data in England 2022’, Ofsted, July 2022. ↩
-
‘Safeguarding children with disabilities in residential settings’, Child Safeguarding Practice Review Panel, October 2022. ↩
-
‘Yvette Stanley letter to the Chair of the Child Safeguarding Practice Review Panel’, Ofsted, October 2022. ↩
-
‘Children looked after in England including adoptions’, Department for Education, November 2022. ↩
-
J MacAlister, ‘The independent review of children’s social care: final report’, May 2022. ↩
-
‘Children’s social work workforce: attrition, caseload, and agency workforce’, Department for Education, May 2022. ↩
-
J Driscoll and others, ‘Multi-agency safeguarding arrangements: overcoming the challenges of Covid-19 measures’, in ‘Journal of Children’s Services’, Volume 15, 2020, pages 267 to 274; ‘Mental health of children and young people in England, 2020: wave 1 follow up to the 2017 survey’, NHS Digital, October 2020. ↩
-
M Baginsky and J Manthorpe, ‘The impact of COVID-19 on children’s social care in England’, in ‘Child Abuse & Neglect’, Volume 116, 2021. ↩
-
‘Child protection in England’, The Child Safeguarding Practice Review Panel, May 2022. ↩
-
‘Growing up neglected: a multi-agency response to older children’, Ofsted, Care Quality Commission, HM Prison and Probation Service, and HM Inspectorate of Constabulary and Fire & Rescue Services, July 2018. ↩
-
‘Vulnerable children and young people survey’, Department for Education, August 2020. ↩
-
M Baginsky and J Manthorpe, ‘The impact of COVID-19 on children’s social care in England’, in ‘Child Abuse & Neglect’, Volume 116, 2021; M Baginsky and J Manthorpe, ‘Managing through COVID-19: the experiences of children’s social care in 15 English local authorities’, Kings College London, July 2020; https://kclpure.kcl.ac.uk/portal/en/publications/managing-through-covid19-the-experiences-of-childrens-social-care-in-15-english-local-authorities(93814072-18ea-4d76-af2d-ec124c6a8494).html. ↩
-
J MacAlister, ‘A revolution in family help’, in ‘The independent review of children’s social care: final report’, May 2022, page 31. ↩
-
‘How local authorities plan for sufficiency: children in care and care leavers’, Ofsted, November 2022. ↩
-
‘Children’s social care market study: final report’, Competition and Markets Authority, March 2022. ↩
-
‘Fostering in England: 1 April 2021 to 31 March 2022’, Ofsted, November 2022. ↩
-
A Roe, ‘What do we know about children deprived of their liberty? An evidence review’, Nuffield Family Justice Observatory, February 2022. ↩
-
‘Transformational investment in children’s social care placements’, Department of Education, December 2021. ↩
-
‘Unaccompanied asylum seeking children: national transfer scheme’, UK Visas and Immigration, July 2016. ↩
-
‘Care of unaccompanied migrant children and child victims of modern slavery: statutory guidance for local authorities’, Department for Education, November 2017. ↩
-
‘An inspection of the use of hotels for housing unaccompanied asylum-seeking children (UASC) March–May 2022’, Independent Chief Inspector of Borders and Immigration, October 2022. ↩
-
‘Local offer guidance: guidance for local authorities’, Department for Education, February 2018. ↩
-
‘Inspecting local authority children’s services’, Ofsted, 2 December 2022. ↩