Weekly NHS Test and Trace bulletin, England: 9 July to 15 July 2020
Updated 23 July 2020

© Crown copyright 2020
This publication is licensed under the terms of the Open Government Licence v3.0 except where otherwise stated. To view this licence, visit nationalarchives.gov.uk/doc/open-government-licence/version/3 or write to the Information Policy Team, The National Archives, Kew, London TW9 4DU, or email: psi@nationalarchives.gov.uk.
Where we have identified any third party copyright information you will need to obtain permission from the copyright holders concerned.
This publication is available at https://www.gov.uk/government/publications/nhs-test-and-trace-statistics-england-9-july-to-15-july-2020/weekly-nhs-test-and-trace-bulletin-england-9-july-to-15-july-2020
The data in the tables below reflect the first 7 weeks of operation of NHS Test and Trace.
For testing, they include:
- people tested for coronavirus (COVID-19)
- people testing positive for coronavirus
- time taken for test results to become available
For contact tracing, they include:
- people transferred to the contact-tracing system, and the time taken for them to be reached
- close contacts identified for complex and non-complex cases, and the time taken for them to be reached
The purpose of this data is to provide a weekly update on the implementation and performance of NHS Test and Trace. Data collected for the Test and Trace programme is primarily for operational purposes and was not designed to track the spread of the virus. Studies into the spread of the virus in the UK are carried out by the Office for National Statistics (ONS). A full explanation of the data sources and methods used to produce these statistics can be found in the methodology document.
Main points
NHS Test and Trace went live on 28 May.
Between 9 and 15 July 2020:
- 355,597 people were newly tested for coronavirus (COVID-19) under pillar 1 (testing in hospitals and outbreak locations) and pillar 2 (national swab testing) in England
- nearly half of people (46.8%) tested under pillar 2 received the result within 24 hours of taking a test. This increases to 7 out of 10 (71.4%) for tests that were carried out in person
- test results for 87.4% of people tested under pillar 1 were made available within 24 hours of the laboratory receiving the test for processing
- 3,953 new people tested positive for coronavirus (COVID-19)
- 3,887 people had their case transferred to the contact-tracing system from which 3,098 people (79.7%) were reached and asked to provide details of close contacts
- most people reached by NHS Test and Trace provided details for one or more contacts and this has increased from 77.5% to 79.9% since last week
- 16,742 people were identified as coming into close contact with someone who has tested positive and been transferred to contact tracing. Of these, 13,034 people (77.9%) were reached and asked to self-isolate, an increase from 72.0% the previous week
- of those contacts reached, 83.6% were reached within 24 hours after being identified as a close contact. 55.9% were contacted within 24 hours of the positive individual that reports them being transferred to contact tracing
- new information published this week shows 69.0% of close contacts reported to NHS Test and Trace are within the same household as the positive case transferred
In total, since 28 May 2020:
- 2,320,229 people were newly tested under pillars 1 and 2
- 38,772 new people have tested positive for coronavirus (COVID-19)
- 38,877 people had their case transferred to the contact-tracing system, of whom 29,962 (77.1%) were reached and asked to provide details of their recent close contacts
- 202,781 people were identified as coming into close contact with someone who has tested positive. Of these, 169,546 (83.6%) were reached and asked to self-isolate
Terminology
People in England who have a positive coronavirus (COVID-19) test are transferred to NHS Test and Trace. Most of these people are tested under pillar 1 or pillar 2 of the government testing strategy:[footnote 1]
- pillar 1: swab testing in Public Health England (PHE) labs and NHS hospitals for those with a clinical need, and health and care workers
- pillar 2: swab testing for the wider population, through commercial partnerships[footnote 2]
Pillar 1 testing is conducted in hospitals and at outbreak locations, while pillar 2 testing can be carried out through several different routes:
- regional test sites, which include drive-through testing centres with limited walk-up facilities. They also include local test sites, which are similar to regional test sites but specifically for walk-ups
- mobile testing units, which travel around the UK to increase access to coronavirus testing. They respond to need, travelling to test essential workers at sites including care homes, police stations and prisons
- satellite test centres, which includes test kits provided directly to ‘satellite’ centres at places like hospitals or care homes that have a particularly urgent or significant need
- home test kits, which are delivered to someone’s door so they can test themselves and their family without leaving the house
People tested refers to people who have newly been tested for COVID-19 and does not re-count people who have been tested more than once in either pillar 1 or pillar 2. People testing positive refers only to people who have newly tested positive for COVID-19 and does not include people who have had more than one positive test. NHS Test and Trace has 2 ways of handling cases depending on their complexity:
- PHE local health protection teams to manage complex cases linked to outbreaks (referred to as complex cases here)[footnote 3]
- wider online and other call centre capacity for less complex cases (referred to as non-complex cases here)
More details can be found in the methodology document.
Figure 1: flowchart showing how people move through the NHS Test and Trace service
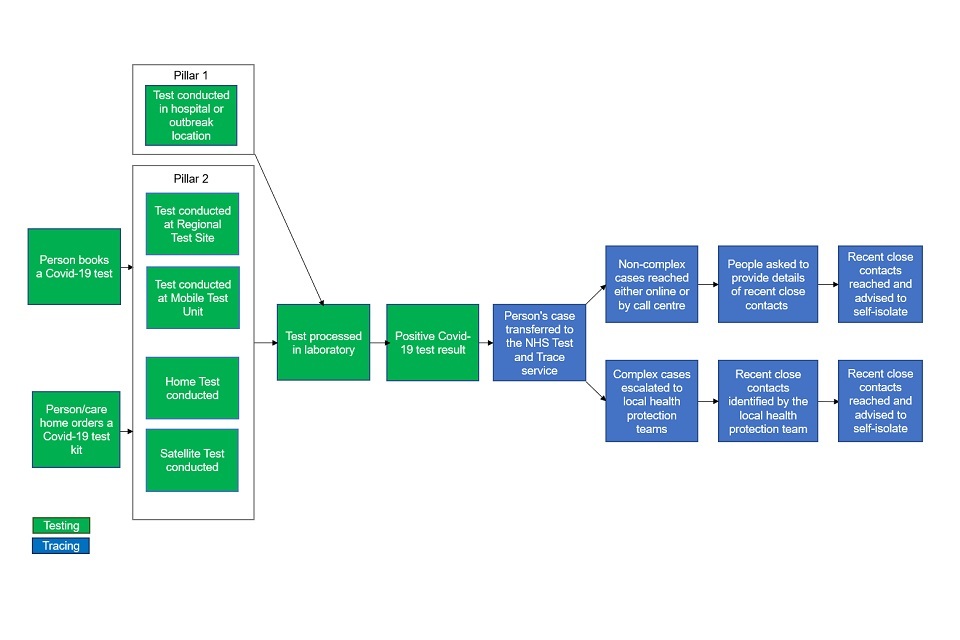
Flowchart is explained in the document text.
Revisions for the publication from 2 July to 8 July
Figures for people testing positive for coronavirus in previous releases have been revised. These revisions are because:
- there are sometimes delays in laboratories submitting data to PHE
- quality checks are conducted on the data to refine figures over time
Figures for pillar 2 testing turnaround times in the previous release have been revised. These revisions are because the figures presented are based on a data-cut several days after the end of the reporting period. Some tests may continue to be being processed after this period and therefore data may need to be revised over time.
Figures for contact tracing in previous releases have been revised. These revisions are because the figures presented are based on a data-cut several days after the end of the reporting period, to give time for cases reported towards the end of the 7-day period to have an outcome. Some cases may continue to be in progress after this period, and therefore data may need to be revised over time (the methodology document gives more detail about this).
Testing
Between 9 July and 15 July 355,597 people were newly tested for COVID-19. 3,953 new people had a positive result
Table 1: people newly tested for COVID-19 under pillars 1 and 2, England
| 2 July to 8 July: number of people | 9 July to 15 July: number of people | Since Test and Trace launched, 28 May to 15 July: number of people | |
|---|---|---|---|
| Pillar 1 | 129,182 | 129,411 | 835,784 |
| Tested postive | 937 | 872 | 10,989 |
| Pillar 2 | 199,233 | 226,186 | 1,484,445 |
| Tested postive | 2,949 | 3,081 | 27,783 |
| Total | 328,415 | 355,597 | 2,320,229 |
| Tested postive | 3,886 | 3,953 | 38,772 |
Figure 2: number of people newly tested for COVID-19 by pillar, England
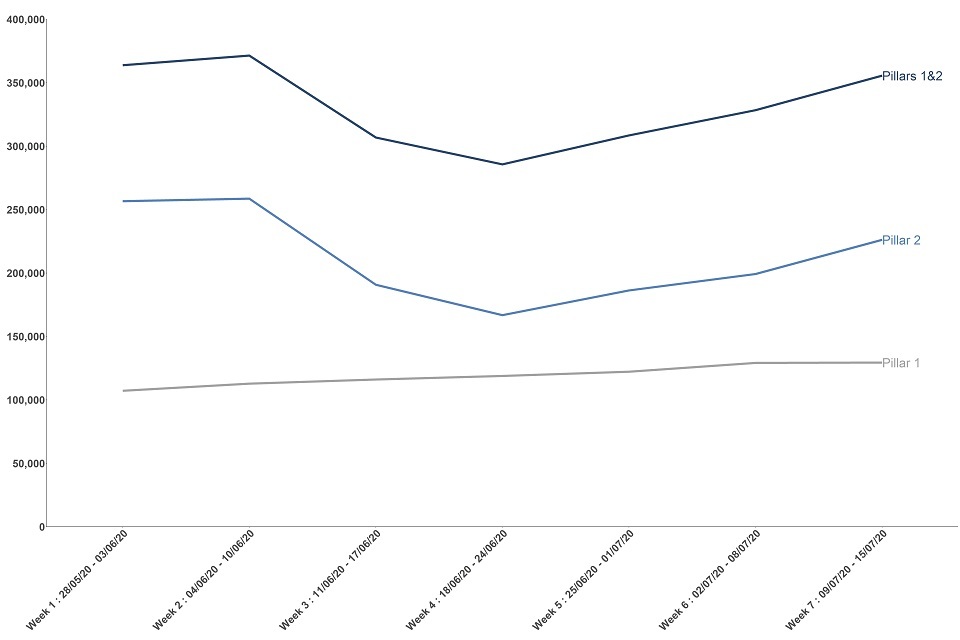
Chart is explained in the document text.
Figure 3: number of people newly testing positive for COVID-19 by pillar, England
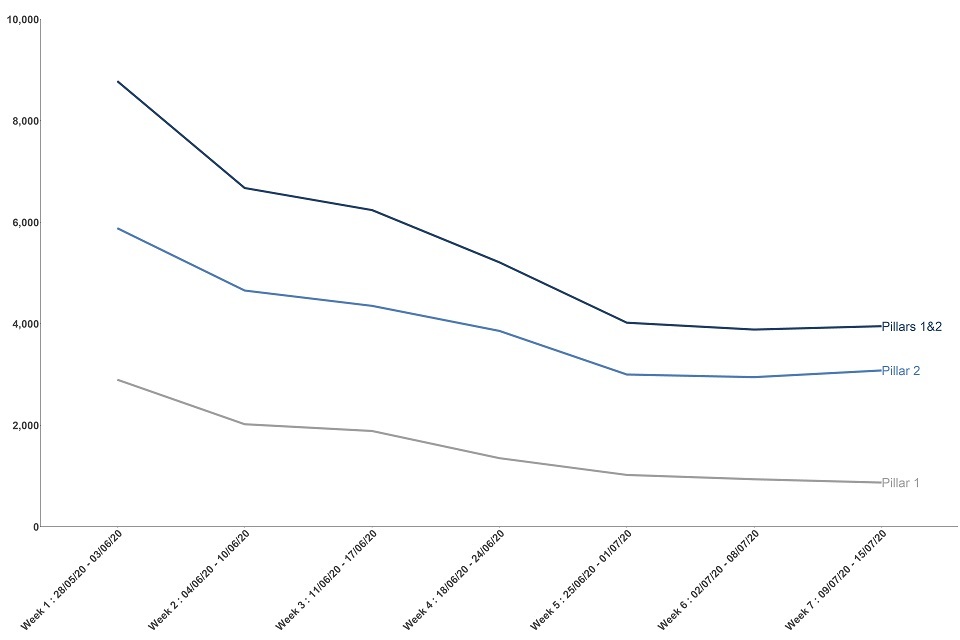
Chart is explained in the document text.
When combined, pillar 1 and pillar 2 give the total number of confirmed cases of coronavirus in the given time period and these people should all have had their cases transferred to the contact-tracing system.[footnote 4]
The number of positive cases transferred to the contact-tracing system may not always align with the number of people testing positive for coronavirus. There are several reasons for this:
- delays between a sample being taken, tested and reported, and being passed from PHE to the contact-tracing system mean that weekly totals transferred to NHS Test and Trace may include people who were tested in the previous week
- the number of people testing positive in pillar 1 may also include people tested anonymously and therefore will not have their case transferred to contact tracing
- there is not a rigorous process for de-duplication of the data being passed into the contact-tracing system each day, so some people may have their case transferred to the contact-tracing system more than once
More information is given in the methodology document.
Note that these figures do not align with other published figures for people tested and people testing positive for COVID-19 under pillars 1 and 2. This is due to:
- differences in the date used for someone testing positive (this release uses the date the specimen was taken)
- differences in geography (this figure is for England rather than the UK)
More details on how our figures compare to other published figures is given in the methodology document.
Pillar 1 testing turnaround times
Changes in the methodology used to capture data by PHE and NHS laboratories now means that we can provide an overall test turnaround time for pillar 1.
For pillar 1, the time taken to receive a COVID-19 test result is measured from the time that a test is received by a laboratory for processing to the time when the results are published to the laboratory information management system (LIMS).
Most pillar 1 tests are conducted in a hospital setting, and it is therefore not practical for those administering the tests to record the exact time that a test was taken.
Table 2: time taken from receipt of the test by a laboratory to the time the result is published, pillar 1, 9 July to 15 July
| 9 July to 15 July: number of tests (percentage) | |
|---|---|
| Total tests conducted in pillar 1 | 263,508 |
| Number of tests completed within 24 hours turnaround | 230,354 (87.4%) |
| Number of tests exceeding 24 hours turnaround | 33,154 (12.6%) |
There remain 4,421 tests on study samples excluded from PHE data and 2,599 tests excluded from NHS submissions for which there is no data on the number completed within 24 hours. However, these tests make up less than 5% of the tests conducted in week 7 and so their absence should not greatly affect the overall totals.
Pillar 2 testing turnaround times
For pillar 2, there are 2 measures of the time taken to receive a COVID-19 test result:
- the time taken to receive a COVID-19 test result from time of booking is measured from the time that a person books an appointment on the website to the time when the person receives a notification of their test result via an email or an SMS. This data is only available for regional test sites and mobile testing units, as test booking and registration processes for home testing and satellite test centres are currently undertaken on different systems
- the time taken to receive a COVID-19 test result from time of test is measured from the time a person completes a test registration (or the time a person indicates their test was taken for home testing kits) until the time that they receive a notification of the result of their test via an email or an SMS
For all measures of time taken to receive a COVID-19 test result, there are a number of tests that were not completed. This covers any test where the results were not communicated, which may be because communication details (for example phone number or email address) were not provided or were incorrect, or because the test was cancelled or abandoned, or no result was available.
Data on the time taken to receive a COVID-19 test result is split up to show the different routes for getting tested (as listed on page 4), as this will have an impact upon the time taken. More details can be found in the methodology document.
Since 28 May when Test and Trace started, the time taken to receive a test result after taking a test has improved (decreased) in pillar 2
Figure 4: percentage of results received within 24 hours (in-person tests) or within 48 hours (home or satellite tests), by route[footnote 5], 28 May to 15 July 2020
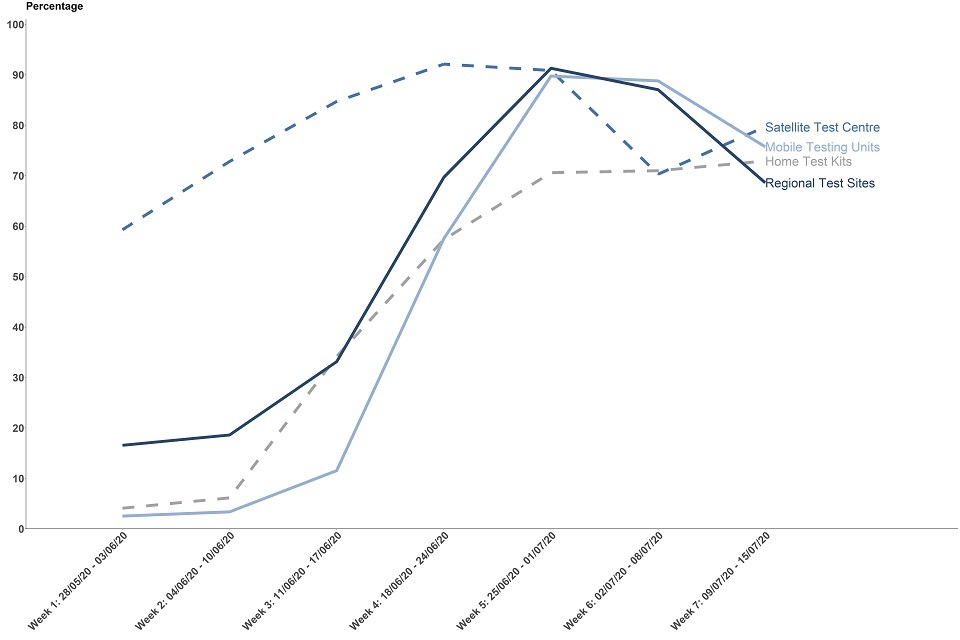
Chart is explained in the document text.
The largest improvements (decrease in time taken) since week 1 of Test and Trace were for regional testing sites, mobile testing units and home test kits. For in-person tests only (excluding both home tests and satellite tests), 71.4% of results from all test sites were received within 24 hours of a test being taken, in the same time period. If we consider the day the test was taken, this means 91.5% of in-person tests results were received the next day after the test was taken.
Compared to the previous week (2 July to 8 July), there has been a drop in the percentage of in-person tests returned within 24 hours but an increase in the percentage of tests from satellite test centres returned within 48 hours.
Table 3: time from taking a test to receiving test results[footnote 6], pillar 2 all routes, England
| 2 July to 8 July: number of people (percentage) | 9 July to 15 July: number of people (percentage) | Since Test and Trace launched, 28 May to 15 July: number of people (percentage) | |
|---|---|---|---|
| Within 24 hours | 145,240 (50.6%) | 130,725 (46.8%) | 577,491 (32.2%) |
| Between 24 and 48 hours | 98,243 (34.2%) | 114,643 (41.0%) | 836,944 (46.7%) |
| Between 48 and 72 hours | 33,578 (11.7%) | 23,114 (8.3%) | 286,986 (16.0%) |
| After 72 hours | 8,037 (2.8%) | 2,972 (1.1%) | 72,737 (4.1%) |
| Not completed | 1,922 (0.7%) | 7,867 (2.8%) | 19,272 (1.1%) |
| Total | 287,020 | 279,321 | 1,793,430 |
All routes includes regional test sites, local test sites, mobile testing units, satellite test centres and home test kits. Combined, 46.8% of tests from all test sites were received within 24 hours of a test being taken in the week 9 July to 15 July. Excluding home testing kits, this is 57.5% of all tests.
Regional test sites
In the week 9 July to 15 July, 68.6% of test results were received within 24 hours of the test being taken. If we consider the day the test was taken, this means that 90.9% of tests results were received the next day after the test was taken. 94.6% of test results were received within 48 hours of booking a test.
Table 4a: time from taking a test to receiving test results, pillar 2 regional test sites, England
| 2 July to 8 July: number of people (percentage) | 9 July to 15 July: number of people (percentage) | Since Test and Trace launched, 28 May to 15 July: number of people (percentage) | |
|---|---|---|---|
| Within 24 hours | 80,210 (87.1%) | 72,406 (68.6%) | 338,025 (55.9%) |
| Between 24 and 48 hours | 10,637 (11.5%) | 28,011 (26.5%) | 246,504 (40.7%) |
| Between 48 and 72 hours | 307 (0.3%) | 165 (0.2%) | 8,005 (1.3%) |
| After 72 hours | 189 (0.2%) | 56 (0.1%) | 2,781 (0.5%) |
| Not completed | 799 (0.9%) | 4,894 (4.6%) | 9,832 (1.6%) |
| Total | 92,142 | 105,532 | 605,147 |
Mobile testing units
In the week 9 July to 15 July, 75.7% of test results were received within 24 hours of the test being taken. If we consider the day the test was taken, this means that 92.6% of tests results were received the next day after the test was taken. 95.0% of test results were received within 48 hours of booking a test.
Table 4b: time from taking a test to receiving test results, pillar 2 mobile testing units, England
| 2 July to 8 July: number of people (percentage) | 9 July to 15 July: number of people (percentage) | Since Test and Trace launched, 28 May to 15 July: number of people (percentage) | |
|---|---|---|---|
| Within 24 hours | 48,769 (88.8%) | 49,796 (75.7%) | 170,249 (47.4%) |
| Between 24 and 48 hours | 4,965 (9.0%) | 12,996 (19.8%) | 168,875 (47.0%) |
| Between 48 and 72 hours | 234 (0.4%) | 201 (0.3%) | 10,176 (2.8%) |
| After 72 hours | 135 (0.2%) | 63 (0.1%) | 2,673 (0.7%) |
| Not completed | 819 (1.5%) | 2,683 (4.1%) | 7,358 (2.0%) |
| Total | 54,922 | 65,739 | 359,331 |
Satellite test centres
In the week 9 July to 15 July, 79.7% of test results were received within 48 hours of the test being taken. If we consider the day the test was taken, this means that 41.9% of tests results were received the next day after the test was taken.
Table 4c: time from taking a test to receiving test results, pillar 2 satellite test centres[footnote 7], England
| 2 July to 8 July: number of people (percentage) | 9 July to 15 July: number of people (percentage) | Since Test and Trace launched. 28 May to 15 July: number of people (percentage) | |
|---|---|---|---|
| Within 24 hours | 13,824 (20.8%) | 4,896 (9.8%) | 58,762 (15.1%) |
| Between 24 and 48 hours | 32,793 (49.5%) | 34,791 (69.9%) | 233,870 (60.0%) |
| Between 48 and 72 hours | 15,994 (24.1%) | 9,278 (18.6%) | 78,299 (20.1%) |
| After 72 hours | 3,463 (5.2%) | 604 (1.2%) | 17,422 (4.5%) |
| Not completed | 235 (0.4%) | 236 (0.5%) | 1,566 (0.4%) |
| Total | 66,309 | 49,805 | 389,919 |
Home testing kits
Home tests take time to be posted to a person and be couriered back to the lab. Because of this a low proportion of test results will be available within 24 hours of the test being taken. In the week 9 July to 15 July, 72.9% of test results were received within 48 hours of the test being taken.
Table 4d: time from taking a test to receiving test results, pillar 2 home testing kits, England
| 2 July to 8 July: number of people (percentage) | 9 July to 15 July: number of people (percentage) | Since Test and Trace launched, 28 May to 15 July: number of people (percentage) | |
|---|---|---|---|
| Within 24 hours | 2,437 (3.3%) | 3,627 (6.2%) | 10,455 (2.4%) |
| Between 24 and 48 hours | 49,848 (67.7%) | 38,845 (66.7%) | 187,695 (42.8%) |
| Between 48 and 72 hours | 17,043 (23.1%) | 13,470 (23.1%) | 190,506 (43.4%) |
| After 72 hours | 4,250 (5.8%) | 2,249 (3.9%) | 49,861 (11.4%) |
| Not completed | 69 (0.1%) | 54 (0.1%) | 516 (0.1%) |
| Total | 73,647 | 58,245 | 439,033 |
Contact tracing
The number of people transferred to the contact-tracing system has decreased since Test and Trace was launched
Between 9 July and 15 July, 3,887 people were transferred to the contact-tracing system. This is a reduction of 52.0% since the first week of contact tracing (28 May to 3 June), due to the reduction in people testing positive for coronavirus over this period.
Figure 5: number of people transferred to the contact-tracing system (includes complex and non-complex cases), England, 28 May to 15 July 2020
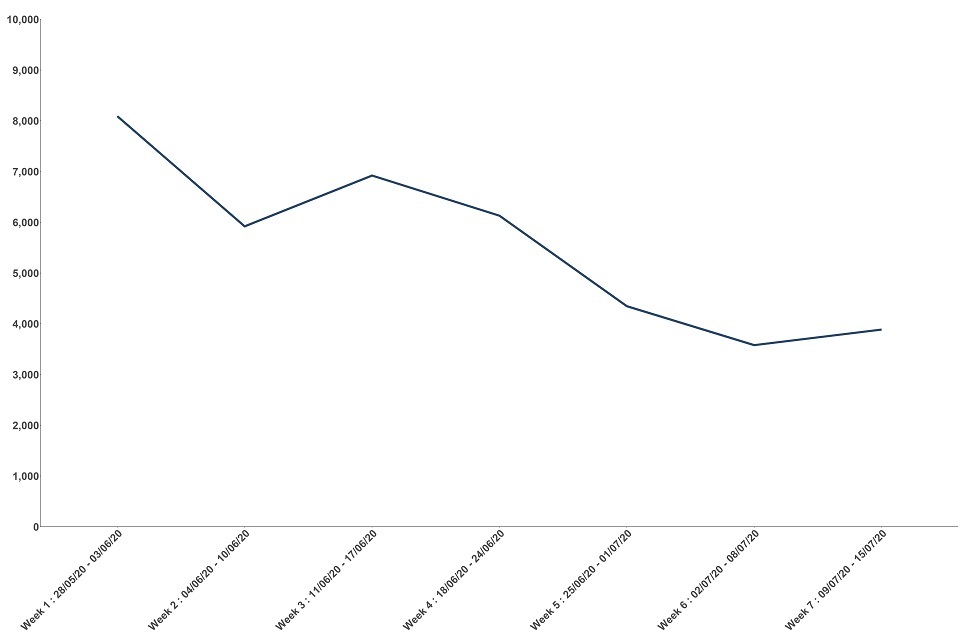
Chart is explained in the document text.
Between 9 July and 15 July around 4 in every 5 people transferred to the contact-tracing system were reached and asked to provide information about their contacts
Table 5: people transferred to the contact-tracing system (includes complex and non-complex cases) by whether they were reached and asked to provide contact details, England
| 2 July to 8 July: number of people (percentage) | 9 July to 15 July: number of people (percentage) | Since Test and Trace launched, 28 May to 15 July: number of people (percentage) | |
|---|---|---|---|
| People who were reached and asked to provide details of recent close contacts | 2,846 (79.5%) | 3,098 (79.7%) | 29,962 (77.1%) |
| People classified as non-complex | 2,559 | 2,873 | 24,615 |
| People classified as complex | 287 | 225 | 5,347 |
| People who were not reached | 588 (16.4%) | 610 (15.7%) | 7,614 (19.6%) |
| People whose communication details were not provided | 145 (4.1%) | 179 (4.6%) | 1,301 (3.3%) |
| Total | 3,579 | 3,887 | 38,877 |
Between 9 July and 15 July, 225 people, who were reached and asked to provide details of close contacts, were classified as complex cases. If NHS Test and Trace is not able to reach an individual testing positive or if no communication details are available, then it is not always possible to know if the case is complex or non-complex. Therefore, these breakdowns are not available.
Figure 6: outcome of people who were transferred to the contact-tracing system (includes complex and non-complex cases), England, 28 May to 15 July 2020[footnote 8]
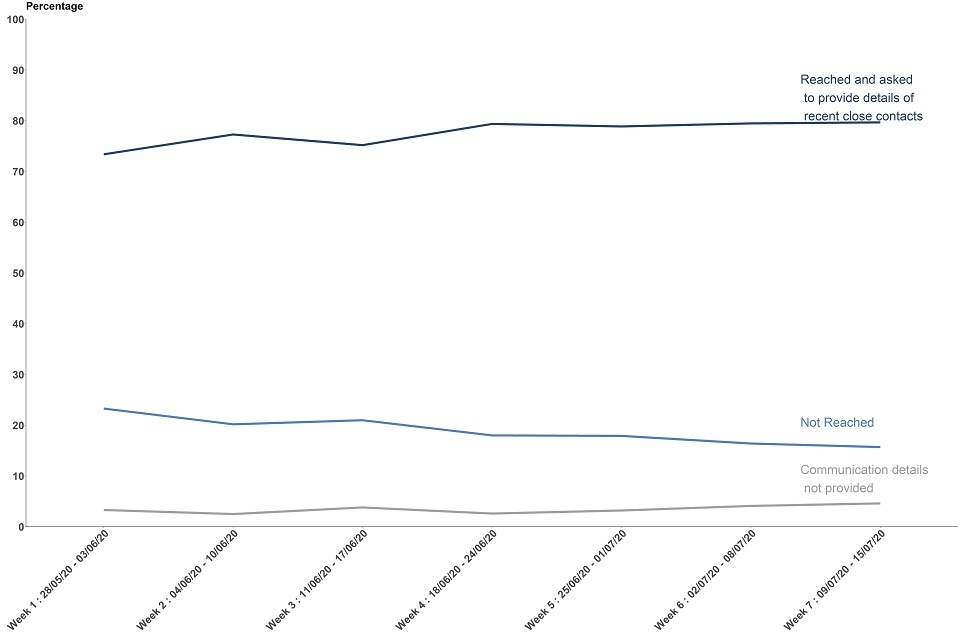
Chart is explained in the document text.
After a person’s coronavirus test is confirmed as positive, they will be transferred to the contact-tracing system to be contacted. The number of these people who were reached and provided details of recent close contacts includes complex cases investigated by local public health teams and people who said that they had no recent close contacts.
People who had no communication details provided are those people for whom there were no contact details (for example phone number or email address). This information is only available for people whose cases were non-complex and handled through the contact-tracing system, because those handled by local public health teams are managed at a situation rather than individual level.
The number of people who were not reached includes those people who the service has been unable to reach because there has been no response to text, email and call reminders. It also includes people who were reached but declined to give details of close contacts. There may also be a small number of people who have not been reached but where contact tracers are still in the process of trying to make contact.
Between 9 July and 15 July around 4 in every 5 people who were reached and asked to provide information about their contacts, provided one or more close contacts
Table 6: people transferred to the contact-tracing system (includes complex and non-complex cases) who were reached and asked to provide details of recent close contacts by how many contacts they provided details for, England
| 2 July to 8 July: number of people (percentage) | 9 July to 15 July: number of people (percentage) | Since Test and Trace launched, 28 May to 15 July: number of people (percentage) | |
|---|---|---|---|
| People who provided details of one or more close contacts | 2,206 (77.5%) | 2,474 (79.9%) | 20,821 (69.5%) |
| People who were not able to give any recent close contacts | 640 (22.5%) | 624 (20.1%) | 9,141 (30.5%) |
| Total | 2,846 | 3,098 | 29,962 |
Not everyone who was reached and asked to provide details of recent close contacts will have had any recent close contacts. The number who were not able to give any recent close contacts therefore refers to people who were successfully reached by NHS Test and Trace, but could not provide details of close recent contacts to pass on for further contact tracing (for example, recent close contact with strangers on the bus).
Figure 7: proportion of people transferred to the contact-tracing system (includes complex and non-complex cases) who were reached and asked to provide details of recent close contacts by how many contacts they provided details for, England, 28 May to 15 July 2020
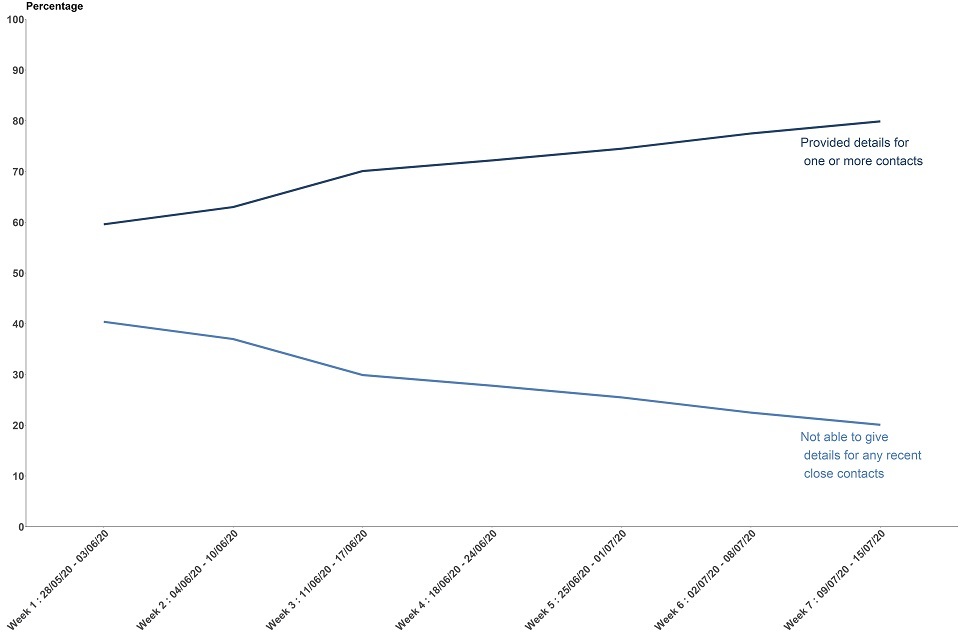
Chart is explained in the document text.
For non-complex cases, most people continued to be successfully reached and asked to provide details about recent close contacts within 24 hours of their case being transferred to contact tracing
Figure 8: proportion of people who were reached and asked to provide details about recent close contacts by time taken to reach them, England, 28 May to 15 July 2020 (excludes complex cases)
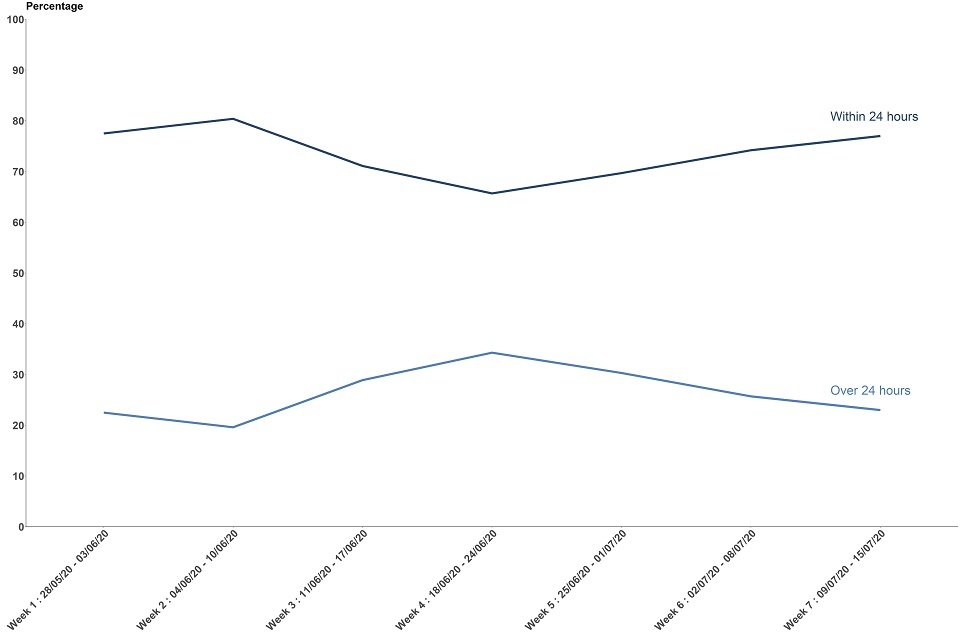
Chart is explained in the document text.
Table 7: people who were reached and asked to provide details about recent close contacts by time taken to do so, England, 28 May to 15 July 2020 (excludes complex cases)
| 2 July to 8 July: number of people (percentage) | 9 July to 15 July: number of people (percentage) | Since Test and Trace launched. 28 May to 15 July: number of people (percentage) | |
|---|---|---|---|
| Within 24 hours | 1,900 (74.2%) | 2,212 (77.0%) | 18,073 (73.4%) |
| Between 24 and 48 hours | 512 (20.0%) | 516 (18.0%) | 4,385 (17.8%) |
| Between 48 and 72 hours | 98 (3.8%) | 99 (3.4%) | 1,082 (4.4%) |
| After 72 hours | 49 (1.9%) | 46 (1.6%) | 1,075 (4.4%) |
| Total | 2,559 | 2,873 | 24,615 |
The number of recent close contacts identified between 9 July and 15 July has fallen by 68% since the start of contact tracing but has increased by 17% compared to the previous week
The number of complex close contacts has fallen more than the number of non-complex contacts since the start of contact tracing (82.5% and 8.0% respectively). However, both have seen an increase compared to the previous week (27.0% and 9.4% respectively).
As non-complex cases have a higher proportion of contacts who are unable to be reached, this has contributed to the reduction in the overall percentage of contacts who were reached and asked to self-isolate, from 90.7% in week 1 to 77.9% in week 7.
Figure 9: number of people identified as recent close contacts, England, 28 May to 15 July 2020
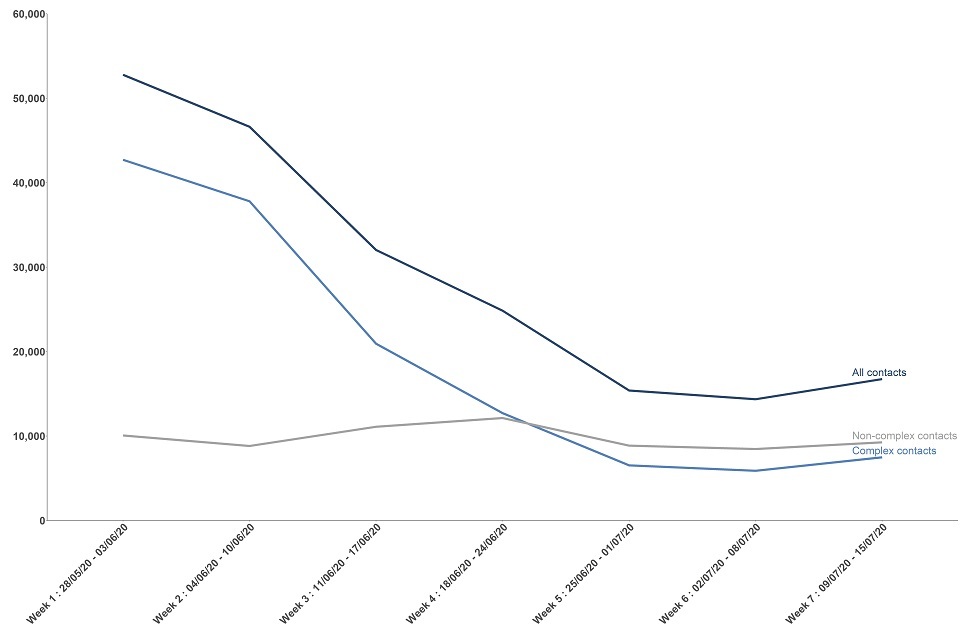
Chart is explained in the document text.
Table 8: number of people identified as recent close contacts by whether they were reached and asked to self-isolate, England, 28 May to 15 July 2020 (includes both complex and non-complex contacts)
| 2 July to 8 July: number of people (percentage) | 9 July to 15 July: number of people (percentage) | Since Test and Trace launched, 28 May to 15 July: number of people (percentage) | |
|---|---|---|---|
| Total number of close contacts identified | 14,356 | 16,742 | 202,781 |
| Close contacts reached and asked to self-isolate | 10,343 (72.0%) | 13,034 (77.9%) | 169,546 (83.6%) |
| Close contacts not reached | 4,013 (28.0%) | 3,708 (22.1%) | 33,235 (16.4%) |
Table 9: number of people identified as recent close contacts by complex and non-complex contacts, England, 28 May to 15 July 2020
| 2 July to 8 July: number of people (percentage) | 9 July to 15 July: number of people (percentage) | Since Test and Trace launched, 28 May to 15 July: number of people (percentage) | |
|---|---|---|---|
| Total number of non-complex close contacts | 8,464 | 9,258 | 68,714 |
| Close contacts reached and asked to self-isolate | 4,669 (55.2%) | 5,696 (61.5%) | 37,468 (54.5%) |
| Close contacts not reached | 1,982 (23.4%) | 1,860 (20.1%) | 15,545 (22.6%) |
| Communication details not provided | 1,813 (21.4%) | 1,702 (18.4%) | 15,701 (22.8%) |
| Total number of complex close contacts | 5,892 | 7,484 | 134,067 |
| Close contacts reached and asked to self-isolate | 5,674 (96.3%) | 7,338 (98.0%) | 132,078 (98.5%) |
| Close contacts not reached | 218 (3.7%) | 146 (2.0%) | 1,989 (1.5%) |
Of the people who were identified as recent close contacts but not reached, some of these could not be reached because no communication details were provided for them (for example a phone number or email address). This information is only available for recent close contacts classified as non-complex. This data is not available for recent close contacts classified as complex because these are usually managed at a situation (for example care home) rather than individual level.
The percentage of non-complex contacts who were reached and asked to self-isolate has increased to 61.5%, the highest percentage since the start of Test and Trace
Out of all the non-complex contacts that were identified between 9 July and 15 July 18.4% did not have communication details. Out of all the non-complex contacts that were identified between 28 May to 15 July 22.8% did not have communication details.
The number who were not reached includes those people who the service has been unable to reach because there has been no response to text, email and call reminders, or those for which no contact details were provided to NHS Test and Trace (for example phone number or email address). Further, there are some contacts who were reached but have not agreed to self-isolate.
Figure 10: outcome of contact tracing for recent close contacts classified as non-complex, England, 28 May to 15 July 2020
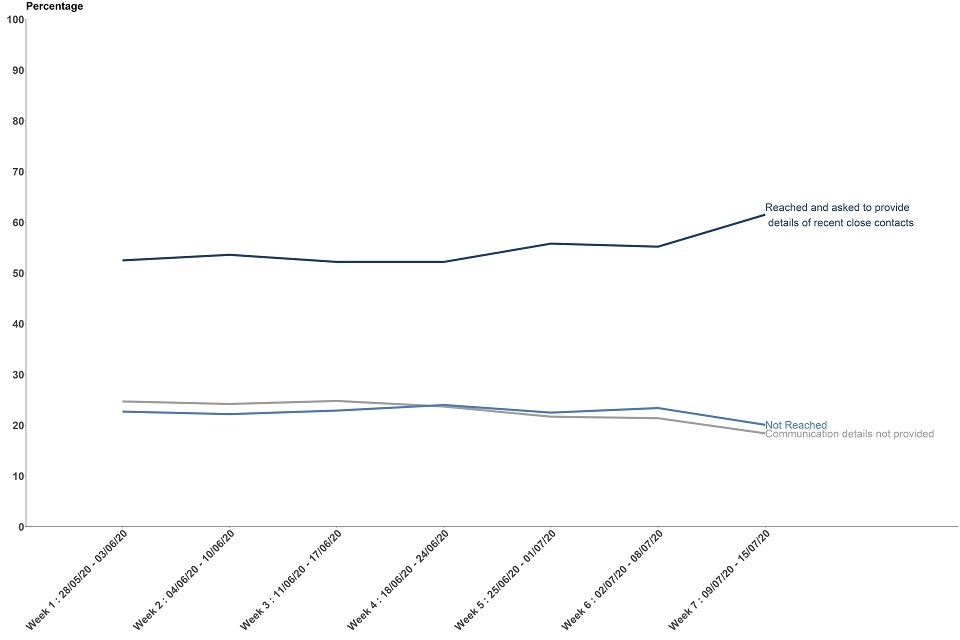
Chart is explained in the document text.
Almost all complex contacts continue to be reached and asked to self-isolate
Out of all the complex contacts that were identified between 9 July and 15 July 98.0% were reached and asked to self-isolate.
Figure 11: outcome of contact tracing for recent close contacts classified as complex, England, 28 May to 15 July 2020
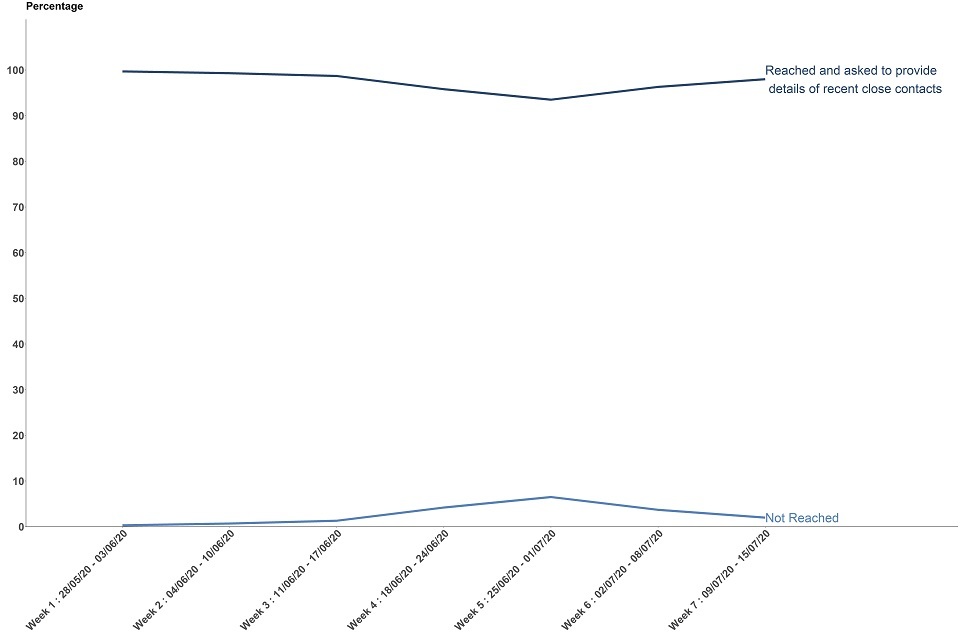
Chart is explained in the document text.
Between 9 July and 15 July, around 7 out of 10 non-complex contacts were from the same household as the case they were identified from
Figure 12: proportion of recent close non-complex contacts by whether they were from the same household as the case that they were identified from, England, 28 May to 15 July 2020
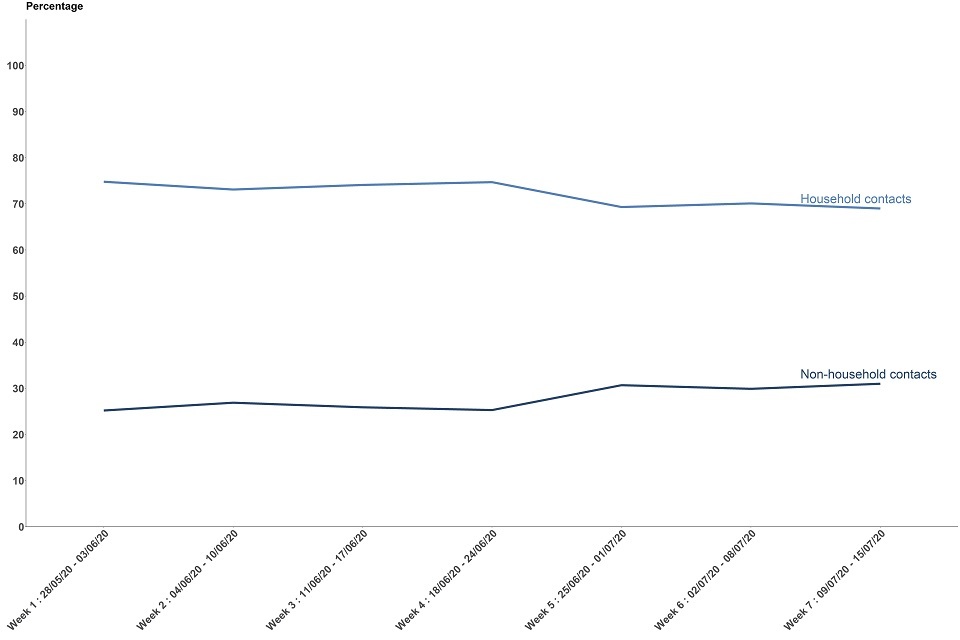
Chart is explained in the document text.
Almost 6 out of 10 of these household contacts were successfully reached and asked to self-isolate. This is in comparison to more than 7 out of 10 for non-complex contacts who were from a different household to the case from which they were identified. Contact tracers will often ask cases themselves to advise their household members to self-isolate without the need for contact tracers to contact them individually. This results in these contacts not being recorded as reached and asked to self-isolate, which is likely a contributing factor for a lower proportion of household contacts being reached in comparison to non-household contacts.
Table 10: Number of recent close non-complex contacts by whether they were from the same household as the case that they were identified from, England, 28 May to 15 July 2020
| 2 July to 8 July: number of people (percentage) | 9 July to 15 July: number of people (percentage) | Since Test and Trace launched, 28 May to 15 July: number of people (percentage) | |
|---|---|---|---|
| Total number non-complex household contacts | 5,936 | 6,392 | 49,738 |
| Close contacts reached and asked to self-isolate | 3,069 (51.7%) | 3,656 (57.2%) | 25,773 (51.8%) |
| Close contacts not reached | 2,867 (48.3%) | 2,736 (42.8%) | 23,965 (48.2%) |
| Total number non-complex not household contacts | 2,528 | 2,866 | 18,976 |
| Close contacts reached and asked to self-isolate | 1,600 (63.3%) | 2,040 (71.2%) | 11,695 (61.6%) |
| Close contacts not reached | 928 (36.7%) | 826 (28.8%) | 7,281 (38.4%) |
For non-complex contacts who were advised to self-isolate, more than 4 out of 5 of them were reached within 24 hours of being identified[footnote 9]
Figure 13: proportion of recent close contacts who were advised to self-isolate by time taken to reach them, England, 28 May to 15 July 2020 (excludes complex contacts)
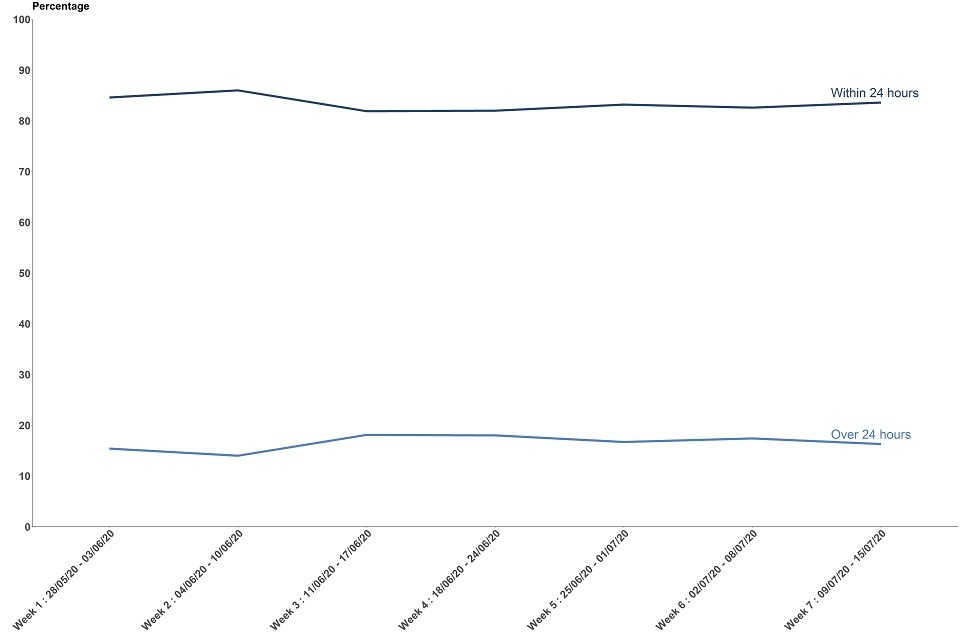
Chart is explained in the document text.
Table 11: people identified as recent close contacts who were advised to self-isolate by time taken to reach them, England, 28 May to 15 July 2020 (excludes complex contacts)
| 2 July to 8 July: number of people (percentage) | 9 July to 15 July: number of people (percentage) | Since Test and Trace launched. 28 May to 15 July: number of people (percentage) | |
|---|---|---|---|
| Within 24 hours | 3,853 (82.6%) | 4,761 (83.6%) | 31,174 (83.3%) |
| Between 24 and 48 hours | 653 (14.0%) | 787 (13.8%) | 4,730 (12.6%) |
| Between 48 and 72 hours | 107 (2.3%) | 98 (1.7%) | 924 (2.5%) |
| After 72 hours | 51 (1.1%) | 48 (0.8%) | 581 (1.6%) |
| Total | 4,664 | 5,694 | 37,409 |
For non-complex contacts who were advised to self-isolate, over half were reached within 24 hours of the case that reported them being transferred to the contact-tracing system
Figure 14: proportion of recent close contacts who were advised to self-isolate by time taken from the case that reports them being transferred to the contact-tracing system, England, 28 May to 15 July 2020 (excludes complex contacts)
Chart is explained in the document text.
Table 12: number of close contacts who were advised to self-isolate by time taken from the case that reports them being transferred to the contact-tracing system England, 28 May to 15 July 2020 (excludes complex contacts)
| 2 July to 8 July: number of people (percentage) | 9 July to 15 July: number of people (percentage) | Since Test and Trace launched, 28 May to 15 July: number of people (percentage) | |
|---|---|---|---|
| Within 24 hours | 2,321 (49.8%) | 3,179 (55.9%) | 20,567 (55.2%) |
| Between 24 and 48 hours | 1,434 (30.8%) | 1,726 (30.3%) | 10,322 (27.7%) |
| Between 48 and 72 hours | 541 (11.6%) | 537 (9.4%) | 3,665 (9.8%) |
| After 72 hours | 364 (7.8%) | 245 (4.3%) | 2,729 (7.3%) |
| Total | 4,660 | 5,687 | 37,283 |
This measure gives a sense of the end-to-end journey time through the Test and Trace system from when an individual testing positive was reported to Test and Trace, to when their close contacts were reached and advised to self-isolate. This information is only available for non-complex contacts, although there are a small number of non-complex contacts where the time taken from the time that a positive case is transferred is not available.
Measuring the data
How the data were collected
These data are collected from management information from the NHS Test and Trace service. More details about the methodology used can be found in the methodology document.
Future development
We have integrated these data with those from other parts of NHS Test and Trace, particularly testing, to provide an end-to-end view of the service that follows the user journey.
So far, testing data for pillars 1 and 2 and the testing turnaround times have been added. Further breakdowns for contact tracing continue to be incorporated, including complex and non-complex breakdowns and household information.
To support user needs and data transparency, additional releases have been published alongside the weekly Test and Trace publication including care home statistics up to 8 July and people tested for coronavirus between 30 January and 27 May. NHS Test and Trace continues to provide information for local authorities and their partners so that they have the information they need to help contain any outbreaks.
In time, NHS Test and Trace intends to publish detailed data from across the programme to support secondary analysis, for example in academic institutions. Over the coming months, we intend to make the following available:
Expected July to August 2020:
- regional breakdowns for tracing data
- characteristics for those tested under pillar 2
- high-level UK test and trace figures
Expected from September 2020:
- details of close contacts who go on to test positive
The UK Statistical Authority has published a rapid review of the Test and Trace statistics. This includes recommendations on how the publication should develop in order to adhere fully to the Code of Practice. These recommendations continue to influence the development of the publication in the coming weeks and months.
Quality
These statistics have been put together by NHS Test and Trace with advice from the Office for National Statistics. More information on quality and how this publication adheres to the Code of Practice for statistics is available in the statement of compliance.
Strengths and limitations
Given the importance of this service and the commitment of NHS Test and Trace to be open and transparent with the public it serves, these data are being released at the earliest possible opportunity.
However, new IT systems and statistical outputs often take a period of time to bed in. These data should therefore be treated with caution as the system and understanding of the data develops.
The figures presented are based on a data-cut 6 days after the end of the reporting period, to give time for test results and cases reported at the end of the 7-day period to have an outcome. Some cases and test results may continue to be in progress after this period, and therefore data may need to be revised over time.
Feedback
For feedback and questions about the release, please contact statistics@dhsc.gov.uk.
-
This may include a small number of people who had a test under pillar 4 (serology and swab testing for national surveillance). People tested under pillar 3 (serology testing to show if people have antibodies from having had COVID-19) do not have their cases transferred to NHS Test and Trace. ↩
-
For example, if someone works in or has recently visited: a health or care setting such as a hospital or care home, a prison or other secure setting, a school for people with special needs, critical national infrastructure or areas vital for national security. ↩
-
Figures for people testing positive have been de-duplicated so people who have multiple tests in both pillars 1 and 2 would only appear once. The number of people testing positive in pillar 1 may also include people tested anonymously as part of surveillance studies, and therefore will not have their case transferred to contact tracing. ↩
-
In-person tests are those from regional test sites and mobile testing units. Home or satellite tests are those from satellite test centres and home testing kits. ↩
-
Please note the number of people receiving results within a given time is not the same as the number of people tested, because people may be tested more than once. ↩
-
This data does not include Randox tests, as these are handled through a different system. Randox tests make up a significant proportion of the tests conducted in care homes, which form part of the satellite test centres. ↩
-
Data has been split to show those cases whose communication details were not provided. Previous publication included cases where communication details not provided under ‘Not reached and asked to provide contact details’. Numbers have been revised for previous weeks to account for new methodology. ↩
-
Timing data does not include non-complex contacts that were subsequently escalated to complex. ↩