Migration Advisory Committee (MAC) annual report, 2022 (accessible)
Updated 31 January 2023

© Crown copyright 2023
This publication is licensed under the terms of the Open Government Licence v3.0 except where otherwise stated. To view this licence, visit nationalarchives.gov.uk/doc/open-government-licence/version/3 or write to the Information Policy Team, The National Archives, Kew, London TW9 4DU, or email: psi@nationalarchives.gov.uk.
Where we have identified any third party copyright information you will need to obtain permission from the copyright holders concerned.
This publication is available at https://www.gov.uk/government/publications/migration-advisory-committee-annual-report-2022/migration-advisory-committee-mac-annual-report-2022-accessible
Foreword
The framework document that covers our governance requires us to produce an annual report to inform Parliament and the public of the work we have done and our use of resources. It also suggests that the report contain comment on, and recommendations relating to, all aspects of the immigration system.
We completed our enquiry into the impact of the ending of Freedom of Movement on the Adult Social Care Sector in April and submitted the report to Government and Parliament. We recommended that care workers continue to be eligible to apply for a Health and Care Worker visa and made some additional recommendations for changes to the immigration system to ease the burden on social care employers and migrants. However, our main recommendation was that a minimum rate of pay should be established for care workers at a premium to the statutory minimum wage where care is being provided with public funds. We suggested that this should initially be set at £1 per hour above the National Living Wage but expected a more substantial premium to be needed to properly address the crisis in social care recruitment and retention. It is deeply disappointing that the Government have still not responded to our report. We note that the Governments of Scotland and Wales are taking clear action to address low pay in the sector and are bewildered by the lack of urgency exhibited by the Department of Health and Social Care.
Net migration in the 12 months to June 2022 reached 504,000, an increase of 331,000 compared to the previous year. A significant part of the rise was due to recently introduced visa routes such as those for Ukraine and Hong Kong citizens. In the short term, new visa routes lead to a sharp rise in net migration (since new people enter under these routes and few leave) but this will likely taper quickly as new visa issuance falls and some on the routes return to their country of origin. There has also been a significant rise in the number of international students coming to the UK. Since the vast majority will leave the UK after their studies are ended, most of the rise in net migration is likely to be temporary. The MAC has also previously highlighted the very substantial benefits that international students bring to the UK. In addition, the work routes have been deliberately designed to be flexible in terms of numbers depending on the state of the economy. When the labour market is tight, as it has been in recent months, we would expect employers to be recruiting more from overseas to address shortages. If, as predicted, the labour market weakens in coming months, we would expect a reduction in worker visa applications. We would caution the Government in becoming too focused on particular net migration numbers, and any change in objective would need to be consistent with the fiscal rules that the Government have in place.
There have been extensive reports in the media and from a variety of pressure groups and research organisations concerning exploitation through the immigration system. We document some of this work in this report and highlight a number of areas where we have concerns over how effectively the system is working to prevent abuse. We also comment on developments in the labour market and how businesses seem to be responding to the new immigration system. In addition, we provide an analysis of the geographic differences in migration across the UK and consider arguments for a more localised immigration policy.
We are again indebted to stakeholders who have taken the time during the year to assist us with our work, both in response to formal commissions and in on-going engagement and have also continued our active engagement with the Devolved Administrations. Finally, the Committee are grateful to the excellent work that the secretariat has done during the year.
We look forward in the coming year to continue in advising the Government on the development of an immigration policy that enhances the welfare of the people of the UK.
Prof. Brian Bell (Chair)
Prof. Dina Kiwan
Prof. Sergi Pardos-Prado
Madeleine Sumption MBE
Prof. Jo Swaffield
1: Migrant exploitation in the labour market
What is exploitation?
Why the MAC is interested in exploitation
Exploitation falls within the MAC’s remit for several reasons. As well as the need to protect migrants, the remit of maximising the welfare of the resident population is also relevant: if employers are able to exploit migrant (or other) workers through low pay and poor conditions then this has the potential to enable circumvention of the standards in the labour market more generally. The Director of Labour Market Enforcement (DLME) states that “Exploitation of workers is not just an offence against the individual – which is serious enough. It also undermines the competitiveness of compliant businesses who treat their workers fairly and with consideration. Worker exploitation can also have a destabilising impact on whole communities.”
A number of recent MAC commissions and papers have included findings relating to exploitation. These have been acquired through Calls for Evidence, qualitative research, discussion with stakeholders and Home Office Intelligence, and examination of the quantitative data. The recommendations we make as part of these commissions often influence the immigration rules. It is therefore imperative that our recommendations work to reduce the potential for exploitation, or at least do not increase the potential for exploitation as an unintended consequence.
Recent MAC commissions have resulted in several recommendations made with exploitation in mind. These include recommendations aimed at ensuring migrants can switch employers and that live-in workers in the social care system should be sponsored by an umbrella body rather than by individuals. Other recommendations and suggestions we have made may link to the reduction of exploitation as a secondary effect, for example the recommendations on English for Speakers of Other Languages (ESOL) access and employment for asylum seekers in our 2021 Annual Report, which would (by increasing access to legal work) reduce reliance on the informal labour market.
What is exploitation?
Exploitation is known to exist in the labour market. However, it is undefined in law (Weatherburn, 2021) and there is also no uniform supranational legal framework regulating labour exploitation (European Union Agency for Fundamental Rights (FRA), 2019). Perhaps for this reason, organisations working in the field of labour market exploitation also do not provide a single definition of exploitation. Spectrum models (such as the one used by DLME shown in Figure 1.1, below) that encompass many forms and degrees of exploitation and levels of severity are often used. We find the DLME conceptualisation to be a particularly useful practical tool that also includes collusion and coercion. An exploitative situation is not necessarily static but may move along this spectrum. The most severe forms of exploitation and abuse, such as modern slavery, are also those where the worker tends to collude least. The forms of exploitation referenced in this diagram are discussed further in the next section.
Figure 1.1: Compliance spectrum across which DLME works
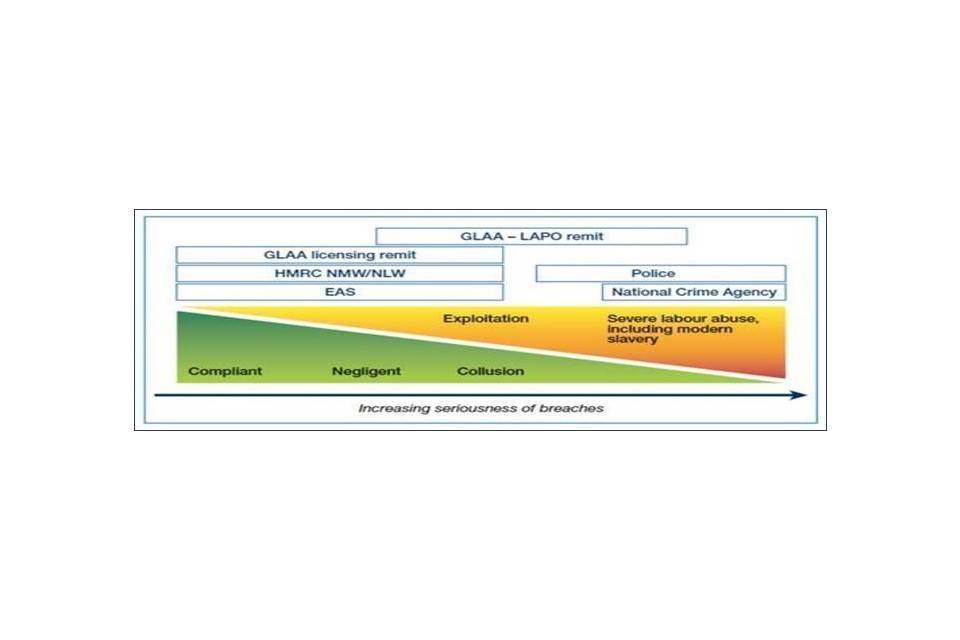
Source: Director of Labour Market Enforcement, 2021.
There is a range of views of what constitutes exploitation as it relates to the labour market. For example, at one extreme, Marx proposed that all capitalist employer/employee relations are inherently exploitative (because the worker does not receive the full value of their labour). Other definitions of exploitation concentrate on coercion or the most flagrant breaches of the law (such as that taken by FRA, 2019, which concentrates on severe labour exploitation: “work situations that deviate significantly from standard working conditions as defined by legislation or other binding legal instruments, concerning in particular remuneration, working hours, leave entitlements, health and safety standards and decent treatment, and which are criminal violations under the legislation of the EU Member State where the exploitation occurs. Hence, severe labour exploitation includes as a minimum coercive form of exploitation…”).
We take exploitation essentially to mean where someone benefits unfairly from another person or group, often their work, or from a situation, especially where the power dynamics are unequal. Even when defining exploitation in this way, the concept is not straightforward. Exploitative situations may arise in many different types of interaction, from personal relationships to criminal activity. For the purposes of this chapter, we have taken the definition of exploitation of migrants in the labour market to cover situations where individual employers are benefiting from workers in a way that is not compliant with their labour rights or general labour market standards. This may include both criminal and non-criminal situations, situations where a migrant colludes with an exploitative situation, and situations where features of the immigration system either facilitate or do not succeed in stopping exploitation. This is a wide definition but fits with the conceptualisation of exploitation as a scale (see above) and also enables the fullest possible examination of how exploitation relates to the conditions attached to migrants’ stay in the UK. We look at exploitation both in terms of the means by which employees may be exploited by employers, and the structural conditions (including features of the immigration system) that allow this to happen.
Many forms of exploitation, such as modern slavery, are illegal. However, migrants may also be exploited within the existing framework of the immigration system, without breaking UK law. Examples may include employees being charged recruitment fees outside the UK or being charged more than market rates for accommodation provided by employers. There are other ways in which migrants are not prevented from being exploited because there is an overall lack of enforcement.
In this chapter we define ‘migrants’ and ‘migrant workers’ as those who are subject to the immigration system, i.e., their continuing stay in the UK depends on meeting the conditions required of them by the immigration system. We exclude those who arrived in the UK as migrants but have subsequently acquired citizenship or Indefinite Leave to Remain (ILR). This differs from the way we generally define migrants, in order to enable us to look specifically at how the immigration system affects exploitation, and how employers are able to use the conditionality of migrants’ stay in the UK to enable exploitation compared to their counterparts whose right to live/work in the UK is not conditional.
We have largely excluded exploitative situations outside the labour market, for example abusive relationships, from the scope of this chapter, other than where these situations constitute a vulnerability that can be exploited by employers wishing to exploit individuals in the labour market. We may explore some of these situations (for example those relating to gendered dimensions or protected characteristics) in future work.
Types of exploitation in the labour market
As the above spectrum suggests, there are a number of ways in which exploitation in the labour market as a whole can be observed, which may apply to all workers and not specifically to migrants: the next section discusses exploitation in relation to migrants specifically. Some examples of exploitation provided in the literature are outlined below, but it is possible for several forms of exploitation to be happening simultaneously. Indeed, low-level violations are often a flag to enforcement bodies that more serious forms of exploitation may be happening – for example, the Gangmaster & Labour Abuse Authority (GLAA) compliance inspection triggers include non-compliance against non-critical licensing standards as a potential indicator of further abuse.
Some factors may increase individuals’ vulnerability to exploitation: these are outlined in a number of research studies and summaries/models (for example IOMs model of migrant vulnerability, 2019) and classified in various ways: for example Focus on Labour Exploitation (FLEX) provides a useful grouping of vulnerabilities as personal (relating to an individual’s characteristics), situational (relating to how an individual is positioned within their environment, including the conditions of being a migrant, with developing English skills or undocumented) or circumstantial (relating to events, for example unemployment). Vulnerabilities may also be pre-existing or ‘created’ (United Nations Office on Drugs and Crime (UNODC), 2012).
-
Pre-existing vulnerabilities include poverty, debt, the presence of caring responsibilities that employers know will make it more difficult to move jobs, or discrimination on the basis of race, sex, disability, pregnancy or other personal characteristics (which may include migrant status) (FRA, 2019);
-
‘Created’ vulnerabilities are situations caused by external parties such as employers or systems (including the immigration system and related migrant-specific issues such as trafficking, explored more below) in place. They may also include vulnerabilities created through factors such as romantic attachment, domestic violence, isolation, or addictions.
Although these vulnerability factors do not cause the individual to be exploited, they increase the ease of inducing a migrant to enter an exploitative situation, the difficulty of leaving an exploitative employment situation or of finding an alternative job. Hence, vulnerabilities can compound each other, with a vulnerability in one area setting off a chain of vulnerability in other areas. For example, perpetrators of domestic violence/coercive controlling behaviour may not allow their partner the freedom to choose their own employer or the type of work that they do. This makes it easier for an exploitative employer to take advantage of the worker’s lack of alternatives by maintaining poor employment terms and conditions. As this example implies, some of these vulnerabilities may be experienced more strongly or commonly according to gender or protected characteristics.
Modern slavery, human trafficking, forced/compulsory labour and servitude
There are several different terms that have specific meanings which are or can be forms of exploitation, although it is not necessary for any of these terms to apply for exploitation to be taking place. These forms of exploitation may apply to migrants or to the resident population. Each of these terms has a distinct meaning, although there are also some overlaps between them.
-
Modern slavery and human trafficking are generally understood as being among the most extreme forms of exploitation. Modern slavery is the condition of being ‘owned’ as property. Unsurprisingly, this may involve a high degree of control by the employer, for example being paid into a bank account that is not owned by the individual. Human trafficking is the movement of individuals by others for the purposes of exploiting them and hence links closely to other forms of exploitation. Human trafficking and exploitation are linked, for example in the Human Trafficking and Exploitation (Scotland) Act 2015, which defines human trafficking as being carried out “with a view to another person being exploited” and in the Modern Slavery Act 2015;
-
Forced/compulsory labour and servitude are also similar and encompassed within the Modern Slavery Act 2015. Servitude is similar to slavery, but the victim is not ‘owned’; instead they may live and/or work with someone and be unable to leave. Forced labour is being forced to work, but not agreeing to this freely, for example, working due to being threatened. Although both UK and migrant workers may be at risk of these forms of exploitation, because of their other vulnerabilities, migrants are particularly affected by forced labour in the UK, as demonstrated in a number of studies including qualitative research carried out by Anderson and Rogaly (2005);
-
Forced/compulsory labour, servitude and modern slavery all involve work that the individual does not undertake voluntarily. They may involve unfree recruitment (for example deception regarding the nature of work), the impossibility of leaving the employer (whether because the employer refuses employment transfers, threatens the worker or their family, or because the worker is financially vulnerable because of debts to repay), risk of homelessness or the risk of losing the right to remain in the UK. As with exploitation of other kinds, they may also all involve abuse of vulnerability; deception; restriction of movement; isolation; physical and sexual violence; intimidation and threats; retention of identity documents; withholding of wages; debt bondage; and abusive working and living conditions (International Labour Organisation (ILO), 2012);
-
Labour exploitation in the workplace can include forced/compulsory labour, servitude, and modern slavery, but is explicitly exploitation in the labour market.
Salary non-payment and deductions
Poor employment practices involving salary such as non-receipt of holiday pay, sudden reductions in hours, non-payment of salary, lack of sick pay and non-receipt of payslips/P45 (Barnard et al., 2022) all come under the general umbrella of exploitation, as workers are not receiving what they should be entitled to as employees. Some employers may pay either at unfair levels (e.g., below National Minimum Wage (NMW)) or pay structures (e.g., those depending on unfeasibly high levels of productivity) (FRA, 2019). Weil (2010), in research with US workers, stresses that low wages in themselves constitute a vulnerability which may leave workers open to further exploitation.
Health and safety violations
Exploitative employers may also violate health and safety regulations or good practice, such as by preventing the worker from accessing medical care, taking sick leave, or being without the legal minimum requirement of safety equipment (FRA, 2019; Parliament of Australia, 2016, cited in Sumption and Fernández-Reino, 2018). Migrants in the greatest need of money (such as those on short-term visas, in debt, or who are given few hours or are underpaid), are unsurprisingly particularly vulnerable to this treatment: for example a small-scale survey and qualitative work carried out by Migrant Voice (2022) showed that those in financial difficulty were reluctant to take sick leave or proper rest hours when they needed to.
Precarity
Precarity in the labour market is characterised by intermittent or temporary work that does not enable financial stability, and may not give the worker enough money to live on (Anderson, 2010; Dwyer et al., 2015). Examples of this type of work can include ‘gig economy’ jobs such as delivery and taxi driving but may also include work on zero-hours contracts (such as care work) and jobs in agriculture. Precarity may also involve a lack of work-life balance, as the migrant overworks or works irregular shifts, often linked to the temporary nature of work and life in UK and the need to earn money in a short space of time: “the effect of precarious work is, as it were, the flipside of the celebration of the ‘work-life balance’, when a person’s economic productivity becomes the overwhelming priority” (Anderson, 2010).
Migrants may or may not choose this trade-off (Anderson and Ruhs, 2010): precarity, in itself, is not necessarily a form of exploitation. As noted in the MAC’s 2022 report on Adult Social Care, given some safeguards, zero-hours or variable contracts may suit workers who are balancing work with other commitments. However, precarity can leave workers vulnerable to exploitation because of the power imbalance insecure work creates in employment relationships (Weil, 2010): a survey of union members seeking advice, analysis of case notes, and qualitative work with migrants in low-paid work (FLEX, 2021), for example, provided several examples of power imbalances based on employees’ fear of losing work being worsened during the COVID-19 pandemic. Precarity represents a greater problem for people with fewer choices in the labour market as they are less able to move on if the situation does not suit them.
Precarity can be compounded to cause hyper-precarity (Dwyer et al., 2015; FLEX, 2021), for example by other vulnerabilities (including, for migrants, factors related to the immigration system). This can leave workers with no other choice than to perform exploitative labour (Dwyer et al., 2015), acting as ‘surplus labour-power’ that can be fired and hired to meet demand with little consequence (ibid.).
It is also possible for unscrupulous employers or managers to use precarity as leverage to exploit employees: for example Barnard et al. (2021) describes a situation where “some individuals pay line managers up to £20 cash per week in order to guarantee their shifts, with line managers exploiting and capitalising on the precarity of zero hour contracts”.
The MAC has previously commented (2018) that zero-hours contracts should benefit both the employer and employee, and we restate the importance of this here. While both employers and employees can benefit from the flexibility zero-hours contracts offer, if employers abuse such contracts to enable them to retain large numbers of people who cannot be guaranteed the means to make a living, this is not only unfair to the specific workers involved but degrades standards in the labour market more widely. It can also be harmful to the allocational efficiency of the labour market as a whole if employers are able effectively to reserve a pool of workers who they do not always need, while other sectors of the labour market suffer from unfilled vacancies. We will continue to revisit this issue in future commissions where it is relevant.
Sectors at most risk of non-compliance and exploitation
DLME (2021) describes the sectors it has assessed to be at risk of non-compliance in the labour market for 2021/22 (set out in the table below). Severe, high, and some medium risk sector threats are described as “Vulnerable workers are being exploited, some cases indicative of modern slavery. Many more in the sector are not receiving NMW/NLW”. All at-risk sectors have issues with non-compliance around NMW/National Living Wage (NLW).
Table 1.2: DLME’s assessment of labour market enforcement threats
|
Sector |
2020/21 assessment |
|---|---|
|
Hand car washes |
Severe |
|
Agriculture (horticultural seasonal workers) |
Severe |
|
Care sector |
High |
|
Construction |
High |
|
Hospitality |
Medium |
|
Shellfish gathering |
Medium |
|
Nail bars |
Medium |
|
Poultry and Eggs |
Medium |
|
Warehouses and distribution centres |
Medium |
|
Food industry (processing and packing) |
Medium |
|
Garments and textiles |
Medium |
Source: Director of Labour Market Enforcement, 2021.
Although exploitation may be found throughout the labour market, there is widespread agreement between various parties with an interest in labour market exploitation about the types of work and sectors most at risk for non-compliance. As DLME’s table above suggests, jobs involving shorter training requirements (particularly at Regulated Qualifications Framework (RQF) 1 - 2 level) appear to be particularly common areas where workers are exploited. The Independent Anti-Slavery Commissioner (IASC) (2022) indicates that “Hand car washes, fast fashion, care homes and agriculture are just some of the UK sectors that face distinctive challenges in the UK labour market, from minor non compliances to severe labour exploitation”. Similar industries are identified by the GLAA’s industry profiles where it deems exploitation to be particularly likely. The MAC has also previously raised the risk of non-compliance and exploitation in the construction, hospitality, logistics, manufacturing and food production, car wash, and cleaning industries.
How exploitation affects migrants in the labour market
As set out above, exploitation may be experienced by migrants and non-migrants and at all skill and salary levels. However, being a migrant may either increase the likelihood of some types of exploitation relative to UK workers or make the individual vulnerable to types of exploitation that do not apply to those who are UK citizens or have permanent leave to remain in the UK. There are also several ways in which factors relating to the immigration system in itself may act or combine to increase the risk of exploitation. These are explored further in the next section.
Areas where migrants are comparatively more vulnerable to exploitation than UK workers
Lower levels of English language may reduce migrants’ awareness of/ability to access information on their rights and their ability to report exploitation (DLME, 2021; Sumption and Fernández-Reino, 2018). Lower levels of English language skills may also be associated with increased precarity (Anderson, 2010).
The MAC has historically opposed reducing English language requirements where they exist, partly because this makes migrants more vulnerable to exploitation. This was one of the reasons we expressed concerns about butchers using the Seasonal Worker visa as an alternative to the Skilled Worker route in our 2021 Annual Report. We acknowledge that in some circumstances – such as Intra-Company Transfers – it may be important for reasons of flexibility and business continuity to have no English language requirement. However, on the whole we feel these exemptions should only be where strictly necessary, and that as far as possible government should resist the temptation to add additional occupations to existing routes with no English language requirement as a means of circumventing the rule. For routes where there is no English language requirement, we believe that – as the Government has stipulated for the Seasonal Workers pilot – it is important for the worker to receive a contract in their own language and for this requirement to be enforced.
Levels of unionisation are lower among migrants, something that has been observed both in the UK and the United States (US) (Sumption and Fernández-Reino, 2018; Weil, 2010). This may be related to the temporary nature of work programmes, and migrants’ expectations of their labour market rights may be lower because they have previously worked in countries with lower labour market standards than the UK (Sumption and Fernández-Reino, 2018; DLME, 2017).
Some factors make exploitation more likely by increasing dependence on the employer (FRA, 2019), for example, having accommodation provided by the employer and/or living in geographically isolated areas. Both these conditions are particularly common among migrants, for example among those living on farms. In some cases, this accommodation is not fit for purpose despite the employee being charged for it and having little realistic alternative but to take it: FRA (ibid.) cites examples of migrants sleeping in fields and construction sites, with very limited sanitary facilities. A small-scale survey of seasonal workers in Scotland by FLEX and Fife Migrant Rights Forum indicated that 57 of the 58 respondents were dependent on their employer for housing, with respondents also highlighting the poor quality of accommodation for the price paid, and unsafe accommodation. The 2021 review of the seasonal workers pilot indicated similar problems: 15% of respondents to an annual survey of pilot workers said their accommodation was neither safe, comfortable, hygienic nor warm and 10% said their accommodation had no bathroom, no running water, and no kitchen. In some cases migrants may voluntarily enter into such accommodation on the private market, for example sharing with several other people in order to save money. However, where accommodation is provided by employers (and the employee therefore has less choice in the matter) it is important (as we underlined in relation to other workers in our 2021 Review of the Intra-Company Transfers route) that it is fit for purpose, fairly priced, that the migrant has a free choice about whether they live there, and that these conditions are properly enforced.
Areas where migrant workers are uniquely vulnerable to exploitation
There are also forms of exploitation that are unique to migrant workers. Migrant workers may be unaware of the fact that they are being exploited, being forced to work, or trapped in an exploitative situation. Alternatively, for some migrants, collusion with exploitative working practices may be the most rational choice if the exploitative situation still leaves them better off than working in their home country (where it may be hard to find a job or where pay differentials mean that they can earn much more in the UK even if exploited). Joseph Rowntree Foundation (JRF, 2011) comment that “A wealth of research shows that people all over the world routinely make choices such as this, submitting themselves to precisely these kinds of exploitative labour relationships because doing so represents their best or only available option” and the collected literature provides numerous examples where migrants have made such decisions: in qualitative and quantitative research with migrant workers across the EU FRA (2019) found that more than two thirds of participants mentioned economic need as a driver of exploitation.
Research by University of Nottingham Rights Lab has demonstrated the existence of ‘pre-agreed’ exploitation. This is where the terms and conditions of the job are made clear to the migrant before they leave their home country, but the migrant is not made aware that these terms and conditions are comparatively poor in the UK. In these cases, migrants may not view themselves as exploited given that they had freely entered into the agreement with the agency.
Many migrants borrow money to pay the costs associated with coming to the UK. A small-scale study by Migrant Voice (2022) indicated that two thirds of migrants responding to the survey had gone into debt – to friends, families, banks or commercial lenders – to pay for their visas. A similar-sized study carried out by FLEX and the Fife Migrants’ Forum (2021) indicated that 62% of respondents had gone into debt to come to the UK on a Seasonal Worker visa. If migrants are indebted, this may prevent them leaving exploitative employment, and indeed force them to accept further exploitative conditions such as being obliged to pay inflated accommodation charges.
While it is illegal to charge recruitment fees in the UK (as set out in the GLAA licensing standards), it is legal to do so elsewhere (although doing so is contrary to ILO guidance on fair recruitment). Migrants may therefore end up paying recruitment fees in their home country in order to secure work in the UK. Several recent Parliamentary Questions have raised this issue, which has also been reported on extensively in the press during 2022, most specifically in relation to specific sectoral routes in both the care sector and agriculture. The number of countries – including India, the Philippines, Ghana, Zimbabwe, and Indonesia – cited in such reports indicates that the problem is (at the very least) geographically widespread even if statistical evidence of the extent of the problem is lacking. Migrants may be aware or unaware that these fees are illegal/unfair. There is evidence that these fees are often borrowed at high rates of interest using the family home as collateral, and that workers may not only be heavily indebted but go on to become trapped in debt bondage as a result. This, as well as the time-limited nature of these work schemes and the lack of options for redress where many organisations are involved, means that the situation often goes unaddressed.
The UK Government cannot control the fees charged in other countries. However, we believe it should look more broadly at whether it is possible to prevent those who charge such fees entering into the chain of recruitment organisations through which migrants enter the UK and build on existing work being carried out. For example, the GLAA has previously conducted effective upstream work on social media to inform Romanians who may be looking to move to the UK to work in construction of their rights, and this model may be able to be used with other nationalities in the sectors where recruitment fees are most likely to be charged. Promotional work on the importance of not paying fees that is currently being carried out by scheme providers and other stakeholders with an interest in seasonal workers also shows the importance of sector-based campaigning.
The Department of Health and Social Care (DHSC) is also conducting similar work in the health and social care sector. The DHSC code of practice for international recruitment sets out standards such as charging by UK agencies being illegal. Further guidance is currently being prepared around this, which, like the GLAA guidance, will be aimed at those who have come, or are interested in coming, to the UK to work. The guidance will be made available online, including on the visa application webpage for the Health and Care Worker (H&CW) visa, and disseminated via the Foreign, Commonwealth & Development Office in other countries in locations where people who may wish to work in the UK are most likely to see it (such as medical schools). It will include guidance on work standards and the costs of living in the UK and a list of ethical recruiters, as well as information on how to report violations. Stakeholders (government departments, UK-based recruiters and end employers) in other sectors may wish to collaborate on similar strategies to target specific audiences most at risk of exploitation.
How factors relating to the immigration system affect migrant vulnerability to labour market exploitation
There are several ways in which the immigration system itself can also create vulnerabilities. It is not necessary for migrants to be subject to the immigration system to be vulnerable: research with migrants in the care sector also revealed exploitation of European Economic Area nationals who had the right to work in the UK. However, the immigration system may facilitate exploitation through creating conditions where employers have a strong incentive not to comply with the rules, where reporting by employees is disincentivised, or because the rules are not enforced.
Lack of ability to work
Those who are not in the UK on a work route, but who are working in the UK, may also be vulnerable because of specific rules in the immigration system. For example, asylum seekers are not generally allowed to work legally (with some very limited exceptions) so may enter the informal economy on poorer wages and conditions, or students may be pressured to work more than their visa conditions allow under threat of reporting past violations. Finch and Cherti (2011) found this to be a particular issue for those who were living irregularly: in qualitative interviews with 80 migrants from 15 countries they found evidence that “irregular immigrants are frequently treated worse than British and regular migrant workers” including lack of holiday, sick and maternity pay; being paid less than NMW; abuse and threats; and having their papers taken away.
Work Rights Centre (2022) has carried out a survey with 191 Ukrainian refugees in the UK. They highlight in particular the population of Ukrainians who were in the UK at the outbreak of war but who did not have a valid immigration status. These people have been excluded from the 3 visa schemes (Ukraine Family Scheme, Ukraine Sponsorship Scheme and Ukraine Extension Scheme) set up to support Ukrainian nationals, and may therefore be particularly likely to seek work in the informal market and (with limited choices) find themselves in an exploitative situation. The caseworker guidance for the Ukraine schemes provides for some flexibility (explicitly stating that refusal should not be given on low-level immigration offences and allowing additional flexibility in terms of evidence submitted). However, this group is likely still to find it difficult either to regularise their status or to return home.
Restrictions on work for some groups of migrants may push them into exploitative situations by preventing them from obtaining safe and legal sources of income. For example, individuals seeking asylum ordinarily have no right to work other than after their application has been pending for 12 months, and then only in a Shortage Occupation List (SOL) role. The comparative restrictiveness of this rule, and the association between work restrictions and subsequent integration once refugee status is attained, are issues on which the MAC has previously commented. In our 2021 Annual Report we questioned the restriction that allows asylum seekers to work in SOL occupations only, and only after 12 months without a decision. We also recommended that the Government review their policy more generally on allowing asylum seekers to work.
Lack of ability to switch employers
Lack of ability to switch employers can increase vulnerability to exploitation. Where a visa is tied to a single employer and switching is not allowed, migrants in an exploitative situation face a choice between remaining in it or returning to their home country. For this reason, the MAC has made several recommendations in previous reports relating both to the importance of allowing switching, and to the importance of allowing time spent on non-settlement routes to count towards eventual settlement without needing to reset the clock. These include the recommendations made in the MAC’s 2021 Annual Report.
Migrants may also face problems where switching is allowed but the amount of time left on their visa is likely to mean that it is difficult to find a new employer: this can be a particular issue in situations where sponsorship has been cancelled or curtailed because of the timescales involved. Migrants may also be disadvantaged where the employer does not understand the rules.
Exploitation is more likely in a thin labour market, which may be a problem where the migrant is tied to a specific sector/geographical area where access to alternative employment is limited. For this reason, some commentators (e.g. Metcalf, 2018 cited in Sumption and Fernández-Reino, 2018) have suggested that tying workers to a specific job is relatively uncontroversial in high-skilled visa schemes, but potentially more problematic in low-wage work where the risks of underpayment or labour exploitation are higher. Historically, this is one reason that the MAC has generally not been supportive of occupation or sector-specific visas.
There is evidence that there is exploitation happening to workers who are in the UK under the new H&CW visa, onto which care workers and home carers were added following the MAC’s recommendation in our 2021 Annual Report. The GLAA has found evidence of labour abuse of migrants in the sector, and the number of modern slavery referrals has been rising, with the Care Quality Commission having made 14 referrals by July 2022 compared to 7 in 2021 and 3 in 2020. While we support the work DHSC is carrying out in this area (described above), we emphasise that in our report on Adult Social Care and Immigration in 2022 made several other recommendations which (if implemented) would help to improve life for all care workers in the UK and reduce the risk of exploitation.
Fees
Paying significant fees (visa application fees, visa renewal fees, immigration health surcharges) in relation to the immigration system can also be associated with a higher risk of exploitation, and a lack of ability to escape exploitative situations. The debt incurred as a result of these fees may not only force migrants to stay in work even if it is exploitative but can also have an impact on their family in their home country.
As well as the initial cost of visas and migration, the ongoing costs associated with visa renewals may make migrants more vulnerable to exploitation. The length of time it takes for a migrant on a settlement route to obtain this exacerbates the situation, with initial fees and ongoing renewal costs creating conditions that mean migrants are more likely than their UK counterparts to be vulnerable to exploitation. Qualitative and quantitative research carried out with migrants paying visa fees by Migrant Voice (2022) indicated that the financial need caused by these costs was a reason for migrants accepting exploitation at work.
Some employers use the knowledge of these high charges and the fact that migrant workers cannot afford to lose their jobs to keep them in more precarious work, such as giving them little notice of shifts, or to offer lower salaries than their UK counterparts because they know that they cannot afford to spend time out of work. Even where the fees are paid by the employer, the threat of repaying both fees and onboarding costs may also be used as a means of tying the migrant into the job for a certain period of time: this practice is used both in the public and private sector, including in NHS trusts. Even where it is possible to obtain fee waivers, it can be difficult and complex to do so.
We believe that settlement fees are currently too high: ILR costs £2,404 per person, even after substantial visa and other fees have been paid for 5 years. We have previously highlighted the generally high cost of these fees in comparison to other countries. In some cases the cost of fees prevents people from accessing settlement, meaning that they remain liable for ongoing visa and other costs – along with the associated application process and continued conditionality of status – until they can afford to apply for ILR. Reducing the level of fees charged would be a way of redressing the balance between employers and migrants in the labour market to some extent. We therefore suggest that the Government review fees for ILR, with a view to lowering them – this would have to be a multi-departmental solution given the extent of the fiscal impact on the Home Office. At a minimum, settlement fees should be waived for people on low incomes, as they are in many other visa categories. Doing this would reduce the ability of unscrupulous employers to use migrants’ financial situation, or the threat of fee repayment, to tie them into an exploitative situation. Being settled also reduces the risk of exploitation as the individual’s stay is no longer conditional. There is also evidence that facilitating paths to settlement through methods such as lowering ILR fees increases migrant wages and labour market performance in the long run (Pardos-Prado, 2022).
New routes and changes to the immigration system
New routes may come with an increased risk of exploitation, including through the labour market. For example, a survey with 191 Ukrainian refugees in the UK carried out by Work Rights Centre (2022), has indicated that entrants to the UK under the Homes for Ukraine scheme have found themselves vulnerable to exploitation as a result of lack of safeguarding oversight.
The situation in relation to those in the UK irregularly has been discussed above. However, migrants may also become irregular as rules change. When changes to the immigration system are made, those already in the UK, but who do not have ILR or equivalent status, may also find that they become more at risk of exploitation. For example, Sumption and Fernández-Reino (2020) discuss some of the groups of European Union (EU) migrants who were less likely to have applied for the EU Settlement Scheme (EUSS) and whose circumstances may therefore have become irregular as a result. As noted elsewhere, irregularity and associated issues such as compliant environment checks and no recourse to public funds (NRPF) may be factors in increasing individuals’ propensity to work in the informal market, and/or vulnerability to exploitation.
Temporary work schemes
Although temporary work and associated labour market problems are not exclusive to migrants, temporary visa schemes represent a specific set of issues in relation to migrant exploitation. By their nature “temporary visas provide less time for workers to develop language skills, knowledge of rights and networks that can increase their ability to protect themselves from exploitation” (Sumption et al., 2022). Anderson and Ruhs (2010) explore short-term working in the context of the wider trade-offs migrants make in the UK, with migrants who are in the UK only for the short term often being more interested in economic improvement than social integration, given the time-limited nature of their stay. Similar risks in relation to temporary work programmes exist in other countries such as Australia, the US, New Zealand, Sweden, and Finland (Sumption and Fernández-Reino, 2018). In general “low-skilled worker programmes around the world tend to offer fewer rights to workers than programmes targeted at high-skilled workers” (Ruhs 2013, cited in Sumption 2018).
Although temporary work is common for migrants, a number of the risk factors for exploitation are more common on temporary work routes which tie the migrant to an employer (often obtained through an agency/intermediary). As discussed earlier, this may be particularly problematic in low-waged work at RQF 1 and 2, as risk of underpayment and labour exploitation is higher due to their dependency on their employer. Research with migrants on these routes in the UK has demonstrated some evidence of this on both the Seasonal Worker visa and the Overseas Domestic Worker routes, on both of which the employer often also acts as the accommodation provider.
It can also be hard for migrants to access accurate information about their job in the UK before they leave their home country. Information available to the migrant on their eventual destination, contract/hours, and any fees they will be charged may be generic and insufficient to allow them to make an informed choice about participating. Disinformation on social media is also common. These work schemes also reduce the likelihood of some of the protective factors against migrant exploitation, such as developing their English language skills, knowledge of their rights or networks (Sumption et al., 2022; MAC, 2018), although there are efforts being made by various stakeholders to mitigate this (discussed above).
Looking at the Seasonal Worker visa in particular (a temporary visa allowing migrants to work in the UK in horticultural jobs such as fruit picking), seasonal workers in the UK in this sector (albeit under Freedom of Movement (FoM)) have described the long hours, hard work, and isolation, but also the positives that come with being in the UK on this route – the main positive being the amount of money they earn and save in the UK compared to their home countries.
Specific difficulties related to the Seasonal Worker visa include: fees being charged by recruitment agencies in migrant source countries; how isolated the locations can be; and the large migrant workforce due to the reliance on migrants to fill these roles. There is evidence of migrants not being provided a contract in their native language and of ill treatment (IASC, 2022); the 2021 review of the Seasonal Workers pilot (based on fieldwork carried out in 2019) also reported that almost half the compliance visits had found evidence of this happening. Farms have been found to be targeted by gangmasters who offer a supply of labour at cheap rates (HO, 2017). There is also evidence that farms may demand an unrealistic pace of work from their workers, who are then not allowed to work further if they cannot sustain it (FLEX and Fife Migrants’ Forum research with seasonal workers, 2021). It can also be difficult to carry out due diligence checks in countries of origin within the timeframes allowed by the scheme.
The 2021 review of the Seasonal Workers pilot found evidence of many of the problems cited above, with 22% of workers reporting unfair treatment from farm managers in interviews with the GLAA. Respondents also reported racism, discrimination, or mistreatment by managers allegedly on grounds of workers’ nationality. Previous studies have suggested that temporary schemes in theory offer opportunities to oversee conditions that less regulated schemes do not: “pay and conditions will not be worse for all sponsored migrant workers because employer-sponsored work permit schemes are also more regulated, e.g. minimum salaries higher than the minimum wage” (Sumption and Fernández-Reino, 2018).
Work is being done to protect seasonal workers’ rights, for example the Workers’ Rights leaflets being produced in several languages by the GLAA. Nevertheless, given the risk of labour market violations and the difficulty in enforcement in this sector, there are significant grounds for concern about lifting the cap for seasonal workers. We would like to see far more safeguarding of the workers who come to the UK for low-wage work, through increased compliance and enforcement visits. Given the limited resourcing available, we believe employers using this scheme should contribute significantly towards the costs of compliance, and that these costs should not be passed on to the worker.
Another way in which workers could be safeguarded more efficiently is by minimising barriers to the return of workers who have come to the UK on seasonal visas and who wish to repeat the experience. Returning workers are viewed positively by scheme operators, who have more time to carry out checks and who can be more confident that placements will work out with a worker who is a known quantity, and by retailers who welcome the added assurance and reduced risks of exploitation in recruitment. Growers also tend to prefer workers with experience of their sites’ specific ways of working, particularly in more specialist growing.
Over the last 2 years scheme quotas have been announced with little notice, leaving scheme operators less time to recruit and potentially delaying seasonal workers’ arrival into the UK. As the Seasonal Worker visa is for 6 months with a 6-month cooling-off period, it can then be difficult to bring workers back to the same place at the same time the following year. The Home Office may wish to look at whether any flexibility is possible, potentially by shortening the cooling-off period. Reducing barriers to enable those who wish to return to do so would also allow migrants the time to become more informed about their rights in the UK and increase their opportunities to learn English. Developing this pool of informed workers would also facilitate the spread of information in source countries about what seasonal workers should expect from a work placement in the UK.
Welfare exclusions and lack of access to Legal Aid and other forms of redress
As discussed above, financial need is a key driver for migrants entering or staying in exploitative work. Rules around NRPF and lack of access to benefits mean that migrants may find it more difficult to support themselves while changing employers, thereby discouraging them from looking for alternative work. Exploitative work may then be their only option to meet basic needs (JRF, 2011). Avoiding destitution (including rough sleeping, which in itself may lead to a migrant being deported) is also a reason for people becoming re-exploited having left exploitative employment.
Migrants are not eligible for some types of Legal Aid support. This support is often also difficult to access even if they do qualify, owing to the general reduction in availability of Legal Aid over the years. Other forms of redress may also be difficult to access. For example, most migrant partners of people on temporary routes cannot access specific leave for domestic violence victims (a restriction which disproportionately affects women). The National Referral Mechanism, by which victims of trafficking/modern slavery can regularise their status, also has long delays which mean that it is hard for migrants to use this route out of exploitation. Whatever the criteria to access leave to remain through this route, it should at least be sufficiently resourced to be usable.
Compliant environment policies
Compliant environment policies (including right to work checks, immigration enforcement raids, the criminal offence of illegal working) may also create a real or imagined fear of deportation/immigration enforcement action which employers can use as a tool to control or threaten migrant workers and trap them in exploitative working conditions (FLEX, 2022). FRA (2019) also provide evidence that migrants may endure exploitation rather than being reported to the authorities whereas Anderson and Ruhs (2010) explore migrants’ fears of being seen as ‘illegal’ or semi-compliant. In practice, it is also possible for labour market inspection bodies in the UK to share information with Immigration Enforcement. One partial solution to this may be the ability to report exploitation without personal data being shared in this way, a system used in the US. The Home Office and the Department for Business, Energy & Industrial Strategy may wish to consider working together to establish the feasibility of this, with a view to putting a similar agreement in place.
Lack of enforcement
Labour market enforcement is not well resourced: in 2014 the MAC expressed concern that enforcement of labour standards generally had been too limited, regardless of the origins of the workers. According to the DLME, the likelihood of being inspected is low enough to have only a weak deterrent effect (2018): “I have concerns that both the chances of being investigated by enforcement officers and the scale of financial penalties for those found to be non-compliant are too low.” In the UK Labour Market Enforcement strategy 2018/19, analysis of the number of closed cases showed that in 2016/17 the average UK employer could expect an inspection from HM Revenue & Customs minimum wage enforcement function around once every 500 years, and the average employment agency could expect an inspection from the Employment Agency Standards Inspectorate once every 20 years. Lack of enforcement, limited penalties and the potential profits to be gained by flouting the rules may also lead employers to make calculations and choose to carry out an “efficient breach” of labour law if the financial benefit to be gained is more than the likely cost of breaking the law. The DLME has warned that “employers are actively discounting these costs as part of their business model”.
We recognise that both immigration and labour market enforcement are finite resources that must be focused where there is the greatest risk of harm. To this extent, work migration (albeit this has historically largely been on highly-skilled routes) has not received a great deal of attention relative to other migration routes, although several threats under active Home Office investigation relate to the exploitation of migrants who are either in the UK for work or who are working while in the UK for other reasons. We would suggest that the Home Office looks at ways in which increased enforcement could be funded through fees paid by employers (whether existing or additional), with the proviso that these fees must not be passed on to migrants themselves as this would serve only to increase the prospects of exploitation.
MAC future work on exploitation
We expect that our work around exploitation in future commissions may involve:
Identification of trade-offs and recommendations for ways forward: a secondary effect of any recommendations that increase migrant restrictions (even if this is to reduce exploitation in the UK) may be to increase migrants’ vulnerability to exploitation in their home country, as a consequence of reducing their ability to move. We have a duty to weigh up the consequences of the recommendations we make. In some cases, this will mean identifying where there are trade-offs and the best way of balancing these.
-
Examples of the kinds of trade-offs (identified by the Migration Observatory, 2018) could include:
-
Linking a migrant’s presence in the UK to their employer: on the whole this reduces exploitation by making it easier to monitor compliance and target enforcement, but it also potentially makes it more difficult for migrants to leave their job (which may increase employers’ hold over their employees and hence the potential for exploitation);
-
Heavier regulation (which would reduce exploitation) depending on effective enforcement to be successful;
-
Efforts to direct employees to one part of the labour market through the use of sector-specific schemes increasing the potential for exploitation as a consequence by reducing those migrants’ opportunities to switch;
-
Some measures potentially preventing groups of migrants from moving to the UK at all: for example setting rules around language skills will reduce the potential for exploitation among those who enter the UK but may leave the group that cannot enter the UK vulnerable to exploitation by removing the chance to move.
We will consider similar trade-offs and attempt to strike a balance between ensuring the labour market is flexible enough to respond to the UK’s needs, while ensuring those who come to work here are properly protected.
-
Commenting on the potential for exploitation: shortage can give employees more bargaining power. However, for those who already have increased restrictions in terms of legality or coercion, shortage has the potential to fuel exploitative and/or illegal working practices where exploitative agents attempt to fill the gap in the market (for example because employers are less likely to insist on the same checks):
-
In particular, we will look at the potential for exploitation (including the abuse of zero-hours contracts) as part of our considerations around whether jobs should be added to the SOL, particularly at RQF 1 - 2;
-
We will also look at the potential for exploitation to vary or be experienced differently by gender and protected characteristics.
-
Commenting on good practice elsewhere, whether that is good practice in other countries or good practice suggested by other organisations. We can also share findings with other organisations who are better placed in the area, for example sharing findings with the DLME on specific sectors/industries they or we identify as those in which migrants are particularly likely to experience exploitation (e.g., nail bars and car washes) or in which changes to the immigration system, e.g., the ending of FoM, may increase the risks of exploitation;
-
Produce recommendations on areas requiring more enforcement, acknowledging the wider enforcement context, in particular the low levels of resourcing overall and the high degree of self-monitoring expected of work sponsors.
2: Labour Market and Immigration
The labour market this year has been characterised by highs and lows. The recovery from the pandemic has been tempered by stalling progress on employment and rising inactivity, an unprecedented level of vacancies, and soaring inflation, with the Consumer Prices Index rising by 11.1% in the 12 months to October 2022.
The after-effects of the first 3 waves of the pandemic, the Russian invasion of Ukraine and, uniquely to the UK, exit from the European Union (EU), have all played a role in influencing this climate. Against this backdrop, the Skilled Worker (SW) route continues to bed in, and it remains to be seen what the long run trend in volumes will be. This chapter focuses on the end of Freedom of Movement (FoM) in this climate, looking at both the labour market and the use of the SW route.
Overview of the labour market
Since the first easing of pandemic restrictions in March 2021 there has been a substantial fall in unemployment, which has now dropped to below pre-pandemic levels, as shown in Figure 2.1, and to rates not seen since 1974. By contrast, employment, in Figure 2.2, has been more sluggish, recovering quickly in 2021 but stalling in 2022 and not yet back to pre-pandemic levels. This shortfall in total employment is driven by falls in total self-employed workers, which was, as of September, 733,000 lower than before the pandemic. The fall in self-employed workers has been offset in part by an increase in the number of employees of 464,000 over the same period. Economic inactivity has increased on pre-pandemic levels to above 21% of the population aged 16-64.
Figure 2.1: Economic inactivity and unemployment rates (%) aged 16-64, 2019-2022
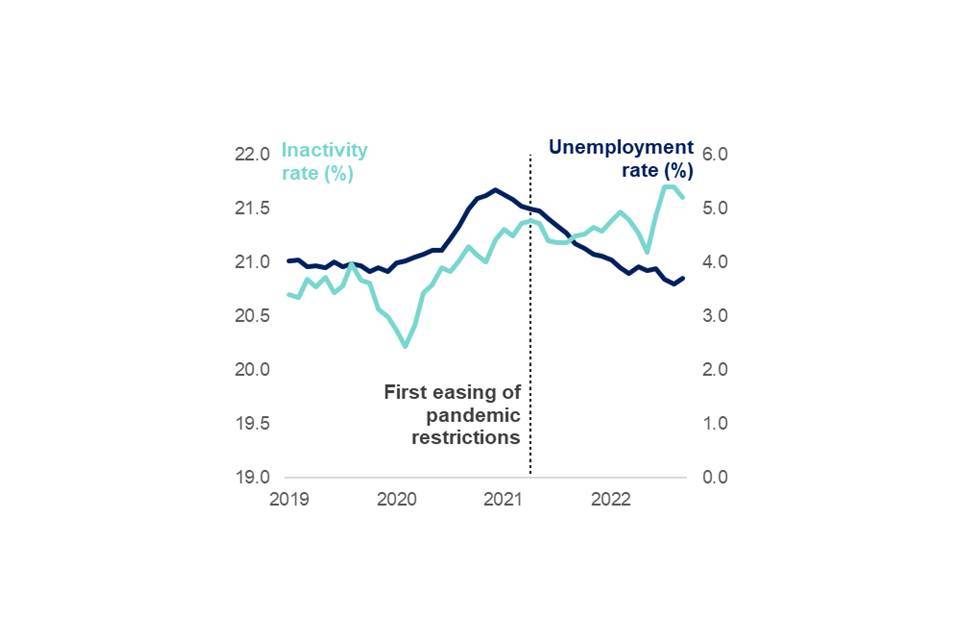
Source: ONS Labour Market statistics, November 2022.
Note: Seasonally adjusted data, includes all aged 16-64.
Figure 2.2: Employment rate (%) aged 16-64, 2019-2022
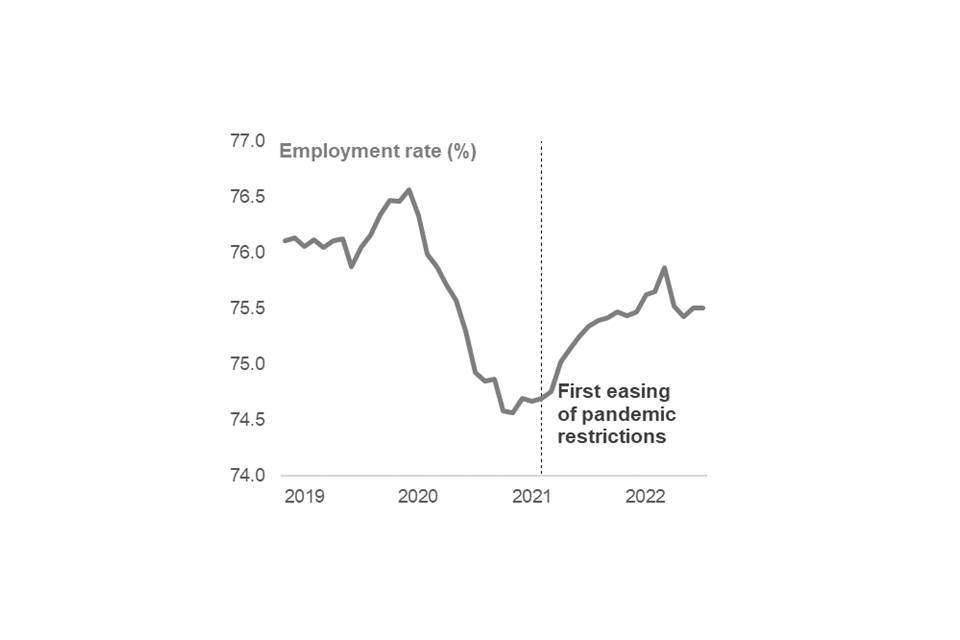
Source: ONS Labour Market statistics, November 2022.
Note: Seasonally adjusted data, includes all aged 16-64.
These labour market conditions are not unique to the UK, with the temporary rise in unemployment replicated across Europe and the initial uptick in inactivity also seen in most G7 economies. Where the UK stands out is that economic inactivity remains stubbornly above pre-pandemic levels. While the UK’s absolute rate of inactivity is not as high as others in the G7 (most notably France and Italy), Figure 2.3 shows that since the end of 2019 most G7 countries have experienced a fall in their inactivity rate. This trend is evident in more than three quarters of Organisation for Economic Co-operation and Development (OECD) countries, whereas the UK has seen the inactivity rate increase. The reason that inactivity is higher in the UK compared to other countries is unclear. What is clear is that the UK’s increases in inactivity are the greatest in comparison to the G7 for men aged 15-24, but also notable for the 55-64 age group as whole.
Figure 2.3: Percentage point change in the economic inactivity rate across the G7, ages 15-64, 2019-2022

Source: OECD Q4 2019-Q2 2022.
There are several elements that make up the UK’s inactivity picture. From 2019 onwards there have been consistently large flows from employment and particularly self-employment into inactivity, with the percentage of self-employed entering inactivity peaking at more than 3% in Q2 2020 and a peak of more than 2% of employees entering inactivity in Q4 of 2020 and 2021.
By age group, the drivers of inactivity have changed over time. Figures 2.4 and 2.5 break down these changes both in terms of age-group and self-reported reason for inactivity. The inactivity rate rose most for the 16–24 age group in 2021, as they entered or remained in full-time education given limited labour market opportunities at the height of the pandemic. This has begun to unwind in 2022, though around 100,000 more 16-24 year olds are inactive compared to 2019. Among 50-64 year-olds, the inactivity rate increased by a smaller amount in 2021, but has continued to increase in 2022, now sitting more than 2 percentage points above pre-pandemic rates. In terms of levels, 50-64 year-olds have been the largest driver of increased inactivity in the working age population both in 2021 and 2022, with nearly 300,000 more individuals inactive compared to 2019.
Figure 2.4: Percentage point change in inactivity rate by age group compared to 2019

Source: ONS Labour Market statistics, November 2022.
Note: Seasonally adjusted data, includes all aged 16-64.
Figure 2.5: Percentage point change in inactivity rate by reason compared to 2019
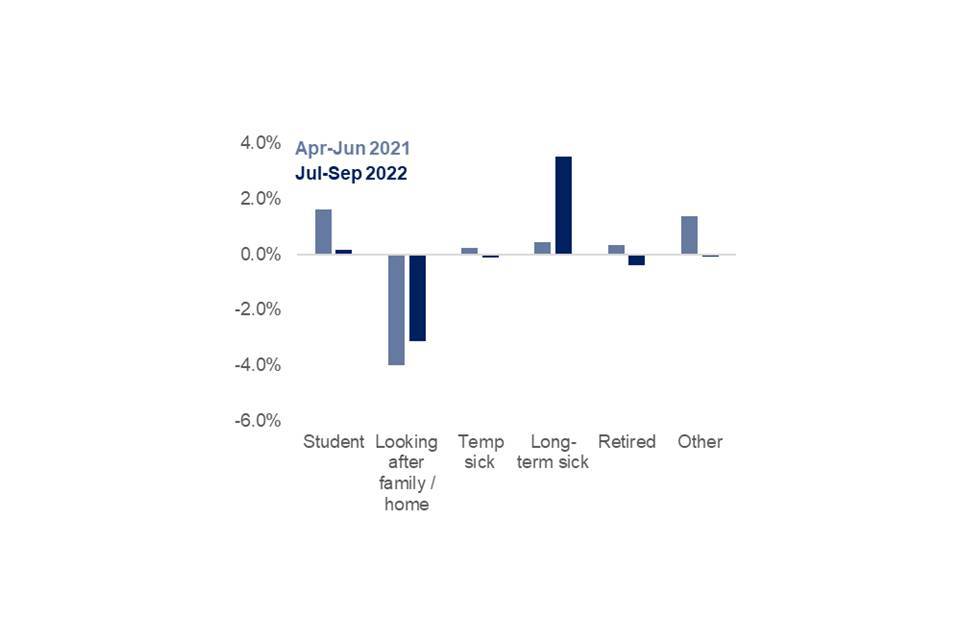
Source: ONS Labour Market statistics, November 2022.
Note: Seasonally adjusted data, includes all aged 16-64.
Sustained high inactivity is therefore predominantly being driven by the 50–64-year-old age group. Whether individuals in this group are likely to re-enter the labour market is unclear. The Institute for Fiscal Studies (IFS) has suggested that greater inactivity is largely due to changes in lifestyle, which the Office for National Statistics (ONS) Over 50s Lifestyle Study corroborates. The Study also finds that a higher proportion of those surveyed would consider returning to work, particularly if they are offered flexible working hours, good pay, and the ability to work from home some or all the time.
Alongside the increase in students, inactivity due to long-term illness has risen considerably, particularly in 2022. While this has coincided with the pandemic, IFS research on labour market flows suggests that rates of long-term illness have increased among the stock of those already inactive, rather than directly forcing individuals out of the labour market. It remains unclear to what extent this reflects the rising NHS waiting lists or ‘long COVID’ and to what extent the long-term sick were formerly those with caring responsibilities (down by around 160,000 since the end of 2019). Significantly, Office for Budget Responsibility research notes that the rise in inactivity due to long-term sickness has been echoed by a rise in new claims for disability benefit, suggesting that many inactive people may not return to the labour market.
While the supply of labour has stalled amid low unemployment and high inactivity, demand for labour has been unprecedented as the economy recovers from the pandemic. Vacancies have increased to record highs in the UK: an estimated 1.3 million between March and May with the ratio of unemployed people per vacancy falling to below 1 from June to August 2022 for the first time on record. These numbers may now have peaked and sit at 1.23 million as of October 2022. This pattern of increasing vacancies is consistent with other developed nations, as shown in Figure 2.6, suggesting that whilst ending FoM may have contributed to higher vacancies, or at least slower turnover, it is not the sole cause. Pent-up demand from pandemic restrictions is likely to be a significant driver of some of this common trend across several countries.
Figure 2.6: Index of total vacancies among selected G7 countries, (Index=100, Q4 2019), 2019-2022

Source: Bureau of Labor Statistics, ONS, Statistics Canada, Institut für Arbeitsmarkt- und Berufsforschung, OECD.
Notes: 1) These data are not strictly comparable due to differences in measurement. 2) No data for Canada from Q2-Q3 2020. 3) UK statistics exclude agriculture.
The ending of Freedom of Movement
The end of FoM and the introduction of the SW route has introduced a more demanding process for European Economic Area (EEA) workers to come to the UK, requiring a job offer from a licensed sponsor before arrival and preventing recruitment directly into Regulated Qualifications Framework (RQF) 1-2 occupations (except care workers). At the same time, there has also been a relative relaxation in restrictions for non-EEA workers.
The EU Settlement Scheme (EUSS) has allowed the vast majority of EU workers already in the UK to remain without needing to meet visa requirements, theoretically allowing sectors to retain their stock of workers and add to their workforce as necessary through the SW route. However, this pool of workers will diminish over the long term and the introduction of the SW route may make filling vacancies more difficult – especially for sectors dependent on EEA workers at skill levels below RQF 3, who are now ineligible for sponsorship.
This therefore represents a shock to labour supply, particularly restricting access to workers with lower training and qualifications. Based on the framework set out in Dustmann and Glitz (2015), we may observe 3 trends amongst employers following this shock:
-
Employers may try to attract new workers by raising wages and improving conditions. This will aim to substitute EEA labour for those already in the UK, particularly UK born workers. There may be high barriers to doing so, in that these sectors may not have been traditionally attractive to domestic workers and employers may face more intense competition with each other over a relatively fixed pool of labour.
-
Employers may reduce the labour-intensiveness of work. This could be achieved through automation, raising the productivity of workers through education and training or, in some cases, relocating activity.
-
If employers can do neither of these things, they may ultimately produce less. If this is the case across a sector, that sector will decline in its share of the labour market.
Immigration, skill mix and capital skill complementarity (Lewis, 2011)
In the 1980s and 1990s, certain metropolitan areas in the United States experienced a wave of immigration due to the tendency of immigrants to regionally cluster. This constituted a shock to the labour supply, increasing the relative supply of less skilled labour.
Combining census, technology, and labour force data, Lewis (2011) examines the relationship between the relative supply of less skilled labour in a metro area (induced by migration) and a manufacturing plant’s use of automation machinery. This is a ‘natural experiment’ because it relates the change in labour supply due to immigration, something largely outside firms’ control, to their decision to automate.
He finds that firms in areas with high immigration flows adopted significantly less machinery per unit of output, despite having similar adoption plans initially, and his overall results are consistent with automation machinery being both a relative substitute for less skilled labour and a complement to higher skilled labour.
In the UK context, FoM can be interpreted as a similar shock to the labour supply, in that it increased the pool of labour available to employers, particularly in RQF 1-2 occupations. This may have historically dampened incentives to adopt machinery. The end of FoM is therefore a shock in the opposite direction, which could encourage firms to turn to automation to substitute for less skilled labour – though this is by no means guaranteed.
This picture has been complicated and exacerbated by the pandemic, during which many sectors lost large numbers of foreign workers (as they returned home), leading to shortfalls when restrictions were then eased, and demand recovered. In addition, the rise in inactivity already discussed has reduced potential labour supply. This has, to some extent, brought forward the labour shock in some sectors which may have developed more slowly otherwise.
Figure 2.7 shows which sectors were most dependent on EU workers prior to the ending of FoM, both in their entirety and in terms of those working in RQF 1-2 occupations now ineligible for a SW visa. The manufacturing, logistics, administration (in particular cleaners, gardeners, security guards) and hospitality sectors stand out as the most reliant by both of these measures. We also focus on the agriculture sector, given that the Annual Population Survey (APS) (providing data on the proportion of EU RQF 1-2 workers) is likely to underestimate the sector’s dependence on hard-to-sample seasonal EU workers. These 5 sectors are likely to face the greatest shock as a result of the end of FoM.
Figure 2.7: Dependence on EU workers by sector
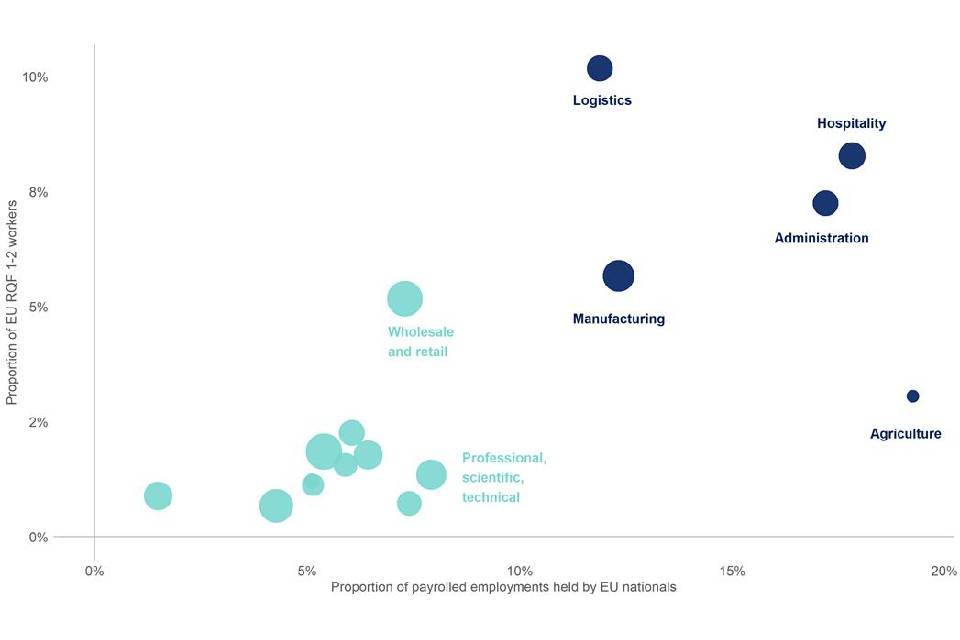
Source: APS 2019, HMRC PAYE RTI 2019.
Notes: 1) Dark blue dots refer to sectors identified as most likely to be impacted by the end of FoM. Turquoise dots show the sectors in the rest of the economy. 2) The APS (providing data on the proportion of EU RQF 1-2 workers, vertical axis) is likely to underestimate the sector’s dependence on hard-to-sample seasonal EU workers. 3) Under SIC 2007, ‘administration’ corresponds to ‘administrative and support service activities’, ‘agriculture’ corresponds to ‘agriculture, forestry and fishing’, ‘hospitality’ corresponds to ‘accommodation and food service activities’ and ‘logistics’ corresponds to ‘transportation and storage’.
Over the medium to long term, employers in these sectors in particular are likely to face the challenges outlined above: raise wages, improve the attractiveness of work or reduce the labour-intensiveness of work. If consumers are highly sensitive to price or if capital costs remain high relative to labour costs, it may be the case that neither of these options are palatable and sectors face relative decline.
This is not to say that all employers are equally exposed to these challenges, or equally able or unable to adapt. For example, an employer’s location will influence its reliance on EEA labour via the demography of a region, while an employer’s size will affect the degree to which it can make capital investments required to automate tasks. But at a sector level, it is likely that employment as a share of the workforce will decrease. FoM provided a relatively cheap supply of labour that may have incentivised recruitment over labour-saving capital investment or other restructuring activity towards fewer, higher productivity and higher paying jobs. Without FoM, many of these jobs may not have existed and may cease to exist in the future – and the period of adjustment to new labour market conditions may be difficult. This is not necessarily a negative development, and there is no obvious reason most private sector industries need to be a particular size.
As well as analysis of quantitative data, we have explored the impact of the labour market shock, and the ability of employers to transition to a ‘high wage, high skill’ economy, by speaking to employers in sectors that historically employed high proportions of EEA workers. To date this has included 7 site visits with companies across the manufacturing, logistics, hospitality, and agricultural sectors.
This work was carried out collaboratively between our independent research contractor, Revealing Reality, and the MAC secretariat. Evidence from this work is incorporated throughout this chapter, and the full report will be published separately by the MAC shortly.
Employment
Figure 2.7 showed that there was significant variation in sectors’ reliance on EU labour prior to the end of FoM, with hospitality, logistics, administration, manufacturing, and agriculture the most dependent and therefore most likely to struggle as a result of any difficulties in recruiting EU workers. Figure 2.8 shows how the level of employees in these sectors has changed since the end of 2019.
Figure 2.8: Percentage change in payrolled employees in selected sectors, 2019-2022
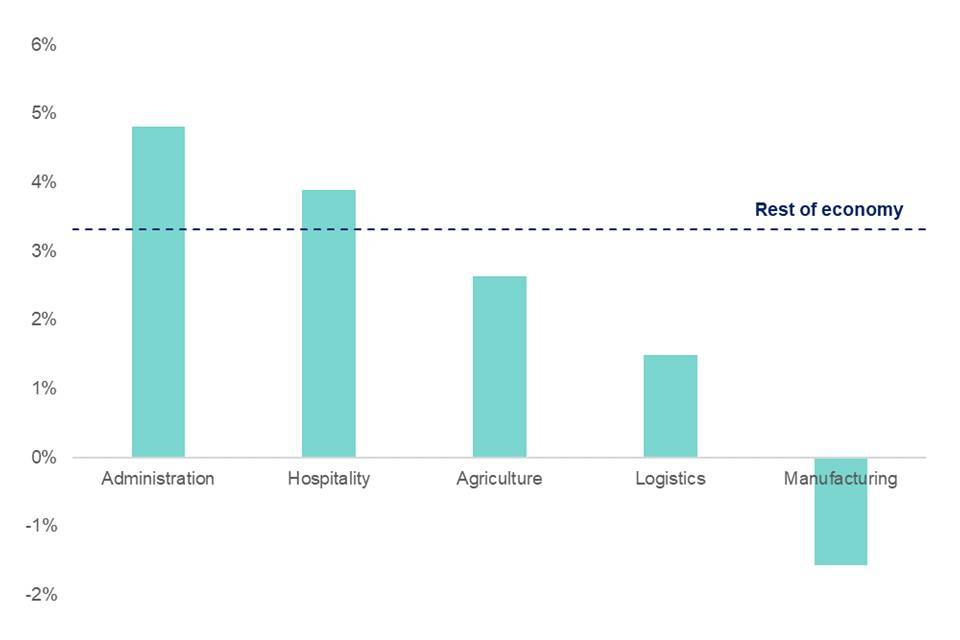
Source: HMRC PAYE RTI October 2019 and October 2022 monthly estimates of payrolled employees.
Note: Under SIC 2007, ‘administration’ corresponds to ‘administrative and support service activities’, ‘agriculture’ corresponds to ‘agriculture, forestry and fishing’, ‘hospitality’ corresponds to ‘accommodation and food service activities’ and ‘logistics’ corresponds to ‘transportation and storage’.
This extends previous analysis by the ONS on payrolled employments held by UK, EU and non-EU nationals from June 2019 to June 2021. While data broken down by nationality are not available beyond this point, the ONS analysis showed that, as of June 2021, there had been significant outflows of EU workers from hospitality, administration and agriculture, while manufacturing and logistics were comparatively less affected.
Figure 2.8 (which tracks employees, rather than payrolled employments as in the ONS analysis) shows that the picture has been mixed since then. Comparing the latest data to 2019, employment growth in administration and hospitality has outpaced the rest of the economy since, suggesting that the shortfall in EU labour has been recovered. Employment growth in agriculture sits close to the overall trend, while the share of all employees in logistics has fallen since 2019 – and paid employments in manufacturing have fallen in absolute terms over the same period. Changes in demand for the goods and services produced by these sectors have influenced this picture, as has the sectors’ capacity to source labour. We do not have the data to attribute these changes to the UK, non-EU, or EU workforce since June 2021.
These sectors are large, and aggregate numbers likely mask variation within them. There is also limited evidence on the experience of specific industries or how the employment of different nationalities within them has changed. Figure 2.9 tracks the percentage change in payrolled employments by nationality as compared to June 2019 in selected industries which were among the most reliant on EEA labour under FoM. As the data only go to June 2021, this can only show the position in which these industries found themselves around the time pandemic restrictions were eased.
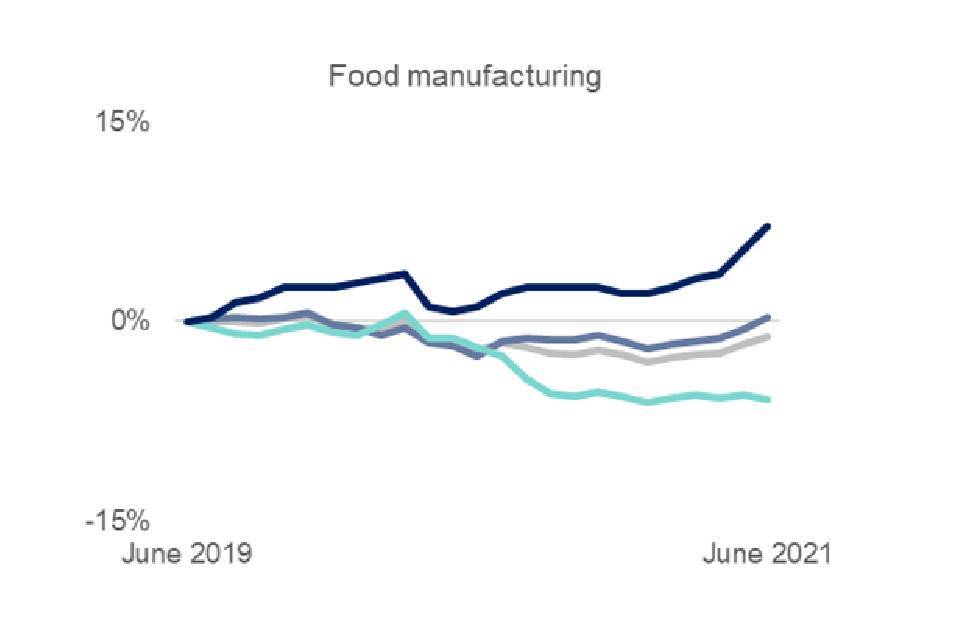
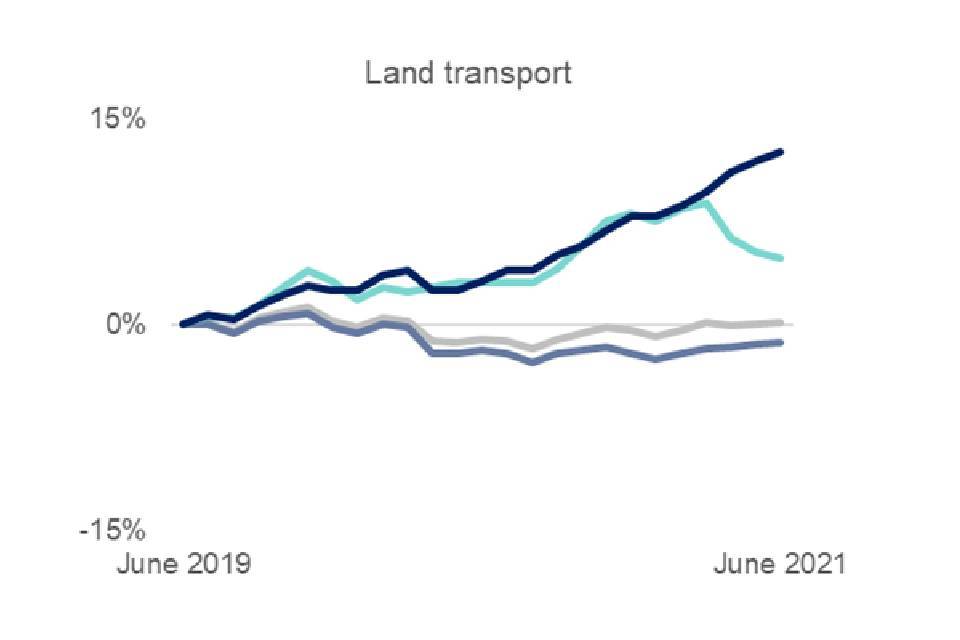
Food and beverage services and accommodation – the two industries that comprise hospitality and among the most directly affected by the pandemic – saw the most significant falls in EU workers, with little sign of UK or non-EU workers making up for this as of June 2021. In food manufacturing – the manufacturing industry most reliant on EU labour – there is some evidence of non-EU workers partially making up for a fall in EU workers. In land transport there was little to no fall in total payrolled employments from June 2019 to June 2021, with growth among both EU and non-EU nationals.
Figure 2.9: Relative change in payrolled employments held by UK, EU and non-EU nationals, June 2019-2021, selected industries
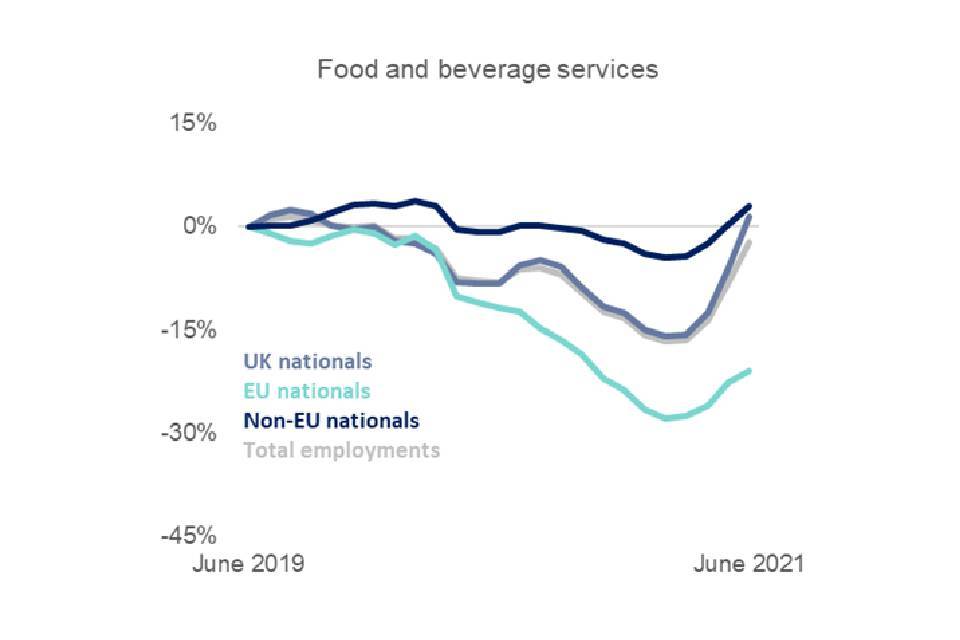
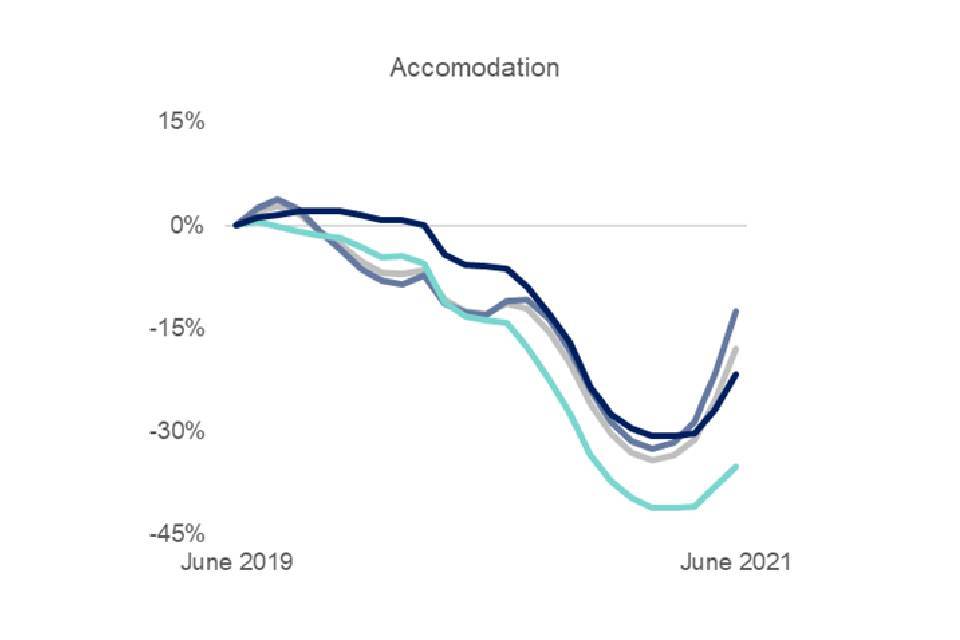
Source: Bespoke analysis using HMRC PAYE RTI 2019-2021, 2 digit SIC level.
Due to data limitations, this analysis has focused on payrolled employments and not self-employment, for which there is limited evidence. Prior to the end of FoM and the pandemic, 27% of all the EEA self-employed worked in construction, making up 5% of the total workforce, as well as over 2% of employment in administration, logistics and the arts. According to the ONS, self-employment has fallen from a peak of 5 million at the end of 2019 to 4.2 million in Q2 2022. It is unclear to what extent this has been driven by exits of the EU born self-employed.
Across the qualitative interviews, employers consistently spoke of the actions that they had taken to address the shortfall in labour, both before the ending of FoM (for example encouraging EU members of staff to apply for settled status), and since. Employer actions also encompassed a wide range of strategies, including efforts to improve retention of existing staff (such as increasing wages and offering greater employee benefits), identifying new potential sources of labour (such as specifically targeting younger or part-time workers, use of the Seasonal Worker visa, or apprenticeships), as well as automation. Further detail is provided under the relevant headings later in the chapter.
Case study – Efforts to mitigate staffing issues - “It was coming but we were prepared”
The organisation produces high-quality clothing, with an emphasis on the hand craftsmanship required to produce pieces. They have historically employed a high proportion of EU workers in their factory, with around 60% of workers born outside of the UK.
Whilst efforts to recruit and retain staff predate the ending of FoM, the change in immigration policy has provided an additional motivation to pursue them. To retain staff, the company has raised wages, with the increase this year costing the company approximately £800,000. They have also looked to improve the broader benefits package, with increased annual leave, wellbeing days, bonuses for long-serving members of staff, bonuses based on individual and company performance, and improved sick pay during COVID-19. To encourage EU born members of staff to apply for the EUSS they also hired specialist immigration advisors, who were able to deliver workshops, 1-2-1 consultations and a helpline for staff interested in using the scheme.
As they could not use the SW route, they have also diversified their recruitment strategy, including a ‘refer a friend’ scheme for existing workers and the development of a training programme, which brings in a variety of workers, including graduates, those with transferable, but lower-level manufacturing skills, and the launch of an apprenticeship scheme.
Automation is an ongoing process for the company, including employing highly skilled industrial engineers to drive service improvement. This includes current projects to digitise aspects of the business, providing real-time data, enabling them to make more efficient decisions. However, they anticipate that they will ultimately work using a ‘hybrid automated’ model, as the hand craftmanship is a key element of the appeal of their products. Automation was also seen as a way of reallocating staff to work on other products and broaden the factory’s offer, rather than simply substituting the existing workforce.
Whilst they believe the true impact is yet to be seen, the efforts to date have been broadly successful, and they have reported an approximate 0.5 percentage point reduction in the proportion of non-UK born staff compared to 2019.
Case study – Efforts to mitigate staffing issues - “The seasonal worker scheme has saved us”
This organisation grows, harvests and packs fresh produce for the UK market across several sites. 78% of their positions are at “entry level” (RQF 1-2): harvesters; and packhouse, quality control, machine, haulage and general operatives.
The harvesting must be done in a very specific way to maximise crop yield, product mix and quality, and it takes time for new staff to reach full productivity. While they learn (in the classroom and on the job) the company effectively subsidises them. After around 12 weeks they are expected to pick to a standard rate and receive a productivity bonus if they exceed this.
Several years ago, the people who worked on the sites were often British mothers with children at school, who were bussed in from the towns nearest the farms. The organisation still runs these buses, but the sites have in recent years relied very heavily on EU labour. Many of the harvesters speak words and phrases in several different languages which they use interchangeably, calling the resultant mixture “farm language”.
In 2018 99.7% of staff were from the EU, compared to 43.9% in 2022. Additionally, the overall number of staff has declined, from 1,080 in 2018 to 982 in 2022 (a 9% drop) as the company cannot fill vacancies. The organisation also saw European staff leave in the immediate wake of the EU referendum: they had 1,250 EU staff at the end of September 2015 and 958 at the end of September 2016 (a drop of 23%). The head of recruitment told us that “recruitment was challenging even before the end of Freedom of Movement, and is even more so now”.
The site we visited has lost staff to a local Amazon warehouse and to other companies in the area, for example a large kitchen supply chain. They have tried to reach the local labour pool (of British and settled EU workers, and also refugees) through Find a Job and holding open days and have also signed up to the Pick for Britain campaign, the Extra Workers Needed portal and advertised on social media. They have reached out to former workers who have returned to the EU but have settled status and run a family and friends referral scheme. The company has investigated the SW route as well as the Seasonal Worker route and tries to get the seasonal workers they train to return the next year. The company has managed to recruit 1,270 people in the past 12 months – 5 of whom were British workers, 128 EU and the rest from outside the EU.
Problems have been experienced with most of these routes. The company continues to find that British workers simply do not find this type of work attractive, even if they attend open days and interviews, and in common with similar employers they found that the Pick for Britain campaign was unsuccessful. The pool of EU staff with settled status is small, and many other employers are trying to recruit from it. Many of their settled Eastern European staff have family and friends who would like to come to the UK and work on the farm long-term, but they do not want to come for 6 months and without being able to bring family are instead staying where they are or going to farms and other businesses in Germany, the Netherlands or other Northern EU member states. Although the business would be ready to pay the salary threshold for the Shortage Occupation List (SOL), they cannot recruit entry-level staff through this route because of the SW skills threshold.
The Seasonal Worker scheme “has saved us” but, as people can only stay for 6 months, they cannot be drawn into the pipeline of supervisory and management training that the business needs. Another source of staff has been Ukrainians on one of the visa schemes, who are in the UK for the slightly longer term and can communicate easily with many other staff.
There are a number of retention initiatives, and the business tries to move their best workers into supervisory positions. They have also experimented with different ways of organising and semi-automating work, but the technology is not available to automate fully. The business needs 500+ staff over the next 6 months.
Vacancies
Vacancies in the UK have surpassed previous records, but these increases have not been equal across sectors. Figure 2.10 compares the trend in vacancies in the sectors most reliant on EU labour (for which we have data) to the prevailing trend in all other sectors. The most dramatic trend is seen in hospitality, where vacancies have bounced back from near-zero in the first wave of the pandemic to nearly double the pre-pandemic level. Vacancies in manufacturing have also run above trend, whereas administration and logistics have largely tracked the trend elsewhere.
Figure 2.10: Index of job vacancies by sector 2019-2022 (Q4 2020=100)
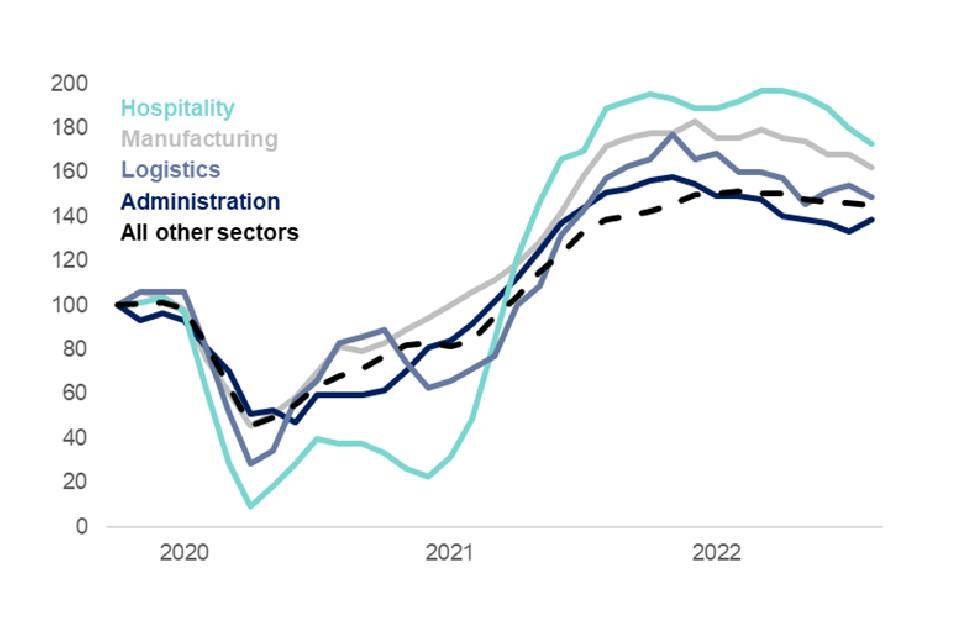
Source: ONS Vacancy Survey.
Notes: 1) No ONS vacancy data published for agriculture. 2) Under SIC 2007, ‘administration’ corresponds to ‘administrative and support service activities’, ‘hospitality’ corresponds to ‘accommodation and food service activities’ and ‘logistics’ corresponds to ‘transportation and storage’.
It remains to be seen to what extent vacancies in these sectors and in the wider economy will remain at near-record highs, with employers in RQF 1-2 occupations competing against each other for a smaller pool of labour. Some of the employers we spoke to reported having exhausted a much wider variety of recruitment methods to advertise and fill vacancies and questioned whether this would be sustainable in the long term.
Indeed, a jobs listings platform, collects information on the locations of those viewing UK-based job postings. Across all jobs, the ‘click share’ of those based in the EU has been stagnant since 2019, but the share of those based outside the EU grew over 100% between January 2019 and July 2022. There is no guarantee that this has translated into job and visa applications – not least since there is no direct route into most RQF 1-2 occupations. However, it is consistent with interest in working in the UK growing upon the relative relaxation of immigration rules for the non-EU born under the SW route.
Wages
Raising pay, particularly in comparison to competitors, is pivotal to enhancing the attractiveness of a sector or occupation. This is especially important amid soaring inflation and falling real pay, as workers expect higher pay at a time when increasing non-labour costs and consumer sensitivity to prices may restrict employers’ ability to provide it. Figure 2.11 compares the nominal increase in median pay since December 2019 in the sectors most exposed to the ending of FoM.
Figure 2.11: Nominal median pay growth in selected sectors, 2019-2022
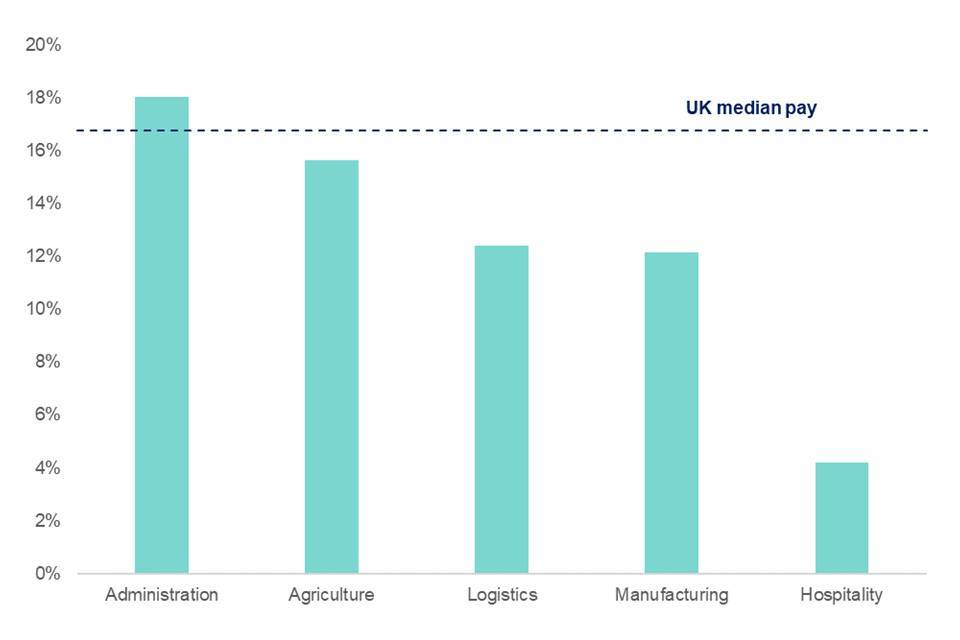
Source: HMRC PAYE RTI, October 2019 and October 2022. Monthly pay includes regular pay, bonuses and overtime.
Note: Under SIC 2007, ‘administration’ corresponds to ‘administrative and support service activities’, ‘agriculture’ corresponds to ‘agriculture, forestry and fishing’, ‘hospitality’ corresponds to ‘accommodation and food service activities’ and ‘logistics’ corresponds to ‘transportation and storage’.
Pay growth in the most exposed sectors has been relatively weak – at least compared to the trend across the labour market – with only administration offering stronger pay growth compared to the average. This is despite vacancies in hospitality in particular growing faster than average. Employers in some sectors, notably logistics, have opted for one off sign-on bonuses rather than consolidated pay increases to attract new staff, which may not be reflected in the analysis of payrolled employees above. Job postings data from Analyst (formerly known as Burning Glass) shows that vacancies were 40% higher in August 2022 than in August 2019; while postings with keywords associated with welcome bonuses rose 110% over the same period, and 125% among RQF 1-2 occupations.
This underscores that high vacancies do not translate into higher wages automatically – as the IFS have found from 2019 to 2022. The willingness of employers to meet pay demands, alongside the economic reality sectors face, in terms of input costs and output prices, determines the extent to which high demand for labour leads to pay growth. It may also be unrealistic to expect pay to increase permanently in the sectors with most acute labour shortages, without a long run increase in productivity or consumer acceptance of higher prices. Inevitably, with relatively weak pay growth over the longer term, some sectors will see their share of the labour market decline.
Within the qualitative research, many employers said they had increased wages, but to varying degrees and for differing reasons, which were not always directly related to the end of FoM. Within agriculture, employers saw the Seasonal Worker route as a crucial part of their workforce, without which the sector would experience far higher vacancy rates.
We’ve had to totally rely on the seasonal work permit scheme. And the real problem with that scheme is for us, it’s only six months. We obviously can offer … a huge proportion of our workforce full time work, but we cannot get… people. We cannot find people locally who want to do the work. … It’s not a wage rate issue. It doesn’t matter what we seem to offer. We can handle the sort of issues that are most normal to our locations. All our sites have rural locations. And if it hadn’t been for the seasonal scheme, we would have closed at least one of our sites because we just wouldn’t have been able to function.
Agricultural employer, North of England and Scotland
Employers in the sector also noted the upward pressure the £10.10 seasonal workers minimum wage rate puts on wages, above the National Living Wage of £9.50. This is not necessarily a problem: one employer we spoke to said that they would be happy to pay the minimum salary threshold for the SOL (£20,480). Employers also reflected that wages were only one aspect of attracting workers to the sector, and that issues such as the type of work on offer, rural locations of sites and the seasonal nature of many roles, provided additional barriers to recruiting UK nationals. Employers noted the efforts the sector had made to recruit domestic workers, citing the ‘Pick for Britain’ scheme, which made little impact despite significant publicity. One agricultural organisation we spoke to argued that whilst it was hard to recruit domestic workers, there was a potential supply of migrant applicants, but that the sector was restricted by the limit on the number of Seasonal Worker visas available. They highlighted the large pay differential between the UK and countries such as Nepal, where agricultural workers typically earned less than £1 per hour.
Competition between employers was also raised as a driver of wage increases, with several employers across all sectors highlighting the wage rates and joining incentives of other organisations. Some organisations were offering similar joining bonuses. However, whilst organisations had often raised wages, they were not always able to pass on increased labour costs to their customers and end users.
Wages are just one part of a broader package of recruitment and retention. Amongst the employers we spoke to, as well as wage increases, examples included additional employee benefits such as increased annual leave, employee bonuses based on company performance, and welcome bonuses of up to £2,000. Employers were also recruiting in several different ways, including starting apprenticeship schemes, utilising ‘refer-a-friend’ initiatives, and diversifying their campaigns, for example to target campaigns at candidates with different age profiles or working patterns. As part of this, employers often found they needed to move away from a rigid pattern of full-time shifts, and towards part-time and flexible working. This could involve organisational changes, for example changing pay structures to incentivise unpopular times, hiring more people, or maintaining a pool of more casual workers who only filled in occasionally around other jobs.
In the past we would have said, well, that is the job. We are now having to become a much more flexible and friendly employer that says, ‘tell me what you can do and I will see if I can give you a job that does that.’. A lot of women who want to drop the kids off and pick the kids up, I will now give you a 6-hour job whereas previously you were expected to do… an 8-hour job. As an employer you are having to be more adaptable which isn’t a bad thing, but inevitably there’s always something no-one wants to do. So I now have to look at how our pay structures work [for different shifts]
Passenger transport, London
Automation
There may be significant potential for the automation of work in some sectors which have historically found recruiting domestic workers difficult, such as agriculture, and for which labour market conditions no longer support historic levels of employment. The adoption of labour-saving technology often requires considerable upfront investment by businesses, which may now be more economically attractive for businesses in the absence of the relatively cheap supply of RQF 1-2 labour under FoM. Greater automation has the potential to create high-skill jobs to which capital equipment is complementary.
In the MAC’s report on the Impact of EEA Migration in the UK, we were not able to definitively conclude the impact of EEA immigration on investment in the UK context due to a lack of robust evidence. Timely and accurate quantitative data on investment by firms remains elusive, making it hard to quantify any impact.
Figure 2.12: Proportion of EU RQF 1-2 workers against job automation probability by industry
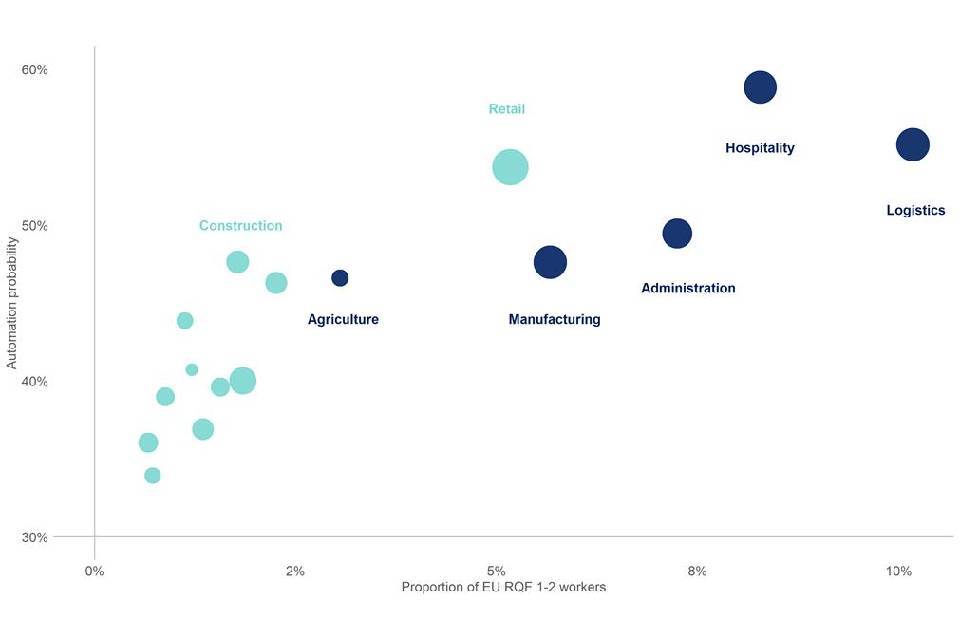
Source: pooled APS 2017-2019, ONS probability of automation dataset.
Notes: 1) Dark blue dots refer to sectors identified as most likely to be impacted by the end of FoM. Turquoise dots show the rest of the economy. 2) ‘Automation probability’ by sector calculated as the weighted sum of 4-digit SOC occupations and their associated probability of automation. 3) ONS probability of automation estimates for England only, applied UK-wide. 3) Under SIC 2007, ‘administration’ corresponds to ‘administrative and support service activities’, ‘agriculture’ corresponds to ‘agriculture, forestry and fishing’, ‘hospitality’ corresponds to ‘accommodation and food service activities’ and ‘logistics’ corresponds to ‘transportation and storage’.
Figure 2.12 plots the estimated likelihood of job automation in sectors (derived from ONS estimates of the probability of automation) against the proportion of the sector’s employment made up of RQF 1-2 workers from the EU. The size of the bubble reflects the absolute number of such workers in the sector’s workforce. The figure suggests that the probability of job automation is higher in sectors with a greater dependence on EU RQF 1-2 workers (either as a proportion of their workforce or an absolute number). These probabilities would be higher still if the analysis looked only at RQF 1-2 occupations, with 67% of roles of that skill level in hospitality potentially being automated in future. Therefore, theoretically, the sectors most dependent on EU workers have greater scope to reduce the labour-intensiveness of work.
Automation may not take place as an automatic response to changes in economic conditions. Evidence suggests that both managerial capability and policy incentives influence technology adoption – and the Government’s Business Productivity Review prior to the pandemic highlighted the role of management capability in driving up firm-level productivity. The Government, in conjunction with the private sector, can do more to raise standards in this area, integral to a ‘high wage, high skill’ labour market.
Across the organisations we spoke to, several expected to see an increase in automation being built into their operations in coming years for several reasons. However, automation was often seen as a gradual rather than binary process. Whilst they believed it may reduce the need for labour over time, few saw automation as a feasible way to address staff shortages in the short-term.
Several of the employers we spoke to were currently identifying areas for automation or even trialling new systems. There were still significant barriers to this, including the initial investment required, and the current precision and efficiency of the technology compared to a worker. For example, in agriculture, employers noted that certain aspects had been heavily automated for many years, such as the spraying of crops and the use of agricultural machines. However, they argued that in tasks such as fruit picking, the technology is currently slower and more expensive compared to a worker. The technology may also not be available: for example, 1 organisation had managed to automate part of the picking process, but this meant that they had to move an equivalent number of staff to grading and sorting produce, as the technology to do this is not yet available, which meant the same number of people were required overall.
Some of the employers we spoke to questioned the importance they believed is placed upon automation to reduce shortage, noting that their margins were thin, that timescales were short, and that they felt areas such as the health sector were treated differently.
Some businesses also explained that for them investment followed long-term planning, driven by a much broader range of concerns than specifically being ‘labour-saving’. For example, they might have an overall aim to upgrade equipment to stay competitive or prepare for future changes in regulations, but automating the process is not the core aim itself. Within some sectors, there was also an appreciation that for certain tasks, automation was not always desirable. For example, one restaurant chain within the hospitality sector noted that whilst certain tasks could be mechanised (for example using a coffee machine, or developing an app for payment), customers were paying for a service when they come to a restaurant, and that they believed would be somewhat undermined by fully automating the waiter role. This was also true of other employers, where items being ‘hand-finished’ was part of the appeal of the product.
Immigration in 2022
The SW route replaced the Tier 2 (General) route as the main work route for skilled work into the UK in December 2020. With migrant inflows tempered by the pandemic in 2021 and care workers made eligible for the route in February following the MAC’s recommendation, it remains to be seen what long-term volumes will be on the new route.
More broadly, net migration has risen considerably in the year ending June 2022, to 504,000, as shown in Figure 2.13. This is the highest figure since records began but follows 2 years in which net migration was lower than in recent years. This rise in the most recent 12 months is for several reasons, including the new Hong Kong British National (Overseas) (BNO) route and Ukraine Sponsorship Scheme, a rebound in worker visas from the pandemic, a rise in the number of students and their dependants, and the NHS’s use of the SW route. It is unlikely that net migration will remain this high in the long term: the spikes in migration caused by the new visa schemes are likely to be followed by applications tapering off and gradual outflows. In addition, the work routes have been deliberately designed to be flexible in terms of numbers depending on the state of the economy. Given the high level of vacancies referenced earlier in the chapter, it is unsurprising that employers are increasing recruitment overseas to address shortages. If, as predicted, the labour market weakens in coming months, we would expect a reduction in worker visa applications. We would caution the Government in becoming too focused on net migration numbers, particularly since a significant part of the rise is a result of deliberate government policy.
Figure 2.13: UK net migration by nationality group, years ending June (thousands)
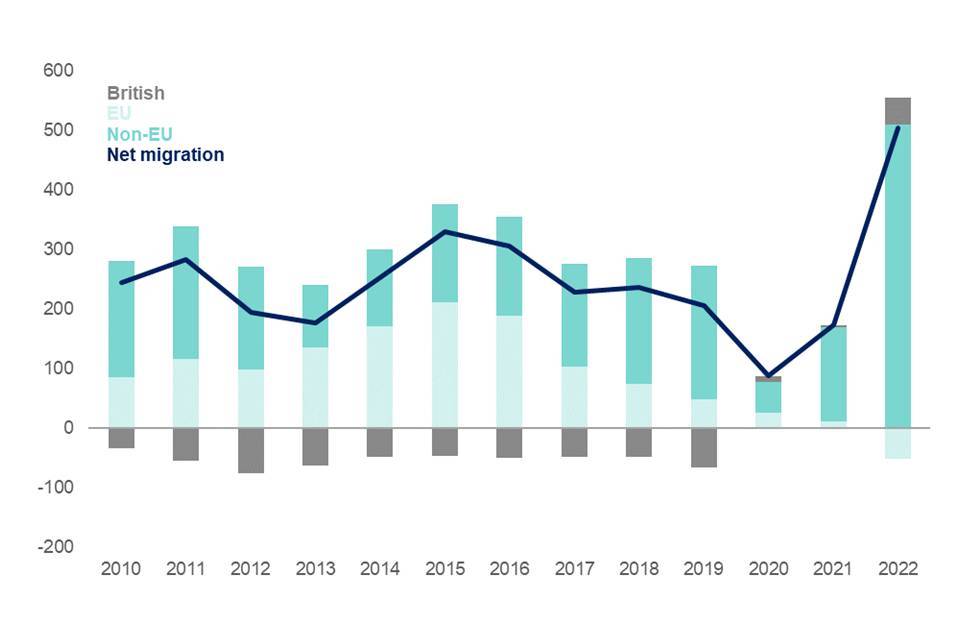
Source: Provisional estimates of long-term international migration, August 2020, November 2022. Yearly figures use mid-year (June) estimates.
Note: the ONS changed its method for estimating international migration in August 2020, meaning estimates before and after this point are not strictly comparable.
Skilled Worker route
While the SW route continues to bed in, some features are increasingly evident. EEA nationals make up around 7% of the cumulative total of applications. There are several factors which may explain why the share of usage is relatively low – particularly given that migrants from the EU made up around 40%-60% of net migration over the previous decade. The EUSS has tempered initial demand for EEA workers, such that the proportion of EEA nationals in the SW route may increase in future. Take-up of the new immigration system among EEA born workers may also be low given that the SW route constitutes a greater disruption to existing recruitment channels compared to non-EEA workers; while employers of EEA born workers, accustomed to FoM, may be unable or unwilling to meet the cost and administrative burdens (outlined in our 2021 Annual Report). It is unclear to what extent volumes of EEA migrants on the SW route should be expected to rise: in 2019, almost half of EEA born workers were in an RQF 1-2 occupation, now ineligible for a visa. At the same time, the Migration Observatory has noted that there were more EUSS applications in England and Wales than there were EU passport holders on census day 2021, suggesting that a potentially large pool of individuals have left the UK while retaining their right to return without a visa for up to 5 years.
Figure 2.14: Skilled Worker visa applications by sector, January 2021-September 2022
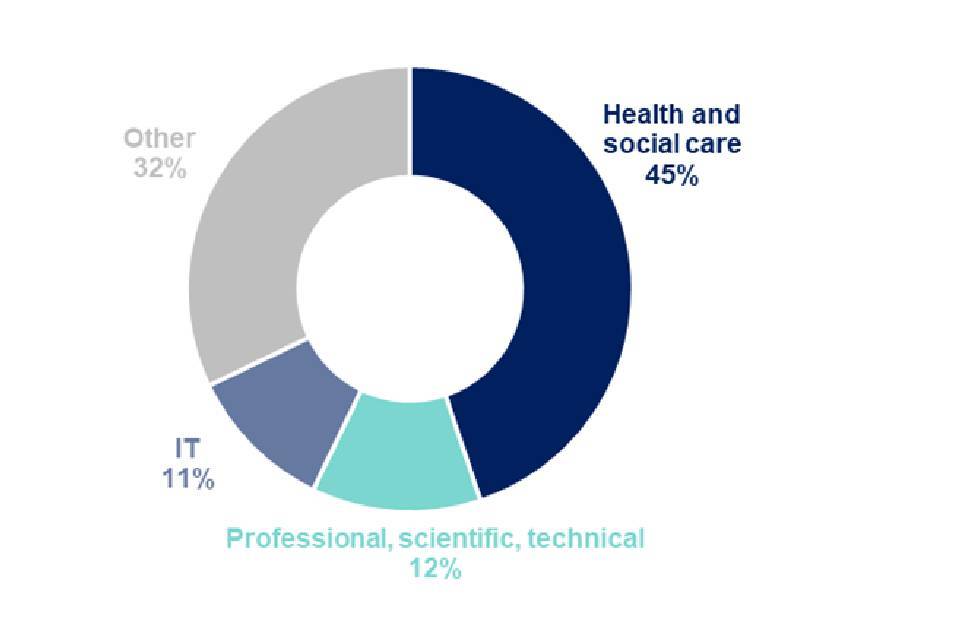
Source: Home Office Management information January 2021-September 2022.
Notes: Used CoS. CoS is assigned to a migrant by their sponsoring employer and the migrant can then use the certificate number to make an application.
Figure 2.15: Skilled Worker visa applications by RQF level, January 2021-September 2022
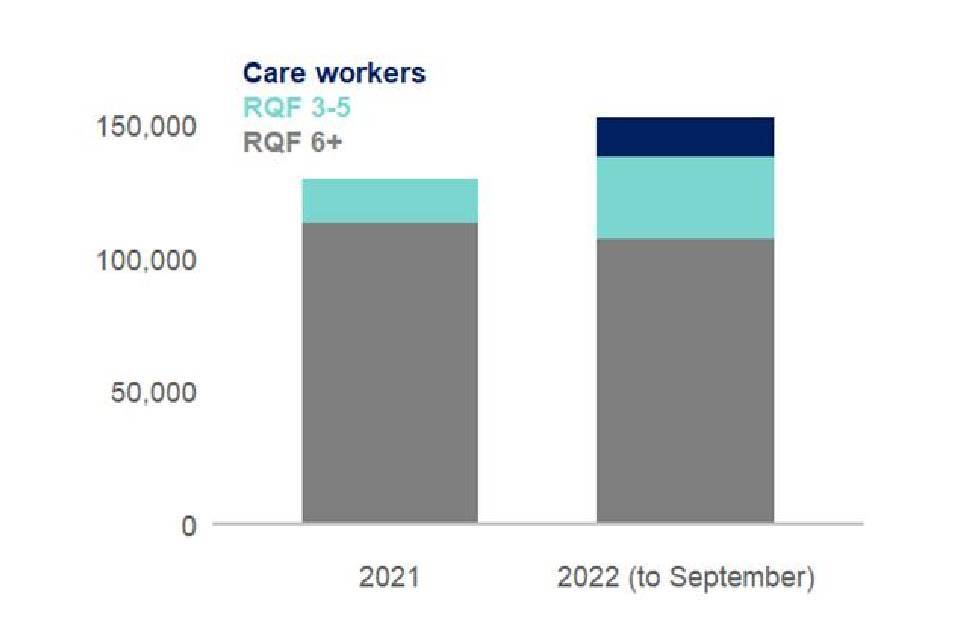
Source: Home Office Management information January 2021-September 2022.
Notes: Used CoS. CoS is assigned to a migrant by their sponsoring employer and the migrant can then use the certificate number to make an application.
Figures 2.14 and 2.15 break down cumulative volumes of SW route applications since 2021, by sector and RQF level respectively. As with Tier 2 (General), the health and social care sector dominates the SW route, making up 45% of applications, while the next two largest users – IT and professional, scientific and technical activities – account for around one tenth each. Nurses remain by far the single largest occupation on the SW route, making up 18% of applications to date. It is important that these flows are not detrimental to the provision of care in the home countries of those who relocate to the UK, and that employers adhere to the code of practice for recruitment.
Applications in RQF 6+ occupations have made up the majority since the inception of the SW route, but there has been rapid growth in applications below RQF 6 in 2022, with RQF 3-5 volumes nearly double the 2021 level by September. Growth in applications for senior care workers and care workers – the only RQF 1-2 occupation eligible for the route – has been rapid, with volumes of the former more than doubling to 14,000 in the year to September, and nearly 15,000 applications for care workers since February. This underscores the crisis in social care set out in the MAC’s review earlier this year.
Small employers have made up a greater share of visa applications in the first 9 months of 2022 than in 2021, driven by the recruitment of care workers and senior care workers. Overall, small organisations’ share of total applications rose from 14% in 2021 to 19% from January to September 2022, while large organisations’ share fell from 70% to 61%. But excluding social care, these proportions are essentially unchanged.
We have also conducted a geographic analysis of the SW route in Chapter 3, identifying how, and seeking to explain why, usage of the route differs across the UK.
Other routes
Table 2.16 sets out the major immigration routes to the UK by their main applicant and dependant volumes. While the MAC’s focus has often been on the SW route and its predecessor, it is important to note that main applicants to the SW route account for a small proportion of individuals granted visas to enter the UK in a given year, and of those entering the UK with at least some right to work.
Table 2.16: Visas granted in the year ending June 2022
|
Route |
Main |
Dependant |
Ratio |
Total |
|---|---|---|---|---|
|
Worker |
119,000 |
103,000 |
0.86 |
222,000 |
|
Skilled Worker |
52,000 |
35,000 |
0.68 |
87,000 |
|
Health & Care Worker |
47,000 |
49,000 |
1.04 |
96,000 |
|
Global Business Mobility* |
18,000 |
18,000 |
0.99 |
36,000 |
|
Other |
2,000 |
1,000 |
0.28 |
3,000 |
|
Temporary Worker |
70,000 |
2,000 |
0.03 |
73,000 |
|
Seasonal Worker |
40,000 |
0 |
0.00 |
40,000 |
|
Youth Mobility Scheme |
13,000 |
0 |
0.00 |
13,000 |
|
Other |
17,000 |
2,000 |
0.13 |
19,000 |
|
Other work visas |
29,000 |
2,000 |
0.06 |
30,000 |
|
Overseas Domestic Worker |
17,000 |
0 |
0.00 |
17,000 |
|
Investor/Business/Talent |
3,000 |
3,000 |
0.91 |
6,000 |
|
Other temporary visas |
37,000 |
|||
|
Sponsored study |
406,000 |
81,000 |
0.20 |
487,000 |
|
Family |
36,000 |
|||
|
BN(O) Route |
45,000 |
30,000 |
0.67 |
76,000 |
|
Ukraine schemes |
144,000 |
|||
|
Ukraine Family Scheme |
44,000 |
|||
|
Ukraine Sponsorship Scheme |
100,000 |
Source: Home Office immigration statistics year ending November 2022, issued entry visas.
Notes: Dependant ratio calculated as dependants divided by main applicants. *Includes Senior or Specialist Worker (Global Business Mobility) and Intra-company Transfers only. Other Global Business Mobility routes counted under Temporary Worker.
In the year ending June 2022, main applicants to the SW and Health and Care Worker routes accounted for around 100,000 of the 222,000 individuals granted a UK worker visa. About 84,000 of the remaining individuals came as dependants to these main applicants, with essentially unrestricted work rights for adult dependants. The rest were granted visas via the Global Business Mobility (formerly Intra-Company Transfer) and other routes, bringing a further 19,000 dependants. Overall volumes of worker visas were 95% higher than in Q1-Q4 2019 (when individuals from the EEA did not require a visa to work). A further 103,000 people were granted visas through other, largely temporary, work routes, almost exclusively as main applicants. This included 13,000 individuals on the Youth Mobility Scheme, with highly flexible work rights, and some of whom are likely to seek employment in RQF 1-2 occupations.
Outside of work routes, nearly 500,000 people were granted a sponsored study visa in the year ending June 2022. International students studying at degree level or above on the Student visa are permitted to work up to 20 hours during term time, and full-time during scheduled holidays, while adult dependants have nearly full work rights. Around 200,000 individuals were also granted UK visas via the BN(O) route and Ukraine Sponsorship Scheme with the right to work (time-limited in the case of the latter) – albeit that work is unlikely to be the main motive behind this migration, and their stay in the UK may not be permanent.
Altogether, in the context of unprecedented vacancy rates, this highlights that the potential labour pool of migrants in the UK is much broader than the main applicants for SW visas, particularly accounting for dependants. While it is unrealistic to expect all or even the majority of dependants to enter the labour market – we do not have the data to distinguish between adults and children, and many may have entered the UK with no intention of working – it is also the case that the UK offers relatively generous work rights, and dependants using these rights have historically participated in the labour force.
Conclusion
The ending of FoM constituted a labour supply shock to the UK economy, particularly for the sectors most reliant on EEA-born workers in RQF 1-2 occupations. The pandemic has arguably increased and hastened the impact of this shock as it led to a rise in economic inactivity and an outflow of EEA workers, at least in some sectors.
There is no economic rationale that requires sectors to have fixed shares of employment. Where FoM historically facilitated the creation of jobs in some sectors by providing access to relatively cheap labour from the EEA, these jobs may no longer be economically viable as workers move to other, likely higher paying, roles in the labour market. In the context of soaring vacancies but consistently high economic inactivity and a looming recession, the MAC believes that the Government should resist calls to open new visa routes without a strong economic rationale and in effect undo the end of FoM on a sectoral basis. Low-wage worker routes have significant unintended consequences, and we are not confident that the Government will be in a position to prevent exploitation of migrant workers whose visa ties them to low-wage jobs.
It is disappointing that there is a lack of joined-up thinking across Government, in cooperation with the private sector, on how to proactively manage and address shortages in the labour market. There is no coherent, overarching strategy for skills and employment that draws on public and private sector actors to facilitate a robust skills infrastructure, enable employers to improve pay and conditions and automate where appropriate, and encourage inactive workers into employment. The ongoing volatility in the policy landscape and focus – including, notably, the dissolution in May 2022 of the Skills and Productivity Board – is an obstacle to long-term planning by both the private sector and the Government.
The Government already exerts influence over the skills pipeline for a wide range of professions. Volumes of doctors and nurses trained domestically, for which the Government is the main funder and regulator, have long been insufficient. This further exacerbates challenges with staff retention and is central in why the healthcare sector is by far the largest user of the SW route. The Government can act comprehensively to address shortage by expanding training and improving conditions. More broadly, further education colleges, in conjunction with the private sector, are likely to play a pivotal role in the future supply of workers in RQF 1-2 occupations. The Apprenticeship Levy could be restructured at a sector level to better fund and set direction for training activity and employment, incentivising employers to ‘chip in’.
Ultimately, high volumes of work migration into specific sectors – which often predate the ending of FoM – to some extent simply illustrate the UK’s attractiveness as a global destination for skilled workers, as the data on rising non-EU interest in UK jobs postings shows. However, high levels of skilled migration also result in part from a failure to proactively improve training, pay, conditions and retention. Immigration policy can at best only offer partial solutions to these problems, as a stopgap, with policy levers over the SW route in particular only accounting for a small proportion of those entering the UK in any given year. A sustainable long-term policy to address shortages must tackle the root causes of those shortages, rather than simply sourcing alternative labour to fill them.
3: Geographic Analysis
This chapter explores geographic variation in usage of the UK immigration system and seeks to explain why any variation may occur. We begin by outlining how migration has changed across the UK over the last 20 years. We then analyse the Skilled Worker (SW), student, and asylum routes of the immigration system to identify and explain differential geographic variation in their use. We then explore demographic differences across the UK’s constituent nations and consider what role migration could play in addressing demographic challenges. We conclude by considering what policy implications any geographic variation has for the immigration system.
Our analysis shows that there is significant geographic variation in how the main work visa of the immigration system is used. London uses the SW route more than any other part of the UK, and more than we would predict based on observable characteristics of different areas such as firm size, occupation, or sector composition. Scotland, Northern Ireland (NI), and North-East England each uses the SW route less than would be predicted based on these same factors.
However, we show that these patterns predate the establishment of the SW route in 2021. London’s dominance of the SW route is very similar both to patterns under the previous main work visa, the Tier 2 (General) route, and to the patterns of location of European Economic Area (EEA) migrants with freedom of movement (FoM) pre-2021. In both cases, migrants disproportionately located in London. We find that geographic variation in flows of work migrants into the UK results from structural differences in regional labour markets which are mirrored by the work visa, as well as from more intangible factors such as existing migrant networks and demography.
Considering the argument that the immigration system should be geographically differentiated, we acknowledge the different demographic circumstances across the UK’s constituent nations – most notably in Scotland, with projected population decline in the coming years driven by lower fertility and higher mortality compared to the rest of the UK (rUK).
We believe that migration can contribute to addressing some of the problems associated with demographic challenges, but only ever as part of a much wider strategy. Inward migration is not well-suited as a policy lever for addressing broad demographic challenges like rising dependency ratios or ageing populations, hence we do not support regionalising the immigration system on this basis. Where we believe inward migration could prove a more effective tool is in the specific case of rural depopulation and its symptoms. Further evidence on the efficacy of rural visas as a policy tool in the UK is needed, and on this basis the MAC continues to support a UK-wide rural visa pilot.
Patterns of geographic migration over time
The policy landscape of migration has changed dramatically since the turn of the millennium, with changes such as the 2004 European Union (EU) expansion into former Eastern Bloc countries, the ending of FoM to the UK, and the global COVID-19 pandemic. This section provides an overview of the numbers and patterns of geographic distribution of migrants in the UK over this period.
How many migrants are there in the UK?
Prior to the adoption of the Future Borders and Immigration System, migrants from outside of the EU needed to obtain a visa to come to live and work in the UK, whilst those from the EU could enter under FoM – as outlined in more detail in Chapter 2.
Figure 3.1 and Table 3.2 below provide an overview of migrant proportions (relative to the UK’s usual resident population) and numbers over time. To note, Table 3.2, which compares census data over time, includes figures for Scotland taken from the 2019 Annual Population Survey (APS), as more recent census data are not yet available. Though more recent APS data are available, 2019 data has been chosen as it provides the most robust methodology due to methodological changes forced by the COVID-19 pandemic. Direct comparisons between the two data sources, particularly where sample sizes are small and which may have proportionally larger confidence intervals, should therefore be treated with caution.
Overall numbers of migrants (as defined by country of birth) increased throughout the period. While non-EU migrants formed the majority of migrants, the EU proportion rose steadily through the period (from 16% in England & Wales in 2001 to 34% in 2021), in part as the membership of the EU expanded during the time period – with FoM becoming available for more people. For example, APS figures show that there were just under 170,000 ‘EU8’ born nationals living in the UK in 2004, rising to around 1.3 million in 2019. A finer geographic breakdown of migration is shown in Table 3.3 below.
Figure 3.1: Proportion of non-UK born population, UK and four nations, 2004-2019
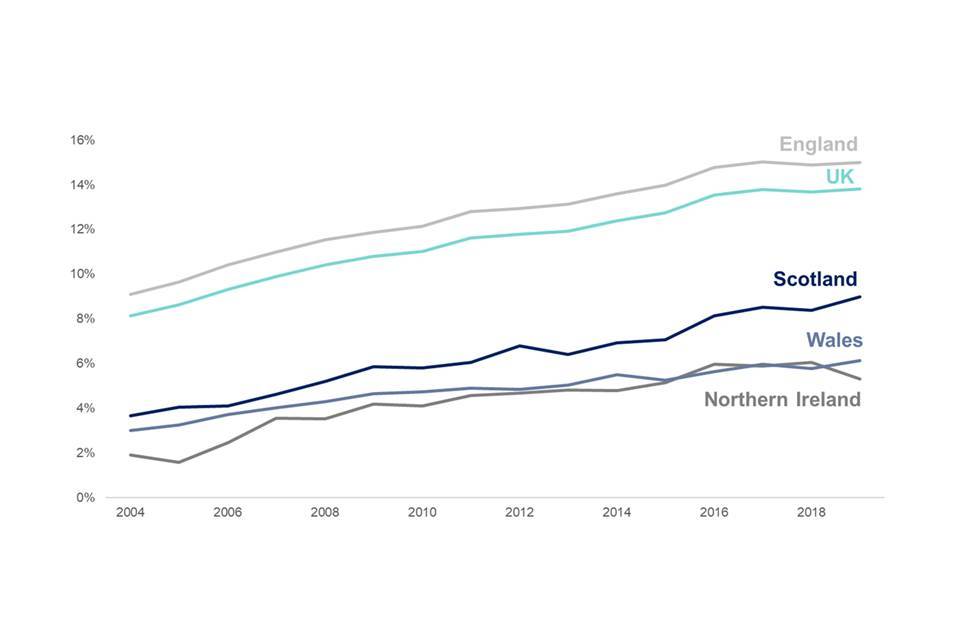
Source: APS 2004-2019.
Note: Figures exclude Republic of Ireland nationals. Figures are based on country of birth, not nationality.
Table 3.2: Migrants numbers and proportions, UK and four nations, 2011-2021
|
Population (millions) |
As proportion of usual resident population of the UK |
||||||
|---|---|---|---|---|---|---|---|
|
Area of birth |
Area migrated to |
2001 census |
2011 census |
2021 census/ 2019 APS* |
2001 census |
2011 census |
2021 census/ 2019 APS* |
|
EU |
England |
0.7 |
2.0 |
3.2 |
1.3% |
3.7% |
5.4% |
|
Northern Ireland |
<0.1 |
<0.1 |
0.1 |
0.6% |
2.5% |
3.5% |
|
|
Scotland |
<0.1 |
0.1 |
0.2 |
0.9% |
2.6% |
4.0% |
|
|
Wales |
<0.1 |
0.1 |
0.1 |
0.7% |
1.8% |
2.6% |
|
|
All UK |
0.7 |
2.2 |
3.6 |
1.3% |
3.5% |
5.4% |
|
|
Non-EU |
England |
3.4 |
4.9 |
6.3 |
6.9% |
9.3% |
10.5% |
|
Northern Ireland |
<0.1 |
<0.1 |
0.1 |
1.2% |
2.0% |
3.0% |
|
|
Scotland |
0.1 |
0.2 |
0.3 |
2.5% |
4.0% |
5.0% |
|
|
Wales |
0.1 |
0.1 |
0.1 |
1.9% |
3.2% |
4.0% |
|
|
All UK |
3.6 |
5.3 |
6.7 |
6.1% |
8.4% |
10.0% |
|
|
Total non-UK born |
England |
4.1 |
6.9 |
9.5 |
8.3% |
13.0% |
15.9% |
|
Northern Ireland |
<0.1 |
0.1 |
0.1 |
1.8% |
4.5% |
6.5% |
|
|
Scotland |
0.2 |
0.3 |
0.5 |
3.4% |
6.6% |
9.0% |
|
|
Wales |
0.1 |
0.2 |
0.2 |
2.7% |
5.0% |
6.6% |
|
|
All UK |
4.3 |
7.5 |
10.3 |
7.4% |
11.9% |
15.4% |
Source: APS 2019, Census 2001, 2011, 2021.
Note: *2021 figures for Scotland are based on the 2019 APS as more recent census outputs are not available for Scotland at time of publication. EU and non-UK figures exclude Republic of Ireland nationals. Figures are based on country of birth, not nationality. ‘All UK’ census figures are calculated by totalling the 3 censuses across the UK – The England & Wales census, the NI census and the Scottish Census, with APS substituted for the Scottish Census in 2021.
Where are migrants based?
Across the UK, some areas and nations have had higher proportions of migration than others. Table 3.3 shows the proportions of migrants relative to the population of each nation or region of the UK. London has a significantly higher share of both EU and non-EU migrants (as a proportion of the usual resident population), both more than double the UK average.
Table 3.3: Proportion of migrants, UK nations and regions, 2021
|
EU (%) |
Non-EU (%) |
Total Non-UK (%) |
|
|---|---|---|---|
|
East Midlands |
5.4 |
8.0 |
13.3 |
|
East of England |
6.0 |
8.3 |
14.3 |
|
London |
11.7 |
27.9 |
39.5 |
|
North East |
2.1 |
4.4 |
6.6 |
|
North West |
3.6 |
7.5 |
11.1 |
|
South East |
5.5 |
9.7 |
15.2 |
|
South West |
4.3 |
5.6 |
9.8 |
|
West Midlands |
4.5 |
10.1 |
14.7 |
|
Yorkshire and The Humber |
4.1 |
7.0 |
11.1 |
|
England - all regions |
5.4 |
10.5 |
15.9 |
|
Northern Ireland |
3.5 |
3.0 |
6.5 |
|
Scotland |
4.0 |
5.0 |
9.0 |
|
Wales |
2.6 |
4.0 |
6.6 |
|
UK total |
5.4 |
10.0 |
15.4 |
Source: APS 2019, Census 2021.
Note: Figures for Scotland are based on the 2019 APS as more recent census outputs are not available for Scotland at time of publication. EU and non-UK figures exclude Republic of Ireland nationals. Figures are based on country of birth, not nationality. ‘UK total’ census figures are calculated by totalling the 2021 England & Wales census, and the 2021 NI census, with APS substituted for the Scottish Census in 2021.
Further variation can be seen within each of these areas with a key distinction between rural and urban areas. Figure 3.4 below shows that non-EEA migrants make up a greater share of the population compared to EEA migrants in all urban areas, but this difference is smaller in rural areas, and in a few rural areas data suggests there are marginally more EEA migrants than non-EEA migrants. Similarly, local authority data suggests that foreign-born residents in rural areas are more likely to be from EU countries. Figure 3.4 also highlights the high proportion of non-UK born residents in London. Differences between rural and urban areas are discussed in further detail with reference to Certificate of Sponsorship (CoS) data later in the chapter.
Figure 3.4: Proportion of non-UK born population, rural and urban regions, 2017-2019

Source: APS 2017-2019.
Note: Data not available for NI.
How is the immigration system used across the UK?
This section examines the SW, student, and asylum routes to identify and explain potential geographic variation in their use.
Skilled Worker route
Table 3.5 breaks down each nation or region’s share of visa applications and employment in eligible occupations for the SW route. It shows that London accounts for a far greater share of visa applications than it does employment, while some nations and regions – notably Scotland, NI, and the North East – account for significantly less.
Table 3.5: Distribution of visa applications and employees, UK nations and regions
|
Nation/region |
Share of SW visa applications (%) |
Share of eligible employment (%) |
Odds ratio (relative to London) |
|---|---|---|---|
|
East Midlands |
5 |
6 |
0.38 |
|
East of England |
9 |
9 |
0.49 |
|
London |
34 |
16 |
(1.00) |
|
North East |
2 |
3 |
0.23 |
|
North West |
7 |
10 |
0.34 |
|
South East |
16 |
16 |
0.46 |
|
South West |
7 |
8 |
0.38 |
|
West Midlands |
7 |
8 |
0.45 |
|
Yorkshire and The Humber |
5 |
7 |
0.30 |
|
Scotland |
4 |
8 |
0.22 |
|
Wales |
2 |
4 |
0.23 |
|
Northern Ireland |
2 |
3 |
0.26 |
Source: Home Office management information January 2021-September 2022, ASHE 2021.
Notes: 1) Used Certificates of Sponsorship (CoS). CoS is assigned to a migrant by their sponsoring employer and the migrant can then use the certificate number to make a visa application. 2) New hires and graduate CoS only. 3) Observations with missing information, without positive salaries, below 18 years old (16 years old in ASHE), in their job for less than a year and not on adult rates excluded. 4) Eligible employment defined as employment in occupations eligible for the SW route.
Here the odds ratio is the ratio of a nation or region’s share of visa applications to its share of the Regulated Qualification Framework (RQF) 3+ employment compared to that of London. While London accounts for around twice the share of SW visa applications than it does eligible employment, Scotland accounts for around half its share of eligible employment – and so has an odds ratio close to 0.25. These findings broadly resemble those from the MAC’s 2019 Review of the SOL for the Tier 2 (General) route, suggesting migrants on the SW route are still significantly more likely to locate in London than anywhere else. Excluding the health and social care sector, these odds ratios would be lower still: the sector accounts for 30% of visas in London, and more than 60% outside of London.
We have repeated the exercise from 2019 using the latest available data for the SW route in Figure 3.6 to control for observable factors that might explain the regional pattern in SW route use.
Figure 3.6: Modelled odds ratios for being a SW route migrant compared to London
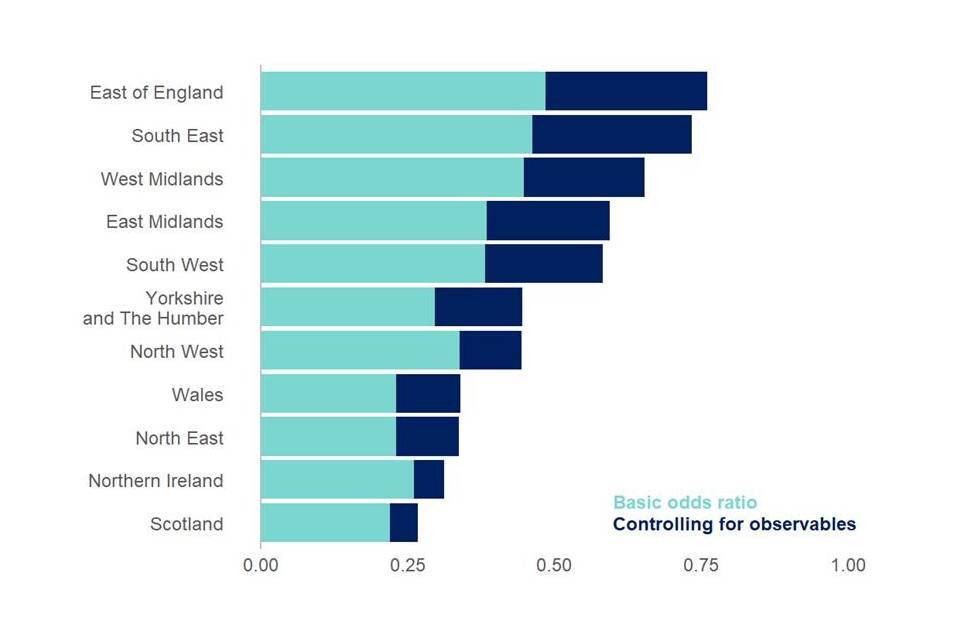
Source: Home Office management information January 2021-September 2022, ASHE 2021.
Notes: 1) Used CoS. CoS is assigned to a migrant by their sponsoring employer and the migrant can then use the certificate number to make a visa application. 2) New hires and graduate CoS only. 3) Observations with missing information, without positive salaries, below 18 years old (16 years old in ASHE), in their job for less than a year and not on adult rates excluded. The controls used included ln(salary), ln(salary)2, gender and indicators for age categories, employer size (by number of employees), industry and full-time work. Odds ratios calculated using a logistic regression with ASHE sampling weights. All regional coefficients were statistically significant at the 5% level or lower.
The turquoise bars show the odds ratios from Table 3.5 above. For all regions the ratio is less than 1, indicating that nowhere in the UK makes greater use of the system than London. There is significant regional variation: SW route migrants are about half as likely to locate in the East of England compared to London, and 20% as likely to locate in Scotland as in London.
The dark blue bars show how much of this difference can be explained by controlling for the regional distribution of sectors, large employers, pay and other observable factors. On average, these factors explain 24% of the remaining difference to London, again with significant variation – controls explain more than half the remaining difference in the East of England compared to just 6% in Scotland. In other words, most of the difference in the regional distribution of SW route use is not explained by observable characteristics.
This regional pattern in work migration to the UK is not new and is to some degree structural. Table 3.7 compares each nation/region’s share of visa applications for the SW route to its share of arrivals from EEA and non-EEA countries in eligible employment for the SW route prior to the ending of FoM.
Table 3.7: Comparison of visa applications and EEA and non-EEA arrivals under FoM
|
SW route |
RQF 3+ employment |
RQF 1-2 employment |
||
|---|---|---|---|---|
|
Nation/region |
Share of visa applications (%) |
Share of EEA arrivals 2015-2019 (%) |
Share of non-EEA arrivals 2015-2019 (%) |
Share of EEA arrivals 2015-2019 (%) |
|
East Midlands |
5 |
4 |
4 |
11 |
|
East of England |
9 |
8 |
7 |
10 |
|
London |
34 |
41 |
46 |
22 |
|
North East |
2 |
2 |
1 |
1 |
|
North West |
7 |
5 |
6 |
9 |
|
South East |
16 |
12 |
14 |
9 |
|
South West |
7 |
7 |
5 |
6 |
|
West Midlands |
7 |
9 |
6 |
11 |
|
Yorkshire and The Humber |
5 |
3 |
3 |
8 |
|
Scotland |
4 |
6 |
5 |
7 |
|
Wales |
2 |
2 |
1 |
2 |
|
Northern Ireland |
2 |
2 |
1 |
2 |
Source: Home Office management information January 2021-September 2022, pooled APS 2017-2019.
Notes: 1) Used CoS. CoS is assigned to a migrant by their sponsoring employer and the migrant can then use the certificate number to make a visa application. 2) New hires and graduate CoS only. 3) ‘Recent arrivals’ counted as individuals who were in employment in an eligible occupation for the SW route and whose stated year of arrival was 2015 or later.
Table 3.7 shows that, looking at RQF 3+ employment, the geographic distribution of migrants under the SW route, FoM, and the Tier 2 (General) route are very similar. If anything, the SW route appears less concentrated around London compared to past flows of migrants. Among RQF 1-2 occupations, the concentration of EEA migrant inflows to London under FoM was less pronounced, though London still accounted for twice the share of any other region. This suggests that the geographic pattern of migration into the UK has longer-term foundations.
There are several factors which might explain why London, and to a lesser extent the East of England and South East, appear to use the SW route more than predicted by their share of employment, while the North East, Wales, NI and particularly Scotland use the system less than predicted:
-
Awareness: prospective migrants will not be equally aware of all parts of the UK and their associated labour market opportunities, nor will they consider all parts to have equal appeal. Likewise, more globally minded employers may be less likely to identify regions which experience lower migration as prospective bases;
-
Migrant networks: historic waves of immigration may influence future immigration. The development of a diaspora in a region can encourage additional migration (e.g., of dependants) or influence the choices of prospective migrants (e.g., through their networks and familiarity with a community). Regions which have experienced comparatively less immigration in the past may therefore not experience these network effects;
-
Rural and remote areas: some of the UK’s most remote and rural areas are found in Wales and Scotland. Labour markets in remote and rural areas tend to be much thinner, offer fewer opportunities to prospective migrants and can be more difficult to initially navigate. However, including an indicator for rural areas and sparseness or remoteness for England and Wales and Scotland in the analysis appears to have only a small marginal effect.
None of these factors is likely to be the sole driver of regional differences in use of the SW route. It is worth noting that internal migration follows a similar pattern, with research suggesting that flows of those with similar characteristics to SW route migrants (i.e., young and highly educated) are also skewed towards London. While there is some evidence that as people grow older they are more likely to move away from London, at least towards the East of England and South East, the data does not allow us to observe this trend for SW route migrants (e.g., upon acquiring settlement); and the overall stock of migrants in the UK is concentrated in London. Structural factors may drive both internal and international migration to London.
Whilst the analysis above accounts for how the regional salary distribution influences migrants’ location, it does not break down the salary distribution in itself. Salary requirements – both the general threshold and occupation-specific going rates – are nationally determined and applied on the SW route. Figure 3.8 shows the proportion of SW visas with pay within 2% of the minimum requirement (i.e., the higher of the general threshold and going rate, net of any discounts), excluding occupations with national pay scales. Figure 3.9 compares median pay on the SW route by nation/region to predicted median labour market pay, based on reweighting the Annual Survey of Hours and Earnings (ASHE) according to the distribution of occupations by region on the SW route (again excluding occupations with national pay scales).
Figure 3.8: Share of SW visas within 2% of the minimum salary requirement
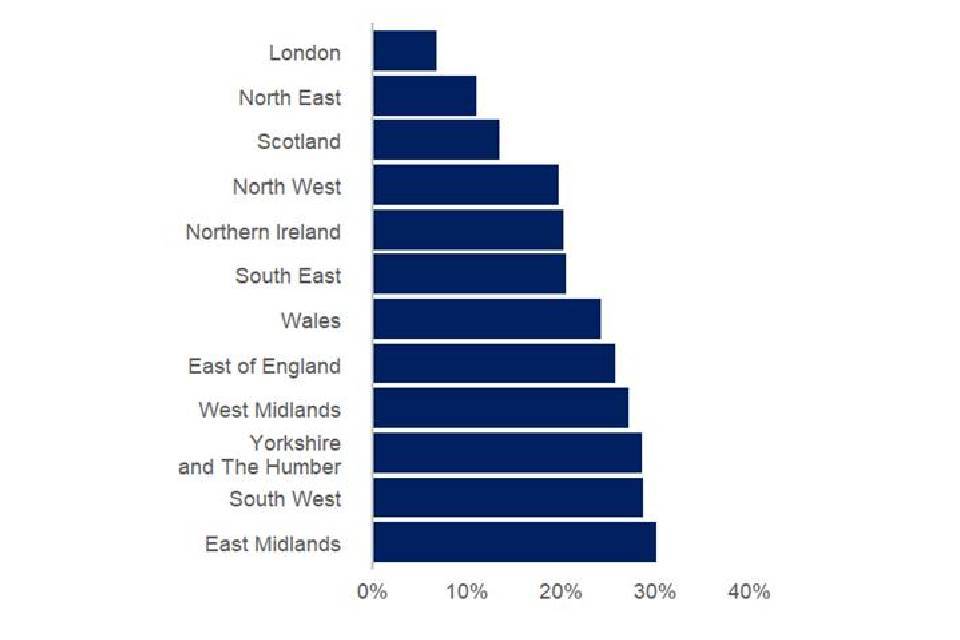
Source: Home Office management information January 2021-September 2022.
Notes: 1) Used CoS. CoS is assigned to a migrant by their sponsoring employer and the migrant can then use the certificate number to make a visa application. 2) New hires and graduate CoS only. 3) Observations with implausible salaries, salaries which do not correspond with the minimum requirement, with national pay scales and below 18 years old excluded. 4) ‘Minimum salary requirement’ defined as the higher of the general threshold and the occupational going rate pro-rated for an individual’s working hours, net of any discounts for new entrants, shortage occupations, STEM and PhDs.
Figure 3.9: Comparison of SW route and predicted labour market median pay
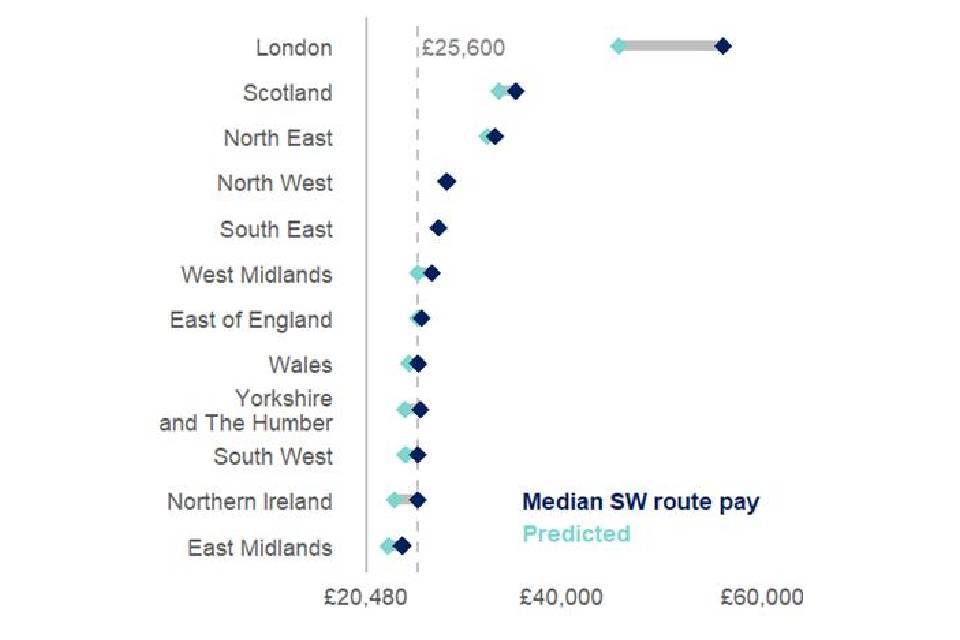
Source: Home Office management information January 2021-September 2022, ASHE 2021.
Notes: 1) Used CoS. CoS is assigned to a migrant by their sponsoring employer and the migrant can then use the certificate number to make a visa application. 2) New hires and graduate CoS only. 3) Observations with missing information, without positive salaries, below 18 years old (16 years old in ASHE), in their job for less than a year, not on adult rates excluded and in occupations with national pay scales excluded.
There is evidence of bunching around the SW route’s minimum pay requirements, suggesting that salary thresholds do matter for pay. However, while this varies significantly between regions, the bunching is not greatest in the regions with lowest pay levels. For example, there is less bunching around the threshold in the North East and NI, which are the parts of the UK with lowest average pay. But it should be noted that we only observe those who have successfully – and affordably – applied for a visa.
Figure 3.9 shows that outside of London, median pay on the SW route is slightly greater than the labour market prediction, given that SW route pay must sit at a minimum at the 25th percentile of the distribution. In London, median SW route pay is 23% higher than the labour market prediction, suggesting that migrants are paid well above the regional labour market rate.
Altogether, this suggests that pay on the SW route largely mirrors the prevailing labour market distribution, with higher SW route salaries broadly tracking regional differences. There is little evidence that national salary thresholds facilitate widespread undercutting in any region of the UK (although we do not observe those ‘priced out’ of a visa by the salary requirements). Pay on the SW route in London appears to be systematically different – and higher – than elsewhere, both in terms of levels and in comparison to requirements for the SW route and the regional labour market. We return to salary thresholds for the SW route when we consider policy implications at the end of this chapter.
Student Route
As outlined in Chapter 2, a significant portion of migrant inflows to the UK are students from abroad coming to study at Higher Education Institutions (HEIs). Under FoM, students from EU countries did not require a visa to study in the UK. Now prospective students from both EU and non-EU countries require a visa.
Figure 3.10 sets out the regional distribution of non-UK domiciled students in the 2019-20 academic year, based on data collected by the Higher Education Statistics Authority (HESA). Within a given region, students are likely to be clustered around large universities. These are shown as points on the map.
Figure 3.10: Distribution of non-UK domiciled students, 2019-20
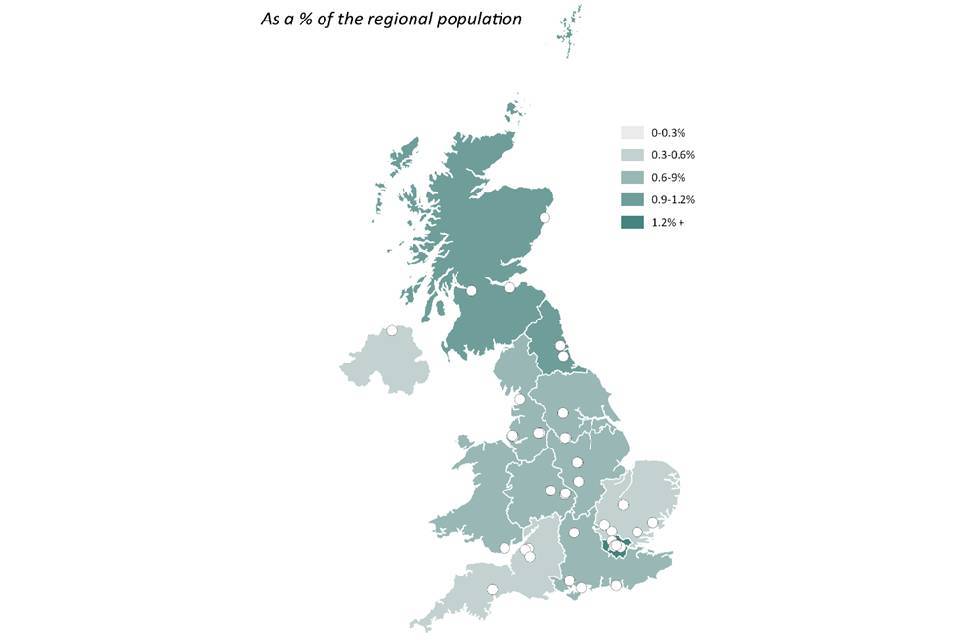
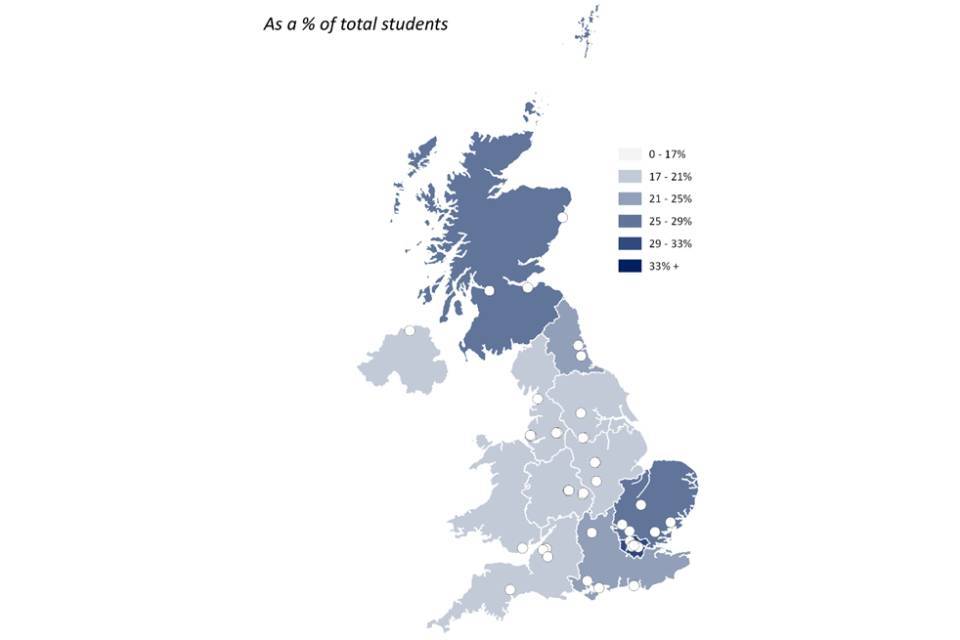
Source: HESA, 2019-20 academic year.
Notes: includes all course types and full-time and part-time students. Large institutions shown as points on the map defined as those with more than 5,000 non-UK domiciled students or more than 25,000 students in total.
Non-UK domiciled students make up a small share of the total population – no more than 1% with the exceptions of London and Scotland. These proportions have been relatively stable since 2014-15, with noticeable growth only in London, from 1.2% to 1.6%.
In general, 20% of students in UK HEIs come from abroad, with variation across the nations and regions. This proportion rises to around 35% in London, is closer to 15% in Wales and NI, and is much higher among postgraduates. International students are less concentrated than migrants overall: London accounts for 26% of all non-UK domiciled students, significantly more than its share of UK students, but less than its share of all migrants. Scotland, Wales and the North East in particular account for a greater share of international students than migrants overall.
The MAC’s 2018 International Students Report highlighted the economic benefits international students provide – to local economies, to the public finances and in cross-subsiding research and the education of domestic students. International students make up a greater share of the total than in 2014-15 everywhere except Wales. But global competition for international students has intensified and analysis by the Migration Observatory suggests that applications for undergraduate study from the EU have fallen by around 50% from 2020 to 2022 – while applications from outside the EU have risen, suggesting that Brexit and the associated rise in fees for EU students is likely to have played a role in this decline. It remains to be seen how these trends will affect the UK higher education sector, both at UK-level and across the nations and regions.
Asylum Seekers and Refugee resettlement
Figure 3.11 below shows the distribution of asylum seekers and refugee resettlement per 10,000 residents across the nations and regions. The North West is the region with the highest number of asylum seekers and Scotland is the region with the highest number of resettled refugees per 10,000 resident population. A substantial proportion of local authorities in England has no resettled refugees.
Local authority participation in refugee resettlement programmes is voluntary, however for local authorities to commit to taking resettled refugees they must confirm that they have sufficient capacity. Capacity considers the available housing, education, and health services in the area. As well as issues of capacity, some local authorities may choose not to take resettled refugees for political reasons.
The data, such as those presented in Figure 3.11, show that some local authorities and regions are providing more than their proportionate share of support for the asylum system while others are providing less than their share.
Figure 3.11: Asylum applicants as of 31st December 2019 and Refugee resettlement per 10,000 by nation/region 2014-2019

Source: Home Office Immigration statistics Asylum and Resettlement, Section 95 support by local authority (Asy_D11) and Resettlement by Local Authority (Res_D01), ONS Census 2021 Resident Population by Local Authorities in England and Wales (P01), National Records of Scotland Mid-Year Population Estimates 2021 and Northern Ireland Statistics and Research Agency Mid-2020 Population Estimates.
Note: Asylum Seekers refer to those on either Section 4 or Section 95 support in dispersed accommodation.
A population-based approach to migration
Immigration is a reserved policy matter for the UK Government and the current immigration system is designed and operated at UK-level, with no distinction between those wishing to locate in any nation or region of the country. However, the Devolved Administrations suggest that there are distinct demographic and economic needs in the constituent nations of the UK which they claim warrant a more regionalised immigration system.
This section provides an overview of the latest available National Population Projections (NPPs) to highlight different demographic circumstances across the UK. We then consider the role that migration can play in addressing demographic challenges and what implications, if any, this might have for the immigration system.
Population projections across the UK
The Office for National Statistics (ONS) 2020-based NPPs apply assumptions about the future levels of fertility, mortality, and migration to the latest mid-year population estimates to project future population levels – including changes to the ‘natural’ and ‘total’ population. Natural population change is determined by subtracting deaths from births to establish whether the population is growing or declining. Total population change accounts for the impact of net migration (immigration minus emigration) on natural population change, adding positive net migration or subtracting negative net migration to establish a total figure.
Each assumption uses long-term historical trends to identify plausible future scenarios. The assumptions applied to the latest NPPs have revised down birth rates and revised up mortality rates from the 2018-based assumptions, resulting in a lower projected population growth rate of 5.8% for the UK to mid-2045 – compared to the projected 9% growth in the 2018-based projections. For context, the EU27 population is projected to decline by 0.7% over the same period.
The UK and all its constituent nations are projected to experience natural population decline to mid-2045. However, Figure 3.12 shows that 3 of the constituent nations’ total populations are projected to grow – due to positive net migration. Scotland is the only nation where the total population is projected to decline to mid-2045, primarily because it has lower fertility rates and life expectancy than rUK – trends which are projected to continue. While there are no subnational 2020-based projections available, the 2018-based projections indicated that all English regions would grow, with rates varying between 4.1% (North East) and 14.3% (East Midlands) to mid-2043. We can assume these figures would be revised down using 2020-based assumptions, but they would all still be projected to grow.
Figure 3.12: Mid-year estimated and projected population levels, UK and four nations, 2010-2045 (2010 base = 100)

Source: 2020 mid-year population estimates; 2020-based interim national population projections.
Notes: 2020-based NPPs are interim and thus only provide a principal projection for the UK and the four nations. There are no variant projections based on different assumptions (e.g. high/low migration scenarios) or subnational projections.
Net migration — immigration minus emigration — gives an indication of the overall scale of long-term migration and its contribution to population growth. Net international migration and net cross-border migration make up the migration assumptions used in the NPPs.
Net international migration covers the flows of people between one UK nation and non-UK countries. The International Passenger Survey indicates that, over the last 25 years, the UK experienced positive net international migration (immigration was higher than emigration), with only Scotland in 2002, and Wales in 2011, experiencing negative net migration.
Net cross-border migration covers flows of people between one constituent nation of the UK and rUK. Scotland is projected to be the main beneficiary of cross-border migration in the UK to 2045, gaining approximately 9,000 people each year from rUK. Wales is also projected to continue as a net beneficiary of cross-border flows (+8,000 per year), while NI is projected to broadly ‘break even’ – gaining or losing 300-400 people each year. As by far the biggest constituent nation in population size, more people leave England each year than move from rUK to live there. However, the ‘cross-border rate’ shows that, per 1,000 people in the population, far more people leave the other constituent nations to move to England. These broad trends are projected to continue until the end of the 2030s.
Age Composition
In addition to projections for natural and total population change, the underlying changes in the age composition of a population can help gauge expected demand for public services from the non-Working-Age Population (WAP) and the tax received from the WAP to pay for them. The ‘dependency ratio’ is a useful, but limited, way of presenting this balance by comparing the non-WAP against the WAP. The higher a dependency ratio, the more challenging it is for a government to pay for public services, pensions, and other benefits for the non-WAP using the taxes paid by a relatively smaller WAP. As shown in Figure 3.13, dependency ratios for the UK and its 4 constituent nations have followed a very similar trend over the last 10 years and are projected to continue broadly mirroring each other in the years ahead to 2045 – a significant drop to 2028, a gradual increase roughly reaching 2020 levels around 2042, before dropping just below 2020 levels again by 2045.
Figure 3.13: Estimated and projected dependants per 1,000 people of working age, UK and four nations, 2010-2045
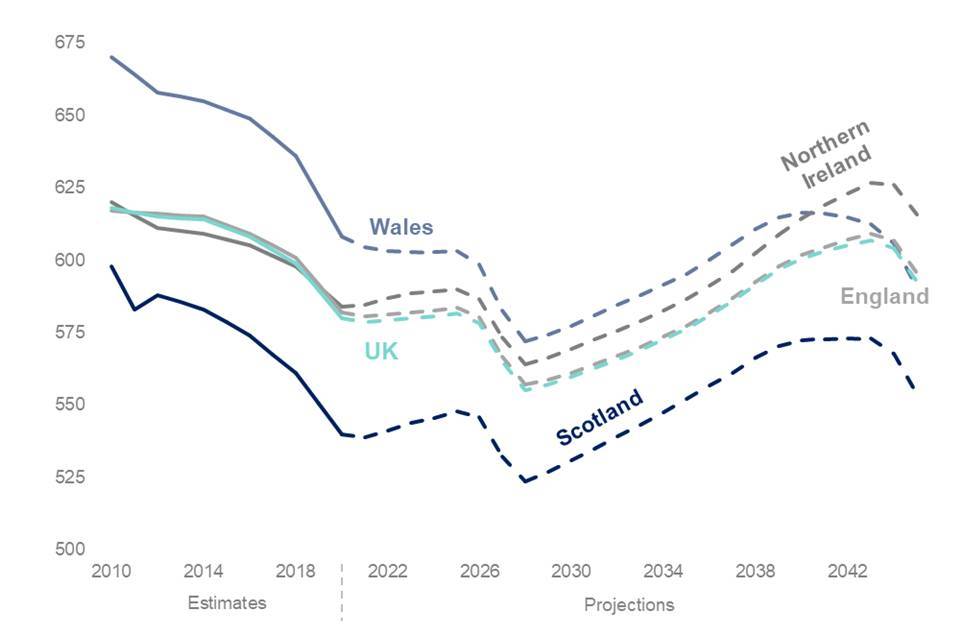
Source: 2020-based interim national population projections.
The populations of all constituent nations are projected to continue ageing to mid-2045, with the median age of the UK population increasing from just over 40 to just over 44. As shown in Figure 3.14, this is due to declining proportions of the youth population (0-15) and a growing ‘old age’ or pensionable population (65+). Scotland’s relatively lower dependency ratio could be seen positively from a fiscal perspective, but it is driven by having the lowest proportion of young people (0-15), which balances out its higher ‘old-age dependency ratio’. Wales’s currently higher-than-average dependency ratio is projected to fall to the level of the UK average by 2045 as its pensionable population grows at a slower rate.
Figure 3.14: Estimated and projected age composition (%) of population, UK and four nations, 2020 & 2045
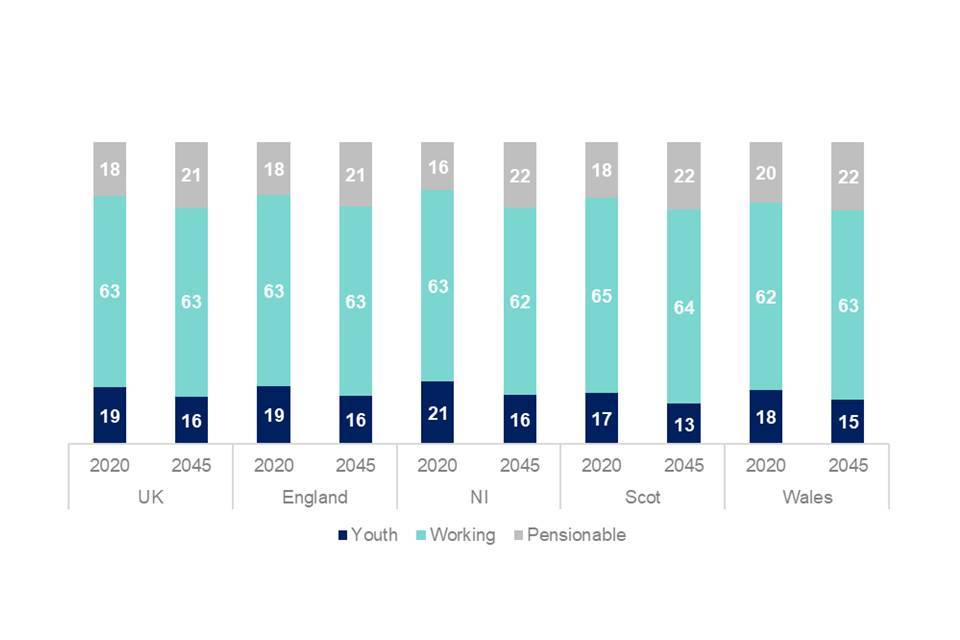
Source: 2020-based interim national population projections.
Based on these projections, Scotland occupies a unique demographic position within the UK. In the last decade, Scotland has experienced positive net migration from overseas and rUK. This trend is projected to continue to mid-2045, with an average gain of 9,000 people from positive net cross-border migration and an additional 10,000 people from positive net international migration. These rates of migration would amount to 8.7% of Scotland’s total population, above the UK average of 7.7%. However, this is not projected to fully mitigate for its starker natural population decline relative to rUK. These projections are consistent with long-term historical trends which show Scotland has experienced higher mortality rates at all but the very youngest ages, compared with the UK.
Addressing demographic challenges through migration
Varying population projections for the constituent nations of the UK raise a question about the role migration can play when policymakers are seeking to address problems that come from a) broad demographic challenges, such as ageing or dependency ratios; and b) more specific problems, such as rural depopulation.
While we consider this question in each case below, in both instances migration can only ever be part of a comprehensive strategy that addresses the drivers of demographic challenges.
Broad demographic challenges
There is no ‘optimal’ population size or density economically, but population decline or rapid population growth can create problems for communities and policymakers. Rising dependency ratios pose a fiscal problem: how to pay for the public services, pensions, and other benefits for the non-WAP using the taxes paid by the WAP. While it may be possible to arrest rising dependency ratios with inward migration, assuming migrants stay in UK they would also require these services and support as they aged. In seeking to address the fiscal problem that dependency ratios pose, what matters is not just the total number of people we add to the WAP but their contributions to productivity and their net fiscal contributions. These contributions will be higher for high-skilled and high-paid workers.
Migration can contribute to addressing demographic challenges, but, as the Scottish Government’s Expert Advisory Group on Migration and Population (EAGMP) also note, using migration to eliminate increases in dependency ratios or bring down the median age of the population are not sensible goals due to the large and likely unfeasible scale of migration required. Regionalising the immigration system to this end seems a disproportionate measure when one compares the large administrative burden it would impose against the relatively minor impact it would have on broad demographic challenges.
Rural depopulation
The challenges posed by rural depopulation arise when local areas no longer have a sufficient population to sustain private and public sector amenities, such as schools or shops. Beyond negative impacts for the immediately affected rural communities, rural depopulation can lead to problems at a regional and national level. The lack of a local population to provide adequate labour supply can impact regional and national food supply chains dependent on rural communities and infrastructure; it can also contribute to the decline of industries which make up large proportions of rural economies, such as fishing, agriculture, and hospitality.
The MAC has previously recommended a rural visa pilot with a view to fully evaluating the impact that such a route could have in negating some of the problems caused by rural depopulation.
As we have highlighted previously, Australia and Canada both have regional dimensions to their immigration systems which reduce the stringency of general work route eligibility requirements for migrants if they locate in rural or remote areas. While New Zealand does not have a dedicated visa route for migrants locating in rural or ‘non-traditional’ destinations like urban centres, they allocate additional points if a migrant is willing to locate in these areas.
Evidence from Canada via the Provincial Nominee Program (PNP) suggests that the more remote a geographic area, the lower the rate of retention. However, having designed an Atlantic Immigration Pilot (AIP) to address the poorer retention of migrants along Canada’s Atlantic coast, the Canadian Government converted this pilot into a permanent visa route for skilled migrants. This decision was based on an evaluation in 2020 which found the pilot improved the retention of migrants in rural and remote areas. The evaluation found that 94% of AIP migrants stayed in their designated geographic areas after their first year, compared to 86% for principal applicants to the PNP. The retention rate dropped to 78% for the AIP after 2 years, compared to 75% for the PNP.
However, the evidence for the efficacy of rural visas in countries of the UK’s geographic scale is limited. The differences in both geographic location and scale between the UK and Canada, Australia, or New Zealand mean we are cautious in applying lessons from these schemes to the domestic context.
The MAC’s key concern is the efficacy of any rural visa, primarily the ability to incentivise migrants to remain located in rural areas after the visa requirements to do so lapse. Migrants moving to rural areas would be subject to the same factors driving non-migrant populations to relocate, such as inadequate health services, housing, a broader lack of investment and training, or economic opportunities for young people. If a pilot evaluation found that migrants moved elsewhere after the residency conditions of their visa lapsed, this would suggest that migration was, at best, a short-term solution to rural depopulation that would require an unsustainable flow of inward migration to these areas. We do not currently have sufficient evidence on migrant retention in rural areas and a fully evaluated pilot would help to build this evidence base.
Such an approach would be in keeping with the Government’s levelling up agenda, utilising the immigration system to address some of the negative impacts of rural depopulation, including the inability to sustain local public services and key industries that play important regional and national roles in our economy.
Policy options
A regionalised immigration system
We are satisfied that the geographic patterns of usage in the SW route are not substantively driven by the design of the current immigration system, but instead by local labour market conditions and patterns of immigration to the UK which have existed for significantly longer than this system has been in place.
There are persistent differences in geographic patterns of immigration, with migrants more concentrated in London than would be predicted based on employment, the economy, and demography, and much less concentrated in Scotland in particular. By highlighting similar trends for both the previous Tier 2 (General) route and for migrants locating in the UK under FoM, we have shown that these differences predate the SW route and are not limited to work migration – although Scotland is notably better represented in student migration.
As well as labour market conditions, these differences in patterns of migration are likely driven by structural factors, including London’s unique features (reputation as a global city, demography, self-selection of employers and migrants), existing diasporas, and the distribution of rural and remote regions.
In as much as some regions using the SW route more than others is deemed a problem which requires solutions, regional salary thresholds are often posited as a policy tool that could result in more evenly balanced visa usage across the UK. The MAC has previously opposed regional salary thresholds and our analysis in this chapter gives us no reason to think they would significantly alter these geographic patterns.
The current salary thresholds and occupation-specific going rates for the SW route are both determined and applied UK-wide, with no adjustments for local labour market conditions. As outlined earlier in this chapter, labour markets across the UK see pay levels at least 20% lower than London. We acknowledge that the general salary threshold of £25,600 for the SW route falls at a different point in the income distribution for some geographic areas, with NI’s 2021 median full-time wage £24,000 and London’s £34,439.
Our analysis indicates that the SW route is not producing materially different labour market outcomes for different areas of the UK – except in London where migrants on the SW route are paid a premium, particularly in RQF 6+ occupations. We believe that the geographic patterns observed in SW route usage are driven by local labour markets and that the SW route (as the main work visa) is mirroring local conditions. We also see that bunching around the salary threshold is not necessarily more common in lower-pay regions. However, it is important to recognise that our SW analysis, by design, only includes successful visa applications and does not capture prospective migrants to a region in an eligible occupation who might be ‘priced out’ by the system. It is possible, for example, that if a lower salary threshold were applied in NI we might observe significantly more visas being issued if this is serving as a binding constraint. However, it is noticeable that NI is not one of the regions in which we observe the most bunching around the thresholds which we might expect if it were more a binding constraint.
We have opposed regional salary thresholds for 3 reasons, all of which remain relevant to the analysis in this chapter:
-
As evidenced in the MAC’s 2020 Points-Based System Report, salary differences within regions, driven by the local composition of skills, occupations, and sectors, are more salient than salary differences across regions. Regional thresholds would therefore only be effective if they were highly localised, something which would prove very difficult to maintain due to a lack of good quality data at a local level.
-
Having different salary thresholds for different parts of the UK would add complexity to an already complicated immigration system. It would create difficulties for employers who operate across multiple regions of the UK, potentially requiring them to monitor the physical location of their employees and report it to the Home Office to ensure compliance.
-
Insofar as inward migration impacts wages at all, regional salary thresholds would risk entrenching relatively lower pay in some areas of the UK compared to others. If the salary threshold for e.g. NI was adjusted downward, the threshold for e.g. London may need to be adjusted upwards. These adjustments would serve to institutionalise regional inequalities across the UK. This view is also in line with recommendations from the Low Pay Commission that has always recommended a UK-wide minimum wage.
A rural visa to address depopulation
Following research by its EAGMP, the Scottish Government developed a Rural Visa Pilot Proposal which was sent to the Home Office and the MAC in September of this year. We believe that this pilot proposal is sensible and clear in both scale and deliverability, and that the UK Government should consider what action would be required to take a pilot from proposal stage to implementation.
We believe that this pilot would be deliverable, but we have concerns about some details of the policy design. The proposed pilot visa would be more restrictive than a SW visa as it ties a migrant to one employer for their first year. This approach may make a rural visa more attractive for employers, but potentially at the expense of the migrant. As discussed in Chapter 1 of this report, tying a migrant to an employer heightens the risk of exploitation and is not a policy lever the MAC recommends. The freedom to move employer after 12 months may also prove difficult for migrants in practice due to thin labour markets in rural areas.
A rural visa would require relaxed SW route eligibility criteria to incentivise migrants to locate in designated areas. As set out earlier in this section, the MAC opposes regional salary thresholds and would prefer to explore the efficacy of lower skill-level requirements or lower visa fees for both employers and migrants as alternative ways of incentivising the use of a rural visa.
We are confident that such details could be agreed in a shared forum between the UK Government and Scottish Government with input from the MAC, the EAGMP, and local stakeholders. As noted by the Scottish Government, we expect this pilot would be of interest to rural communities across the UK – not just in Scotland – and any forum for design and implementation could be expanded accordingly.
Ultimately, we believe it is in the interest of the UK Government to pilot and evaluate a rural visa targeted at areas facing depopulation and that such a pilot would align with the Government’s commitment to level up all parts of the UK.
4: 2022 MAC Publications
We conducted a number of studies into various aspects of the UK immigration system during 2022, ranging from responses to formal Home Office commissions (including a review of the adult social care sector) to own-initiative reports and analysis commissioned by the Committee itself.
Adult social care
In April we published a Review of the Adult Social Care Sector, following the interim update provided in last year’s Annual Report. We made 19 recommendations relating to data, workforce strategy, pay and conditions and immigration policy for social care. These include a fully funded minimum rate of pay for care workers in England that is above the National Living Wage (NLW), where care is provided through public funds; removing the Immigration Skills Charge for Health and Care Worker (H&CW) visas and reviewing it across the wider Skilled Worker (SW) route; and for care workers to be made eligible for the H&CW visa permanently. We are very grateful for the support of the social care sector, the UK Government and Devolved Administrations and our expert advisory group in conducting this commission.
The crisis in social care has worsened since the report was published. Skills for Care estimate that there are around 70,000 more vacancies today than before the pandemic, an overall vacancy rate of 11.1%. The rate is higher still for care workers and registered nurses. At the same time, the cost of living crisis is particularly severe for social care workers, whose pay remains tied to insufficient government funding and for whom compensation for fuel costs was often already inadequate. Against this backdrop, the sector is a major user of the SW route. Care workers, who were made eligible for the H&CW visa in February following the MAC’s recommendation, and senior care workers accounted for nearly 20% of SW visa applications in 2022, and more than 60% of applications among occupations below Regulated Qualifications Framework (RQF) 6.
It should also be noted that in Wales the Welsh Government is currently working on a budget proposal to implement the latest real living wage rise of £10.90 for care workers; the Scottish Government will provide an update on their plans for social care pay in their 2023/24 budget statement, due 15 December.
We are very disappointed that the Government has not responded to any of our recommendations in the 8 months since receiving the report it commissioned from us. The conditions now faced by the social care sector are unsustainable. Persistent underfunding by successive governments underlies almost all the workforce problems in the sector. Higher pay at a premium to the NLW, which the Government is instrumental in setting, is a prerequisite to attracting and retaining workers. Despite calls from the Health and Social Care Select Committee, the Public Accounts Committee, the NHS Confederation, Care England and numerous other organisations alongside the MAC, the Government appears to have no ambitions to raise pay in a material and properly funded way. We look forward to seeing a full response from the Minister for Immigration and the Secretary of State for Health and Social Care as soon as possible.
Job postings analysis
In December 2022 we published a standalone publication exploring data from the jobs site Indeed. This dataset has been used in several MAC reports, including the 2021 Annual Report. This publication examines the data further to build the MAC’s evidence base and highlight areas where analysis may provide valuable insights in future. It also provides a cross-country comparison looking at the labour market changes seen in the UK compared to Germany, France, Italy, and Spain between 2019 and 2022.
Employer research
In March 2022 we published a report which explored the circumstances in which employers use migration as a response to skills shortages. We interviewed 28 employers in manufacturing, construction and information technology (IT) between November 2020 and May 2021. The interviews took place against the backdrop of both COVID-19 and the ending of Freedom of Movement (FoM) in December 2020, and these events had major impacts on the way businesses operated. The full report contains further details and the full findings, but the findings relating to COVID-19 and the end of FoM are summarised below.
The impacts of COVID-19 and the ending of FoM appeared to be interlinked, with each at various times either masking or exacerbating the impact of the other. COVID-19 was generally viewed by employers as a short-term threat which in the longer term would be overcome. For some employers, recruitment had drastically reduced due to international travel restrictions during the pandemic, which meant that it was difficult to hire workers from abroad. Many also said that existing workers from European Union (EU) countries had returned to their home countries to wait out the pandemic or to look after family, with these employers experiencing some uncertainty over whether staff would return.
For other employers COVID-19 presented an opportunity (or a short-term bonus) as they experienced an increase in the volume of applications for job vacancies for roles at lower RQF levels. They said that this was because of job losses in other areas such as hospitality, which increased the size of the pool of available candidates and meant that employers were able to fill positions more easily.
For others COVID-19 was described as a ‘game changer’, as employers rethought their ways of working. For example, some were setting up offices within EU countries to overcome some of the impacts of the ending of FoM, based on the ‘proof of concept’ COVID-19 had provided, which had showed that it was possible to work without being in the same location.
Although the ending of FoM in December 2020 had been known about and employers had been able to plan to reduce its impact, in many cases, this was viewed as more of an ongoing threat. Employers in manufacturing in particular had made considerable effort to encourage their employees to apply for the EU Settlement Scheme and had provided support to help them do this where necessary. Some employers said they had experienced the heaviest impacts in terms of staff losses earlier, at the time of the EU referendum vote in 2016.
For some small and medium sized businesses in manufacturing the process of exporting products had become complicated and expensive because of new legislation on the movement of goods. The full impacts of both COVID-19 and the ending of FoM were unknown at the time fieldwork was completed, but this will be explored in ongoing MAC research and analysis.
Many of these impacts are likely to be felt in the longer-term and therefore we will revisit this research by carrying out further interviews and site visits to get a fuller picture of the impacts of the ending of FoM and COVID-19.
Shortage Occupation List (SOL)
In August 2022 we received a formal Home Office commission to review the SOL. This review is currently on hold at the request of the Home Office pending clarification from the Government on migration policy. This may alter the specific details of the commission and we do not think it would be in the interest of stakeholders to begin a Call for Evidence that may not reflect the final parameters of the commission. We will continue to press the Government to reach a decision on this commission as soon as possible.
Corrections
The following corrections have been made to this report in January 2023.
Page 15: sentence deleted
Second paragraph on page included text reading ‘The Ukraine Extension Scheme may also increase the dependence of Seasonal Worker visa holders applying for the Ukraine Extension Scheme on their employers, as they cannot work outside the scheme or sector.’
This rule existed on the initial extension to the Seasonal Worker Visa, which allowed Ukrainian workers to extend their stay in the UK until December 2022. The Ukraine Extension Scheme does not restrict which employer individuals on the scheme can work for.
Page 39: sentence amended
The line beginning with “International students studying at degree level or above on the Student visa are permitted to work up to 20 hours during term time” has had the words ‘studying at degree level or above’ added.
The rules as stated only apply to students studying at degree level or above, if a student is studying below this level they will have different work rights applied, which was not clear from the initial wording.
Multiple pages: typos and formatting issues
Typos and formatting issues addressed for quality and consistency purposes.