Main findings: local authority and children’s homes in England inspections and outcomes autumn 2020
Updated 20 January 2021
Applies to England

© Crown copyright 2021
This publication is licensed under the terms of the Open Government Licence v3.0 except where otherwise stated. To view this licence, visit nationalarchives.gov.uk/doc/open-government-licence/version/3 or write to the Information Policy Team, The National Archives, Kew, London TW9 4DU, or email: psi@nationalarchives.gov.uk.
Where we have identified any third party copyright information you will need to obtain permission from the copyright holders concerned.
This publication is available at https://www.gov.uk/government/statistics/local-authority-and-childrens-homes-in-england-inspections-and-outcomes-autumn-2020/main-findings-local-authority-and-childrens-homes-in-england-inspections-and-outcomes-autumn-2020
Summary
This is the main findings report for the Local authority and children’s homes in England inspections and outcomes 2020 release. The following are also available:
- underlying data
- methodology
- pre-release access list
This release contains:
- the number of inspections and outcomes for local authority (LA) children’s services inspections as at 31 August 2020 and published by 30 September 2020 (final data)
- the number of inspections and outcomes of the most recent inspection, for all children’s homes, as at 31 August 2020 and published by 30 September 2020 (final data)
- the number of visits and subsequent activity for all children’s homes between 1 April 2020 and 31 August 2020, published by 30 September 2020 (provisional data)
lmpact of COVID-19 (coronavirus) on this release
Due to COVID-19, at the request of the Secretary of State, we suspended all routine inspections of social care providers on 17 March 2020. For more information, visit the Ofsted guidance and information relating to COVID-19 webpage.
We have not completed any routine inspections of social care providers or LAs since 17 March 2020. The national inspection grade profile for both providers and LAs has, therefore, not changed since the release of our Children’s social care data in England 2020 national statistics.
We have continued with monitoring visits and other regulatory work to ensure that children are safeguarded. Monitoring visits and regulatory activity in the period between April 1 and August 31 2020 are contained in this release. We will also cover these in Her Majesty’s Chief Inspector’s Annual Report 2020.
Due to COVID-19 and the suspension of routine inspection activity, we have inspected fewer providers and LAs than in a normal year.
Between 1 April 2020 and 31 August 2020, we did not inspect any LAs. However, one inspection from March was published in the time frame covered by this report so has been included in the underlying data.
We have visited 171 children’s homes since 1 April 2020.
Between 1 April 2020 and 31 August 2020, we carried out 255 monitoring visits to 171 children’s homes of all types. These homes represent 7% of all homes open as at 31 August 2020. Of these 171 homes, 12 had resigned by 31 August 2020, and 11 were suspended on 31 August 2020.
We registered 176 new children’s homes between 1 April and 31 August, the highest number recorded in that period.
Between 1 April 2020 and 31 August 2020, we registered 176 new children’s homes of all types. This follows a continued increase in registrations year on year since at least 2015.
Since 1 April, 13 new children’s homes have opened in London. This is the largest increase in this region and in this period in at least 10 years.
London has been the region with the fewest children’s homes for many years. Between 1 April 2020 and 31 August 2020, 13 new homes opened, higher than in the same period for at least 10 years. This was an increase of 11%, the highest percentage increase of any region. One of these homes was only opened temporarily to cover the additional demand due to COVID-19.
We have cancelled the registration of 1 children’s home since April 2020. Five other homes resigned after we issued a notice of cancellation.
The number of cancellations and resignations after a cancellation notice was similar to the number in recent years. As at 31 August 2020, 14 children’s homes were suspended. Eleven of these suspensions followed monitoring visits. Three were suspended after serious concerns about the provider. These 3 homes were all part of the same company.
Introduction
This release contains data on all children’s home inspections and visits and LA inspections. It supplements the Children’s social care data in England 2020 statistics, which cover all Ofsted inspections of social care providers. We publish these on an annual basis in July.
We inspect the 151 LAs in England responsible for ensuring and overseeing the effective delivery of social care services for children.
We carry out inspections of LA services for children who need help and protection, children in care and care leavers under the inspections of local authority children’s services (ILACS) framework.
We inspect children’s homes under the social care common inspection framework (SCCIF).
Since 1 September 2020, we have been visiting providers for assurance visits as part of a phased return to routine inspection. As these started after the period this report focuses on, we have not discussed them here. We have recently published a separate briefing on evidence from assurance visits to children’s homes. We will publish management information on assurance visits on 27 November 2020.
Inspections of local authority children’s services
There are almost 12 million children and young people in England. The 151 LAs in England provide children’s services to around 400,000 children in need each year. More than 78,000 of these children are children in care. We inspect these LAs to see how their children’s services are performing.
ILACS activity between 1 April 2020 and 31 August 2020
There have been no ILACS inspections since 1 April 2020 due to the suspension of routine inspections.
One additional inspection report is included in the data in this release, as it was published in June 2020 after an inspection in March 2020. It was judged requires improvement to be good.
Overall LA effectiveness as at 31 August 2020
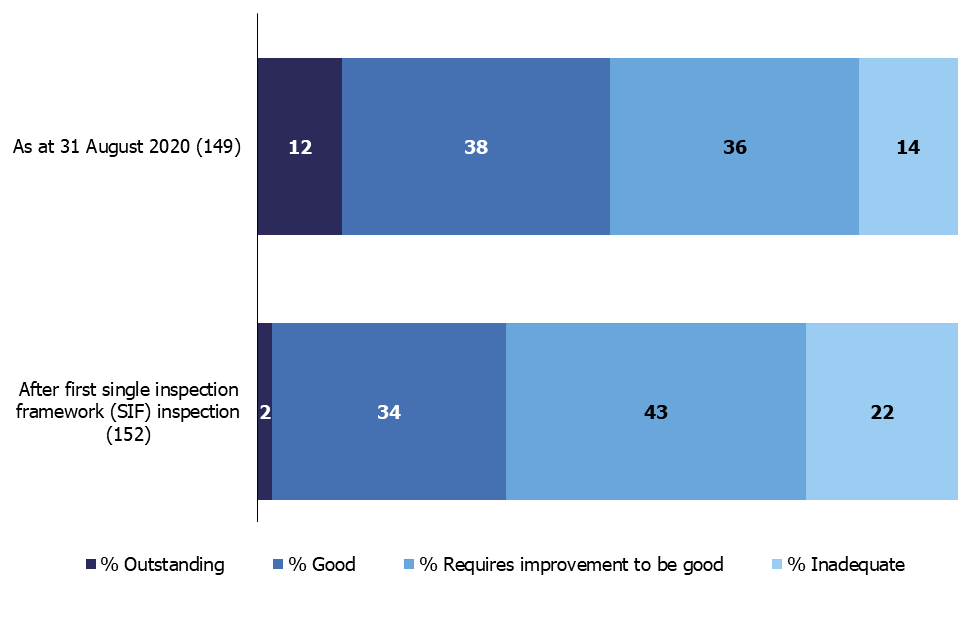
Nationally, a higher proportion of LAs were judged good or outstanding at 31 August 2020 than after their first single inspection framework (SIF) inspection. As at 31 August 2020, 12% of LAs were judged outstanding, 38% good, 36% requires improvement to be good and 14% inadequate.
Figure 1: Inspection profile of LAs as at 31 August 2020
Download a zip file with the underlying data in csv format.
Overall experiences and progress of children and young people for all children’s homes
Inspection profile as at 31 August 2020
At 31 August 2020, 4 of every 5 children’s homes of all types were judged good or outstanding.
Between 17 March and 31 August 2020, only monitoring visits of children’s homes have taken place. As these do not lead to inspection judgements, the overall effectiveness grades have not changed since the publication of Children’s social care data in England 2020. At both dates, 80% of children’s homes were judged good or outstanding.
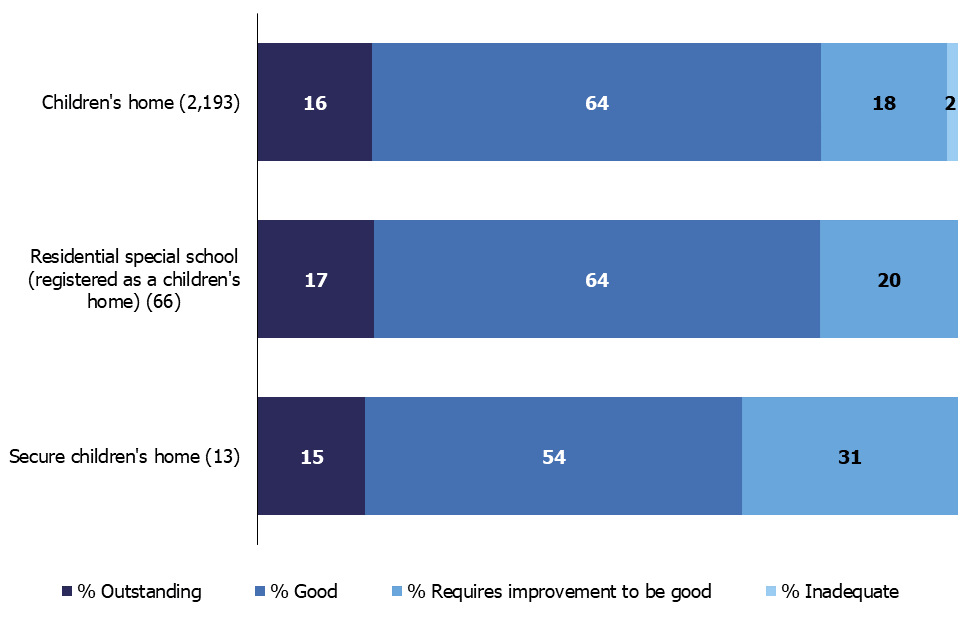
The inspection profile is very similar for all types of children’s homes. Secure children’s homes have the lowest proportion of good or outstanding homes (69%) and the highest proportion of homes judged requires improvement to be good (31%).
Figure 2: Most recent overall effectiveness of children’s homes as at 31 August 2020, by type
The overall effectiveness profile is the same as at 31 March 2020, but the overall number of providers with inspection outcomes has changed, as some providers have closed.
Download a zip file with the underlying data in csv format.
All children’s home inspections in the period between 1 April and 31 August 2020
All full inspections of social care providers were suspended in March 2020. Since 1 April 2020, there have been 255 monitoring visits to 171 children’s homes of all types. These homes represented 7% of all children’s homes open at 31 August 2020.
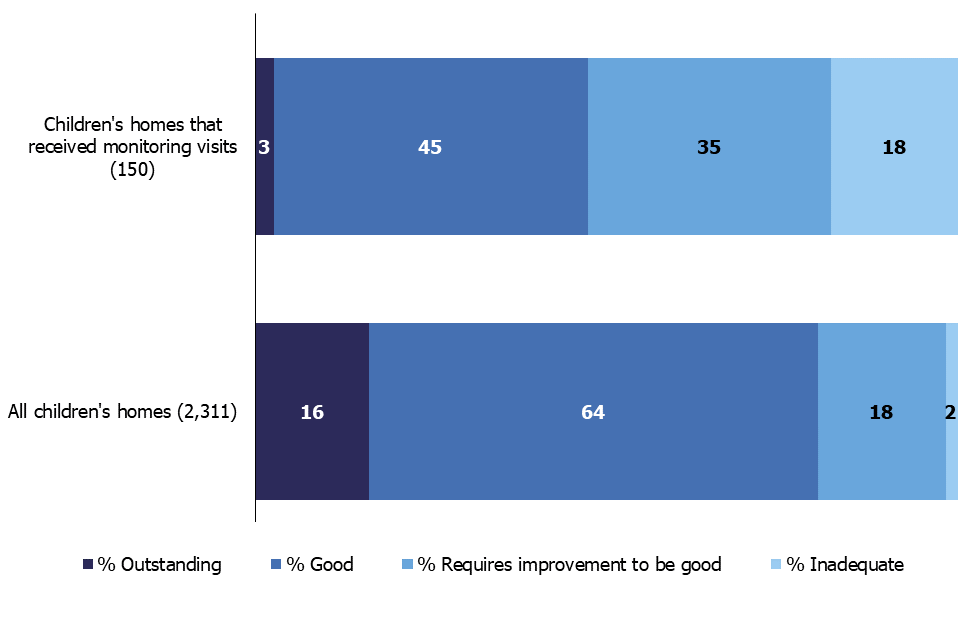
Of the 171 homes visited, 150 had a full inspection judgement as at 31 March 2020. Over half (53%) of these had previously been judged requires improvement to be good or inadequate. This is considerably higher than the national proportion of 20%.
The other 21 homes were newly registered, so had not previously been inspected.
Of the 171 homes we visited, 148 were still active, 12 had resigned and another 11 were suspended on 31 August 2020. Of those that resigned, 4 were previously judged inadequate and 6 requires improvement to be good. The 2 others had previously been judged good.
Of the 12 that resigned, 5 resigned after we issued a cancellation notice.
Figure 3: Outcomes for homes that received monitoring visits

Download a zip file with the underlying data in csv format.
Figure 4: Overall effectiveness profile (at 31 March 2020) of children’s homes that then received a monitoring inspection
Download a zip file with the underlying data in csv format.
Most homes visited were children’s homes, with 243 visits to 162 homes. There were 11 visits to 8 residential special schools (that are registered as children’s homes) and 1 visit to a secure children’s home.
Table 1: Number of inspections in year by type of children’s home
| Type of children’s home | Number of monitoring inspections | Number of homes inspected |
|---|---|---|
| All children’s homes | 255 | 171 |
| Children’s home | 243 | 162 |
| Residential special school (registered as a children’s home) | 11 | 8 |
| Secure children’s home | 1 | 1 |
Changes in the children’s homes sector throughout the COVID-19 pandemic
This section focuses on the changes in the children’s homes sector between 1 April 2020 and 31 August 2020.
Registration activity since April 2020
Since April 2020, the overall number of children’s homes has risen by 133 to 2,592, the highest number since at least 2012. This is due to 176 children’s homes registering and 43 closing.
There has been a steady increase in the number of homes registered in the period between 1 April and 31 August since at least 2015. Between 1 April 2020 and 31 August 2020, 176 new homes were registered. A small number of these registrations were fast-tracked where provision was urgently needed. In the same period in 2019, 136 homes were registered.
Table 2: Number of registrations between 1 April and 31 August by year
| Year | Registrations April to August | De-registrations April to August |
|---|---|---|
| 2015 | 44 | 50 |
| 2016 | 86 | 48 |
| 2017 | 103 | 58 |
| 2018 | 87 | 46 |
| 2019 | 136 | 47 |
| 2020 | 176 | 43 |
Of the 176 new homes, 155 were run by private companies, 13 were run by LAs and 8 were run by voluntary organisations.
Of these 176 new children’s homes, 23 were registered on the site of a previously closed children’s home and are classed as re-registrations. Of these 23 re-registrations, 11 occurred within a year of the previous registration closing. The other 12 had been closed for longer than a year, with 5 being closed for over 5 years. It is possible that LAs and other providers have reopened old settings to cope with the additional demand caused by the COVID-19 pandemic or due to other increased demand.
In the same period, 43 children’s homes closed, all but one of them through resignation of the registration. We cancelled the registration of the other home. Of the 42 homes that resigned, 6 were re-registered before 31 August 2020 and are therefore included in the numbers above. The number of homes resigning or being cancelled has remained similar since 2015.
Of the 42 homes that resigned, 13 resigned following a monitoring visit. We issued 5 of those with a cancellation notice before the resignation.
Registration activity compared to 2019
The number of children’s homes registered between 1 April 2020 and 31 August 2020 was higher than in the same period in 2019. The number that de-registered was similar to 2019.
When this activity is split by month it appears that there were fewer de-registrations than normal between April and June, and more in July. However, a provider must notify us of their resignation at least 3 months before they close, so these decisions were likely taken earlier.
Figure 5: Registrations by month between April and August
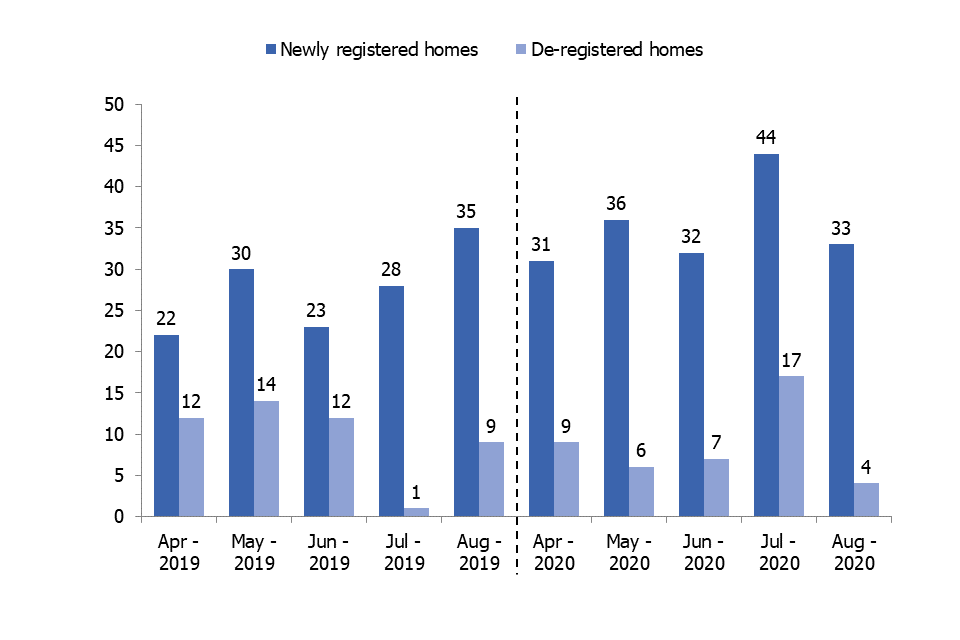
The months from September 2019 to March 2020 are not shown as we are only comparing the April to August periods.
Download a zip file with the underlying data in csv format.
Activity of the 10 largest children’s homes providers
On 23 July 2020, we published statistics on the largest providers of children’s social care.
In the period between 1 April 2020 and 31 August 2020, these providers registered 25 new homes (14% of all new homes) and resigned 16 homes (38% of all de-registered homes).
Four of these resigned homes belonged to the Priory Group (part of Partnerships in Care UK 1 Ltd). All 4 resigned after our monitoring visits found serious shortfalls and we issued notices to cancel their registration.
Table 3: Registration activity of the 10 largest children’s homes providers
| Provider company name | Number of homes registered | Number of homes resigned |
|---|---|---|
| Horizon Care and Education Ltd | 8 | 7 |
| Keys Group Limited (G Square Healthcare Private Equity LLP) | 4 | 4 |
| The Priory Group (Partnerships in Care UK 1 Ltd) | 1 | 4 |
| Sandcastle Care Ltd (Sc Topco Limited) | 5 | 0 |
| CareTech Holdings Plc | 3 | 0 |
| The Outcomes First Group (Sscp Spring Topco Limited) | 2 | 0 |
| Hexagon Care Services Limited (Hcs Group Limited) | 1 | 1 |
| Esland Group Holdings Ltd | 1 | 0 |
| 10 largest providers (combined) | 25 | 16 |
Changes in the number of homes by region
The North West had the highest number of children’s homes at both 31 March and 31 August 2020. The number of homes rose from 590 to 633, a 7% increase.
London had the fewest homes at 31 March (122), but saw the largest percentage increase in the number of homes. There were 13 new homes, and no de-registrations, in the region between 1 April and 31 August. This caused an 11% rise in the number of homes.
Table 4: Change in the number of children’s homes by region since April 2020
| Region | Number of homes at 31 March | Number of homes at 31 August | Change in number of homes | Percentage change in number of homes |
|---|---|---|---|---|
| East Midlands | 243 | 262 | 19 | 8% |
| East of England | 178 | 186 | 8 | 4% |
| London | 122 | 135 | 13 | 11% |
| North East, Yorkshire and the Humber | 362 | 388 | 26 | 7% |
| North West | 590 | 633 | 43 | 7% |
| South East | 276 | 286 | 10 | 4% |
| South West | 179 | 185 | 6 | 3% |
| West Midlands | 428 | 437 | 9 | 2% |
| England | 2,378 | 2,512 | 134 | 6% |
London has been the region with the fewest children’s homes for many years. The increase in homes in London this year is the highest increase seen in the equivalent period in at least 10 years.
Of the 13 new homes, 12 were private or voluntary, and 1 was run by Greenwich LA. This LA home was set up as a temporary home to house children during the COVID-19 pandemic and has resigned since the end of August.
Only 1 other home nationally mentioned being set up specifically for provision during the COVID-19 pandemic in its statement of purpose.
Changes in the number of homes by sector
On 31 August 2020, 78% of all children’s homes were run by private companies, 16% were run by LAs and 6% were run by voluntary organisations. This is slightly different to the data as at 31 March 2020, where 77% were private and 17% were LA. This continues the trend of private companies operating larger proportions of the sector year on year.
There were 1,948 private children’s homes at 31 August, a 7% increase (127 homes) since 31 March. This was caused by 157 new private homes opening and 30 private homes resigning.
Only 8 LA homes were opened in the same time, while another 5 closed. This led to a 1% increase (3 homes).
Table 5: Change in the number of children’s homes by sector since April 2020
| Sector | Number of homes at 31 March | Number of homes at 31 August | Change in number of homes | Percentage change in number of homes |
|---|---|---|---|---|
| LA | 408 | 411 | 3 | 1% |
| Private | 1,821 | 1,948 | 127 | 7% |
| Voluntary | 142 | 144 | 2 | 1% |
| England | 2,378 | 2,512 | 134 | 6% |
In the same period, 2 homes were opened by health authorities, taking the total number from 7 to 9. We have included these in the totals for the table above.
Changes in children’s home capacity
Between 1 April 2020 and 31 August 2020, 176 homes opened in England, providing a total of 608 places. In the same period, 43 homes de-registered, removing 168 places. The average new home had 3.5 places, while the average closing home had 4.0. This continues the trend of new homes often being smaller than old ones.
On 31 March 2020, there were 12,175 places in children’s homes of all types. As at 31 August 2020, this had increased to 12,572 places, an increase of 397 places (3%). The largest rise was seen in children’s homes, with an increase of 454 places.
Table 6: Changes in the number of places in children’s homes since April 2020
| Type of children’s home | Places 31 March 2020 | Places 31 August 2020 | Change in places | Percentage change in places |
|---|---|---|---|---|
| Children’s home | 10,033 | 10,487 | 454 | 5% |
| Residential special school (registered as a children’s home) | 1,911 | 1,854 | -57 | -3% |
| Secure children’s home | 231 | 231 | 0 | 0% |
| England | 12,175 | 12,572 | 397 | 3% |
The majority of both newly registered places and de-registered places were in children’s homes, where there were 608 new places and 168 closed places. This increase is in line with the existing capacity of homes.
Changes in children’s home capacity by region
Regionally, London saw the largest percentage increase in capacity, with 54 new places (8%). The region with the smallest increase was the South West, with 15 new places (2%).
Table 7: Changes in the number of places in children’s homes since April 2020 by region
| Region | Places 31 March 2020 | Places 31 August 2020 | Change in places | Change in proportion of places |
|---|---|---|---|---|
| East Midlands | 1,036 | 1,111 | 75 | 7% |
| East of England | 867 | 894 | 27 | 3% |
| London | 671 | 725 | 54 | 8% |
| North East, Yorkshire and the Humber | 1,671 | 1,737 | 66 | 4% |
| North West | 2,156 | 2,287 | 131 | 6% |
| South East | 1,430 | 1,474 | 44 | 3% |
| South West | 629 | 644 | 15 | 2% |
| West Midlands | 1,573 | 1,615 | 42 | 3% |
| England | 10,033 | 10,487 | 454 | 5% |
Table 8: Registrations and de-registrations of children’s homes by region
| Region | Places added by new homes | Places removed by closed homes |
|---|---|---|
| East Midlands | 81 | 7 |
| East of England | 40 | 14 |
| London | 57 | 0 |
| North East, Yorkshire and the Humber | 79 | 13 |
| North West | 179 | 52 |
| South East | 61 | 14 |
| South West | 30 | 29 |
| West Midlands | 81 | 54 |
| Total in England | 608 | 183 |
Regulatory activity between 1 April 2020 and 31 August 2020
We will discuss regulatory activity in more detail in our Annual Report, which we are due to publish on 1 December 2020.
Between 1 April 2020 and 31 August 2020, we cancelled the registrations of 1 children’s home and 1 independent fostering agency.
As at 31 August 2020, there were 14 suspended children’s homes and 1 suspended residential family centre. All of these were suspended after 1 April 2020.
For both cancellations and suspensions, this is broadly in line with the same period in 2019.
Revisions to previous release
The provisional data in the previous Children’s social care data in England 2020 release related to inspections that took place between 1 April 2019 and 31 March 2020 and was published by 30 April 2020. It indicated that there were 3,463 inspections of all social care providers in this period.
The revised data in this release shows that an additional 48 inspections took place between 1 April 2019 and 31 March 2020, with the reports published since 30 April 2020. These consist of an additional 28 full inspections, 10 monitoring visits of all provision types and 10 interim inspections of children’s homes.
These newly published inspections changed the overall effectiveness judgement of 10 providers. The judgements for all these providers declined to either requires improvement to be good or inadequate.
The profile of overall effectiveness judgements only changed for residential special schools, which we inspect for welfare. The proportion of residential special schools judged good and outstanding both decreased by 1 percentage point. The proportion judged requires improvement to be good and inadequate both increased by 1 percentage point.
These findings have not resulted in any changes to the main findings of the Children’s social care data in England 2020 release.
We publish revisions to data in this publication in line with Ofsted’s revisions policy for official statistics.
Notes
The accompanying quality and methodology report for this release sets out the main uses of this data, further contextual information and arrangements for quality assurance. It also provides information about strengths and limitations of the statistics.
Due to rounding, percentages might not add up to 100.
Glossary
Definitions of terms are within the statistical glossary.
Further information
Contact for comments or feedback
If you have any comments or feedback on this publication, please contact Adam King on 0300 013 0020 or socialcaredata@ofsted.gov.uk.
Annual report
We will publish findings from our Annual Report on 1 December 2020.
Acknowledgements
Thanks to Tom Nelson for his contribution to this statistical release.