Main findings: children’s social care in England 2020
Updated 22 September 2020
Applies to England

© Crown copyright 2020
This publication is licensed under the terms of the Open Government Licence v3.0 except where otherwise stated. To view this licence, visit nationalarchives.gov.uk/doc/open-government-licence/version/3 or write to the Information Policy Team, The National Archives, Kew, London TW9 4DU, or email: psi@nationalarchives.gov.uk.
Where we have identified any third party copyright information you will need to obtain permission from the copyright holders concerned.
This publication is available at https://www.gov.uk/government/statistics/childrens-social-care-data-in-england-2020/main-findings-childrens-social-care-in-england-2020
This is the main findings report for the children’s social care in England 2020 release, these are also available:
- underlying data
- methodology
- pre-release access list
Summary
This release contains:
- inspection outcomes for local authority (LA) children’s services inspections from 1 November 2013 covering all inspections published by 30 April 2020
- the number of providers of children’s social care, and the number of places they are registered for, as at 31 March 2020
- the most recent inspections and outcomes for all regulated and inspected children’s social care provisions, as at 31 March 2020, and published by 30 April 2020
- outcomes for all regulated and inspected children’s social care provision inspections carried out between 1 April 2019 and 31 March 2020 and published by 30 April 2020
Due to coronavirus (COVID-19), Ofsted suspended all routine inspections of social care providers on 17 March 2020. Therefore, we did not complete the inspection cycle and we completed fewer inspections than in previous years as a result. For more information, visit the Ofsted guidance and information relating to COVID-19.
The overall effectiveness profile of LAs continues to improve.
As at 31 March 2020, the proportion of LAs judged good or outstanding for overall effectiveness increased to 50%. After each LA’s first single inspection framework (SIF) inspection, it was 36%.
The number of new children’s homes of all types in England continues to rise.
As at 31 March 2020, there were 2,460 children’s homes providing 12,175 places. This was a 7% increase in the number of homes from 2,304 as at 31 March 2019, and a 1% increase in the number of places (from 12,035).
The proportion of independent fostering agencies (IFAs) judged good or outstanding has increased.
As at 31 March 2020, 93% of IFAs were judged good or outstanding, an increase of 1 percentage point since 31 March 2019.
The number of voluntary adoption agencies (VAAs) decreased this year.
As at 31 March 2020, in contrast to previous years, the number of VAAs decreased by 22%, from 50 to 39 settings.
Introduction
Ofsted reports annually on social care inspections and outcomes for LAs, regulated providers and other providers of placements in England.
Out of the 12 million children living in England just under 400,000 (3%) are in the social care system at any one time. More than 78,000 of these children are children in care. Across England, there are 151 LAs responsible for ensuring and overseeing the effective delivery of social care services for children. We inspect these LAs to see how their children’s services are performing.
We regulate and/or inspect providers that offer placements for children in care and other providers of placements. As at 31 March 2020, there were 3,158 active or suspended social care providers of these services in England. More information about the different types of providers can be found in Figure 13 and in the glossary.
Inspection of LA children’s services
We inspect LA children’s services under the inspections of local authorities’ children’s services (ILACS) framework, which was introduced on 1 January 2018.
Under the ILACS framework, we inspect LAs based on the intelligence we have about them, including their most recent inspection judgement.
Throughout this release, when we refer to LAs improving or declining, we are comparing the current position to the picture after each LA’s first SIF inspection.
The inspection judgement profile for LAs continues to improve from the position after each LA’s first SIF. Half of all LAs are now judged good or outstanding and fewer judged inadequate.
On 1 April 2019, there were some changes to the boundaries of a small number of LAs, bringing the total number of LAs in England to 151. For more information, see the notes section.
Overall LA effectiveness as at 31 March 2020
The picture for all LAs as at 31 March 2020 continues to improve, with 50% of LAs now judged good or outstanding. The position after each LA’s first SIF inspection was 36%. There has also continued to be a fall in the percentage judged inadequate, decreasing to 14% from 22% after each LA’s first SIF.
Figure 1: LA overall effectiveness as at 31 March 2020 and previous years

A bar chart showing the overall effectiveness profiles for LAs after each LA's first SIF inspection and at 31 March 2019 and 2020. The chart shows the grade profile is continuing to improve with more LAs now judged good or outstanding than previously.
Numbers in brackets represent the number of LAs with an overall effectiveness outcome as at 31 March 2020.
Figure 2: LA overall effectiveness judgements as at 31 March 2020
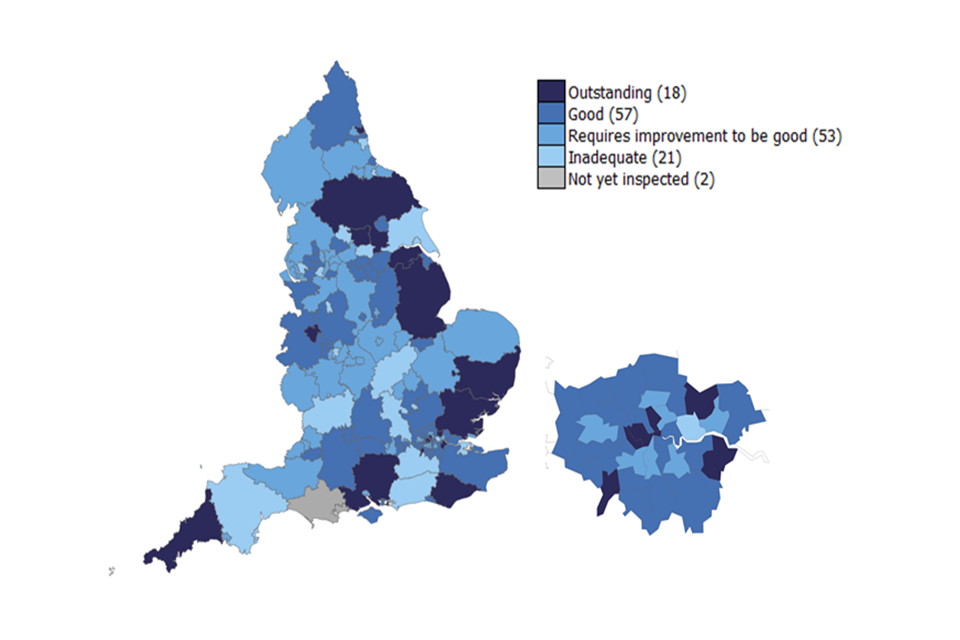
A map of England showing the overall effectiveness breakdown by local authority as at 31 March 2020.
Numbers in brackets represent the number of LAs
Judgements as at 31 March 2020
For the judgements of ‘impact of leaders’, ‘children in need of help and protection’ and ‘children in care and care leavers’, the percentage of LAs judged to be good or outstanding continues to increase as shown in Figure 3.
In the judgement of children in need of help and protection, 11 LAs are now judged to be outstanding, however, the percentage remains low. After each LA’s first SIF, none had received this judgement in this area and, as at 31 March 2019, only 4 LAs had.
Figure 3: Percentage of good or outstanding judgements after each LA’s first SIF inspection and at 31 March 2019 and 2020

A bar chart shows the improvement in good or outstanding judgements after each LA's first SIF and as at 31 March 2019 and 2020. The grade profile is continuing to improve with more LAs now judged good or outstanding.
ILACS activity between 1 April 2019 and 31 March 2020
Between 1 April 2019 and 31 March 2020, 105 LAs had some sort of ILACS inspection activity. We carried out a total of 129 visits or inspections to these LAs.
Figure 4: ILACS inspection activity between 1 April 2019 and 31 March 2020

A figure of 4 circles shows the breakdown of ILACS inspection activity by inspection type between 1 April 2019 and 31 March 2020.
ILACS short and standard inspections
Between 1 April 2019 and 31 March 2020, we carried out 59 ILACS standard or short inspections. Five inspections took place in the 2018 to 2019 year but were published in the 2019 to 2020 year so have been included in this year’s numbers.
Just under half of these inspections were judged good or outstanding (49%), 34% requires improvement to be good and 17% inadequate.
Of these 59 inspections, more LAs improved than declined their overall effectiveness judgement. Twenty-six LAs improved their judgement, 19 retained the same judgement and 14 declined, as shown in Figure 5.
Four of the 26 LAs that improved did so by 2 inspection grades:
- Barnet, Croydon, and Tower Hamlets LAs all improved from inadequate to good
- Telford and Wrekin LA improved from requires improvement to be good to outstanding
Figure 5: Change in overall effectiveness judgements in England between 1 April 2019 and 31 March 2020

A bar chart shows the change in overall effectiveness outcomes for ILACS standard or short inspections that took place between 1 April 2018 and 31 March 2019 compared with after each LA’s first SIF.
Inadequate local authorities and their monitoring visits
Of the 20 LAs judged inadequate as at 31 March 2019, we inspected all of these during 2019 to 2020. Nine of these LAs received a standard ILACS inspection where they could change their overall effectiveness judgement. All 9 LAs improved, 3 LAs by 2 grades. All other inadequate LAs received at least one monitoring visit during the year.
Between 1 April 2019 and 31 March 2020, we carried out 29 monitoring visits to 14 LAs.
ILACS focused visits
Between 1 April 2019 and 31 March 2020, we carried out 41 focused visits to 39 LAs.
As with last year, the 2 most common themes for visits were ‘children in need/subject to a plan’ (37%) and ‘front door’ (32%). The higher number of these types of themed visits is to be expected since our inspections show that these are the most challenging areas for LAs to do well in.
Figure 6: ILACS focused visits by theme between 1 April 2019 and 31 March 2020

A donut chart showing the breakdown of ILACS focused visits by theme between 1 April 2018 and 31 March 2019.
Four of these focused visits resulted in areas for priority action for 3 LAs. One LA had 2 focused visits, both resulting in an area for priority action.
Four of the 41 focused visits, to Devon, Luton, Rutland and Middlesbrough LAs (2 ‘children in need’, 1 ‘children in care’ and 1 ‘front door’), were then followed by an ILACS standard inspection. At these subsequent ILACS inspections, 3 of these LAs were judged inadequate and one requires improvement to be good.
Children’s homes
The number of children’s homes in England continues to rise. There was a 7% increase in the number of homes and a 1% increase in the number of places compared with 31 March 2019. This continues the long-standing trend of the number of new homes rising faster than the number of new places.
For all types of children’s homes, 4 out of 5 providers were judged good or outstanding as at 31 March 2020, in line with the previous year.
In this section, we report on the 3 types of children’s homes:
- children’s homes
- residential special schools registered as children’s homes
- secure children’s homes
The sub-category of children’s homes also includes respite/short breaks only children’s homes, although they have not been separated out in the data below.
Providers and places as at 31 March 2020
There were 2,460 children’s homes as at 31 March 2020, a 7% increase (156 homes) from the previous year (2,304). These homes were registered for 12,175 places, a 1% increase from 12,035 as at 31 March 2019.
Although occupancy data is currently not easily identifiable for a full year, we know that not all homes had children in them all the time. For example, in the most recently available Department for Education data, for the end of March 2019, there were around 6,400 children in English children’s homes. Around 5,700 of the children were in children’s homes and around 700 were in children’s homes registered as special schools.
The rise in the number of places did not keep pace with the increase in the number of homes. This is mainly caused by new children’s homes being smaller than those that close. The average number of places for a new children’s home was 3.4, while the average for a closing home was 5.1.
The consistent pattern over the last 5 years has been of homes increasing at a greater rate than places. While the number of all children’s homes increased by 19% between March 2015 and March 2020, the number of places increased by 3% over the same period.
Children’s homes are not distributed evenly across the country. A quarter of all children’s homes, and 1 in 5 available places, are in the North West region. Only 1 in 19 homes, and 1 in 15 places, is in London. This is a similar pattern to that seen in 2019.
Table 1: The number of children’s homes and residential special schools registered as children’s homes, and the number of places as at 31 March 2020 by region
| Region | Number of children’s homes | Number of children’s homes places | Number of residential special schools registered as children’s homes | Number of residential special schools registered as children’s homes places |
|---|---|---|---|---|
| England | 2,378 | 10,033 | 69 | 1,911 |
| East Midlands | 243 | 1,036 | 10 | 318 |
| East of England | 178 | 867 | 6 | 138 |
| London | 122 | 671 | 0 | 0 |
| North East, Yorkshire and the Humber | 362 | 1,671 | 9 | 167 |
| North West | 590 | 2,156 | 10 | 234 |
| South East | 276 | 1,430 | 15 | 580 |
| South West | 179 | 629 | 7 | 231 |
| West Midlands | 428 | 1,573 | 12 | 243 |
Split between sectors
As at 31 March 2020:
- private companies ran over three quarters of children’s homes (1,815), providing 6,960 places
- local authorities ran 408 homes (2,128 places)
- trusts operated 22 homes on behalf of a local authority (141 places)
- voluntary providers ran 126 homes (760 places)
- health authorities ran 7 homes (44 places)
These numbers are similar to those in 2019.
Joiners and leavers in 2019 to 2020
Between 1 April 2019 and 31 March 2020, 286 children’s homes and 2 residential special schools registered as children’s homes opened (with 985 places). Meanwhile, 126 children’s homes, 5 residential schools registered as children’s homes and 1 secure children’s home closed (667 places).
Of the 286 homes that opened in-year, 11 then closed again by 31 March 2020. Nine of these belonged to one organisation, which went into administration in-year. This resulted in a net increase of 156 homes and 318 places.
Of the 286 new children’s homes, 28 (10%) were LA homes. Twelve of these were in the North East, Yorkshire and the Humber region, and 8 were in the West Midlands. The other 8 were split between the remaining regions. As at 31 March 2020, 423 of 2,460 children’s homes (17%) were LA homes.
Six homes transferred from an LA to a children’s trust running homes on behalf of an LA in year. In this release, these are counted as one home leaving and a separate home joining.
Table 2: The change in the number of children’s homes of all types between 31 March 2019 and 31 March 2020
| Provision type | Change in number of providers | Change in number of places |
|---|---|---|
| All children’s homes | 156 | 318 |
| Children’s home | 160 | 435 |
| Residential special school (registered as a children’s home) | -3 | -110 |
| Secure children’s home | -1 | -7 |
Residential special schools registered as children’s homes
There were 69 residential special schools registered as children’s homes as at 31 March 2020.
Most residential special schools registered as children’s homes were run by private companies. Private companies operated 49 schools, providing 1,231 places. Voluntary sector organisations ran 17 schools, providing 602 places. Local authorities ran 3 schools (78 places).
Secure children’s homes
There were 13 secure children’s homes as at 31 March 2020, offering 231 places. These homes were not split evenly across England. There were no secure children’s homes in London or the West Midlands, while there were 4 in the North East, Yorkshire and the Humber region.
Between 1 April 2019 and 31 March 2020, 1 secure children’s home resigned. This home was open, but not operational, as at 31 March 2019, as the service was undergoing renovations. There has therefore been no real change in the operational capacity of secure children’s homes since 31 March 2019.
Inspection profile as at 31 March 2020
As at 31 March 2020, 2,311 (94%) active children’s homes of all types had an inspection judgement.
Figure 7: Grade profile of all types of children’s homes with inspection outcomes as at 31 March 2020

A bar chart showing the overall effectiveness profiles for the 3 types of children's homes as at 31 March 2020. For all children's homes, 80% are good or outstanding.
Numbers in brackets represent the number of providers with an overall effectiveness grade as at 31 March 2020.
Across all inspected children’s homes, the grade profile was similar to previous years. Four in five homes (1,850 out of 2,311, 80%) were judged good or outstanding, in line with last year (1,755 out of 2,192, 80%). Slightly fewer homes were judged outstanding compared with 31 March 2019 (16% in 2020 compared with 18% in 2019).
Change over time in inspection profile
The grade profile of all types of children’s homes has remained similar for the last 4 years. The overall proportion of all children’s homes judged good or outstanding has decreased by 1 percentage point since 2017.
Figure 8: Change in the grade profile of all children’s homes at their most recent inspection between 31 March 2017 and 31 March 2020

This bar chart shows the overall effectiveness profiles for all children's homes as at 31 March 2020, compared with the previous 3 years. The proportion of all children’s homes judged good or outstanding has decreased by 1 percentage point since 2017.
Numbers in brackets represent the number of providers with an overall effectiveness grade as at 31 March 2020.
As at 31 March 2020, 9 of the 13 secure children’s homes were good or outstanding, compared with 9 out of 14 in March 2019.
As at 31 March 2020, there were no inadequate secure children’s homes. This is because the only inadequate provider resigned in-year and there have been no other changes to the grade profile of secure children’s homes since last year.
As at 31 March 2020, the proportion of residential special schools registered as children’s homes judged good or outstanding (79%) was higher than at 31 March 2019 (71%), and in line with previous years. However, the proportion judged outstanding was lower than in any of the 3 previous years.
There were no inadequate residential special schools registered as children’s homes as at 31 March 2020.
Inspections of children’s homes during 2019 to 2020
Between 1 April 2019 and 31 March 2020, there were 3,124 inspections of children’s homes of all types.
Table 3: Children’s homes inspections in 2019 to 2020 by type
| Event type | Number of inspections |
|---|---|
| Full inspection | 2,350 |
| Interim inspection | 442 |
| Monitoring inspection | 332 |
| Total | 3,124 |
The 2,350 full inspections covered 2,257 children’s homes, as some homes had more than one inspection in the year.
Of these 2,257 homes:
- 348 (17%) improved their overall effectiveness judgement at their first inspection in-year, compared with 31 March 2019
- 438 (22%) declined
- 1,226 (61%) did not change
- 245 had not been inspected before 31 March 2019 so were not comparable
Inspection activity of inadequate homes
Of the 2,257 children’s homes that received a full inspection in 2019 to 2020, 141 (6%) were initially judged inadequate. Of these, 95 had a subsequent full inspection or a monitoring inspection where the judgement was changed.
Of these 95 children’s homes, 35 were judged good, 52 were judged requires improvement to be good and 8 were inadequate as at 31 March 2020.
There were 22 homes that had no further inspections or visits before 31 March 2020. This was due to the initial inspection happening relatively late in the year. There were also 24 homes that had a further inspection, but were not given a judgement. These would have been either monitoring inspections or interim inspections where no judgements were given.
By 31 March 2020, 21 of these providers had resigned (15%). None of these providers were cancelled in-year.
Figure 9: Inspection activity of children’s homes initially judged inadequate in 2019 to 2020

This infographic shows what happens to children's homes judged inadequate at their first inspection in 2019/20. 141 homes were initially judged inadequate. By 31 March 2020, 35 were subsequently good, 52 requires improvement and 8 inadequate.
Interim inspections
Only children’s homes that have been judged requires improvement to be good or inadequate in the previous inspection year, and homes judged good or outstanding that were subsequently assessed as high risk, receive interim inspections.
There were 442 interim inspections carried out in 2019 to 2020, a drop from 503 in 2018 to 2019. Of those that received a judgement, 120 (29%) improved effectiveness, 193 (47%) sustained effectiveness and 102 (25%) declined effectiveness. Twenty-seven were not judged as there were no children in placement at the time of inspection.
Independent Fostering Agencies
The number of IFAs remains stable. Private companies continue to own most agencies. Eight IFAs provide fostering services on behalf of LAs, the same number as in 2019.
Nationally, the percentage of all IFAs judged good or outstanding remains high and increased over the last year.
Providers and places as at 31 March 2020
Most children in care (72%) are in foster placements, which are provided by LA fostering agencies or IFAs. According to our most recent statistics, over a third of all fostered children (around 19,000) are placed through IFAs.
The number of IFAs has varied over the years. As at 31 March 2020, there were 300 IFAs, a small decrease from 305 as at 31 March 2019. Private companies own 4 in 5 IFAs and voluntary organisations run the rest.
During 2019 to 2020, 12 new IFAs opened and 16 resigned. Ofsted cancelled the registration of one IFA.
Inspection profile as at 31 March 2020
As at 31 March 2020, 288 of the 300 active IFAs (96%) had received a full inspection. The providers that we had not yet inspected were mostly new. Ninety-three per cent of IFAs were judged good or outstanding, an increase of 1 percentage point since 31 March 2019.
Figure 10: Grade profile of IFAs as at 31 March 2020
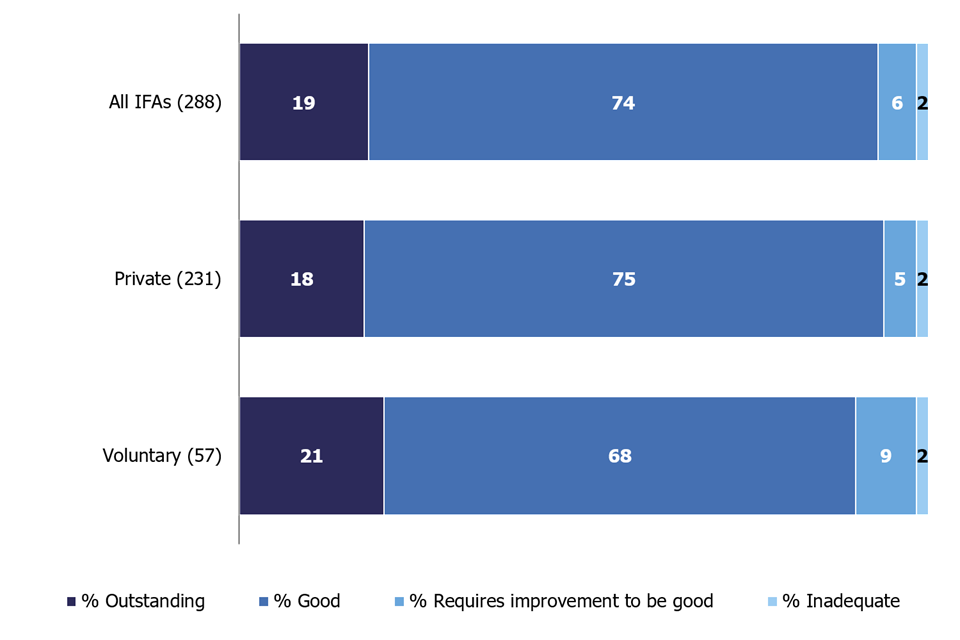
A bar chart showing the grade profile of IFAs as at 31 March 2020, split by sector. The grade profile is similar for both private and voluntary settings. For all IFAs, 93% are judged good or outstanding.
Numbers in brackets represent the number of providers with an overall effectiveness grade as at 31 March 2020
In total, there were 67 full inspections of IFAs between 1 April 2019 and 31 March 2020, lower than the previous year (138). There were also 19 monitoring inspections of 13 IFAs in the year. In most cases, this was following a previous inadequate judgement. Of these 13 providers, 12 remain active and one had their registration cancelled by Ofsted.
Other social care providers
As at 31 March 2020, for half of provider types, the number of settings had decreased from 31 March 2019.
Between 1 April 2019 and 31 March 2020, we carried out a total of 253 inspections to 231 other social care providers. Most provider types, either maintained or improved the percentage of their settings judged good or outstanding; only 2 provider types declined.
Providers and places as at 31 March 2020
As at 31 March 2020, for half of provider types, the number of settings had decreased from 31 March 2019. The exceptions were residential family centres and residential holiday schemes for disabled children, where the numbers increased (by 9 and 1 respectively). The increase in residential family centres is part of a continuing trend.
Figure 11: Increase in the number of residential family centres as at 31 March 2020 and previous years

This infographic shows the increase in the number of residential family centres as at 31 March 2020, 2019 and 2018.
Since 2016, there has been a continued fall in the number of residential special schools from 165 in 2016 to 136 in 2020, an 18% decrease.
In contrast to previous years, the number of VAAs has decreased this year, from 50 to 39, a 22% decrease. Before this year, VAAs had seen a steady increase in numbers.
The change to the adoption sector that we have seen this year is likely to be for a number of reasons. One is the introduction of regional adoption agencies (RAAs). These are groups of LAs working together to deliver regional adoption services. Some VAAs that remain active have chosen to close regional branches that were registered separately, adding to the decrease in the number of settings. Additionally, one large VAA with multiple registrations closed during the year, accounting for some of these de-registrations.
This year saw the closure of 1 of the 3 secure training centres (STCs). Medway STC closed at the end of March 2020. The government designated the Medway site for its plans to develop and pilot the first secure school, following Charlie Taylor’s review of the youth justice system in 2016. The remaining 2 STCs are both judged requires improvement to be good, the same as last year.
Figure 12: Provider types that decreased in number as at 31 March 2020 and the change seen in previous years

This infographic shows the provider types that decreased in number as at 31 March 2020. It also shows the change in numbers seen for these providers as at 31 March 2018 and 31 March 2019.
Data on the number of places is only available for these 4 provider types:
- residential special schools – the number of places fell by 2% to 3,962
- boarding schools – the number of places fell by 1% to 9,977
- further education colleges with residential accommodation – the number of places fell by 8% to 5,774
- residential family centres – the number of places rose by 18% to 315
Inspections of other social care providers during 2019 to 2020
As at 31 March 2020, not including children’s homes and IFAs, there were 398 active or suspended settings. This is a decrease from 409 settings in the previous year and from 424 in 2018. Of these 398 settings, the majority, 372 (93%), had a full inspection outcome as at 31 March 2020. We inspected just over half of these settings (209) during 2019 to 2020.
Figure 13: Inspection judgement profile at 31 March 2020

A bar chart shows the inspection judgement profile of other social care providers as at 31 March 2020.
Numbers in brackets represent the number of other social care providers with an overall effectiveness grade as at 31 March 2020
Between 1 April 2019 and 31 March 2020, we carried out a total of 253 inspections of 231 other social care providers.
For many provider types, they either maintained or improved the percentage judged good or outstanding. Only 2 provider types declined, as shown in Figure14.
Figure 14: Change over time in percentage of settings judged good or outstanding, 2018 to 2020

This infographic shows the change over time in the percentage of other social care providers judged good or outstanding from 2018 to 2020.
Revisions to previous release
We have published revised data covering children’s homes in the period 1 April 2019 to 31 August 2019 as part of this release.
The revision of statistics relating to 1 April 2019 to 31 August 2019 from ‘provisional’ to ‘revised’ status includes outcomes relating to a further 28 inspections. These consist of an additional 27 full inspections and one monitoring inspection of children’s homes, which took place in this period and have been published since 30 September 2019.
Of the additional 27 full inspections, 25 were of children’s homes and 2 were of residential special schools registered as children’s homes. Of these homes, 18 received good or outstanding overall effectiveness judgements and 9 received requires improvement to be good or inadequate judgements.
These revisions did not result in any changes to the main findings identified in the previous publication.
We publish revisions to data in this publication in line with our revisions policy for official statistics.
Further information
Notes
The new Bournemouth, Christchurch and Poole LA was formed from the old Bournemouth and Poole LAs and the Christchurch region of Dorset. The new Dorset LA is therefore smaller as a result. Neither of these newly formed LAs has yet received a standard or short ILACS inspection. Therefore, throughout this release, we have excluded these 2 LAs from the LA judgement profile as at 31 March 2020. We have, however, included these LAs in the in-year inspection activity where they received monitoring or focused visits.
All social care providers are inspected by Regulatory Inspectors and Her Majesty’s Inspectors under the social care common inspection framework (SCCIF), except for STCs when there is a joint inspection with other inspectorates.
We inspect most of the providers annually. These include:
- children’s homes
- residential special schools
- secure training centres
- residential holiday schemes for disabled children
We inspect IFAs on a 3-year inspection cycle.
When we talk about ‘other social care providers’, we are referring to all providers other than children’s homes (all 3 types) and IFAs.
Other social care providers receive an inspection once every 3 years unless there is a cause for concern (and may receive extra concern-driven inspections).
Ten LAs have alternative delivery models where all the statutory functions are delegated to third-party bodies, a children’s trust or a not-for-profit organisation. There are also a small number of LAs that have delegated part of their functions to other organisations. All agencies that perform the fostering or adoption functions of an LA must register with Ofsted as an IFA or a VAA respectively. They are included in the analysis and the grade profile of IFAs and VAAs, if applicable.
In a small number of cases, when data on the number of places for other social care providers is not available, we have used estimates. For the full picture of changes in the number of providers and places since September 2011, see the underlying data file ‘Providers+places six monthly’ tab.
Due to rounding, percentages might not add up to 100.
There is a quality and methodology report and glossary to accompany this release.
Contacts
If you are a member of the public and have any comments or feedback on this publication, contact Adam King (adam.king@ofsted.gov.uk) or the social care team socialcaredata@ofsted.gov.uk.
Acknowledgements
Thanks to the following for their contribution to this statistical release: Tom Nelson and Klara Davies.
Glossary
Definitions of terms are within the statistical glossary.
Instructions for printing and saving
Instructions may vary depending on which browser you use, such as Internet Explorer or Google Chrome, and the type of device you use, such as an iPhone or laptop.
You will find your print and save options in your browser’s menu. You may also have other options available on your device. The instructions for mobile and tablet devices will be specific to their make and model.
How to search
Click on Ctrl + F on a Windows laptop or Command + F on a Mac
This will open a search box in the top right-hand corner of the page. Type the word you are looking for in the search bar and press enter.
Your browser will highlight the word, usually in yellow, wherever it appears on the page. Press enter to move to the next place it appears.
How to print a copy of the guidance
Click on Ctrl + P on a Windows laptop or Command + P on a Mac
You can also choose to save as a PDF.